
Abstract
Structure design for reducing noise is essential and widely studied because cab interior noise seriously affects the ride comfort of the driver and passengers, especially for heavy commercial vehicles. This paper proposes an enhancement investigation on the low-noise structure performance of a cab in a heavy commercial vehicle based on an approximation model. A series of vibroacoustic tests with varying running speeds are implemented first to acquire the vibration signals at four cab suspensions and the sound pressure signal at the right ear of the driver. The finite element model and structure–acoustic coupled model of the cab of a heavy commercial vehicle are established sequentially. When the vibration accelerations measured in the tests are converted into excitation signals using the cab structure–acoustic coupled model, the sound pressure of the right ear of the driver is predicted, and the accuracy of the cab structure–acoustic coupled model is then verified. After panel acoustic contribution analysis, an approximation model of critical panel thickness and the peak noise near the right ear of the driver is established in accordance with the radial basis function. Genetic algorithm is utilized to solve an optimization model to obtain optimal panel thicknesses. By comparing the right ear sound pressure before and after optimization, the results confirm that optimized panel thicknesses can reduce sound pressure level of the critical frequency.
Keywords
Introduction
With the increasing demand in vehicle acoustic comfort, the performance of vehicle noise, vibration, and harshness (NVH) has been given considerable attention from vehicle manufacturers and component suppliers. Thus, substantial efforts focus on improving the acoustic comfort of vehicles.1–3 Optimizing low-noise structure to reduce cab interior noise is one of the essential methods to improve market competitiveness. Furthermore, the working environment of the heavy commercial vehicle is complex, abominable, and usually unexpected. The vehicle structure, particularly for a cab, may produce strong vibration and noise when passing through terrible road conditions. These vibration and noise can seriously affect driving efficiency and easily lead drivers to fatigue, malaise, or even wrong judgment that may cause traffic accidents. 4 Therefore, vibration of the heavy commercial vehicles must be reduced and the interior acoustic comfort must be improved. 5
The interior noise of cab includes air-borne and structure-borne noises. Air-borne noise is the external noise that transfers into the cab through the air channel and is mainly related to high-frequency noise. Structure-borne noise comes from the panel vibration. Noise radiates when vibrations are transferred to the cab panels. For structure-borne noise, 20–200 Hz, which is mainly caused by engine idle speed and road roughness, is a special band that requires attention because it may cause booming sounds and cause drivers to become intensely uncomfortable. 6 In addition, this band is mainly caused by engine idle speed and road roughness, However, conventional reduction measures of sound absorption have less effect under this frequency band. 7
Low-noise structure design within this frequency band has attracted considerable attention. In general, low-noise structure optimization can reduce the vibration amplitudes and velocities of panels and consequently improve acoustic comfort. In Wang et al., 8 a topology optimization model is applied first to minimize the normal velocities of a target region. Ribs are arranged according to the optimum topologies, and the normal velocities are then reduced. Xu et al. 9 used the coefficients of mean acoustic contribution to identify the panels that have a significant influence on the interior noise. When the car body is modified by using a damping material, the interior noise is completely reduced to a certain frequency range. In Guo et al., 10 structure vibration and surface radiation noise of diesel engine oil bottom shell are predicted on the basis of the combination method of finite and boundary elements. Surface vibration and noise radiation are reduced by improving the local stiffness of the cab structure. From the aforementioned studies, the first step of low-noise structure optimization is to establish the finite element model (FEM) of the structure and sound field. This procedure is followed by the analysis of the acoustic response. The final step is the implementation of low-noise structure optimization. Accordingly, the finite element analysis is an essential method for analyzing and controlling the noise.11,12
However, the FEM of the cab structure or the cab cavity is complex. In particular, the FEM related to the structure–acoustic coupled model is more complicated because the acoustic response analysis can require a few hours or a longer period. Furthermore, when an optimization algorithm needs to request the FEM repeatedly to optimize the design variables, a considerable amount of time is required to compute the acoustic response. Thus, in the cab low-noise structure optimization, improving optimization model calculation efficiency is becoming important for vehicle NVH research. The computational cost can be greatly reduced by replacing the FEM with the calculation model considering that it can accurately predict the response of FEM. 13 The approximate model method is a common method for reducing computational cost and improving the optimization efficiency. Furthermore, the design variables and response quantities are mathematically modeled and used to replace the original FEM to improve the calculating speed. This method has been widely applied in the optimization and iterative calculation of complex models, such as optimization design of occupant restraint system for safety guarantying, 14 vehicle suspension parameters for ride comfort improving, 15 and cab structure for interior nose reducing. 16
This study aims to propose a new method of low-noise structure optimization in accordance with approximation model for heavy commercial vehicle and is organized as follows. The next section introduces in detail the modeling method of FEM and structure–acoustic coupled model of cab. “Analysis and optimization” section presents an analysis of panel acoustic contribution to identify critical panels that have a significant influence on the right ear sound pressure, introduces the optimization and approximate models on the basis of the radial basis function (RBF), and analyzes the optimization results of panel thicknesses. The final section provides the conclusions.
Prediction and analysis on internal noise of the cab
Cab finite element modeling and validating
As shown in Figure 1(a), the cab FEM of the heavy commercial vehicle is built by shell elements with 10 mm grid. In these elements, the quantum of quadrilateral elements is 331,741, and the quantum of welding spots is 10,917; these are replaced with rigid connections. The quantum of triangular elements is 13,604, which is approximately 3.9% of the total elements. On the basis of these features, the left and right doors and the windscreens are added to the cab FEM to build a complete cab model, as shown in Figure 1(b). The complete cab model is imported into the LMS.Virtual.Lab software, in which small holes and cracks are properly filled to form a closed cab finite element structure model. As shown in Figure 1(c), the acoustic FEM of the cab cavity is extracted, in which the unit length is 50 mm and the quantum of tetrahedral elements is 83,467. According to the interior material parameters provided by the manufacturers, the impedance coefficients of these interior materials are listed in Table 1.
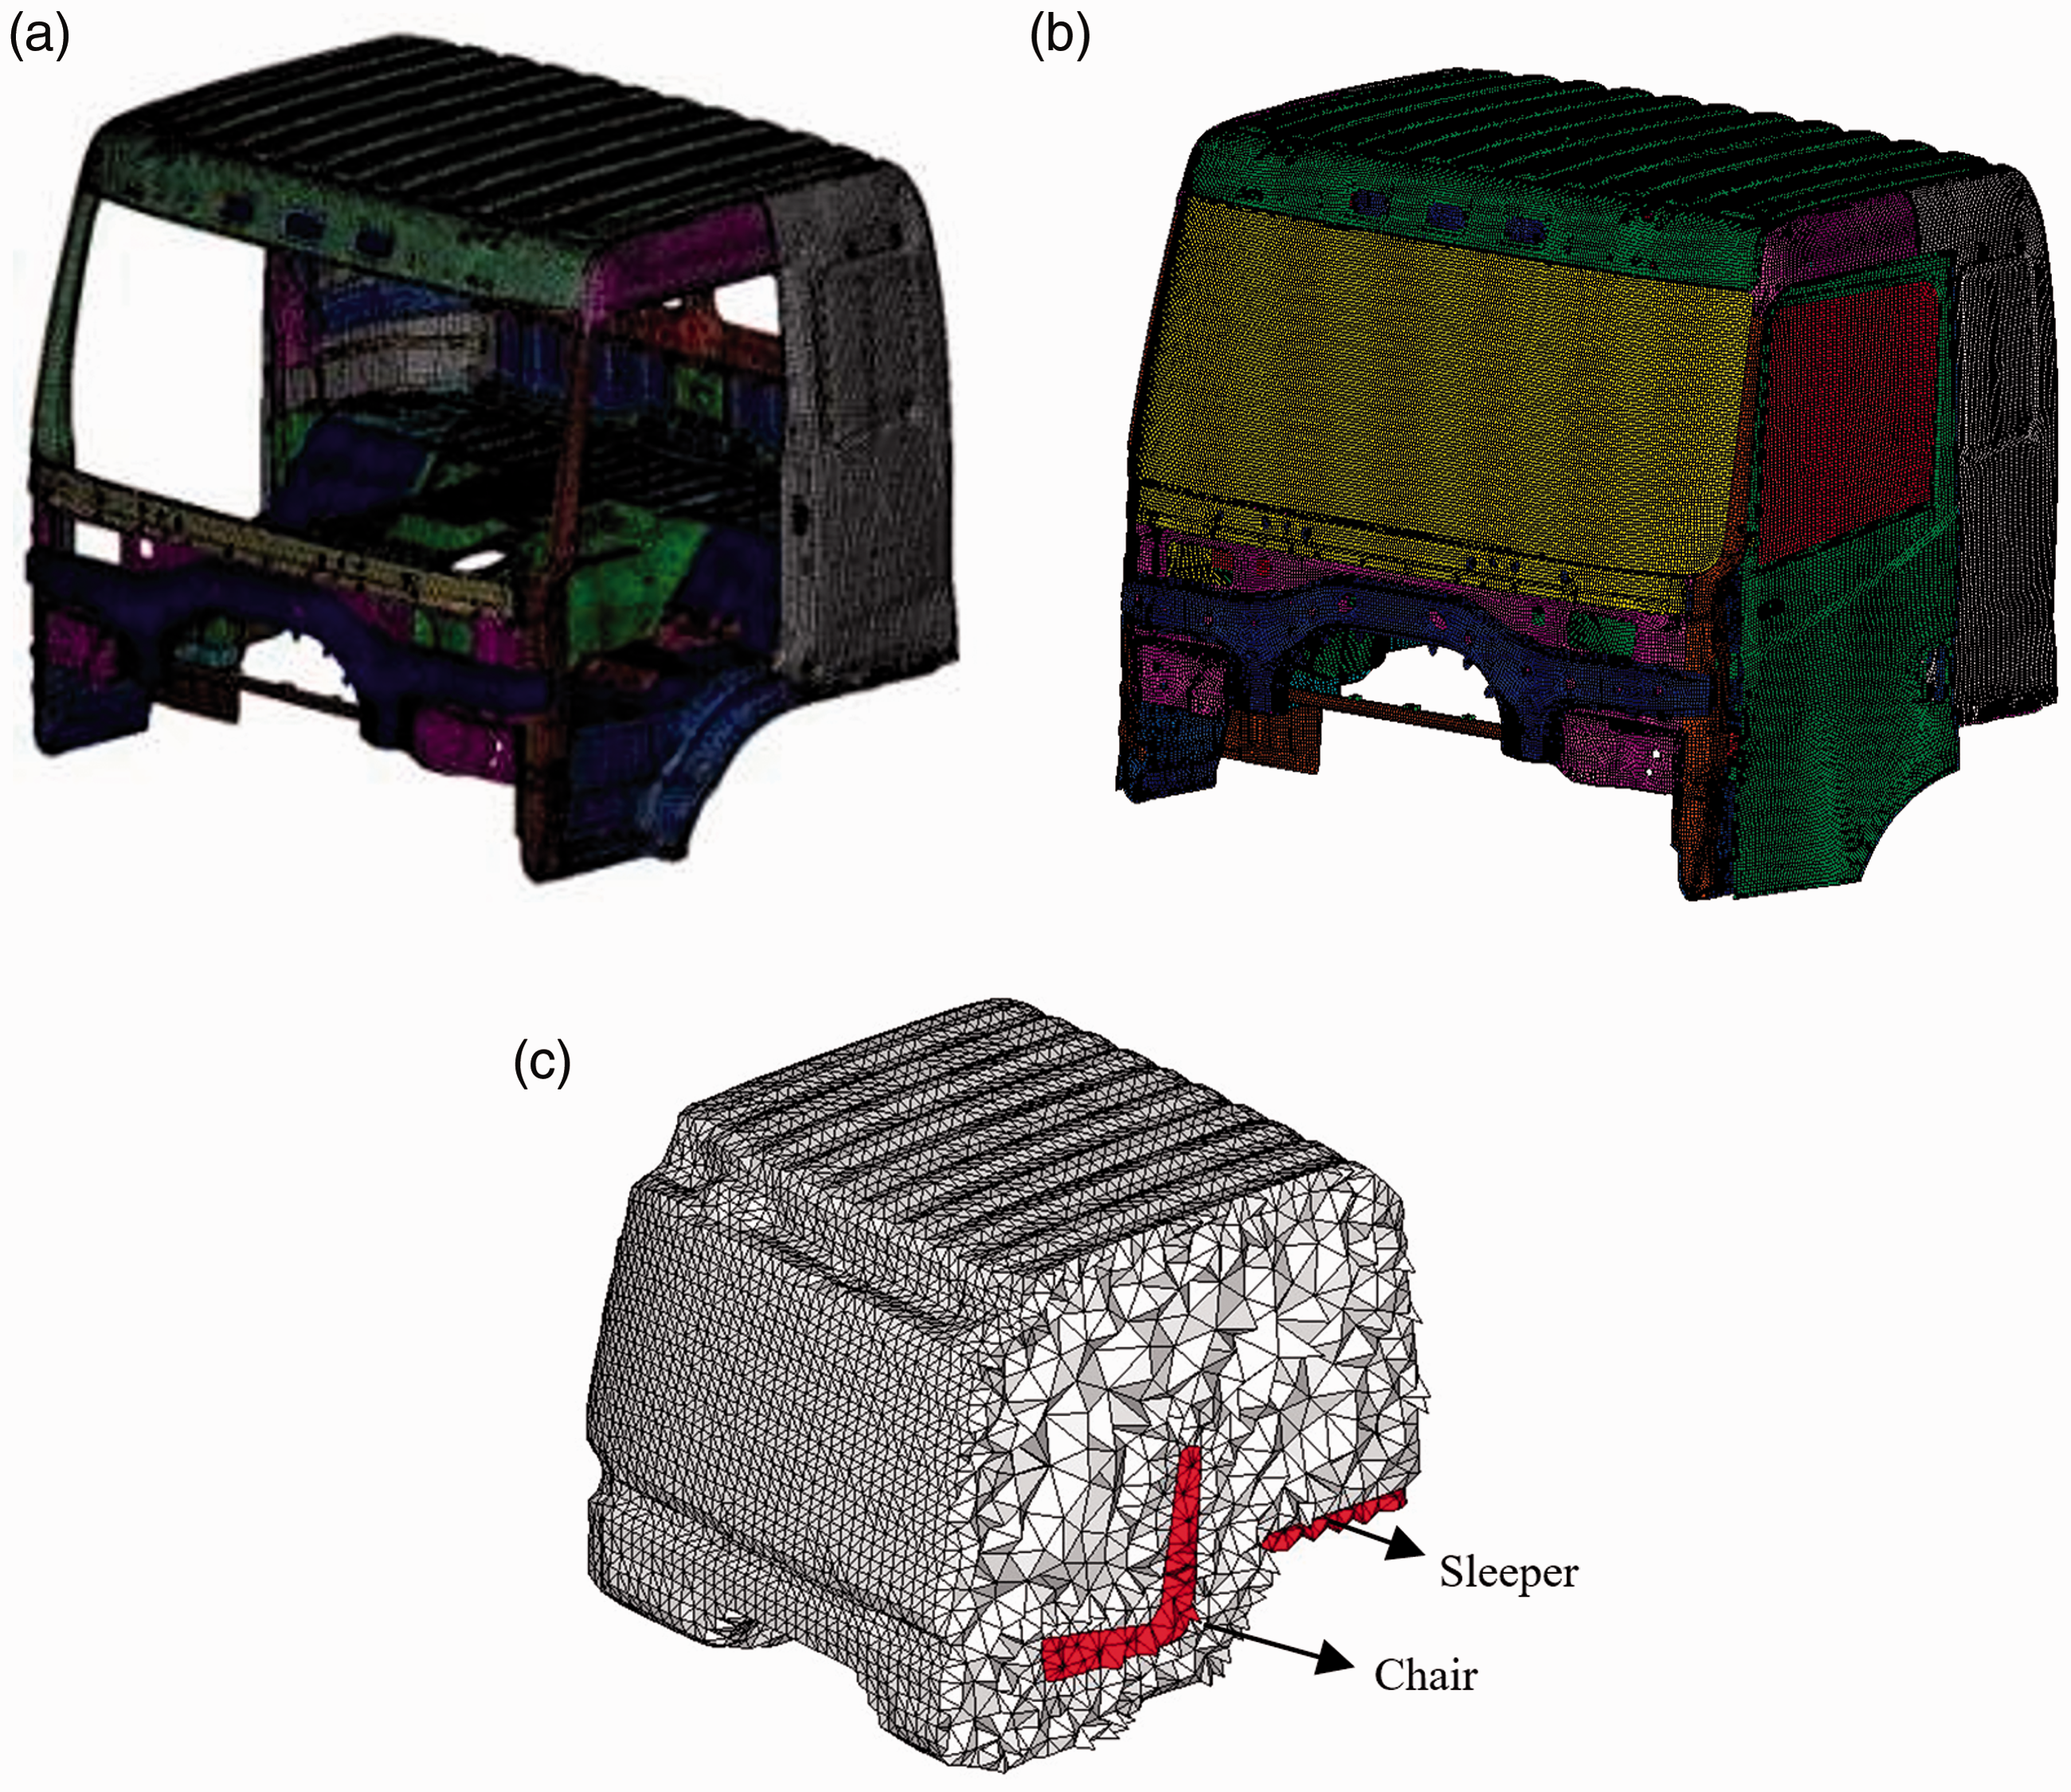
FEM of heavy commercial vehicle cab. (a) FEM of the white body, (b) complete FEM of the body, and (c) section view of acoustic FEM.
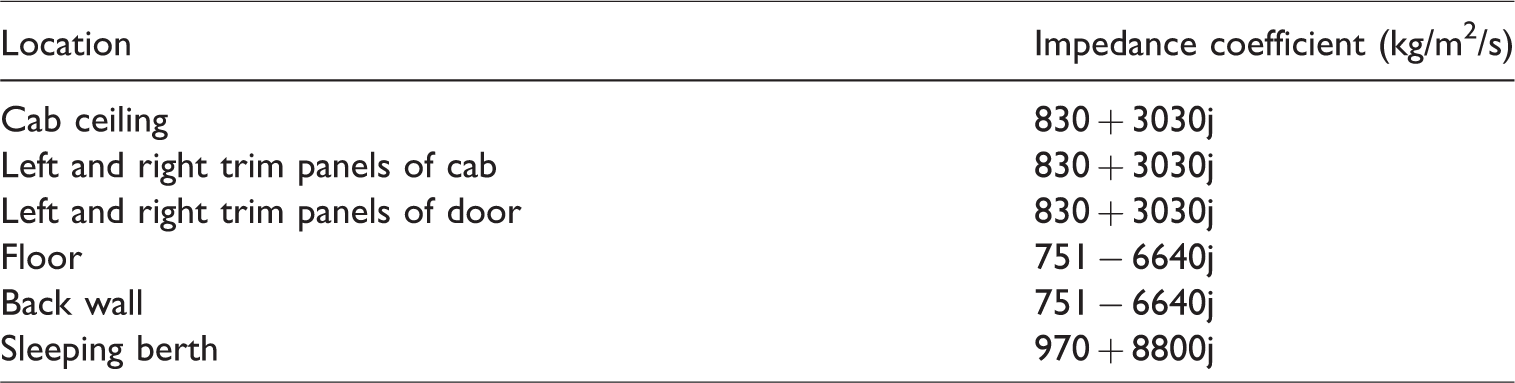
Impedance coefficients of the interior material.
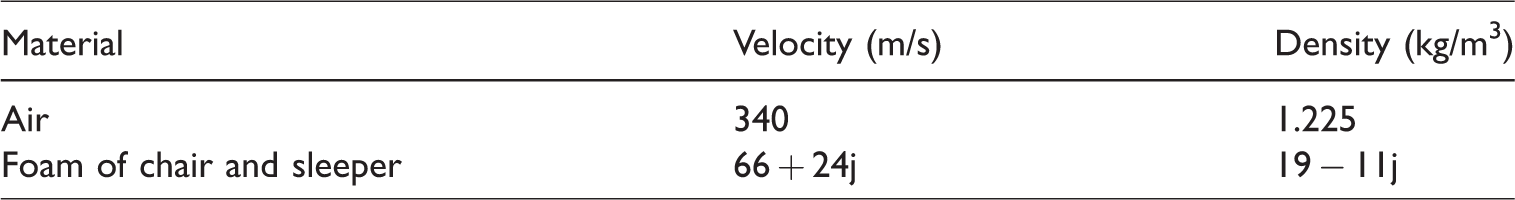
The chair and the sleeper are defined as fluid material to describe the characteristics of the material of foam. The material properties are listed in Table 2.
Fluid properties.
The comparative analysis of numerical and experimental modals is used to verify the accuracy of FEM, analyze the interrelation of structure vibration and structure-borne noise, and ensure that FEM can accurately reflect the vibration characteristics of the actual structure. The modal testing of the white body is illustrated in Figure 2. The heavy commercial vehicle cab is supported by an elastic cushion to simulate a free state. An electromagnetic vibration exciter is then used to generate the excitation signal. A dynamic signal acquisition card NI PXIe-4472 is controlled by the NI PXIe-8133 controller to sample the excitation and response signals. Eight modals are extracted when the series of posttreatment is completed. Simultaneously, an accurate calculation of the free modal of the white body is implemented in the MSC.Nastran software using the Lanczos method to obtain the computational modal. The material properties are defined as follows: density is 7.8 g/cm3, elastic modulus is 2.1 × 10⁵ MPa, and Poisson’s ratio is 0.3.
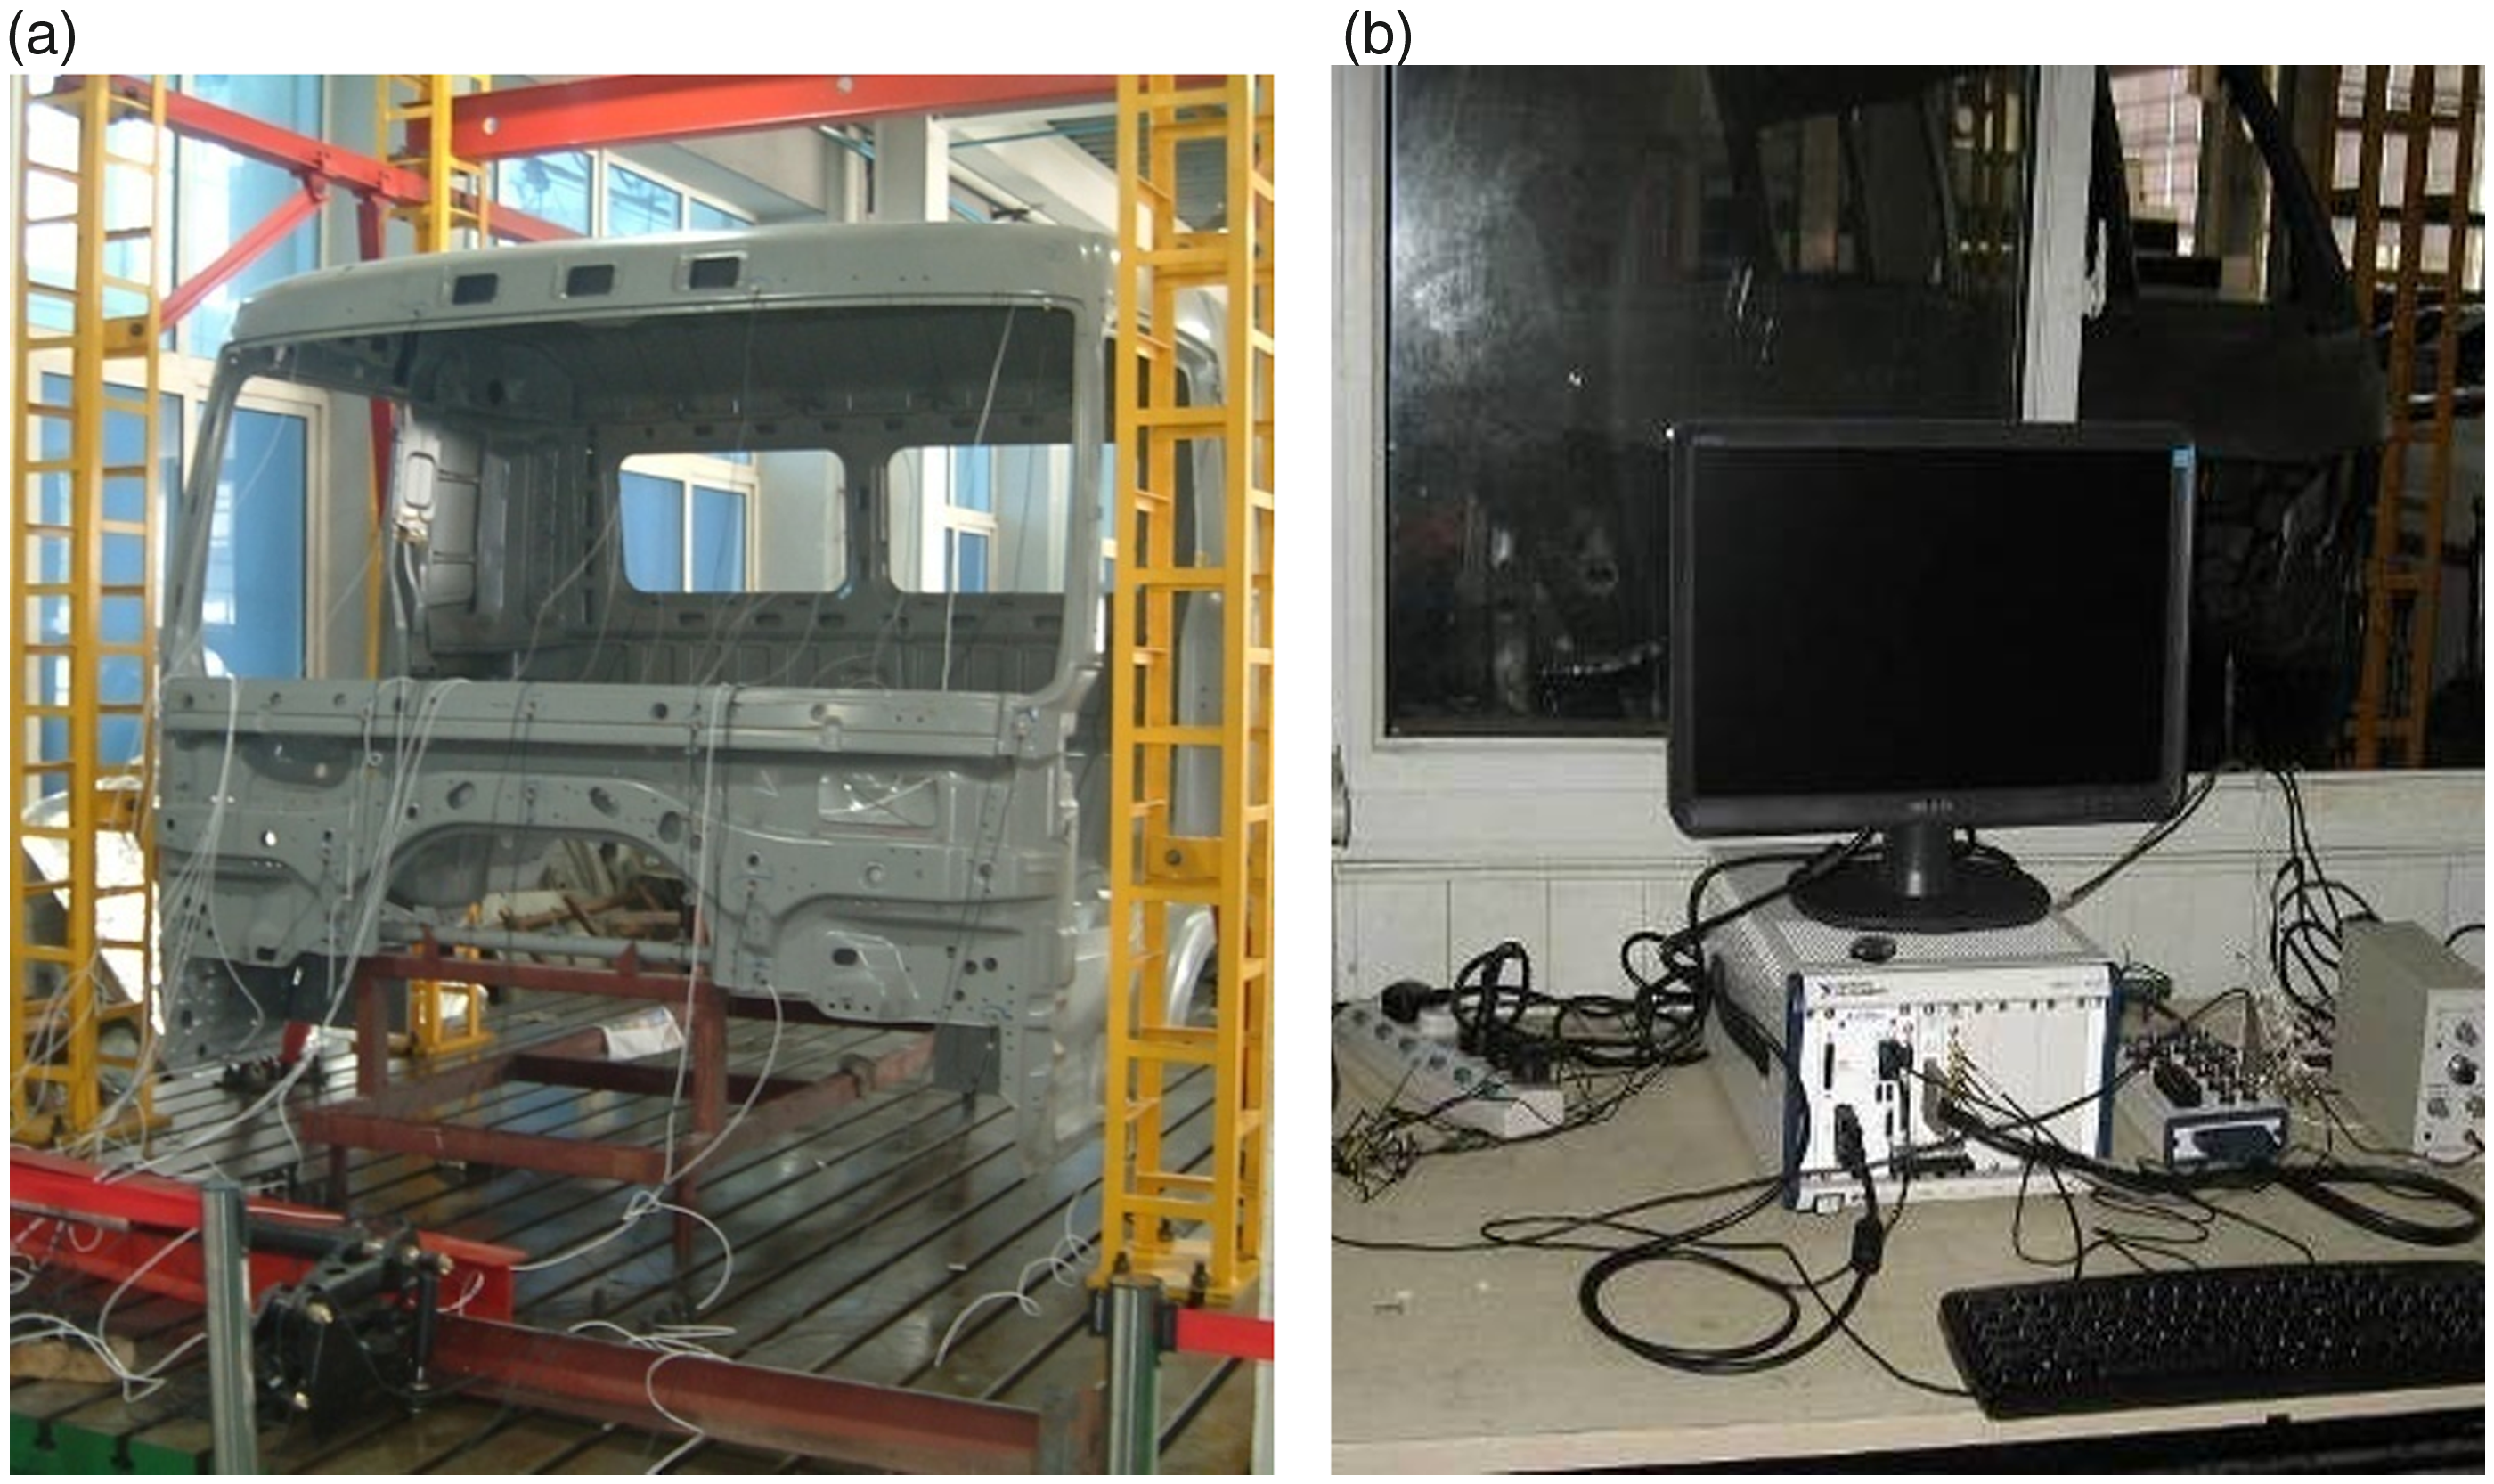
White body modal testing. (a) White body of the heavy commercial vehicle and (b) sampling equipment of the modal test.
The maps of modal shapes of the first eight orders are illustrated in Figure 3, which gives the outline of the vibration displacement of each order. As shown in the figure, the roof, back panel, and roof of the cab undergo maximal displacement corresponding to various modal frequencies. These panels should be given more attention in future research.
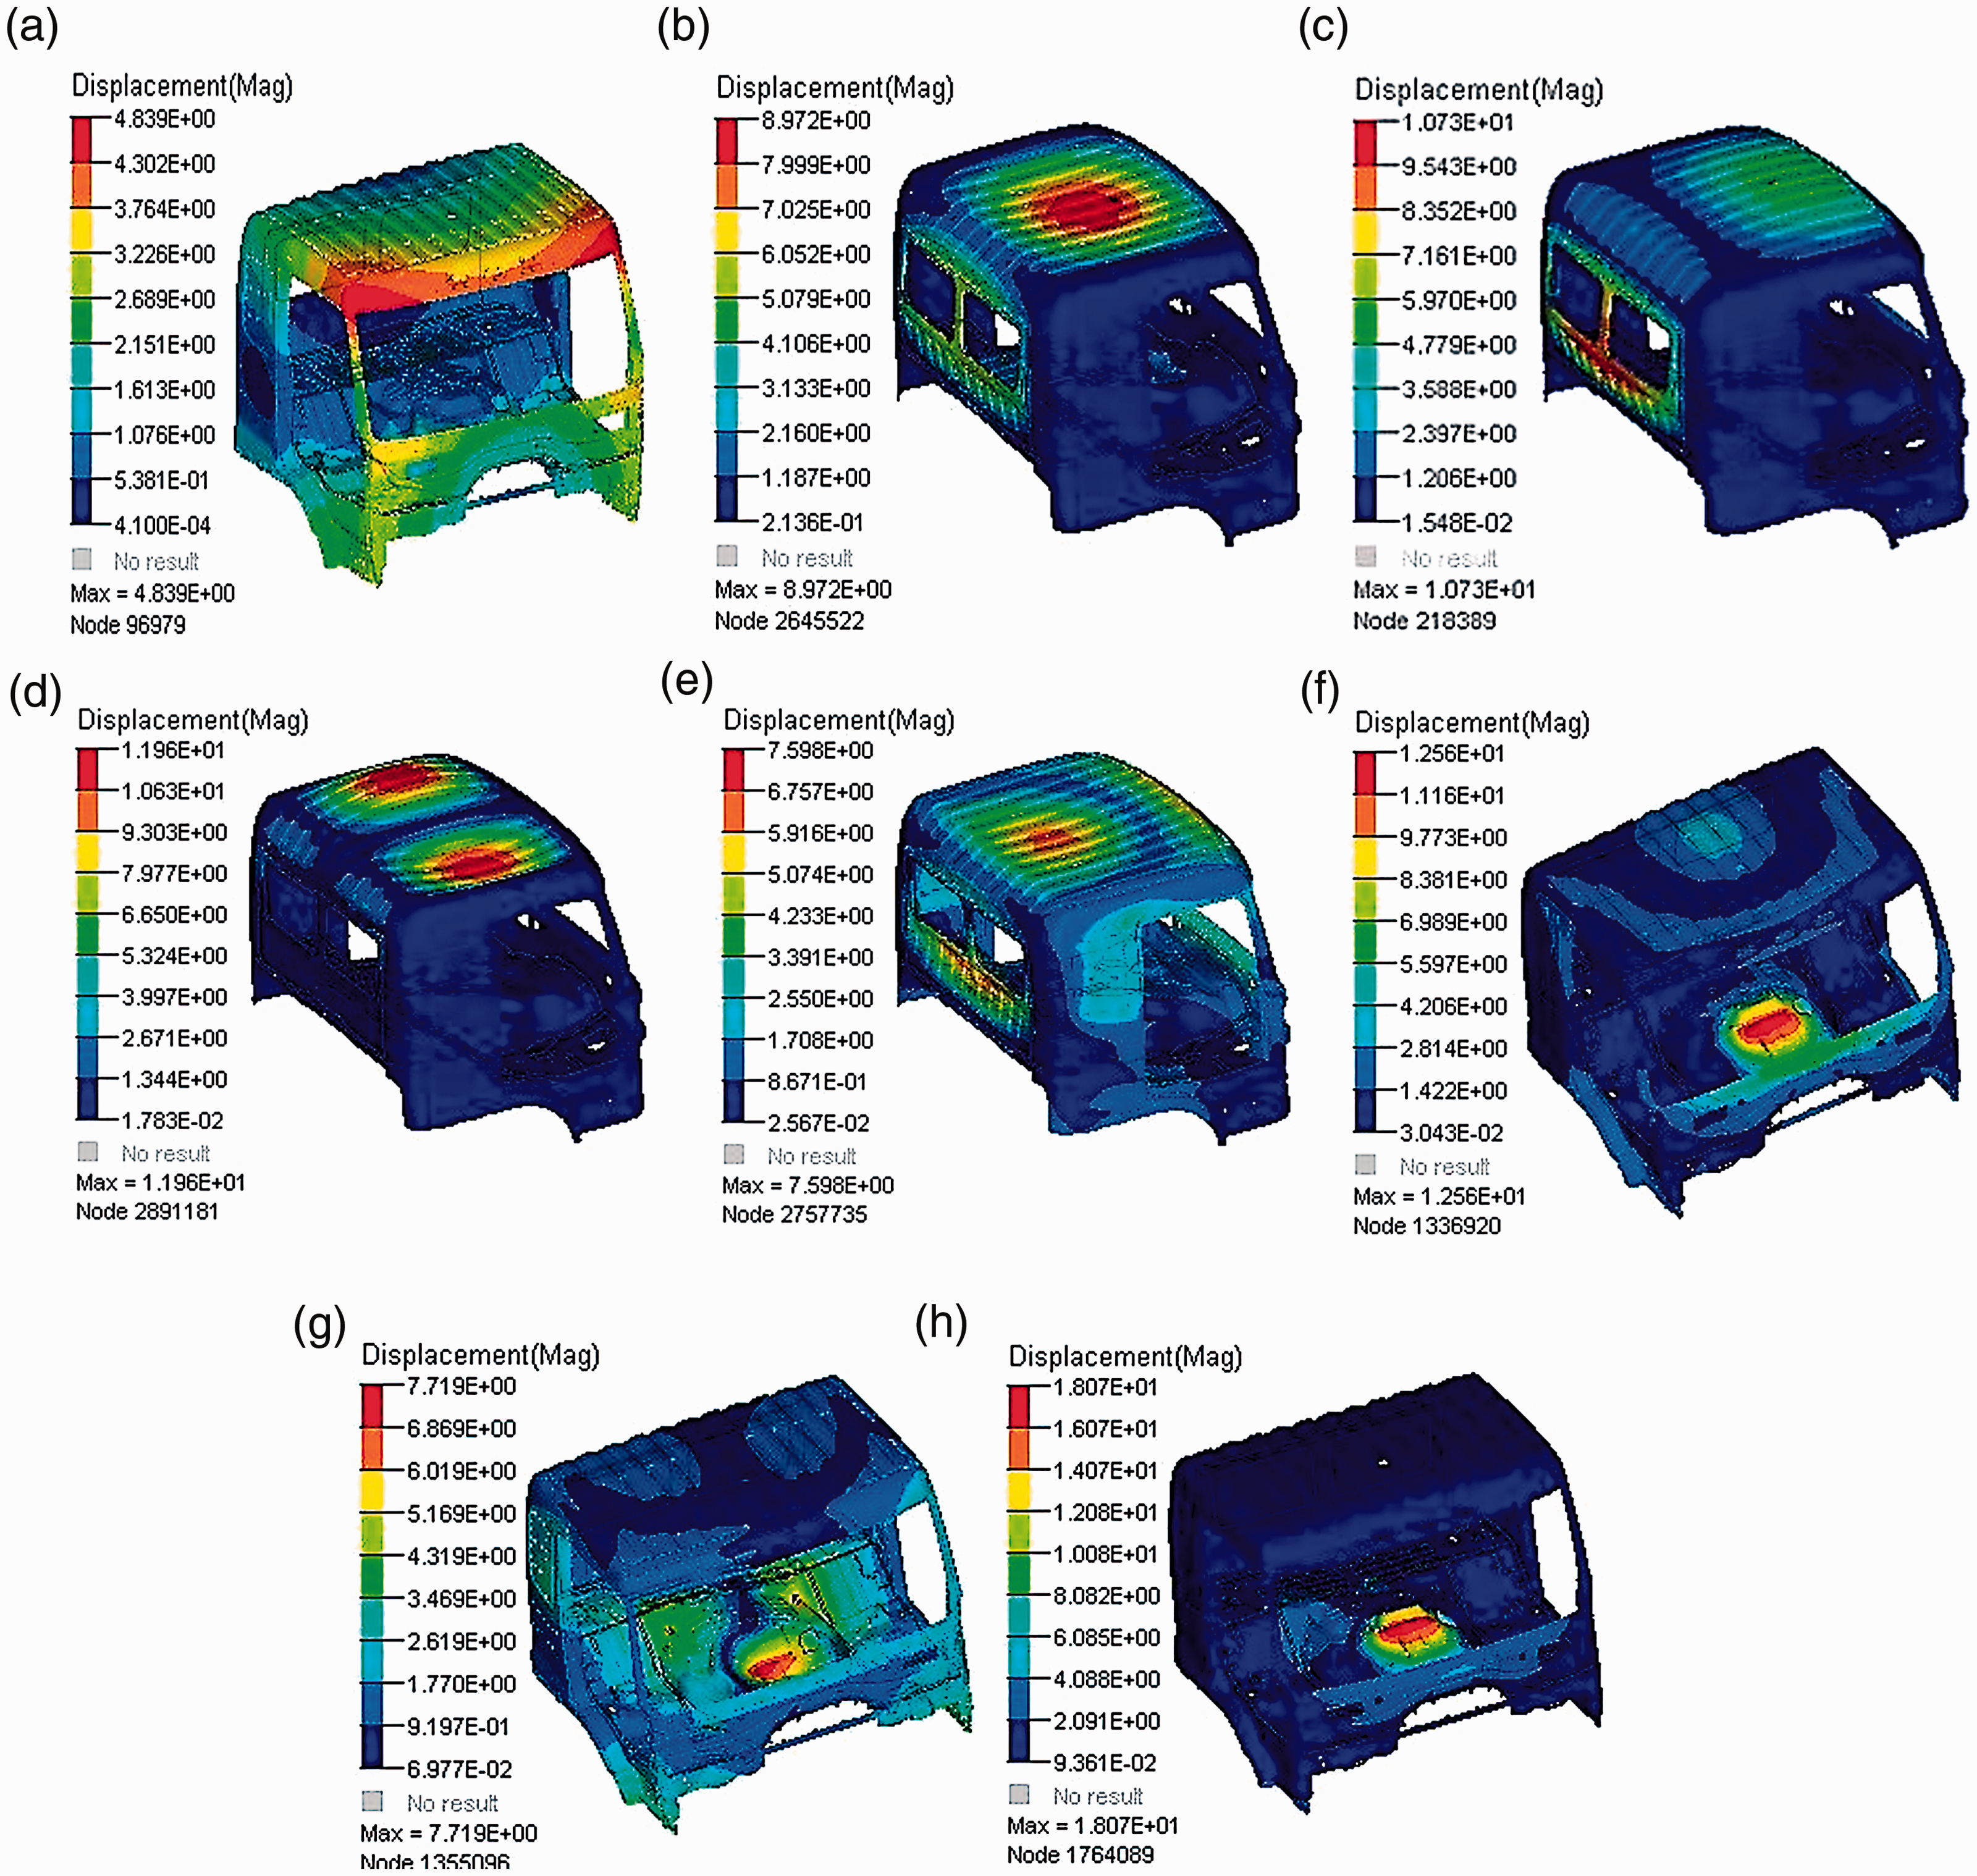
Modal shapes of the first eight orders of the white body. (a) The first order, (b) the second order, (c) the third order, (d) the fourth order, (e) the fifth order, (f) the sixth order, (g) the seventh order, and (h) the eighth order.
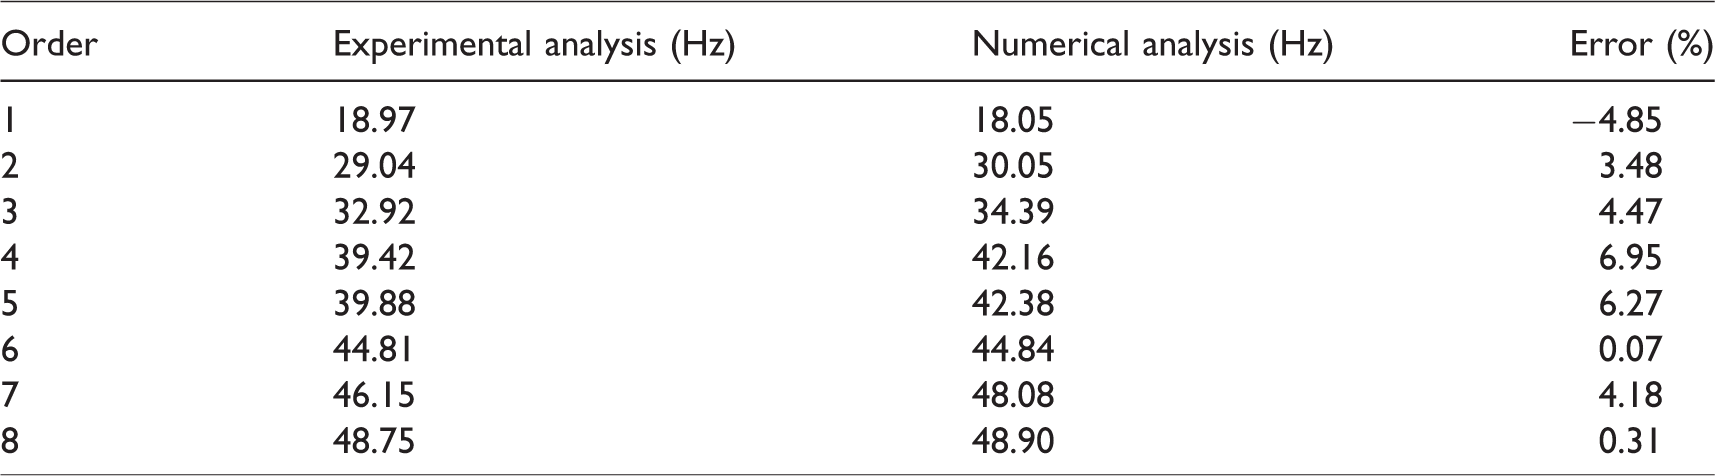
Table 3 compares the modal frequencies of the numerical and experimental analyses. As shown in the table, the natural frequency errors of the numerical and experimental modal analyses are all within 10%. Thus, the precision of the FEM of the white body is validated, which can accurately reflect the vibration characteristics of the actual structure.
Comparison between numerical and experimental results in terms of modal frequencies.
Cab structure–acoustic coupled model
The cab structure–acoustic coupled model is established when the acoustic model is coupled with the structural model via the vibration of boundary nodes, by which the vibrations of nodes are transmitted from the boundary nodes of the cab structural model to the boundary nodes of the cab cavity chamber. Meanwhile, the boundary nodes of the cab cavity chamber exerted a counteraction to the boundary nodes of the cab structure model. Usually, the noise in the cab can be considered as velocity-coupled noise.
17
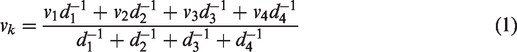
The pressure distribution of the coupled system is determined by the mechanical characteristics of the cab structural model and the acoustic characteristics of the cab cavity chamber simultaneously. In this study, the four-point interpolation method is used to transmit vibrations from the surface of the cab structural model to the envelope surface of the cab cavity chamber. The four-point interpolation method can be expressed as follows
The acoustic finite element equation can be expressed as follows

The structural finite element equation can be expressed as follows

The structure–acoustic coupled finite element equation can be expressed as follows

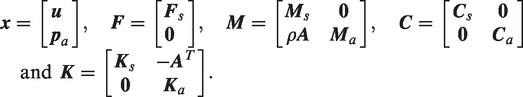
Not considering the damping effect, equation (4) can be simplified as follows

If the ith elements of 
The coupling relation expressed in equation (6) is used to analyze the effects of cab panel vibration on the interior acoustic field and calculate the acoustic pressure distribution and the models of the cab structure–acoustic coupled model. Furthermore, equation (6) is used to analyze the cab panel acoustic contribution and identify key panels that have the most significant effect on the right ear of the driver.
Cab interior noise prediction and analysis
According to the feedback information provided by vehicle manufacturers and customs, the more serious noise problem of heavy commercial vehicle cab occurs during medium and high speeds. Thus, the two tests of vibration and sounds of a heavy commercial vehicle under the speed of 40 and 60 km/h are used to analyze the causes of the cab structure-borne noise and verify the precision of the cab noise prediction model. Four cab vibration accelerations at suspension points and right ear of the driver noise are sampled under two uniform speed conditions. The test road is B grade asphalt road without wind, and the background noise is less than the working noise of 10 dB. The doors, windows, and the import and export of ventilation are closed. The wiper, ventilation fans, and air-conditioning are not operating. Given that this study aims to analyze low-frequency vibration and noise caused by structure-borne vibration, the sampling frequency is 2000 Hz based on the Nyquist sampling theorem. However, the concerned frequency is from 20 to 200 Hz given that this frequency range covers the typical running frequency and is the main frequency band of cab structure-borne noise.18,19 When sampling vibration acceleration and sound pressure, the recording time is set at 30 s and the test is repeated thrice. The measurements of the vibration accelerations and sound pressure are illustrated in Figure 4. In the experiment, four accelerometers 333B30, manufactured by the PCB Group, Inc. of USA, are arranged at the upper end of the suspensions. A sound pressure meter MKV451, manufactured by the BSWA Technology Co., Ltd, is placed near the right ear of the driver. The accelerations and sound pressure signals are synchronously sampled by a dynamic data acquisition card as NI PXIe-4472, which is controlled by the LabVIEW program.
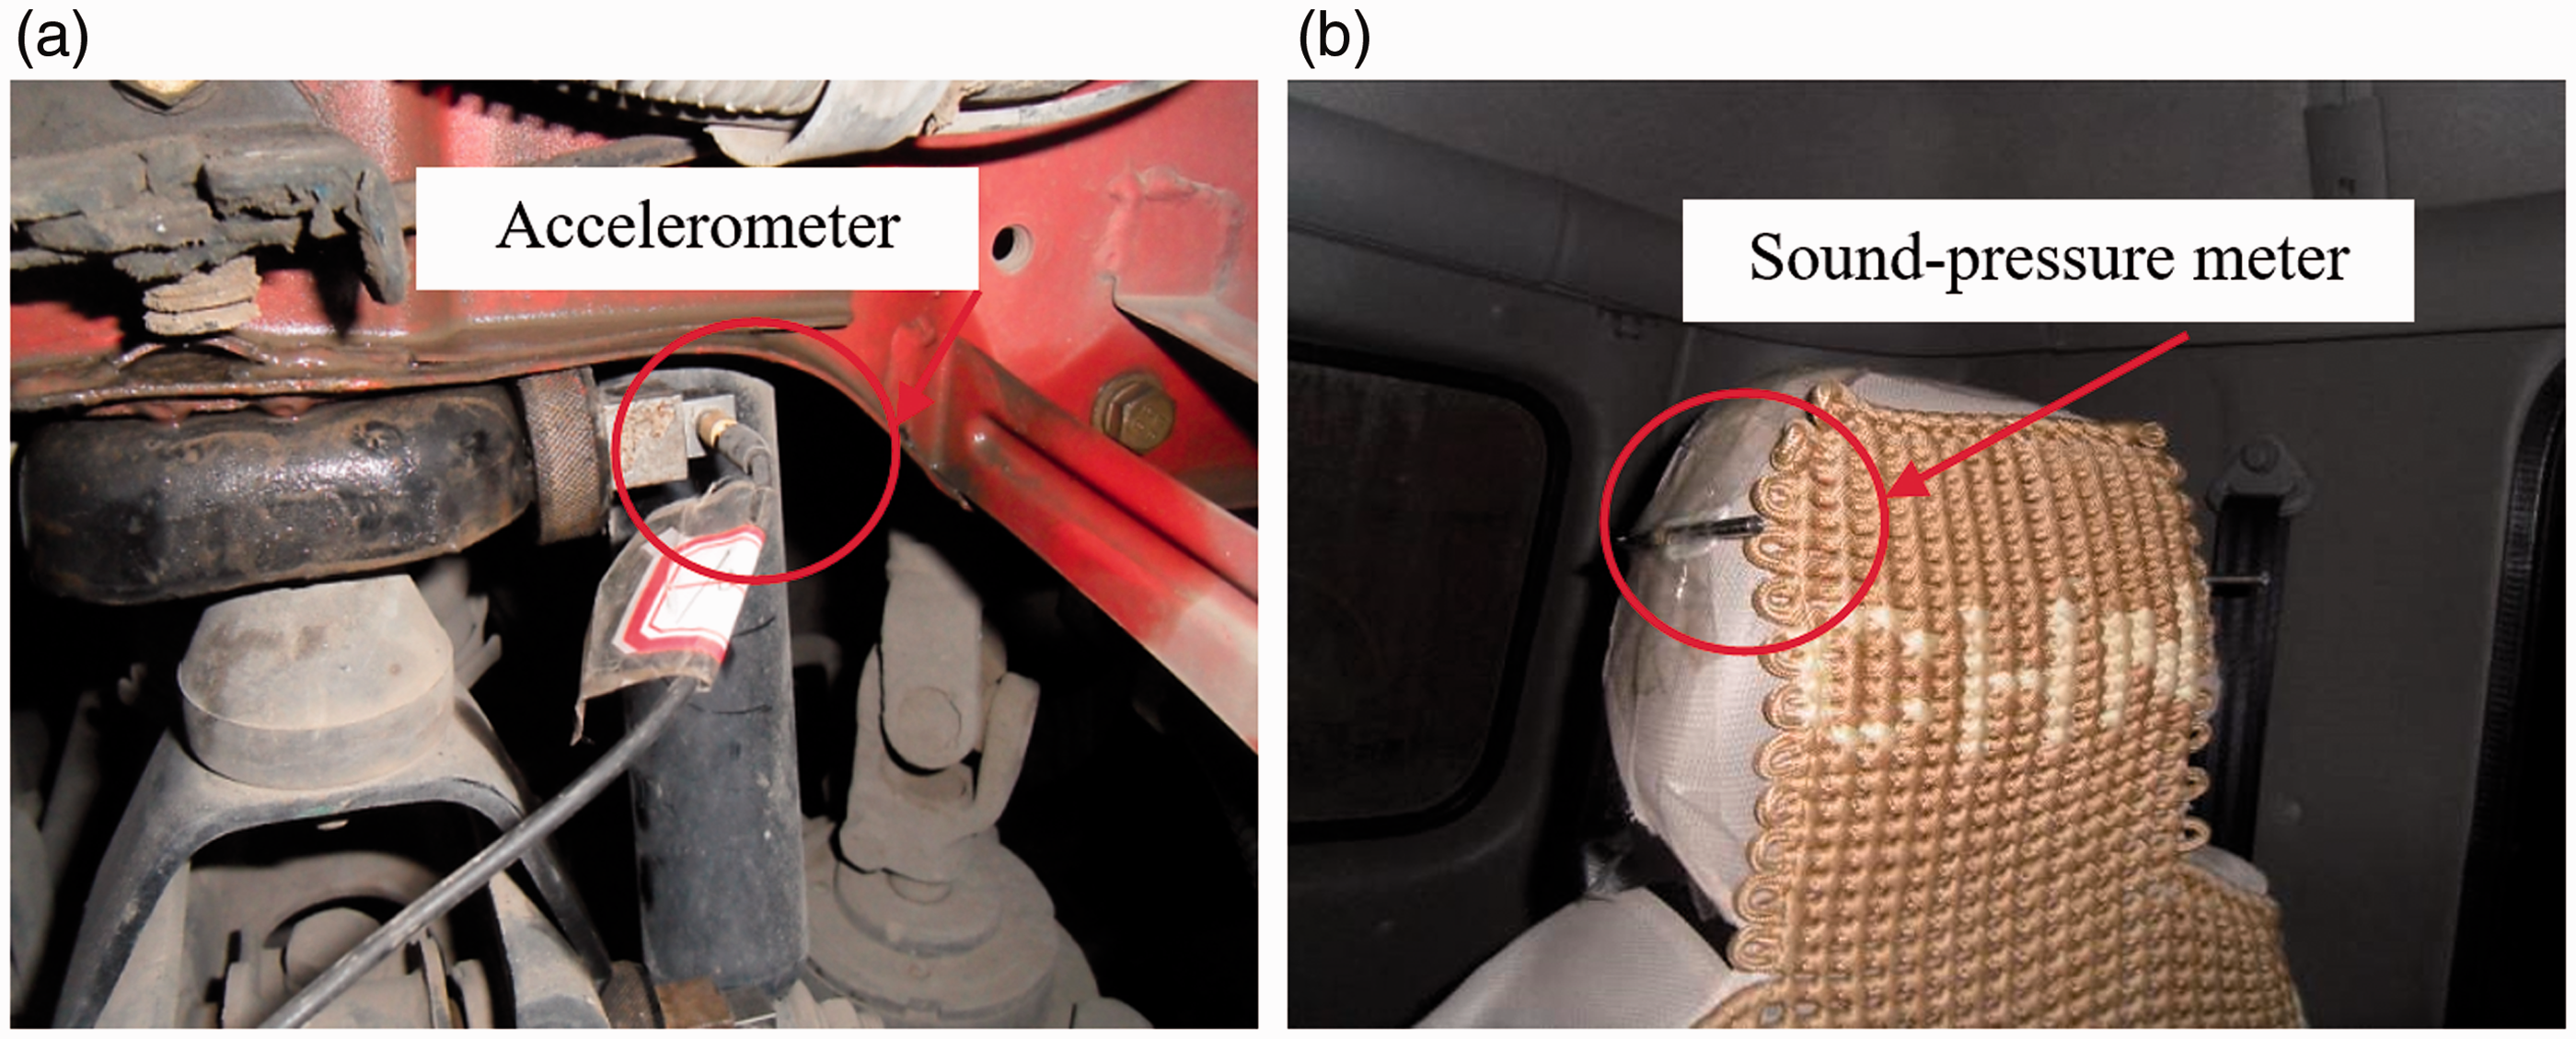
Measurement of vibration acceleration and sound pressure. (a) Vibration acceleration measurement and (b) sound pressure measurement.
The external excitations must be force signals when a structure–acoustic coupled model is used to calculate acoustic response. However, force data cannot be sampled easily in the test. When the vibration acceleration excitations acquired in the test are loaded to the four suspension nodes to implement frequency response analysis, the constraint forces can be calculated by the structural solver of the software Nastran and treated as external force excitations for cab acoustic analysis. Downward forces of 1050 and 860 N are applied to the pilot and copilot seats to simulate the occupant weight, respectively, to simulate the force on the cab accurately. The point near the right ear of the driver is defined as the noise response point, and the coupled FEM is used to predict the sound pressure of the vehicle interior by the direct integral method. The comparisons of the right ear noise during the predictive and experimental settings under two speeds are shown in Figure 5.
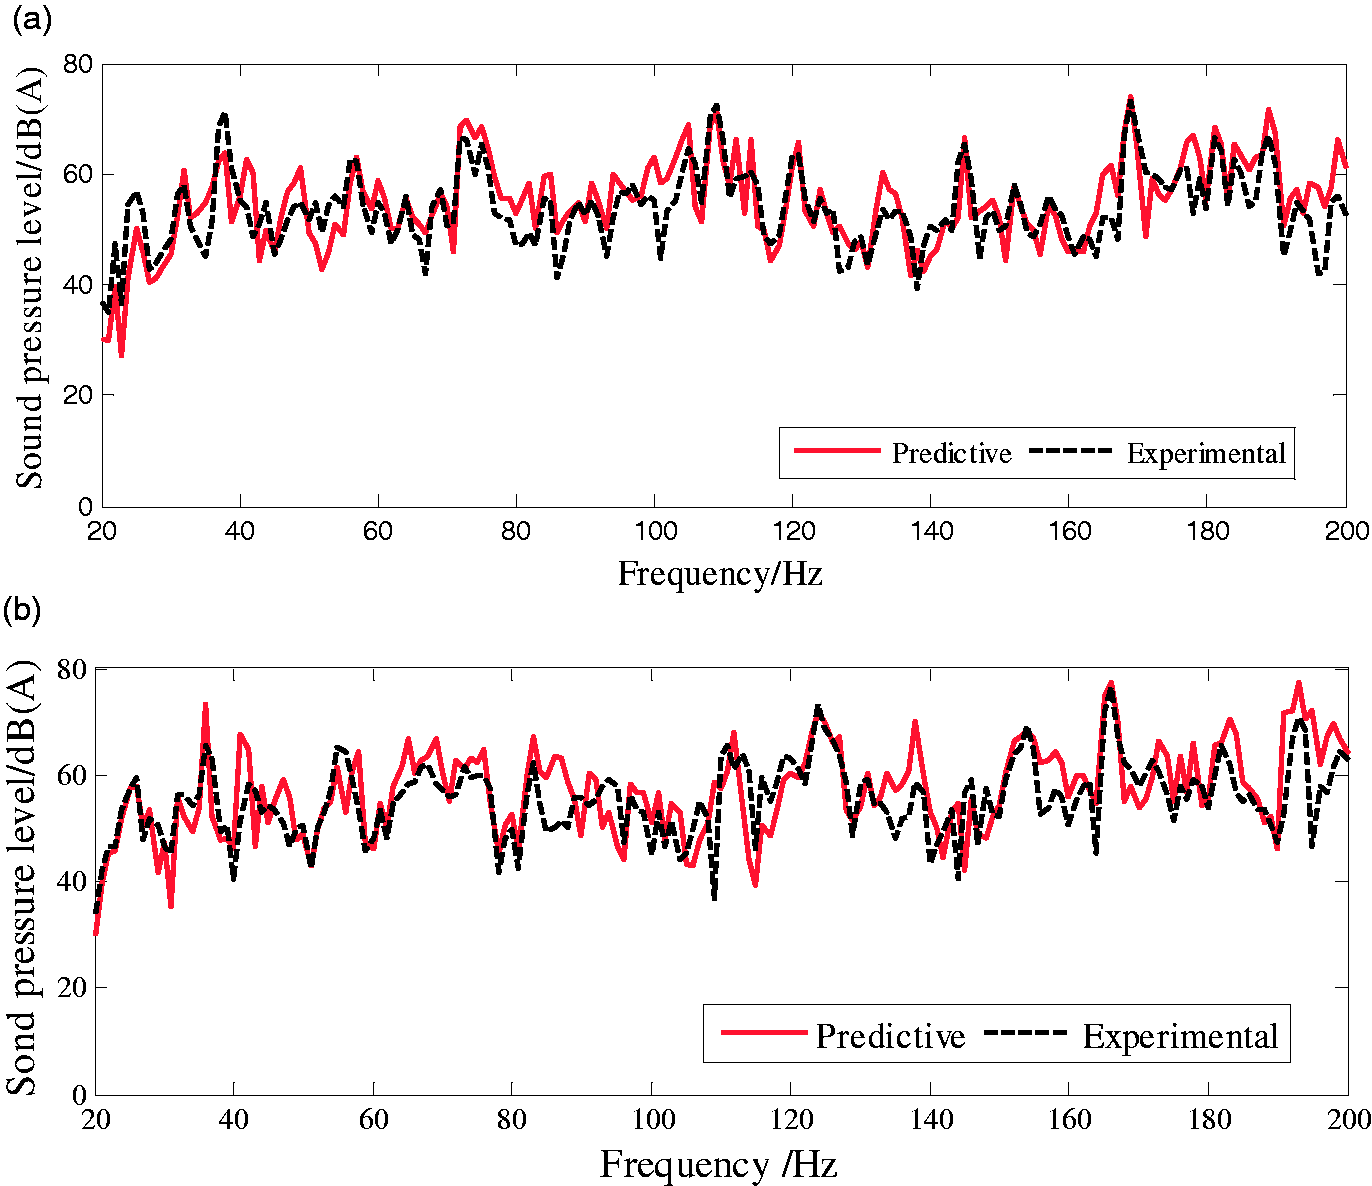
Comparison of the noise responses on the right ear of the driver. (a) Sound pressure level at speed 40 km/h and (b) sound pressure level at speed 60 km/h.
As shown in Figure 5, the predictive and experimental values are close in most range. The root mean square (RMS) of the errors between the predictive and the experimental values are 5.53 and 6.27 dB(A), when the vehicle speeds are 40 and 60 km/h, respectively. The relative errors between the RMS and the mean of the experimental are 10.94 and 12.14%. However, certain errors that might have resulted from outside noise interferences or parameter uncertainties of the cab structure model exist in certain frequency points evidently. Given that the errors of the predictive and experimental values are within the allowable range, the noise prediction model of the heavy commercial vehicle cab has high precision and can be used as an analysis model for further study. In addition, as shown in Figure 5, the maximum noise of 73.98 dB(A) occurred at 169 Hz when the speed is 40 km/h, and the maximum noise of 77.32 dB(A) occurred at 166 Hz when the speed is 60 km/h.
Analysis and optimization
It is inefficient and time consuming if the optimization problem is solved directly using the FEM. When the sampling points of the design variable are generated by the Latin square method for achieving good distributions in the design space, the predefined optimization object and constraint are extracted by the response of cab FEM or structure–acoustic coupled model. Therefore, an approximated model is used to construct a mathematical function between design variables and optimization object or optimization constraint. In order to describe the optimization method in accordance with the approximation model in detail, a flowchart describing the optimization process is shown in Figure 6.
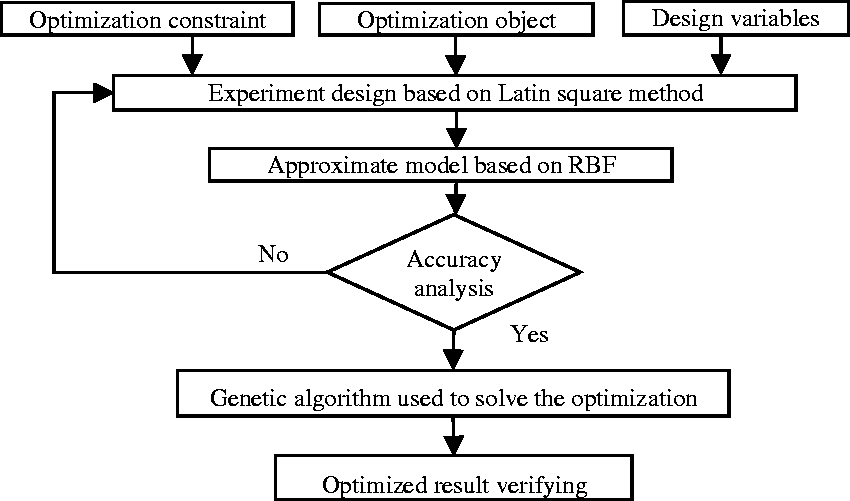
Flowchart of the optimization process.
Panel acoustic contribution analysis
According to the generation mechanism of the cab structure-borne noise, the total sound pressure of an arbitrary field point in the cab is a superposition effect for the acoustic pressure of all panels in the cab. If the critical panel with the largest contribution on field point pressure is determined by a certain method, then several improvements could be implemented to the critical panel to reduce vibration by low-noise structure optimization. However, the contribution of each panel on the field point pressure of the cab varies at different frequency ranges. The first step to reduce interior noise of heavy commercial vehicle cab is to evaluate and identify the critical panels that make the most contributions on peak sound pressure at the critical frequency range. Then, several low-noise structure optimizations could be applied on the critical panels.
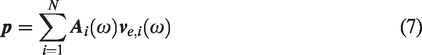
As mentioned previously, the sound pressure of an arbitrary field point is the superposition effect of the total sound pressures produced by all panels in the cab, which can be expressed as follows
If the jth panel has m elements, then 
The acoustic contribution coefficient of the jth panel to the total sound pressures of an arbitrary field point, 
The envelope of the acoustic cavity of the cab is disassembled into 16 main panels to perform acoustic contribution analysis. The panels are labeled middle roof 1, front roof 2, rear roof 3, back panel 4, front windshield 5, dashboard 6, left floor 7, right floor 8, middle floor 9, rear floor 10, upper panel of left side frame 11, left side frame 12, left door 13, upper panel of right side frame 14, right side frame 15, and right door 16. Figure 7 shows the disassembled main panels of the envelope of the acoustic cavity of the cab.
Disassembled envelope of the acoustic cavity system of a cab.
The vibration velocities of all the nodes of the boundary surface of the cab acoustic cavity are acquired by using the cab structure–acoustic coupled model to calculate the acoustic response under the two different running speed conditions. These data are treated as the velocity boundary condition for acoustic panel contribution analysis. The acoustic contribution coefficients of each panel under two different running speed conditions are shown in Figure 8.
Acoustic contribution coefficient of each panel to the right ear of the driver. (a) Contribution coefficient of each panel at 38 Hz under the condition of 40 km/h, (b) contribution coefficient of each panel at 169 Hz under the condition of 40 km/h, (c) contribution coefficient of each panel at 36 Hz under the condition of 60 km/h, and (d) contribution coefficient of each panel at 166 Hz under the condition of 60 km/h.
Figure 8 indicates the acoustic contributions of the 16 main panels. At 38 Hz, the contribution coefficients of middle roof 1 and back panel 4 are 0.91 and 0.57, respectively. At 169 Hz, the contribution coefficients of rear roof 1 and rear floor 10 are 0.59 and 0.58, respectively. When vehicle speed is 60 km/h, middle roof 1 and back panel 4 give more contributions on peak sound pressure at the frequency of 36 Hz, the contribution coefficients of the aforementioned panels are 0.88 and 0.60, respectively. Overall, the main panels that have the most positive contributions to the right ear of the driver at the low-frequency range are middle roof 1, front roof 2, rear roof 3, back panel 4, left floor 7, right floor 8, and middle floor 9. These panels must be considered first when low-noise structure optimization to the cab of the heavy commercial vehicle is applied. These main panels are defined as critical panels in this study and are treated as objects of low-noise structure optimization, such as thickness optimization.
Establishment of the optimization model
According to the result of the cab panel acoustic contribution analysis, panel thickness is defined as the design variable. Among these panels, middle roof 1, front roof 2, and rear roof 3 are considered to be one plate and the thicknesses of the three panels are treated as one design variable. Left floor 7 and right floor 8 are symmetrical and their thicknesses are treated as one design variable. Along with back panel 4 and middle floor 9, there are four design variables. The sound pressure level at a frequency of 166 Hz when running speed is 60 km/h is the largest contributor. Therefore, the reduction of this maximum noise is taken as the optimization objective. Noise level at a frequency of approximately 169 Hz when running speed is 40 km/h is the second largest contributor and is considered an optimization constraint that should not be increased when optimization is implemented. During optimization, the first-order natural frequency is guaranteed not to be reduced for avoiding resonance with road excitation. At the same time, this step should assure that the increment of the weight of the cab is less than 3%. In accordance with the previously presented analysis, the optimization model is established as follows

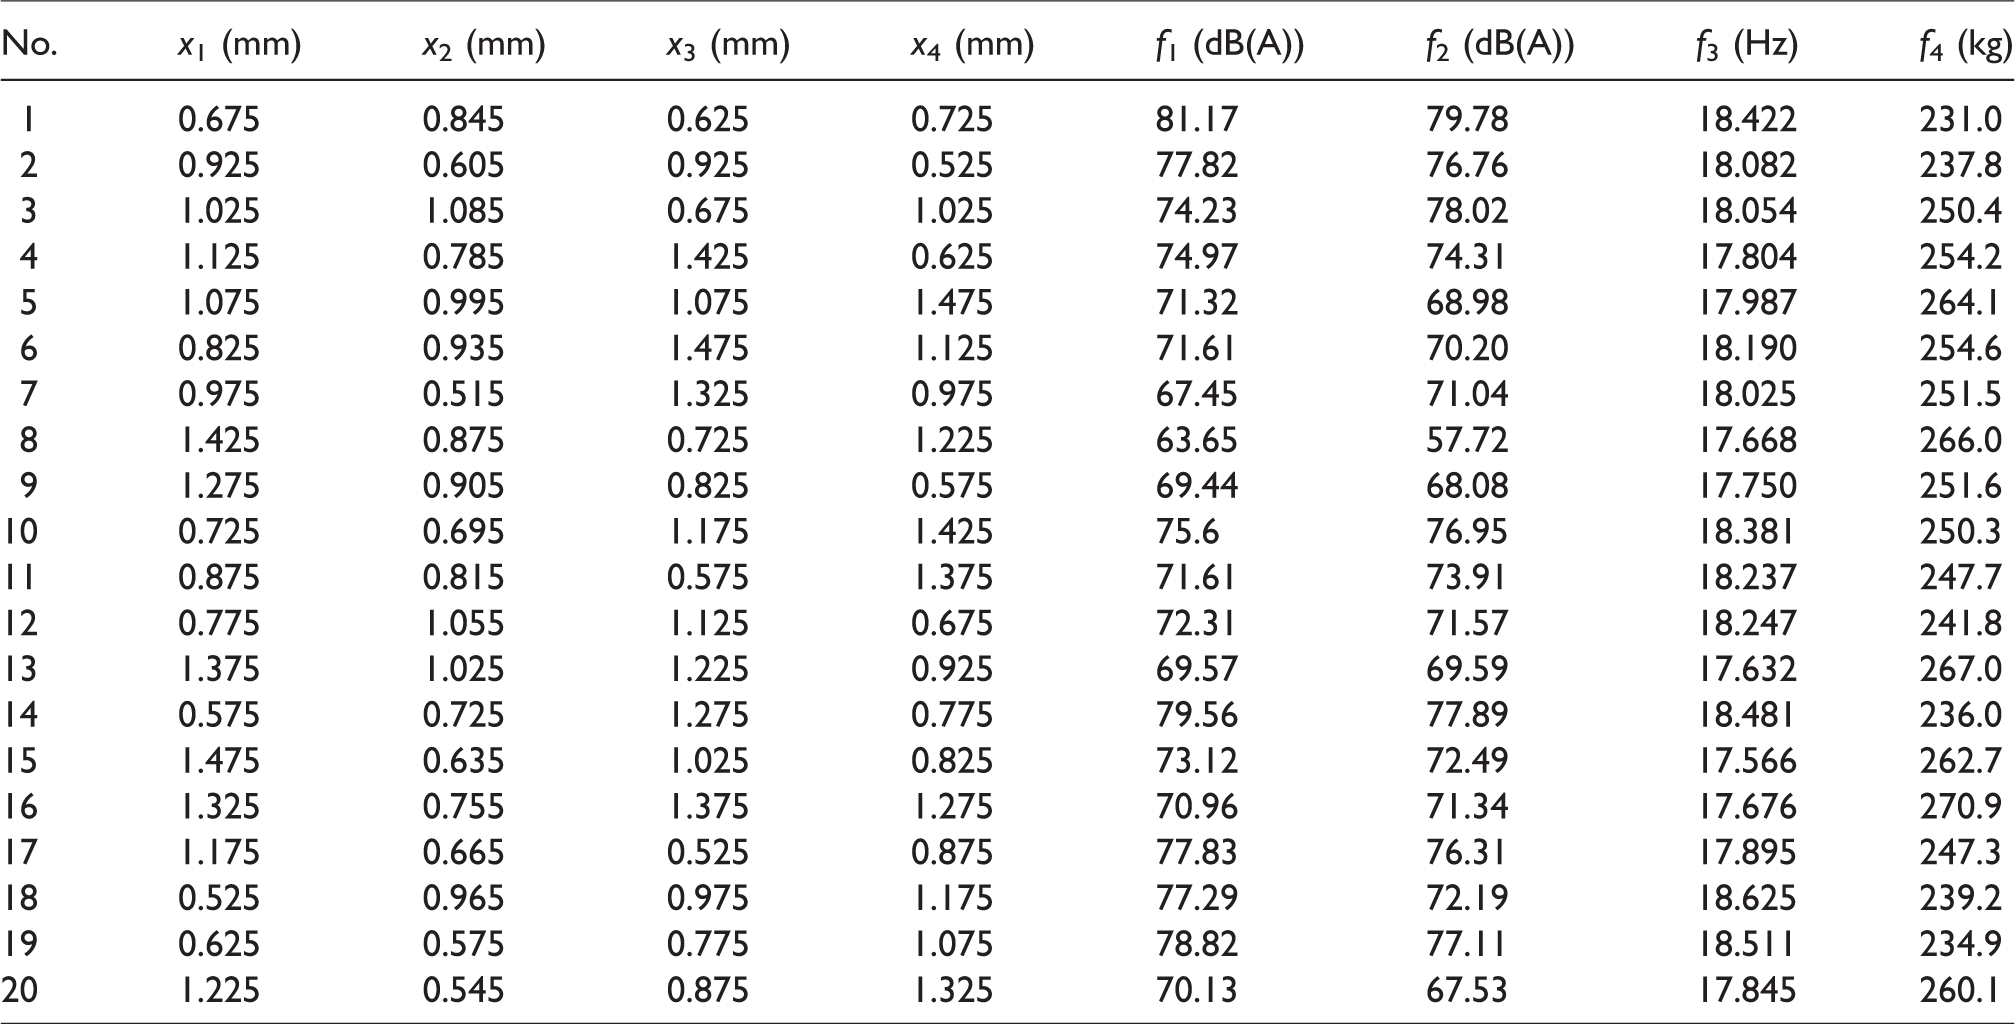
The uniform Latin square method is selected as the experimental design method in this study to build a high-fidelity model. The data of 20 sample points are listed in Table 4.
Twenty sample points defined by the uniform Latin square design method.
Establishment of the approximate model on the basis of the RBF
There are different types of approximate models that can be used to construct the relationship between design variables and responses, such as response surface,
20
Kriging models,
12
and RBF. Among the approximate model methods, RBF is suitable for tackling highly nonlinear responses and has the best performance for accuracy and robustness.
21
RBF is used to build an approximate model that the analysis model needs for critical panel thickness optimization. RBF can transform a complex multidimensional problem into a simple one-dimensional problem with Euclidean distance as the independent variable. The fundamental form can be expressed as follows
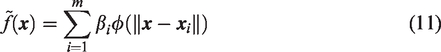
The approximate model on the basis of the RBF fits real function 
Substituting equation (12) into equation (11), the following equation set can be derived

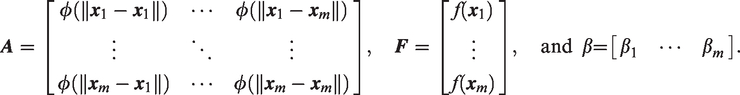
When the sample points are misaligned and function 
A low-order polynomial is added to the basis of the classical RBF to improve the adaptability of the approximate model on the basis of the RBF to the linear or nonlinear relation simultaneously,
24
and its mathematical expression is written as follows
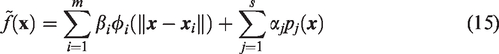
Given that the number of unknown variables in equation (15) is larger than the number of independent equations, this function is unsolvable. Therefore, an orthogonality condition with respect to 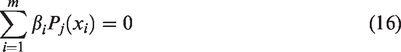
A combination of equations (15) and (16) results in 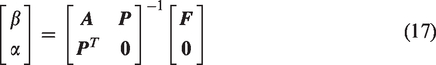
After the approximate model is established, the precision test is applied to guarantee accuracy. In general, root mean square error (RMSE), 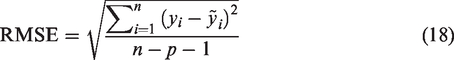
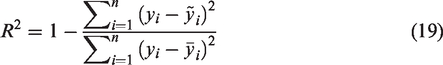
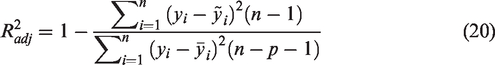
Another eight sets of sample points of the design variables, which are not used to establish the approximate model, are selected as evaluation points. The evaluated indices of RMSE,
Evaluation of the approximate model prediction error.
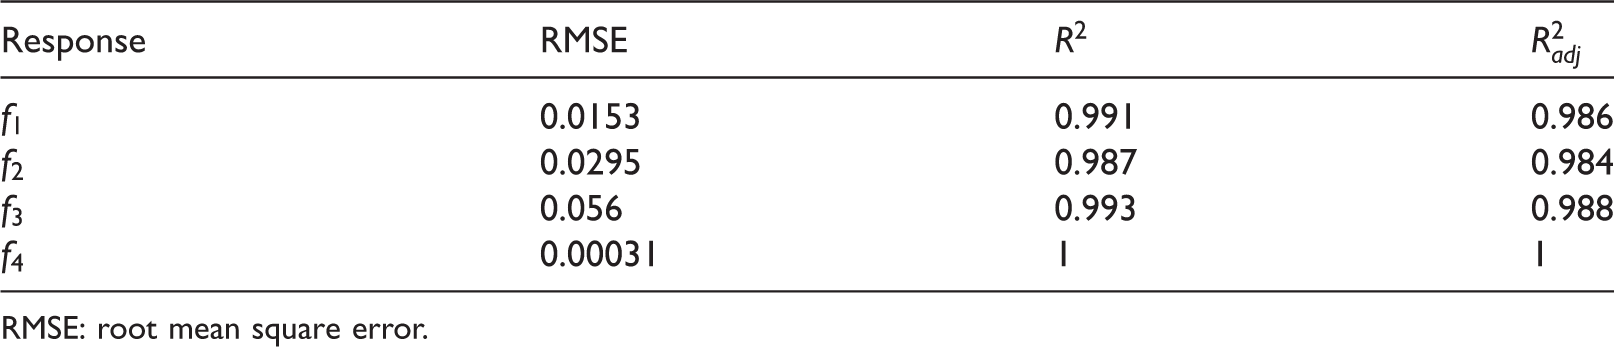
RMSE: root mean square error.
Optimization result and analysis
The panel thickness optimization model in accordance with the approximate model is solved by genetic algorithm. The population in the algorithm is set as 50. The iteration process is illustrated in Figure 9. As shown in Figure 9, the objective function converged at 69.38 dB(A) after eight times of iteration. This process only took 75 s, whereas one acoustic response computation of the structure–acoustic coupled model needed 5–6 h in general for the same computer. Thus, using the approximate model for analysis can significantly improve computational efficiency. After optimization, the design variables of the optimization model are x1 = 1.221 mm, x2 = 0.849 mm, x3 = 0.924 mm, and x4 = 1.194 mm. Considering the specification limits of practice panel thickness, the values are rounded off to x1 = 1.2 mm, x2 = 0.8 mm, x3 = 0.9 mm, and x4 = 1.2 mm.
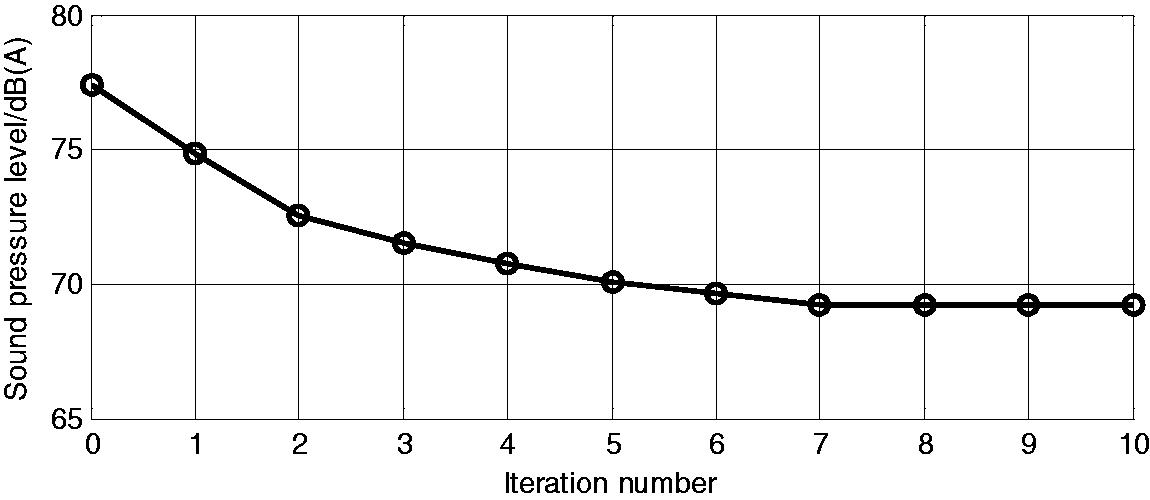
Iteration process of optimization.
Substituting the final optimal thickness into the approximate and FEM models, the optimization objective and constraint are computed and compared, as shown in Table 6. The relative error is less than 1%, which indicates that the approximate model is effective.
Performance comparison before and after optimization.
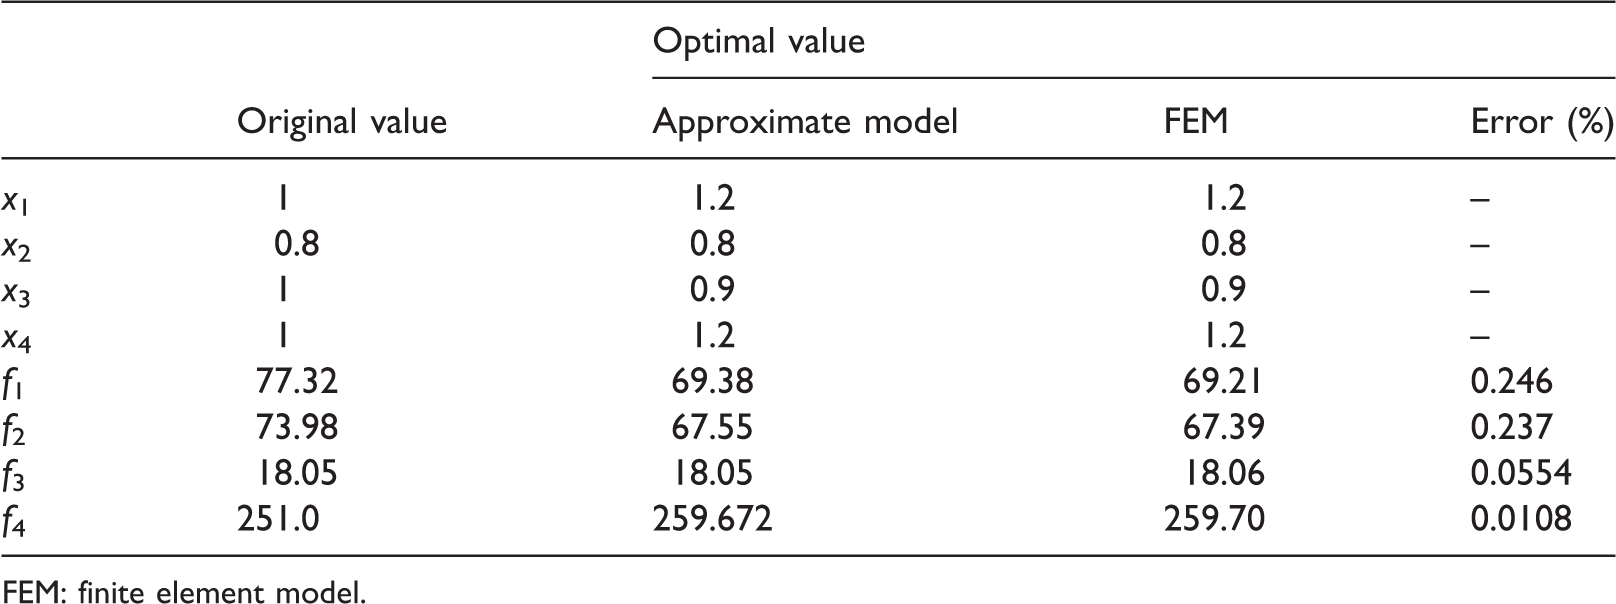
FEM: finite element model.
The optimal panel thicknesses listed in Table 6 are compared to evaluate the cab acoustic responses before and after optimization. Under two different conditions, the frequency response of sound pressure level at the right ear of the driver is shown in Figure 10. The maximum peak value at 169 Hz is reduced to 6.59 dB at the running speed of 40 km/h and 8.11 dB at the running speed of 60 km/h. Thus, the optimized thicknesses of the critical panels can effectively improve the acoustic comfort of the cab.
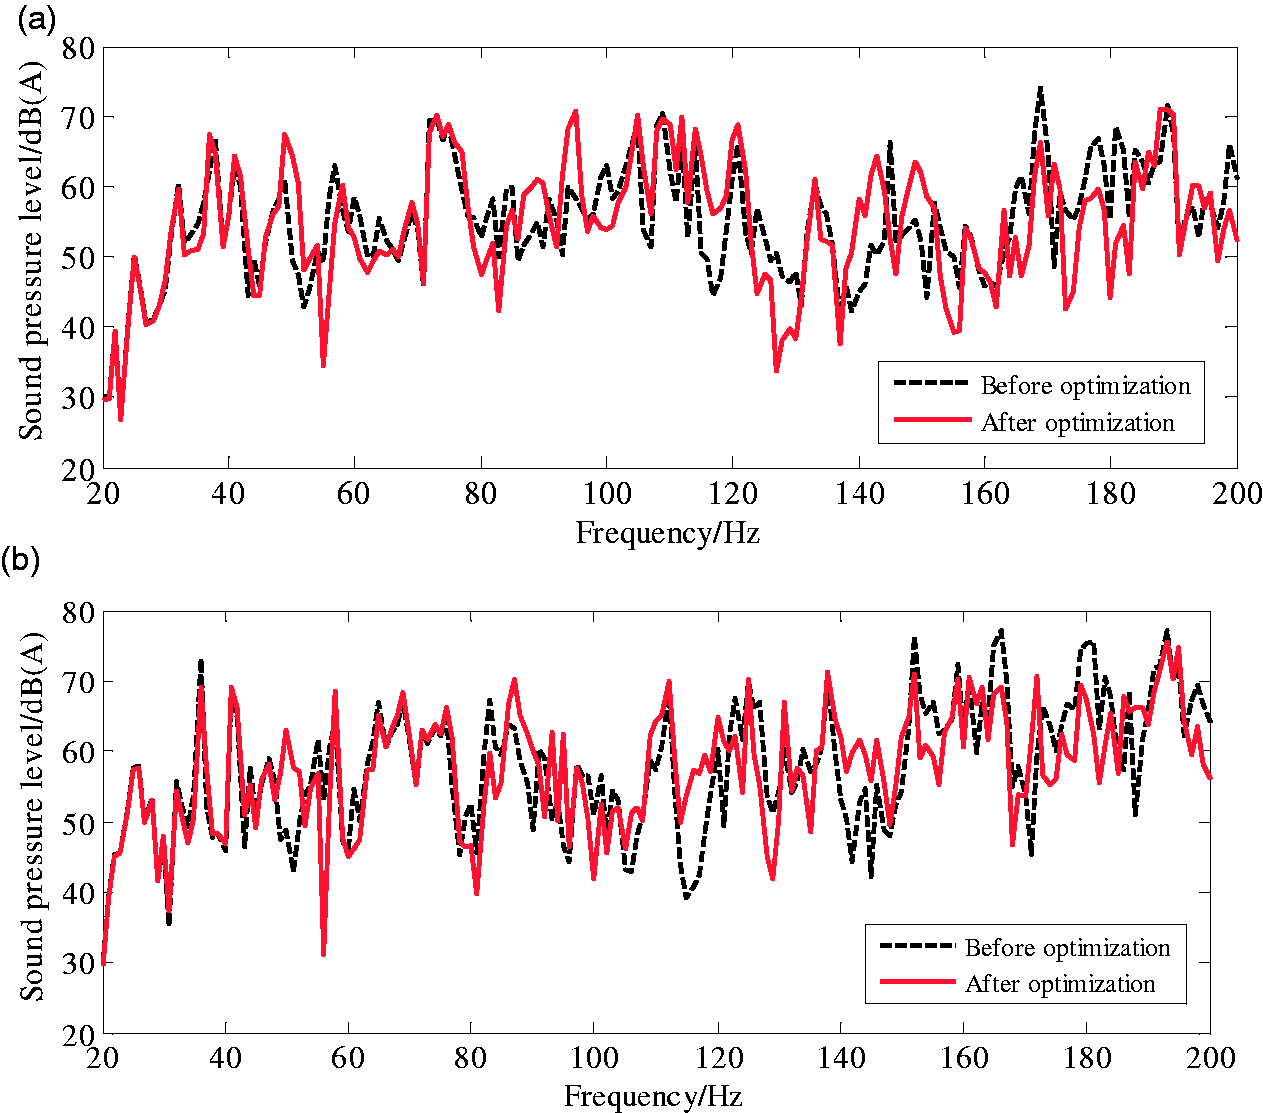
Comparison of low-frequency sound pressure response at the driver’s ear before and after optimization. (a) Before and after optimization under the condition of 40 km/h and (b) before and after optimization under the condition of 60 km/h.
Conclusions
A method of low-noise structure optimization in accordance with the RBF approximate model is introduced in this study. The structural FEM model of heavy commercial vehicle cab is established, and the model’s precision is verified by white body modal testing. The structure–acoustic coupled model is then used to predict low-frequency noise at the right ear of the driver, which proves that the structure–acoustic coupled model of the cab has high precision, and the transformation of vibration acceleration into excitation signal is effective. According to the panel acoustic contribution analysis, the panels that have the most positive contributions to the right ear of the driver at the low-frequency range are the roof, back panel, and floor. An approximate model on the basis of the RBF is used to perform low-noise structure optimization, which showed high accuracy and high computational efficiency. According to the comparison of noise peak pressure response at the right ear of the driver before and after optimization, it is obvious that the optimal panel thickness can significantly reduce the sound pressure level of the right ear of the driver at 169 Hz. As result, the optimization method in accordance with the approximate model proposed in this study is effective.
Footnotes
Declaration of conflicting interests
The author(s) declared no potential conflicts of interest with respect to the research, authorship, and/or publication of this article.
Funding
The author(s) disclosed receipt of the following financial support for the research, authorship, and/or publication of this article: This work is financially supported by the National Natural Science Foundation of China (No. 51675057) and the Hunan Provincial Natural Science Foundation of China (No. 2015JJ2002). This work is also supported by the State Key Laboratory of Advanced Design and Manufacturing for Vehicle Body (No. 31215003).