
Abstract
Modal frequency is an important indicator reflecting the health status of a structure. Numerous investigations have shown that its fluctuations are related to the changing environmental factors. Thus, modelling the modal frequency–multiple environmental factors relation is essential for making reliable inference in structural health monitoring. In this study, the Bayesian network (BN)-based algorithm is developed for recognizing the pattern between modal frequency and multiple environmental factors. Different candidates of network structure of the BN are proposed to describe the possible statistical relations of different variables. In the BN-based pattern recognition, the learning phase conducts uncertainty quantification in both parameter and model levels; and the prediction phase makes inference under complete and incomplete observed information. Based on the long-term monitoring data, the most plausible network structure is selected, and its associated parameters are identified. The developed algorithm is then utilized for analyzing the long-term monitoring data (modal frequencies, temperature, humidity, wind speed and traffic volume) of the Xinguang Bridge (a 782-m three-span half-through arch bridge). It turns out that the selected network structure properly captures the pattern of modal frequency–multiple environmental factors.
Introduction
Structural health monitoring is to infer structural health status given measurements of structural responses and environmental conditions, 1 which has been developed and utilized for various types of infrastructures such as bridge,2–8 building structure, etc.9–16 The modal frequency is widely adopted as a global health status indicator in SHM.17,18 As monitored infrastructures are exposed to environmental conditions, evidence can be observed that the fluctuations of modal frequencies are related to the changing environmental factors such as the temperature, relative humidity, wind speed and traffic loading. Direct ignorance of the environmental effects in SHM possibly leads to misleading inference. Therefore, considerable efforts have been devoted to depicting the pattern between modal parameters and environmental factors. The modal frequency–multiple environmental factors pattern recognition contains the training/learning phase and prediction phase. Based on training SHM data (modal frequencies and environmental factors), the training/learning phase is to select the model class and identify the parameters of modal frequency–multiple environmental factors relation. Once the model is trained, it can be utilized to predict the output data (modal frequencies) based on the given input data (multiple environmental factors) in the prediction phase. In practical SHM applications, the key is how to make accurate and robust predictions when the training input data only comprise a tiny fraction of all possible input data, which is known as generalization in pattern recognition. Cornwell et al. 19 developed a linear model for daily temperature and modal frequencies, and they discovered that the first frequency of the Alamosa Canyon Bridge varied by 4.7% over the 24-h period. Peeters and Roeck 20 utilized the ARX model to capture the relationship between temperatures (air temperature and stuctural temperatures) and modal frequencies by one-year monitoring data of the Z24-Bridge. Xia et al. 21 modelled environmental conditions-modal parameters with a linear regression model by nearly two-year monitoring of a reinforced concrete slab outside the laboratory. It was found that the modal frequencies and damping ratios have strong correlation with temperature and humidity. Hua et al. 22 modelled temperature–frequency with combined principal analysis and support vector regression technique. Liu et al. 23 used the linear regression models to evaluate how the temperature variations influence the modal parameters. Zhou et al., 24 Ni et al. 25 and Li et al. 26 used the neural network to determine the correlation between the environmental conditions and the modal parameters. Yuen and Kuok27,28 inspected a set of model class candidates based on Bayesian probabilistic approach. Mu et al. 29 developed a pattern recognition algorithm to select the relevance features in environmental conditions (temperature and relative humidity) and modal frequencies. Moser and Moaveni 30 monitored a steel pedestrian bridge located on Medford. A fourth-order model, out of six regression models, without cross terms was selected as the best representative model for the relationship between the modal frequencies and the temperature. Zhang et al. 31 used the Gaussian process regression technique to model the dependency between the bridge modal frequencies and the environmental along with operational conditions.
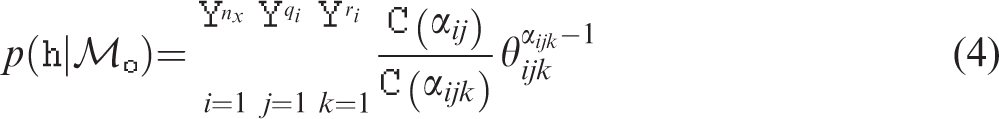
Since both structural dynamical responses and environmental factors exhibit significant level of uncertainty,32–35 uncertainty quantification (UQ) is essential in modal frequency–multiple environmental factors pattern recognition.36–38 Bayesian probabilistic framework-based approach39,40 has attracted special attention as it provides a rigorous solution to UQ in both parameter level41–44 and model level.45–47 As the complexity of the pattern between modal frequency–multiple environmental factors grows with the number of the environmental factors in the inference process, a sophisticated graphical model-based tool, the Bayesian network (BN), 48 is explored and developed for pattern recognition purpose. There are three advantages of the BN. First, its inference is based on Bayesian framework, so it possesses the capacity of UQ. Second, it utilizes a graphical interpretation to depict the casual or statistical dependent relationships between different variables and it is capable of directly identifying the conditional and joint probability distributions of the variables. Third, it can make inference under incomplete observed information (missing data), which is common in SHM. Due to these advantages, it has attracted attention in georisk and structural engineering, such as ground-motion prediction, 49 reliability analysis, 50 and risk assessment. 51
In this study, the BN-based pattern recognition is performed based on one-year modal frequency and multiple environmental (temperature, relative humidity, wind speed, and traffic) monitoring dataset of a 782-m three-span half-through arch bridge over the Pearl River of Guangzhou City of China. The remaining parts of the paper are organized as follows. Dataset and BN structure candidates are firstly presented. Then, the BN-based pattern recognition is explored and developed. Finally, pattern recognition results of modal frequency–multiple environmental factors of the Xinguang bridge are presented and the prediction capability of the BN-based model is validated.
Dataset and BN structure candidates
The monitored structure is the Xinguang Bridge (shown in Figure 1), which is a three-span half-through arch bridge with the mid span of 428 m, two side spans of 177 m each, and width of 37.62 m, over the Pearl River of Guangzhou City of China. It is the first bridge with a combination of the steel truss arch and the concrete triangular frame in China.
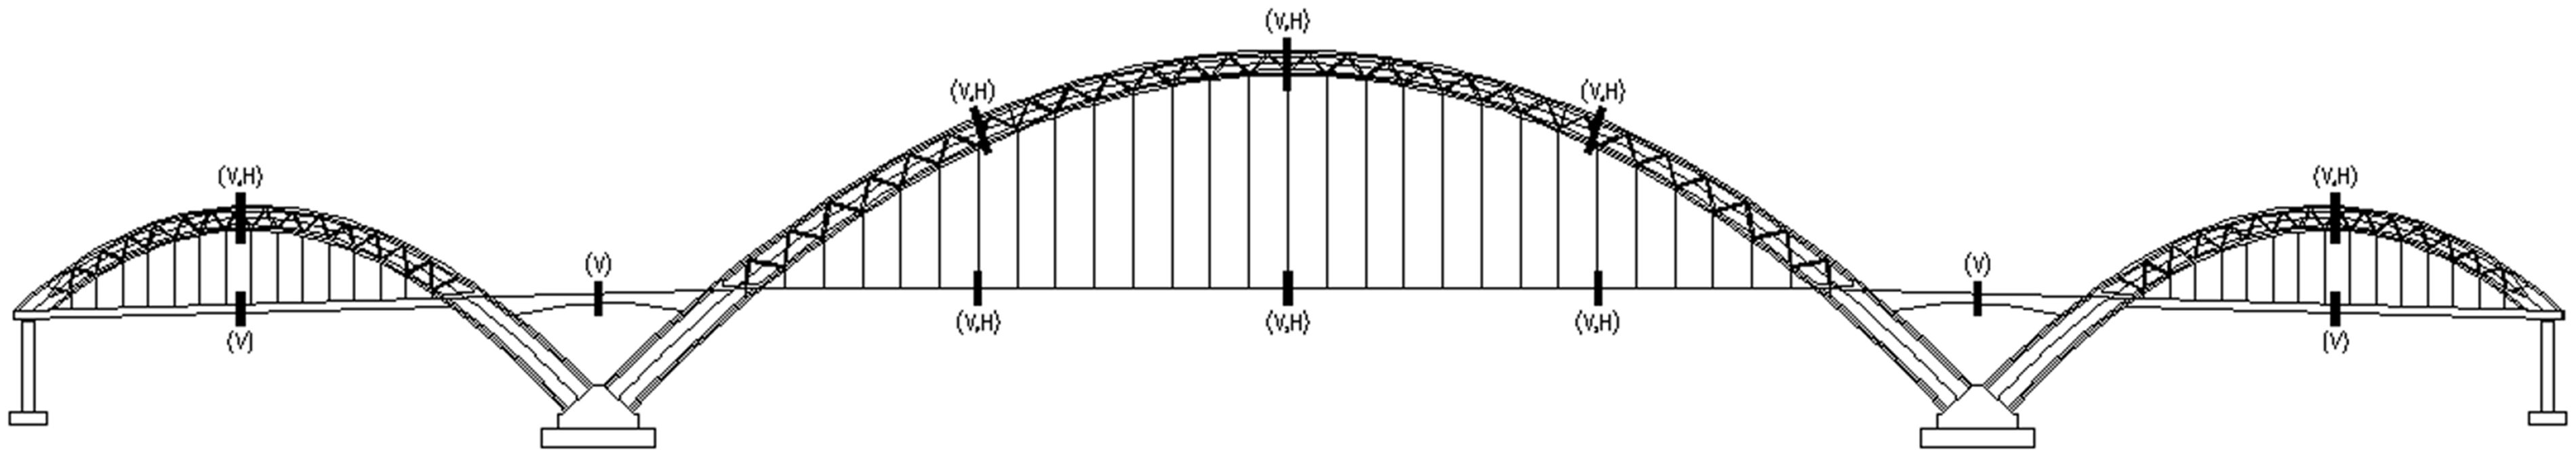
Elevation of the Xinguang Bridge with the mid span of 428 m, the two side spans of 177 m each, and the width of 37.62 m.
The monitoring period is from 1 January to 31 December of year 2014. As the operating time of sensors was set to be uniformly distributed from 00:00 to 23:59, more than one set of data can be achieved within one day. As the monitoring system requires regular maintenance, no record is measured for those maintenance days. Totally four types of data were collected for the environmental dataset: the temperature, the relative humidity, the wind velocity, and the traffic volume. Two weather sensors, located in the mid-span deck and the side-arch crown, measured the temperature and the relative humidity in the sampling time of 1 s. The average temperature T (unit: °C) and the average relative humidity H (unit: %) were achieved by averaging the corresponding measured values from the two weather sensors. Three wind sensors, located in the mid-span deck the main-arch crown, and the side-arch crown, measured the wind velocity in the sampling time of 1 s. The average wind velocity W (unit: m/s) was achieved by averaging these three measured values. Two traffic volume cameras, located in the upstream and downstream traffic lanes, measured the number of vehicles passing through the bridge within 5 min. The traffic volume Tr (unit: no. of vehicles) was achieved by summing up the cumulative number of vehicles of the three upstream traffic lanes and the three downstream traffic lanes. Figure 2 shows these four environmental factors of the Xinguang Bridge of year 2014. Forty accelerometers were installed and the corresponding locations of one side of the bridge are shown in Figure 1. Note that ‘V’ and ‘H’ represent the vertical and horizontal directions of the sensors, respectively. The measured sampling frequency is 76.8 Hz, while the adjustable measured time spans are 120×n s with n ranging from 1 to 10 for different measured times and days. The data-driven random subspace method is used to identify the modal frequency of the structure.
52
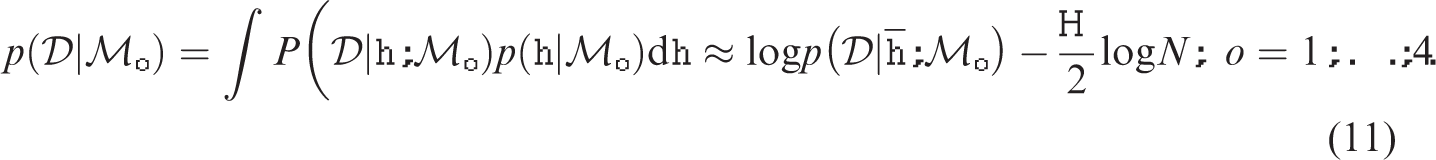
In this study, the first and second modal frequencies (
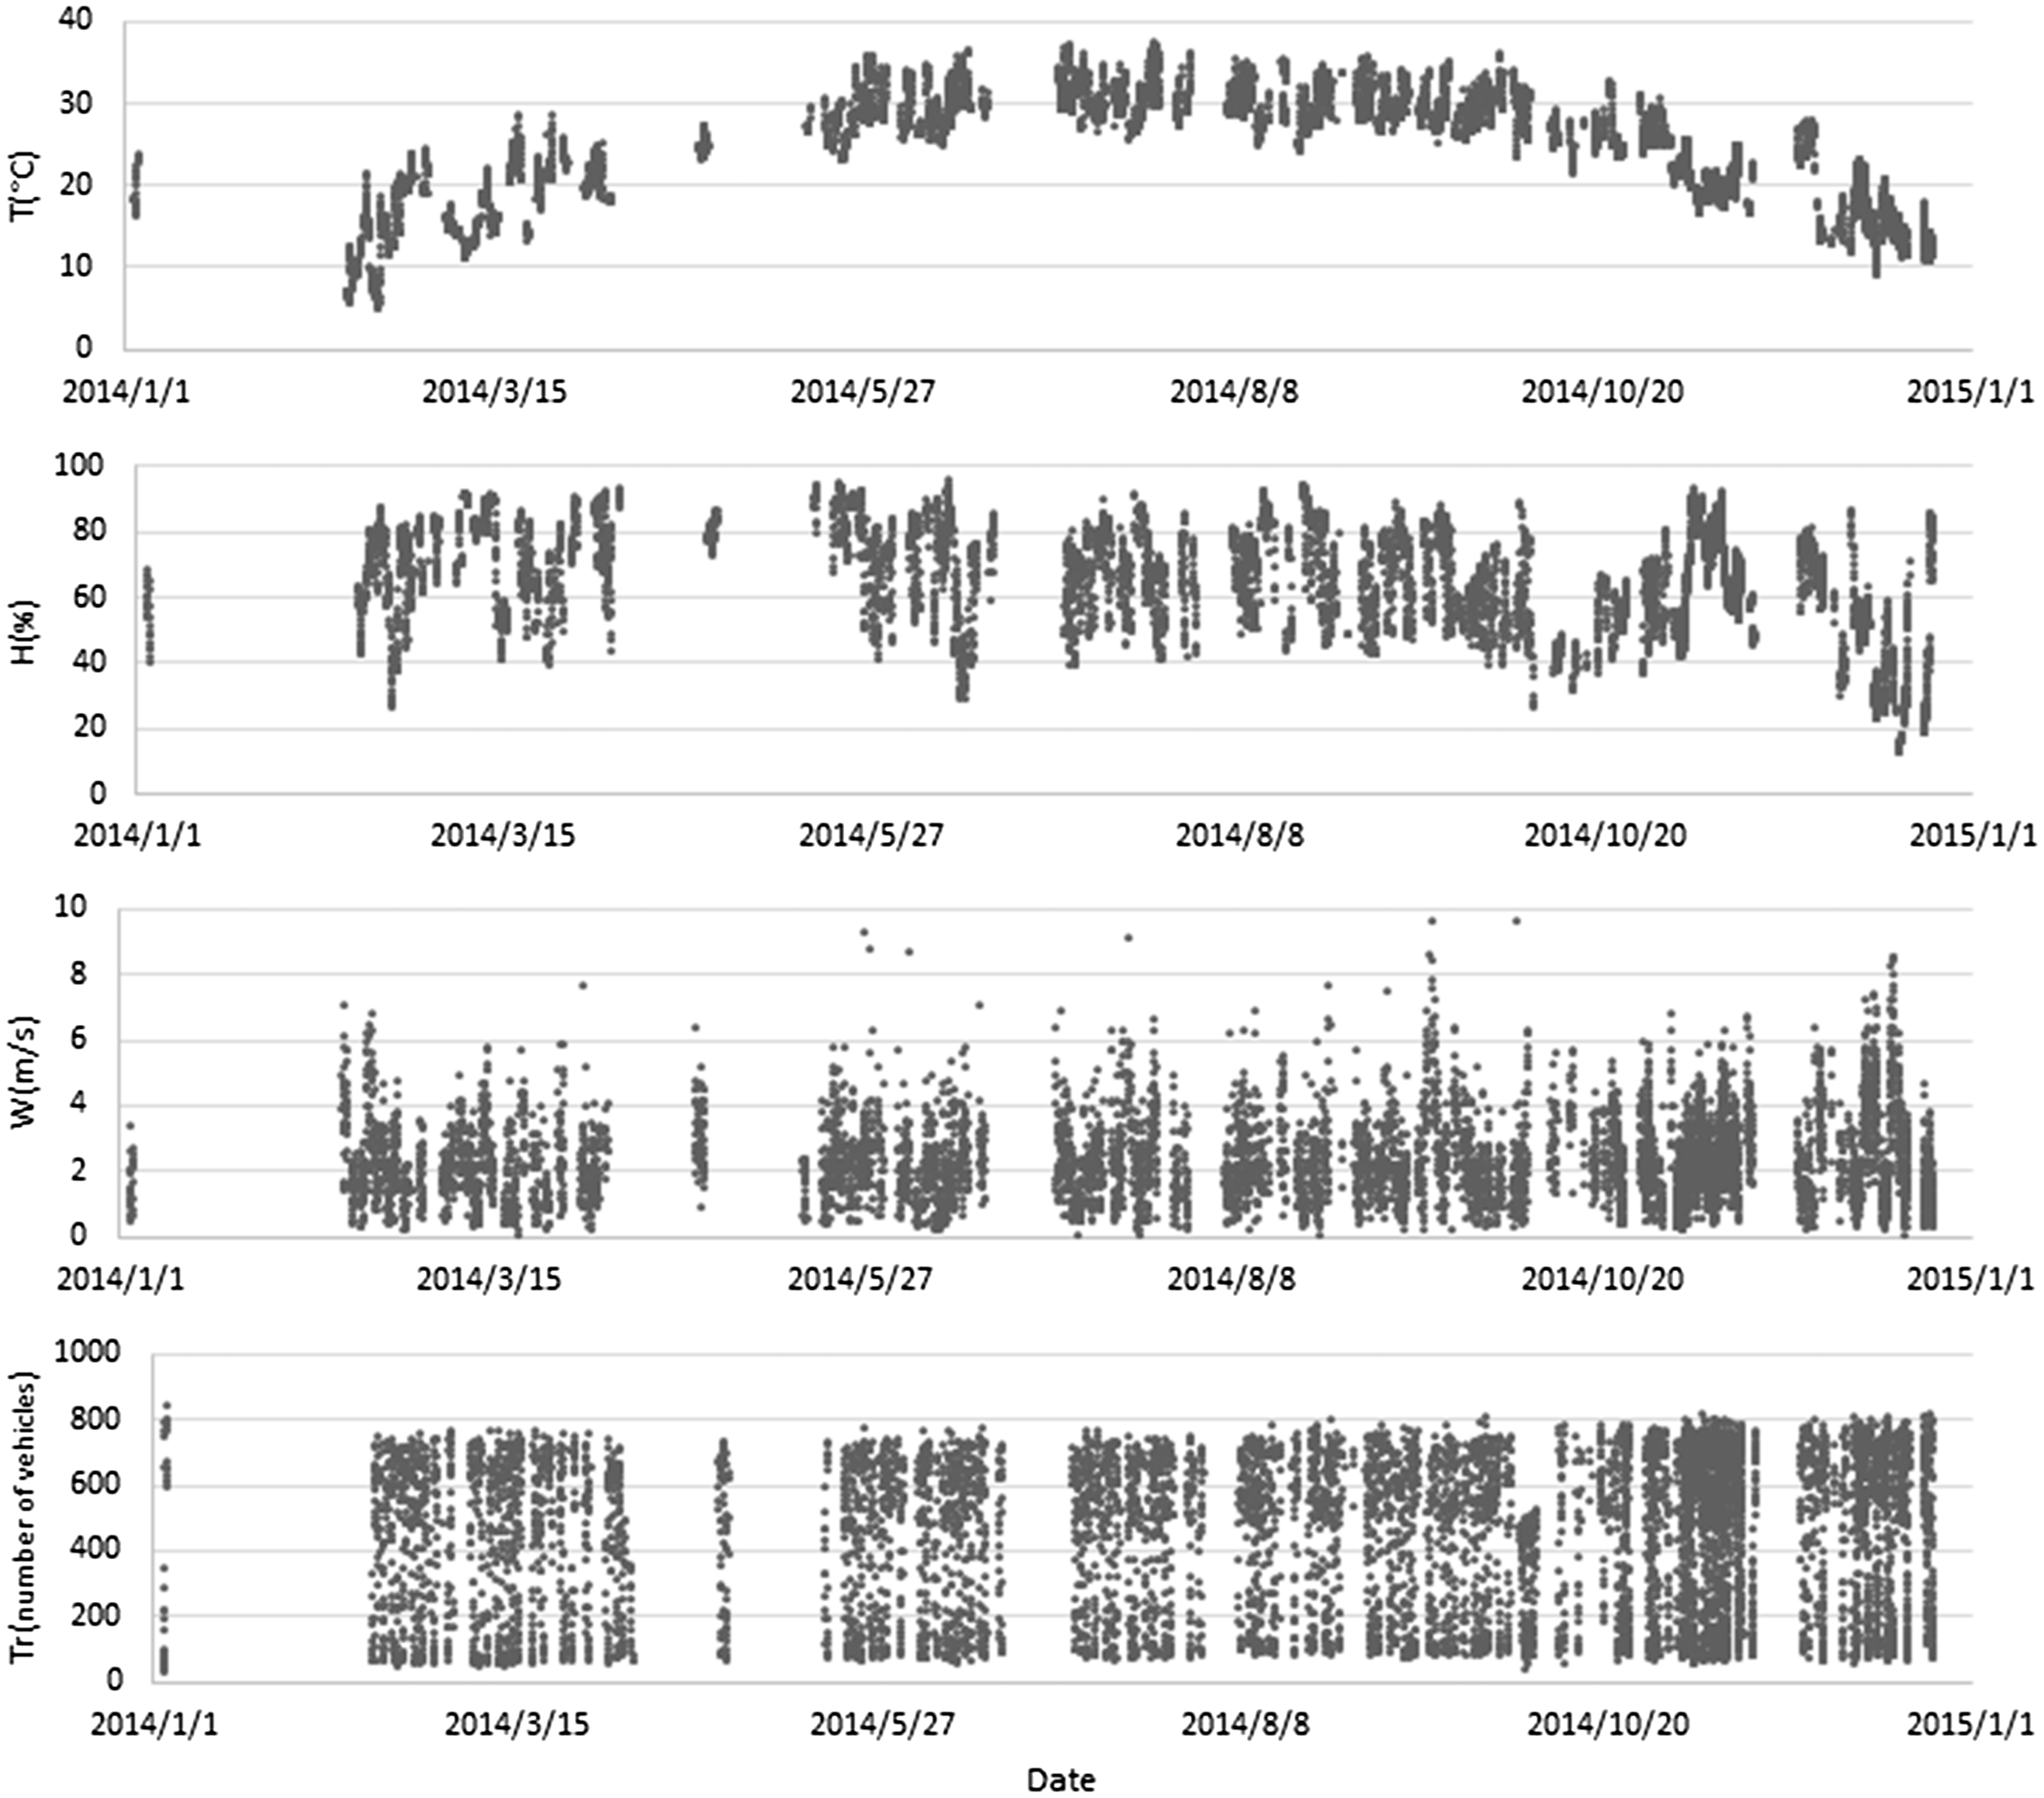
The temperature, relative humidity, wind speed and traffic volume of the Xinguang Bridge of year 2014.
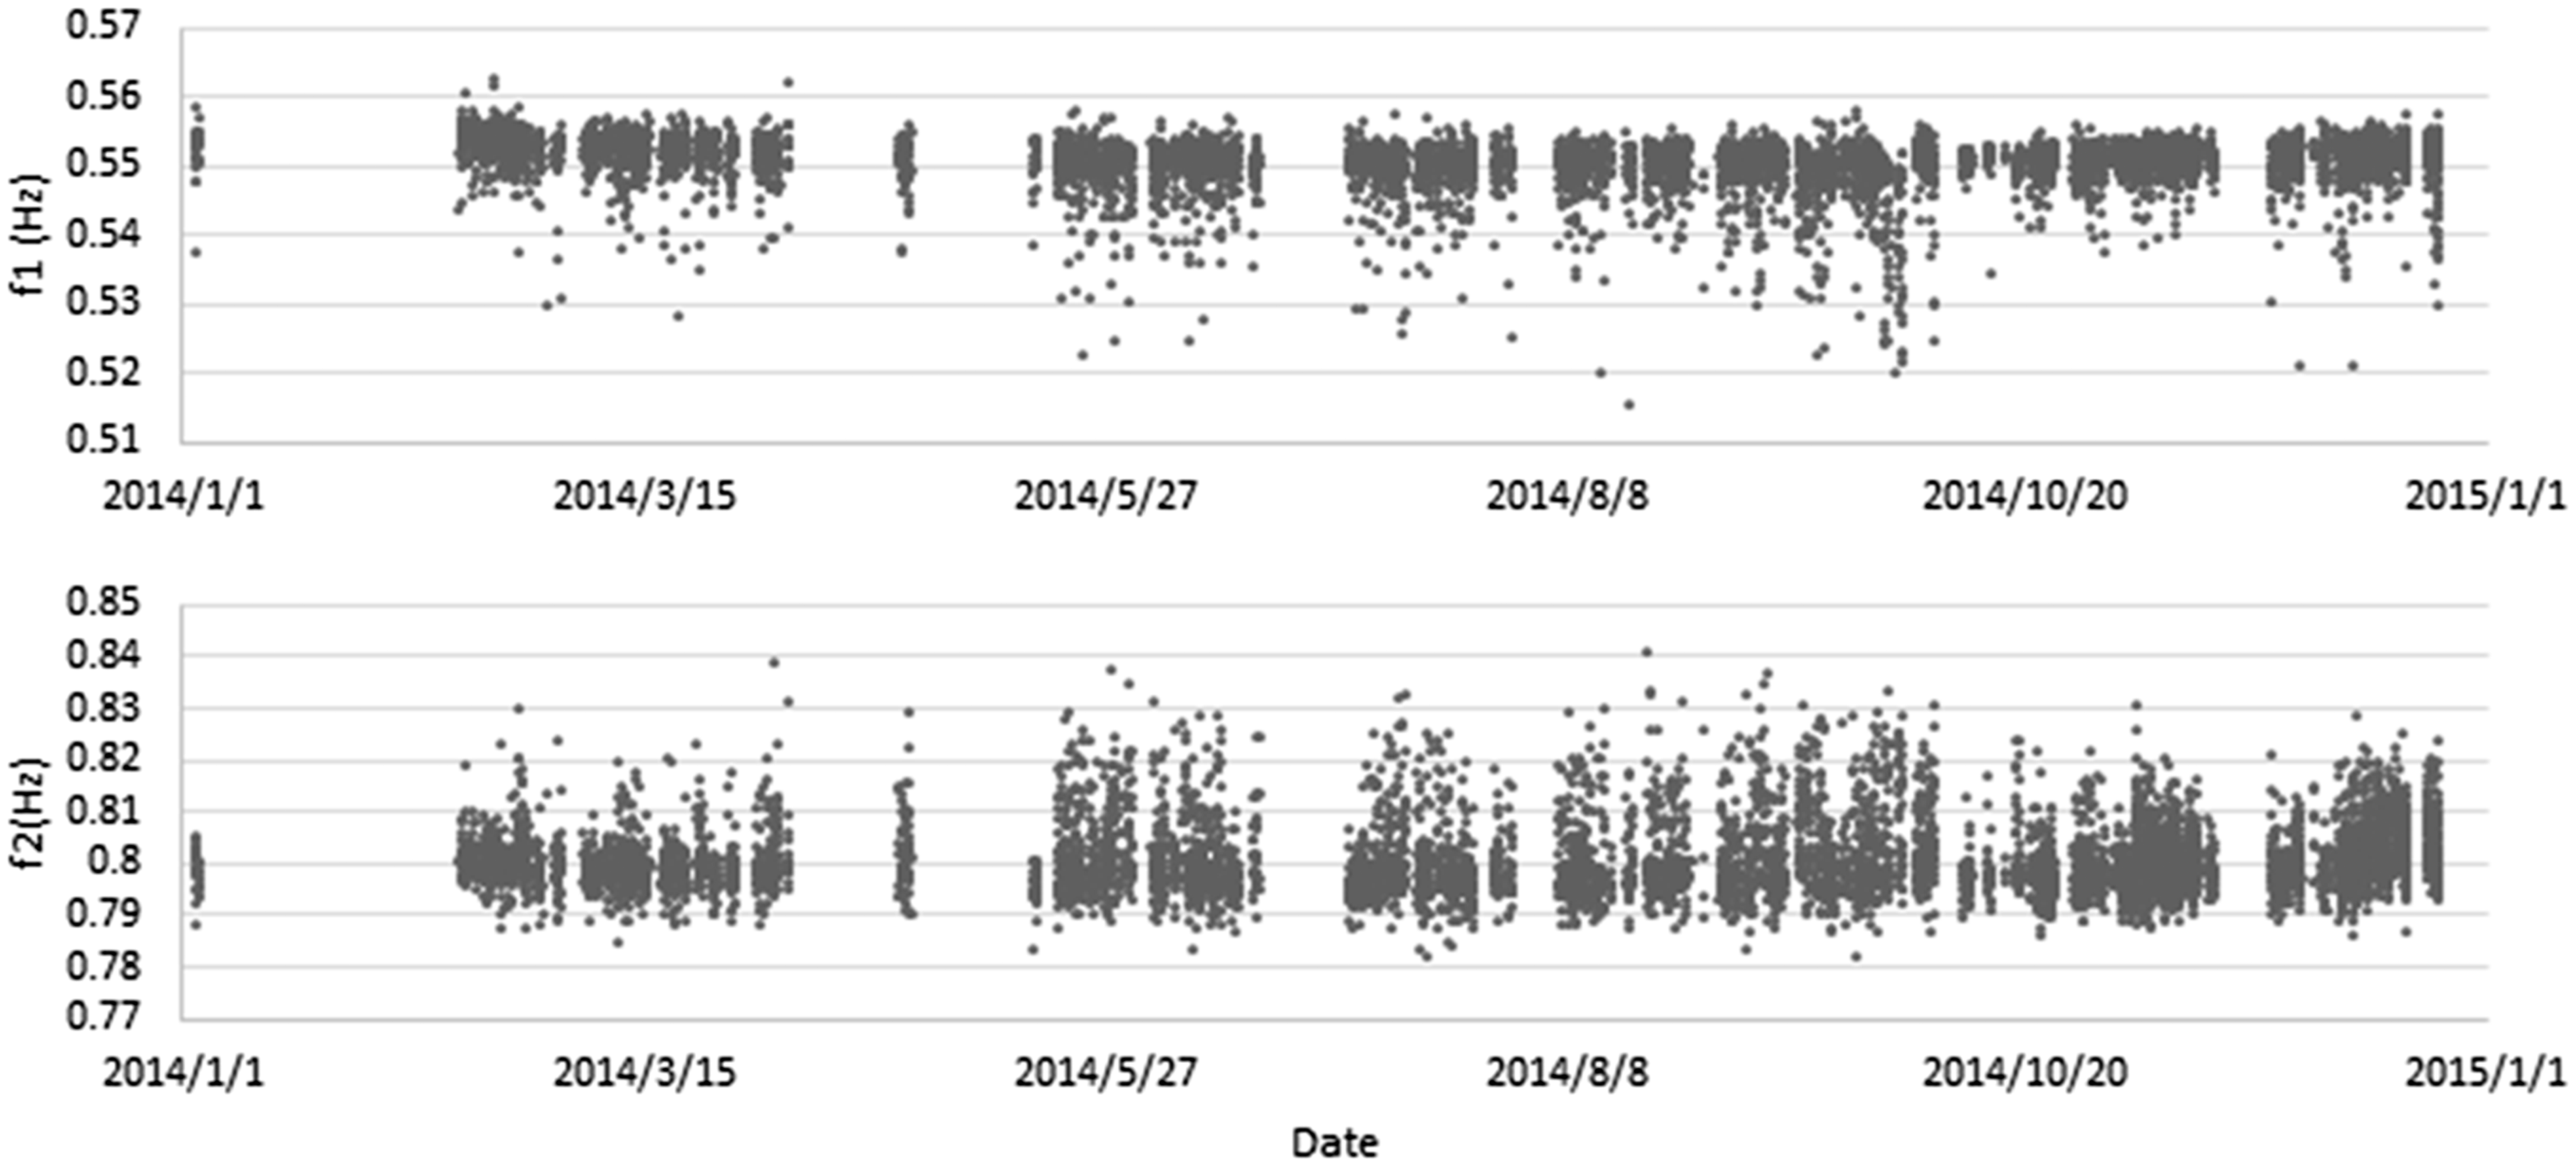
The first and second modal frequencies of the vertical mode of the Xinguang Bridge of year 2014.
A BN is a directed acyclic graphical (DAG) model, which is a graphical representation of the statistical relation between a set of random variables
In modal frequency–multiple environmental factors pattern recognition, six nodes are required for six measured variables:
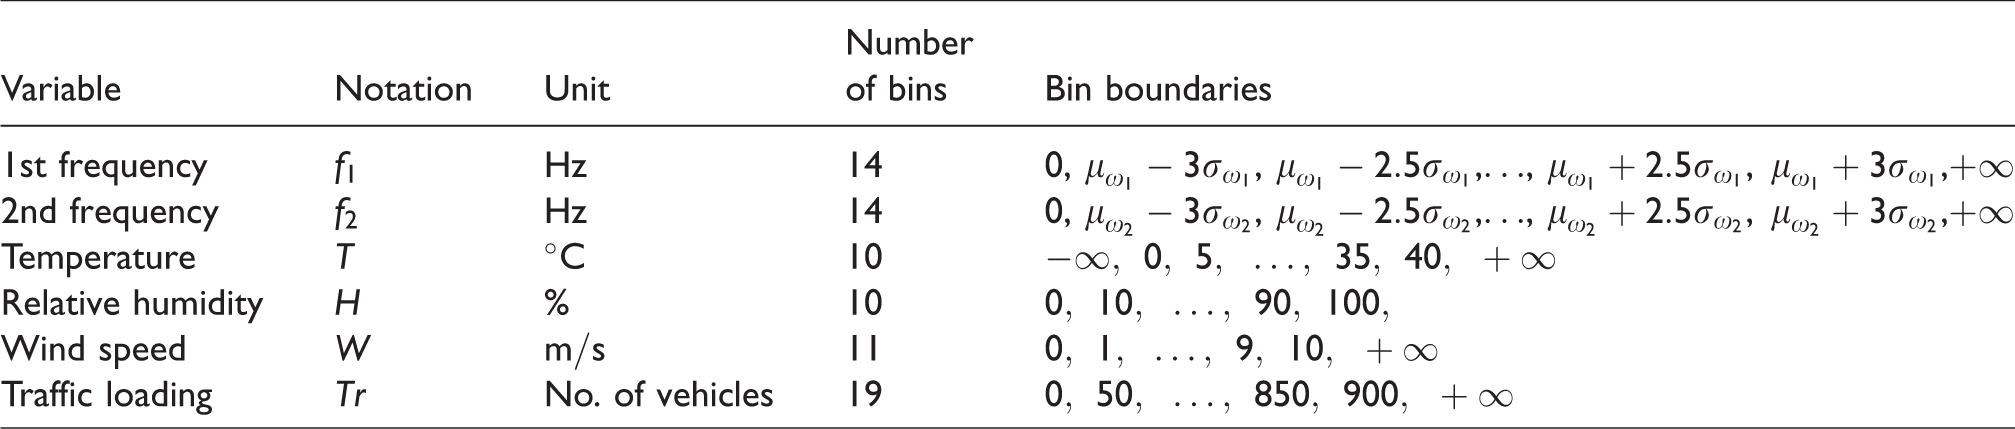
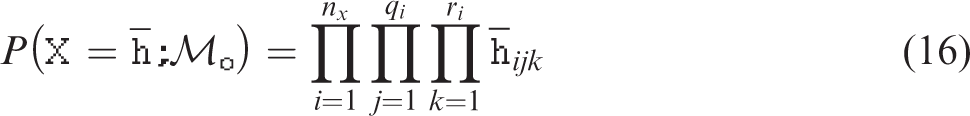
Discretization of data.
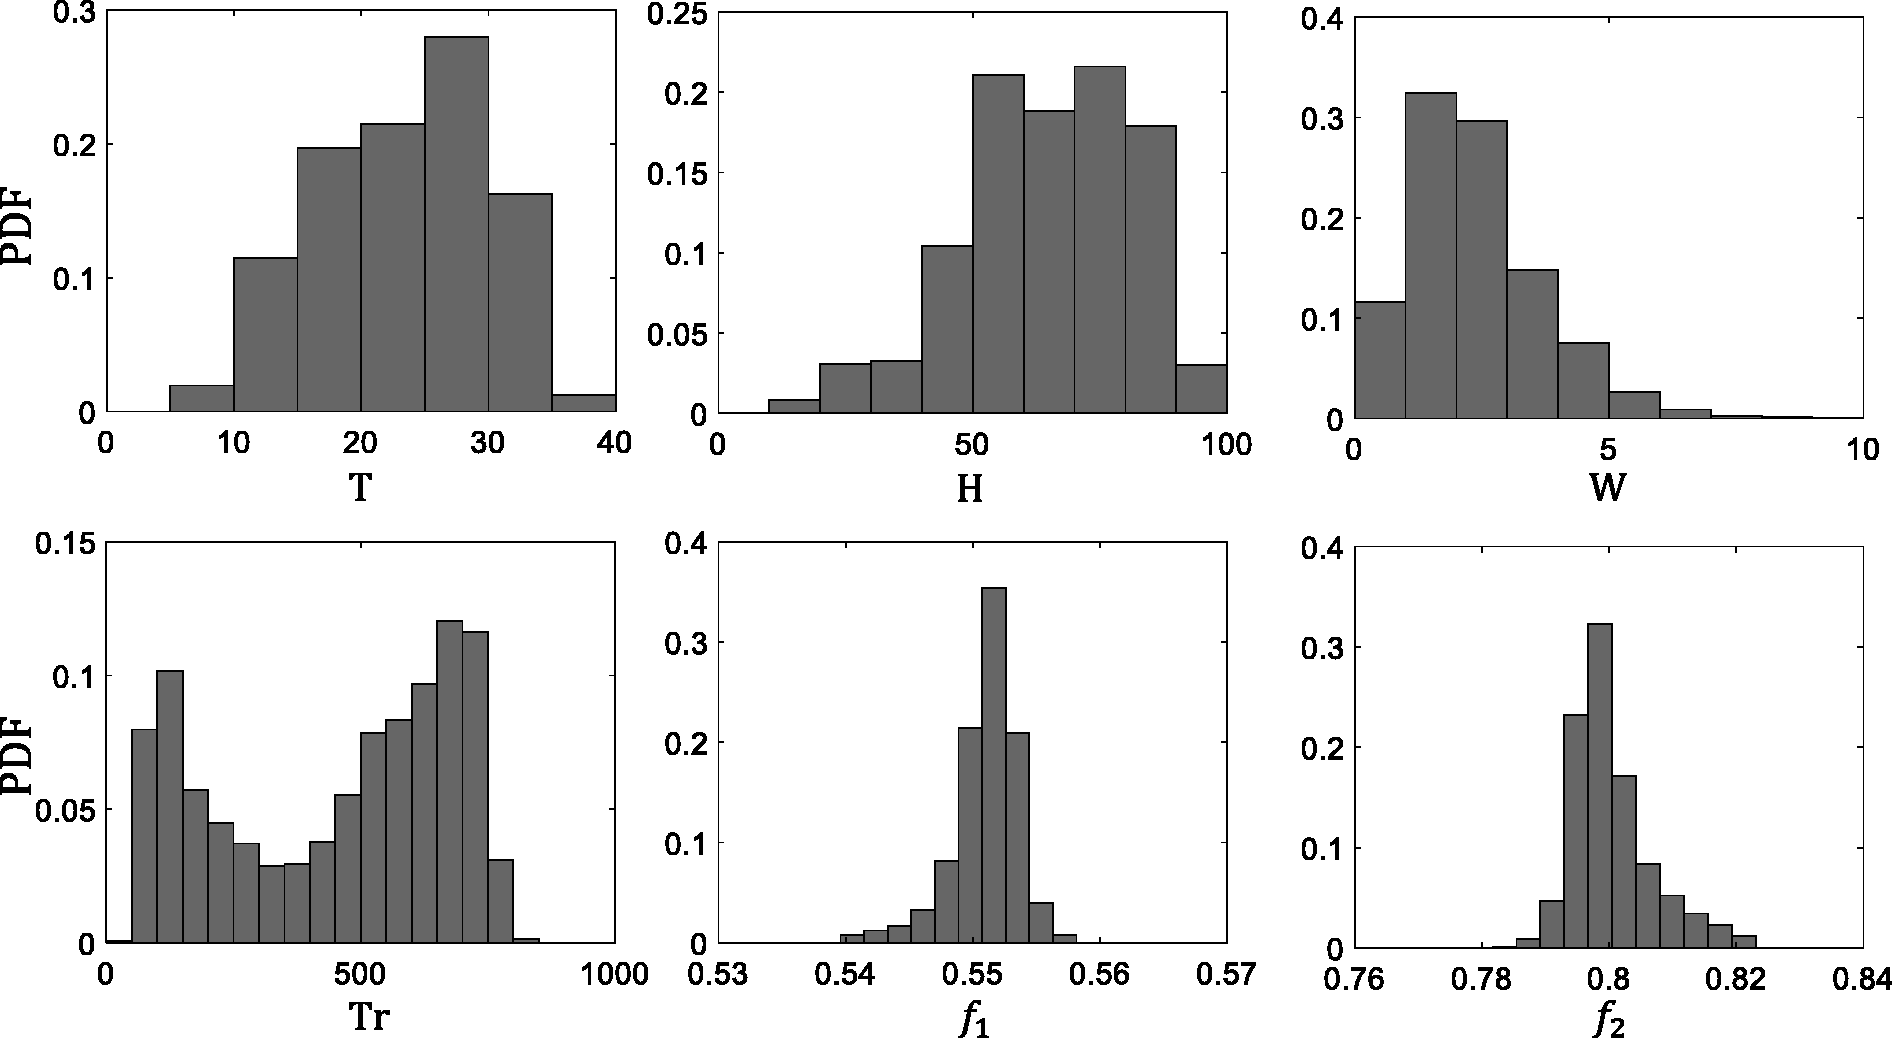
Data histograms of different nodes.
Figure 5 shows the proposed candidates of network structure for modal frequency–multiple environmental factors pattern recognition. The candidates are proposed as follows: (1) Candidates
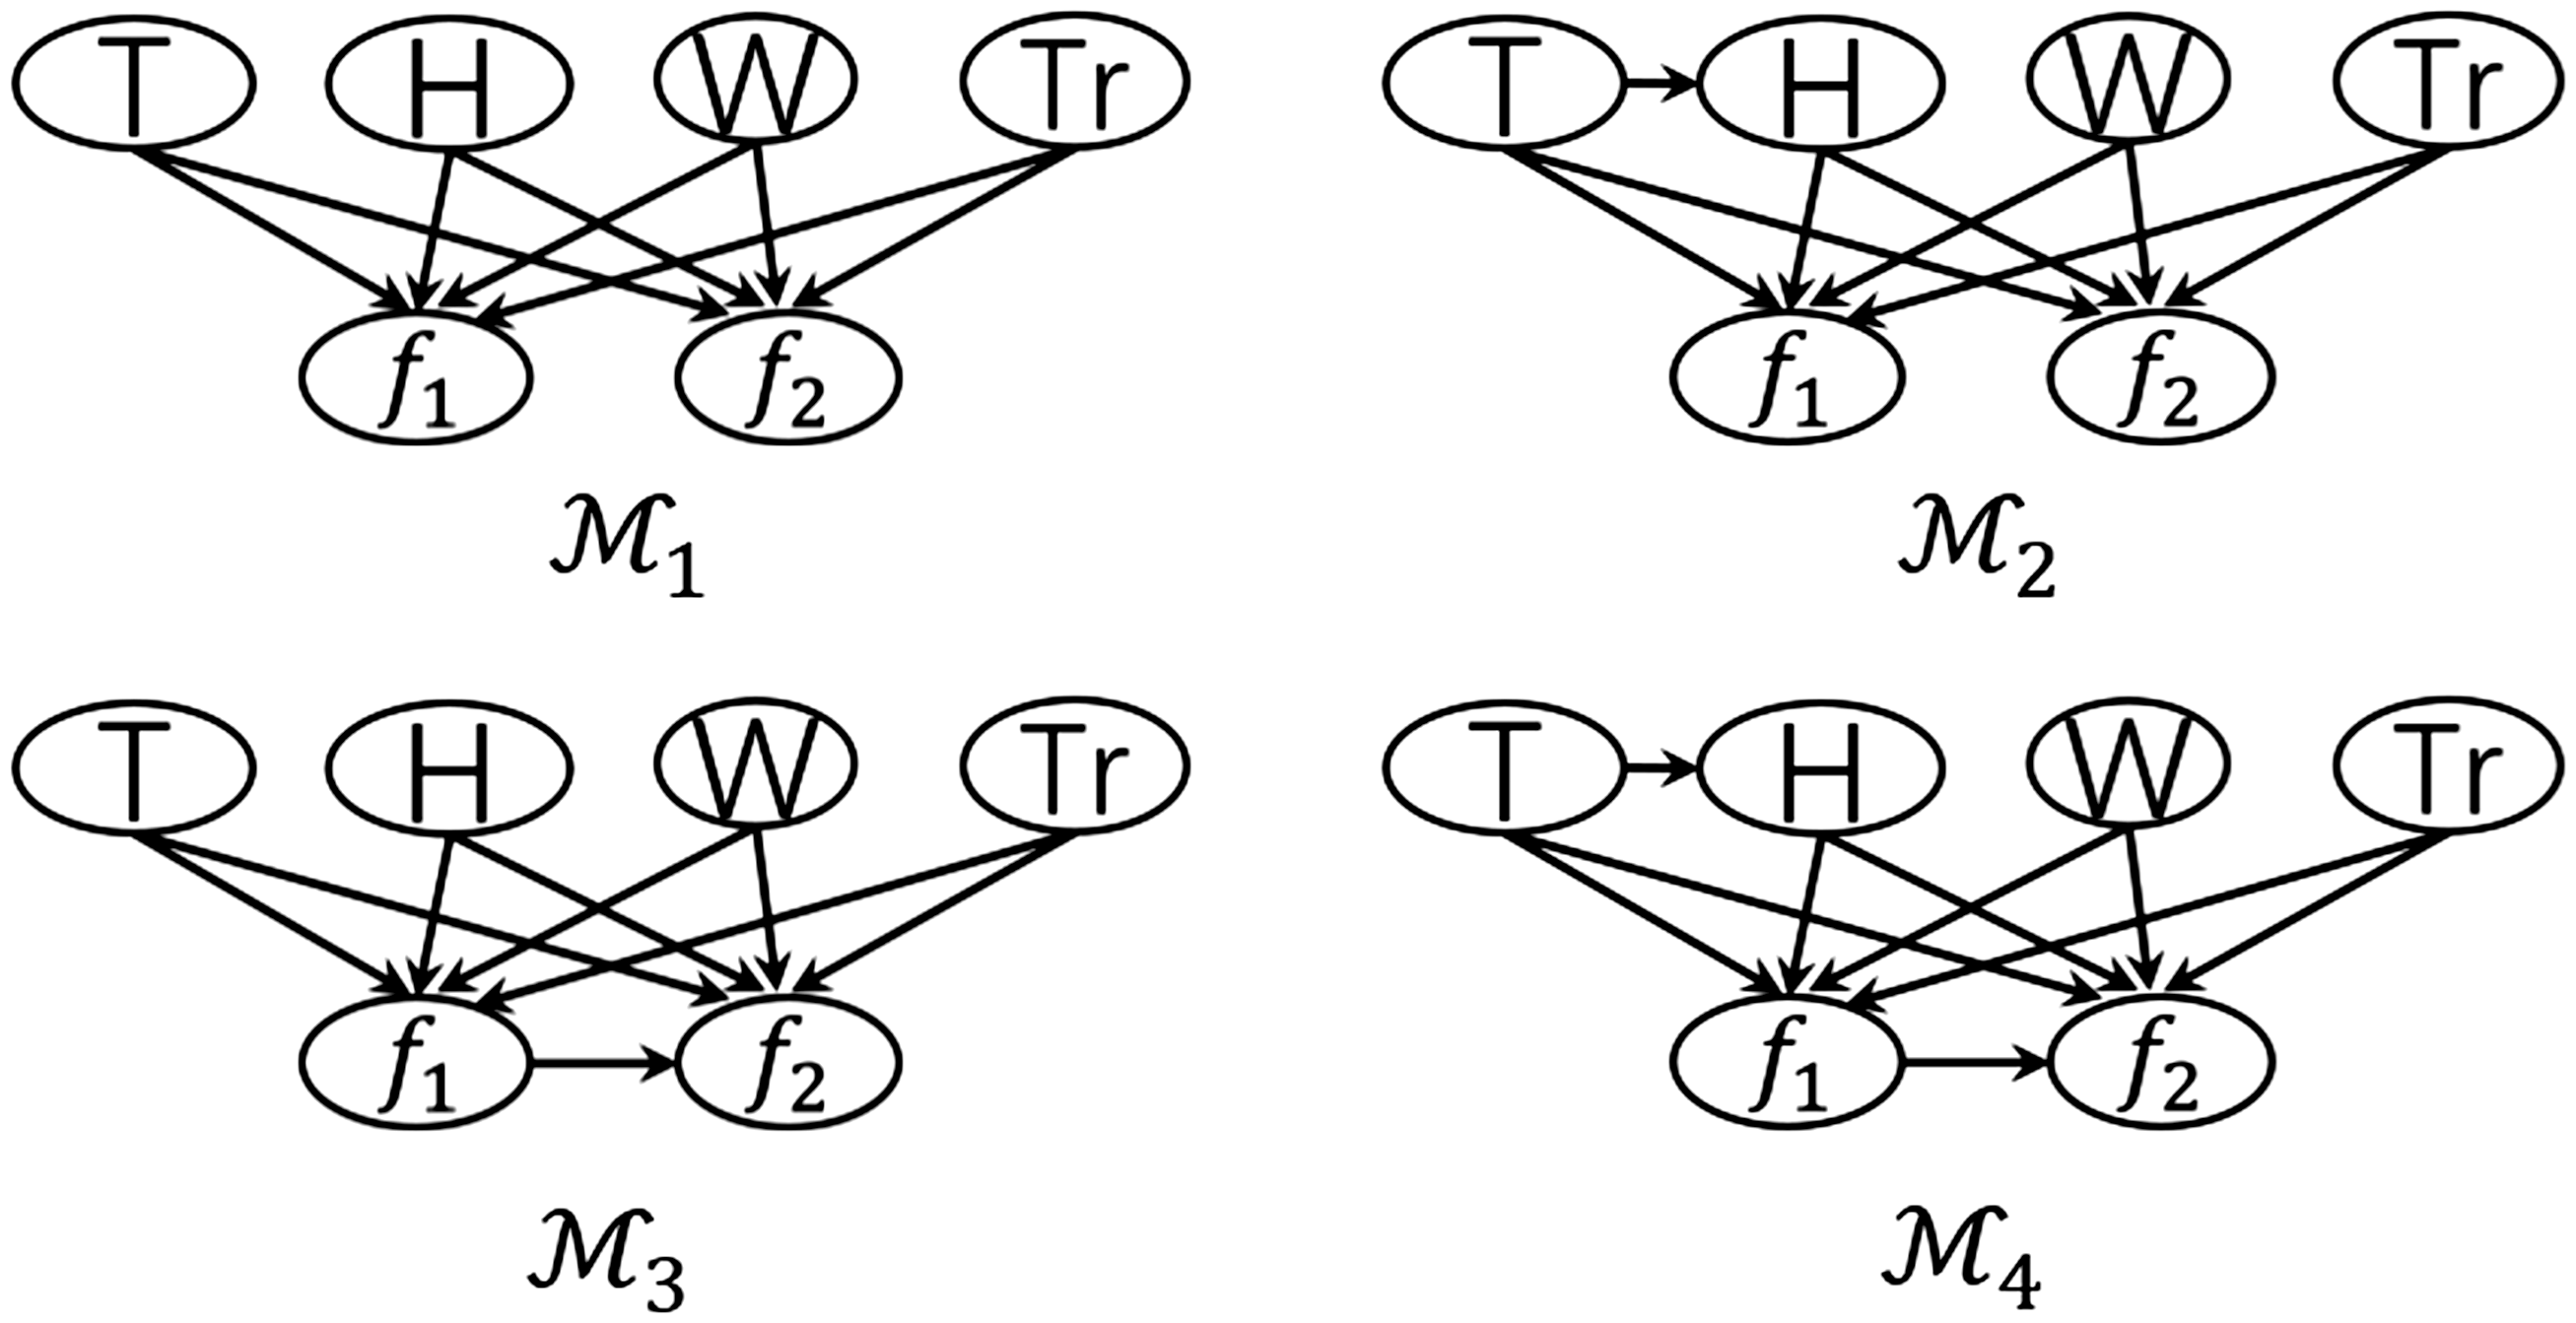
Proposed candidates of network structure for modal frequency–multiple environmental factors pattern recognition.
BN-based pattern recognition
Learning phase
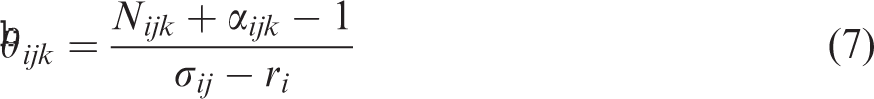
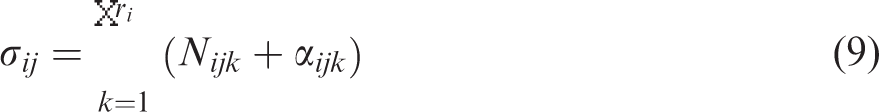
Let 
The product Dirichletian distribution, the conjugate prior with global and local independence,
53
is introduced
Finally, the posterior distribution can be obtained by Bayes’ theorem

In order to select the most plausible network structure, Bayesian probability is utilized as the relative plausibility measure of the aforementioned four candidates 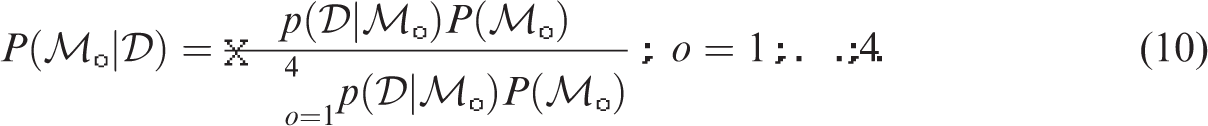

Prediction phase
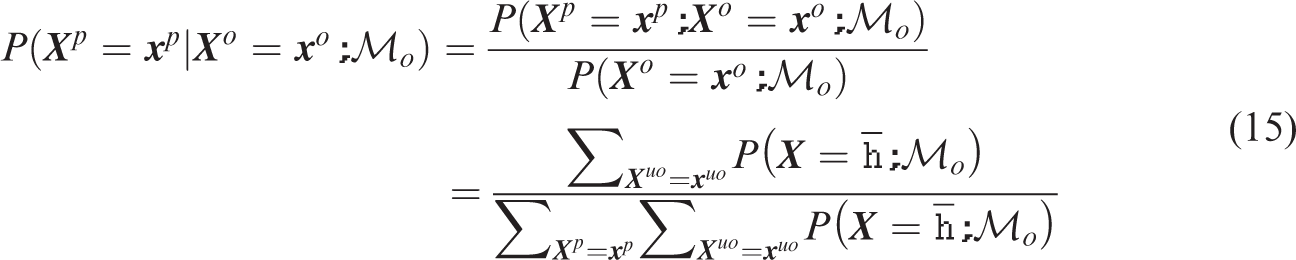
In the case of complete observation information, given a full-observed sample 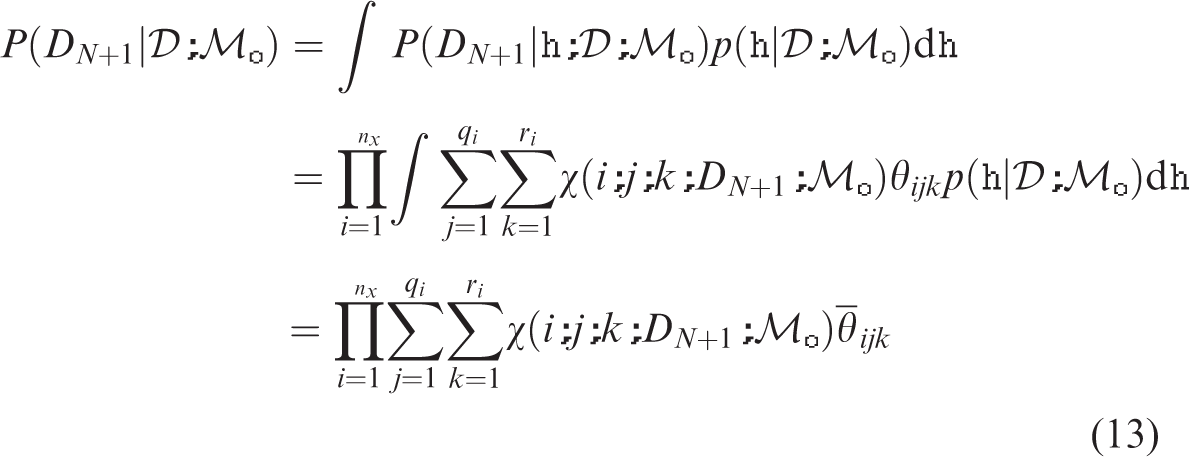
In contrast to the traditional inference requiring complete information of observation, the BN is capable to make prediction on the target node with incomplete observed information of other nodes. That is, without knowing the unobserved node 
The above conditional probability can be factorized as
Pattern recognition results
Table 2 shows BIC and probability results of different proposed candidates of network structure. The probability of the most plausible network structure
BIC and probability results of different proposed candidates of network structure.
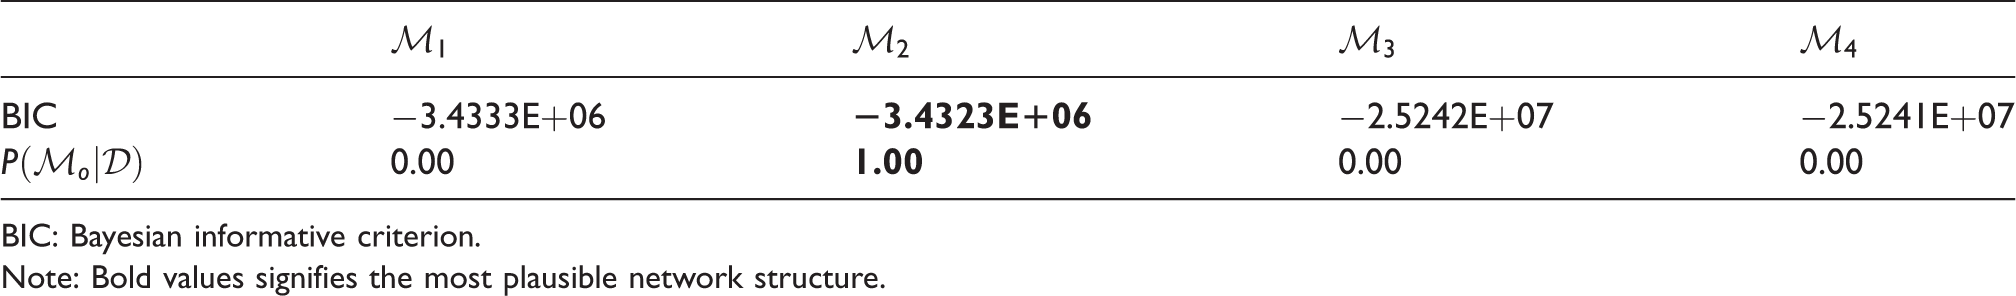
BIC: Bayesian informative criterion.Note: Bold values signifies the most plausible network structure.
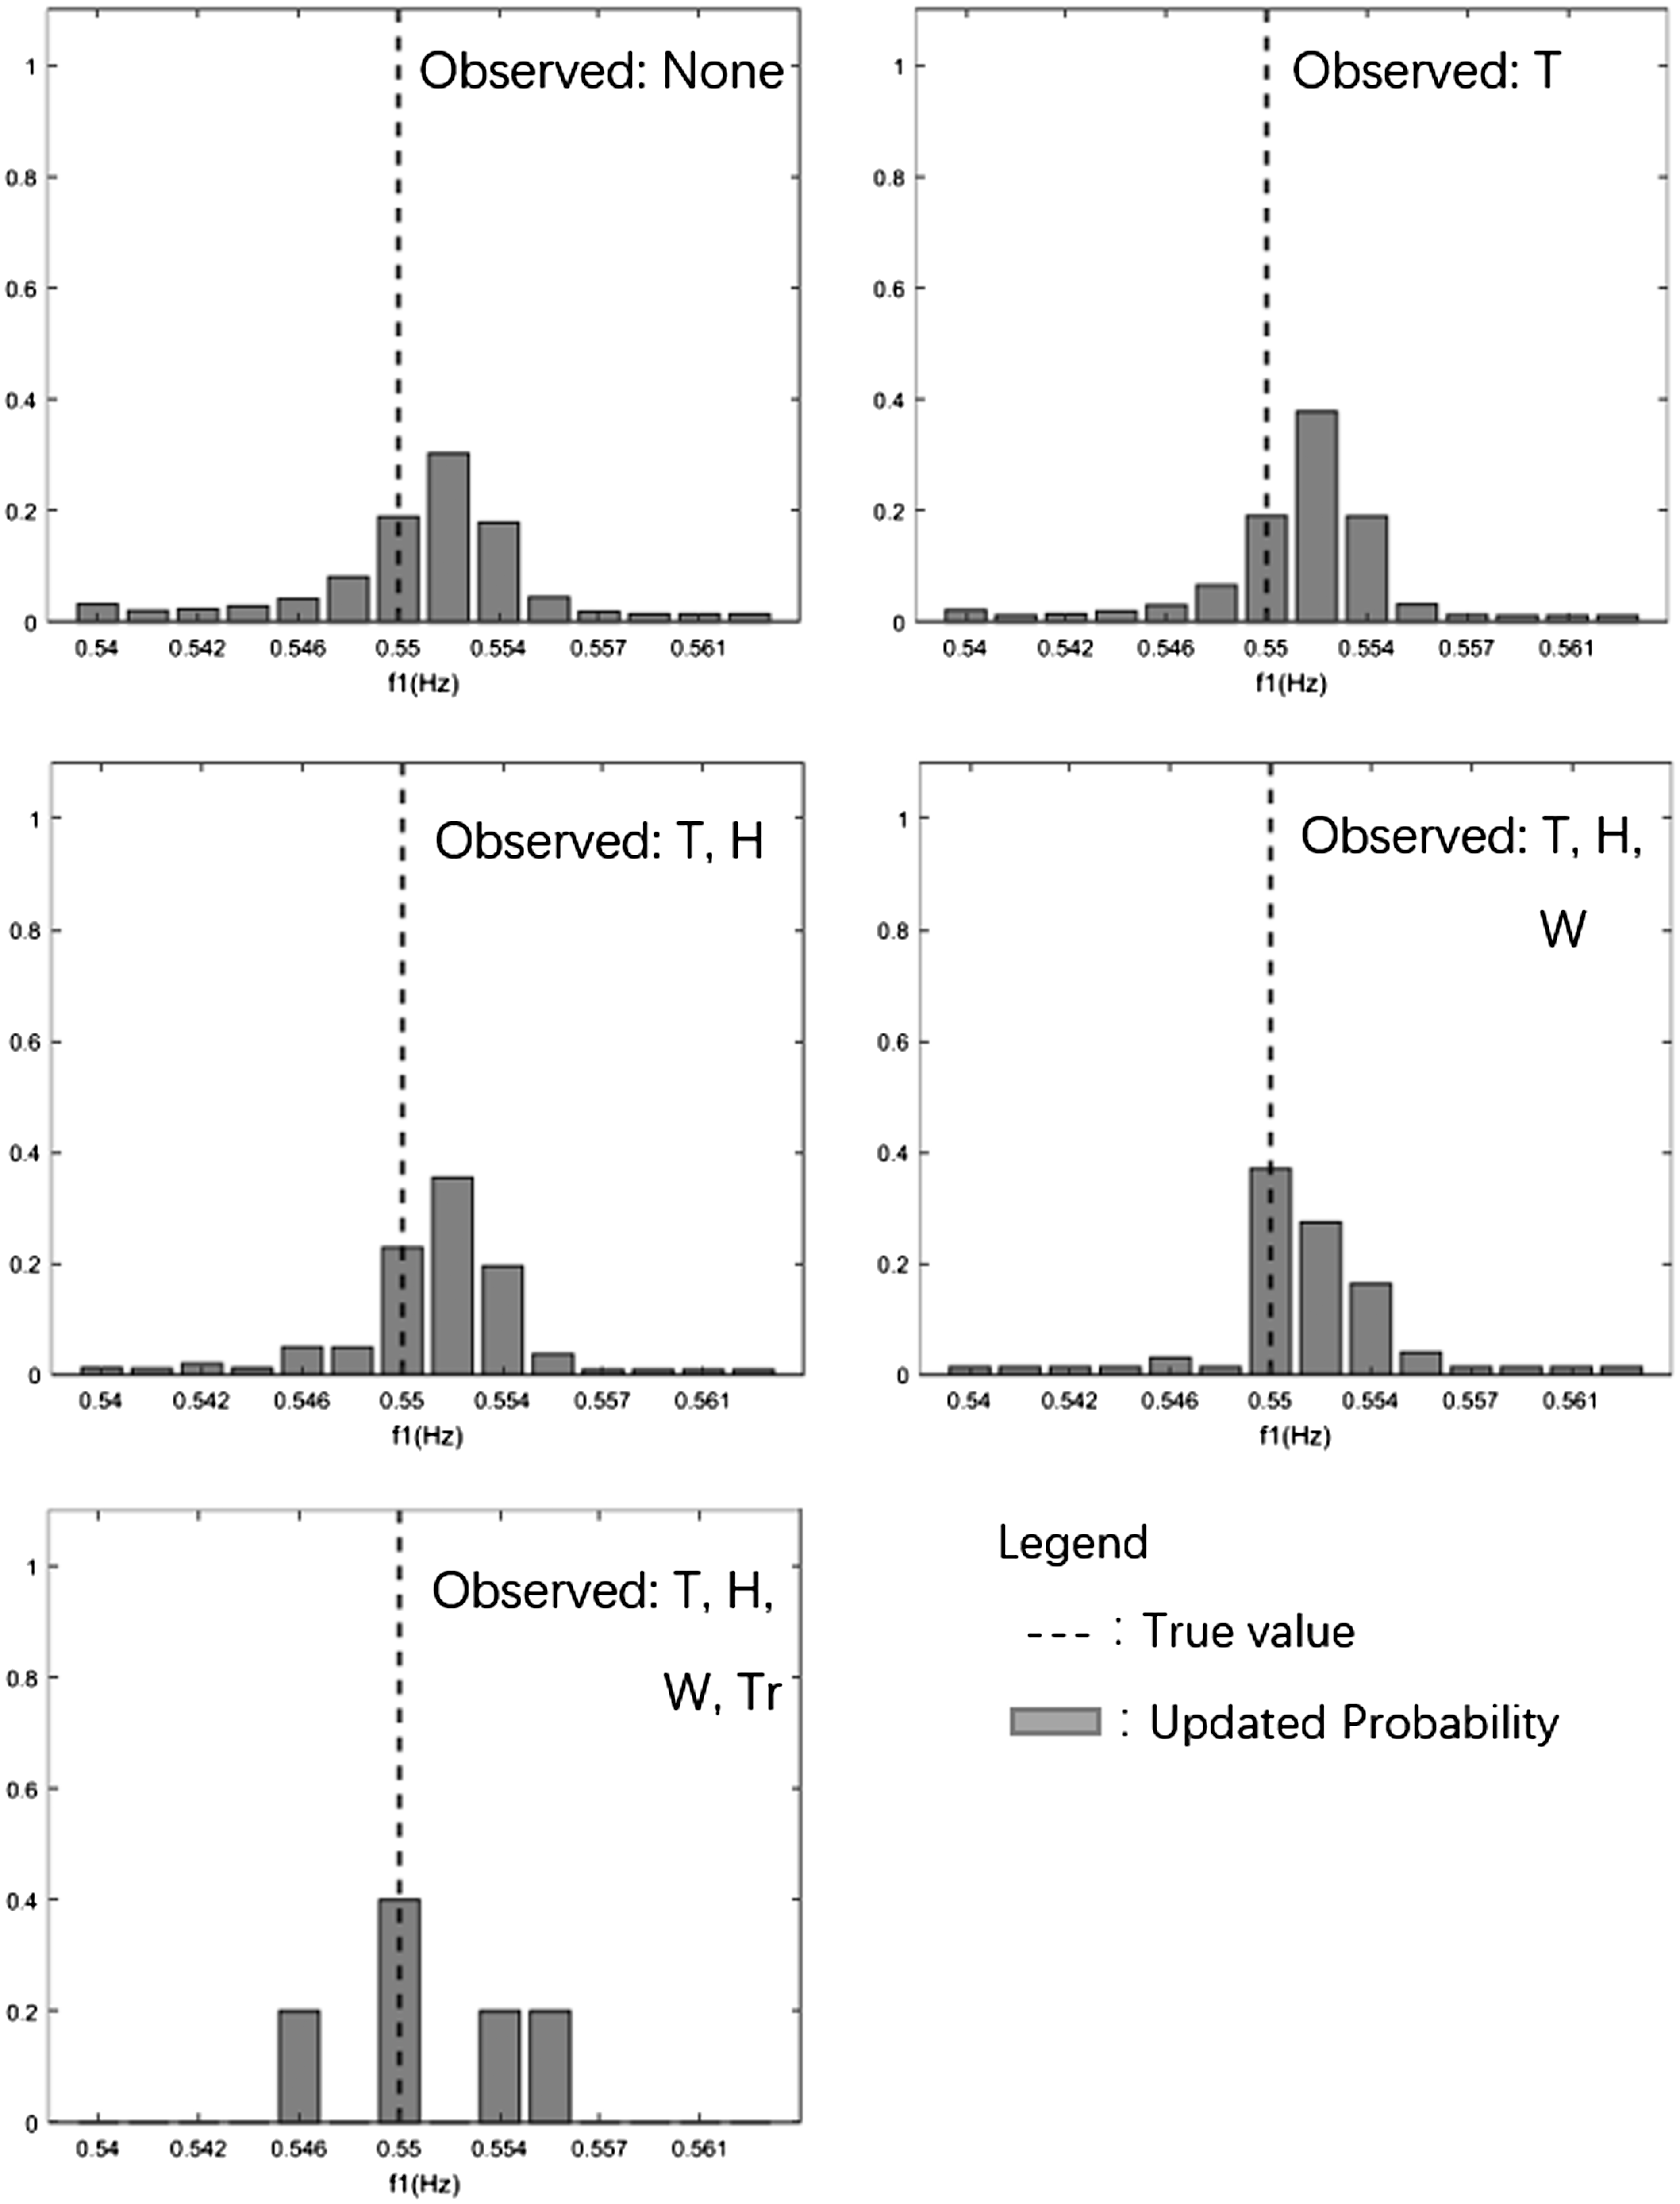
Predicted histogram of
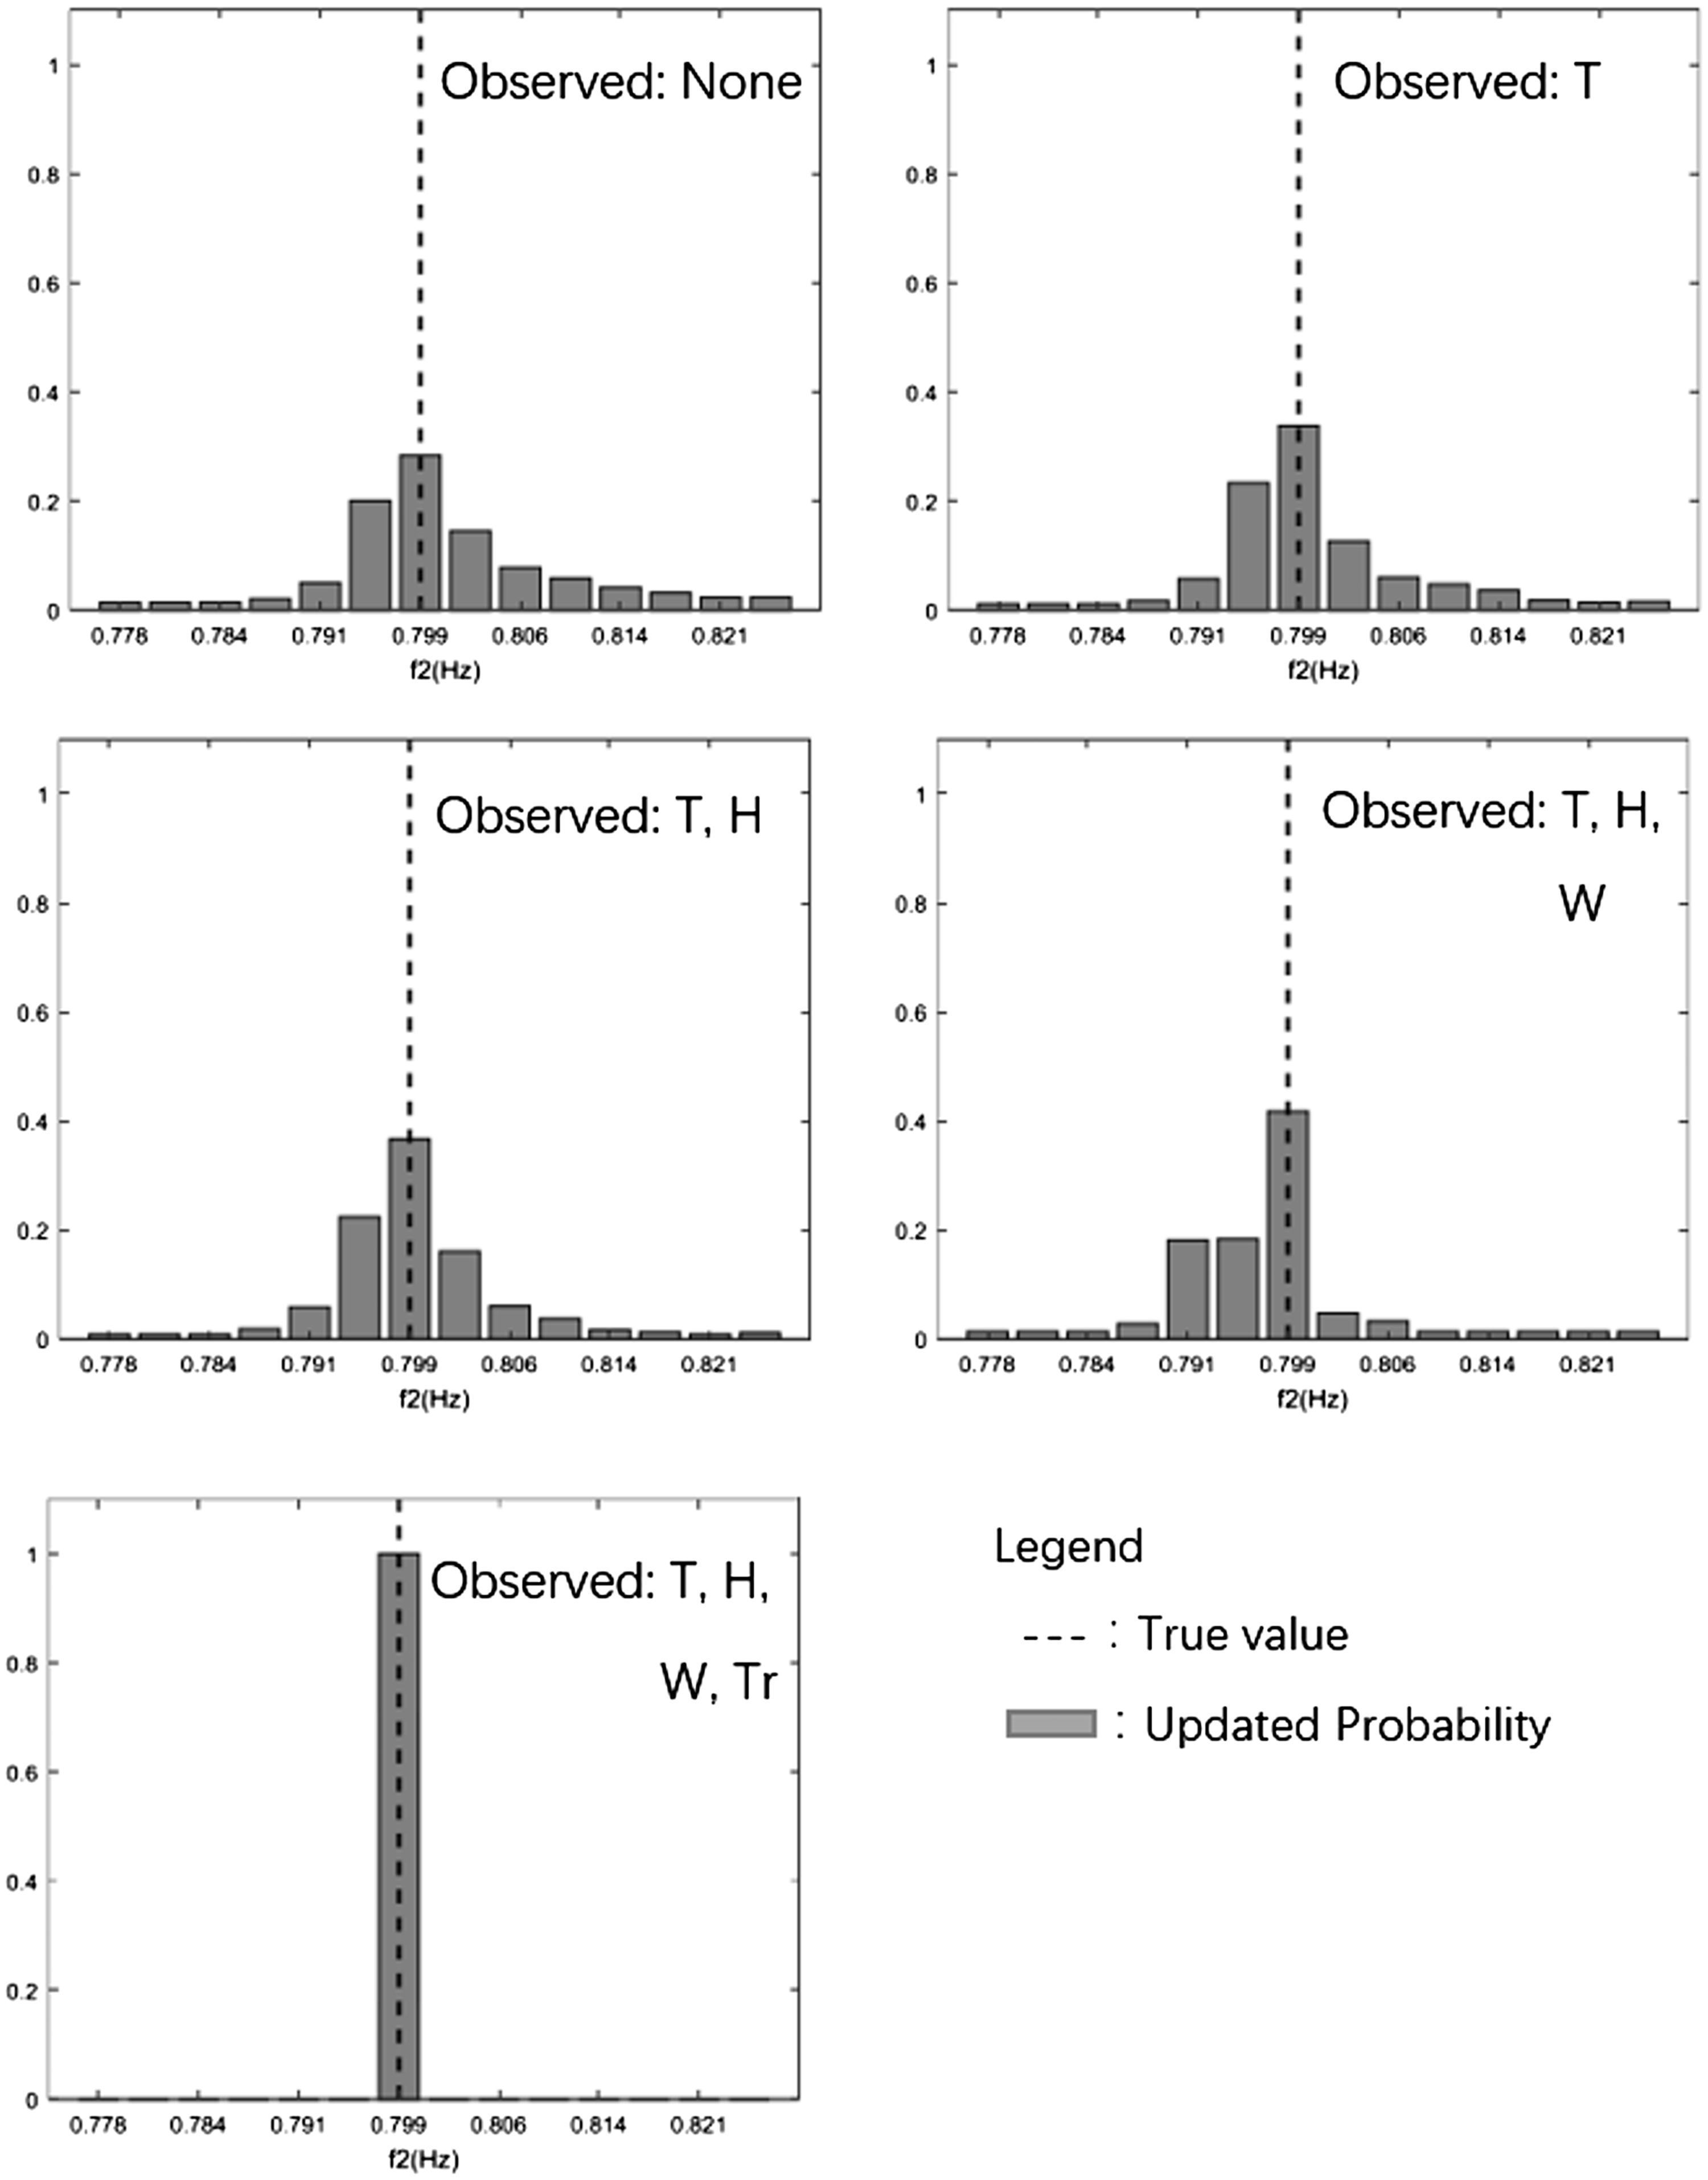
Predicted histogram of
In order to compare the prediction capability of different network structure candidates, prediction capability tests are implemented. Table 3 shows root-mean-square errors (RMSEs) on predicted frequencies with different training and test data. Three cases with different training data, test data, and data incompleteness are considered. Case I: The training data and test data are both the full observation dataset (the original dataset with 7811 points). Case II: The training data and test data are both the full observation dataset, but each test point is randomly selected to be an incomplete point with some probability. An incomplete point means that each component of the four environmental factors is with some probability to be ‘missing’, so the ‘missing’ component will not be utilized in frequency prediction. Here, the probability of random incompleteness is 0.05, and for a selected incomplete point, each component of the four environmental factors (T, H, W, Tr) is with 1/3 probability to be ‘missing’. Case III: The training data and test data are constructed using leave-one-out cross validation. That is, for each implementation, one point is selected as the test data, while the remaining points are the training data. Random incompleteness is considered in this case as that in Case II. From Table 3, it is obvious that the optimal network structure
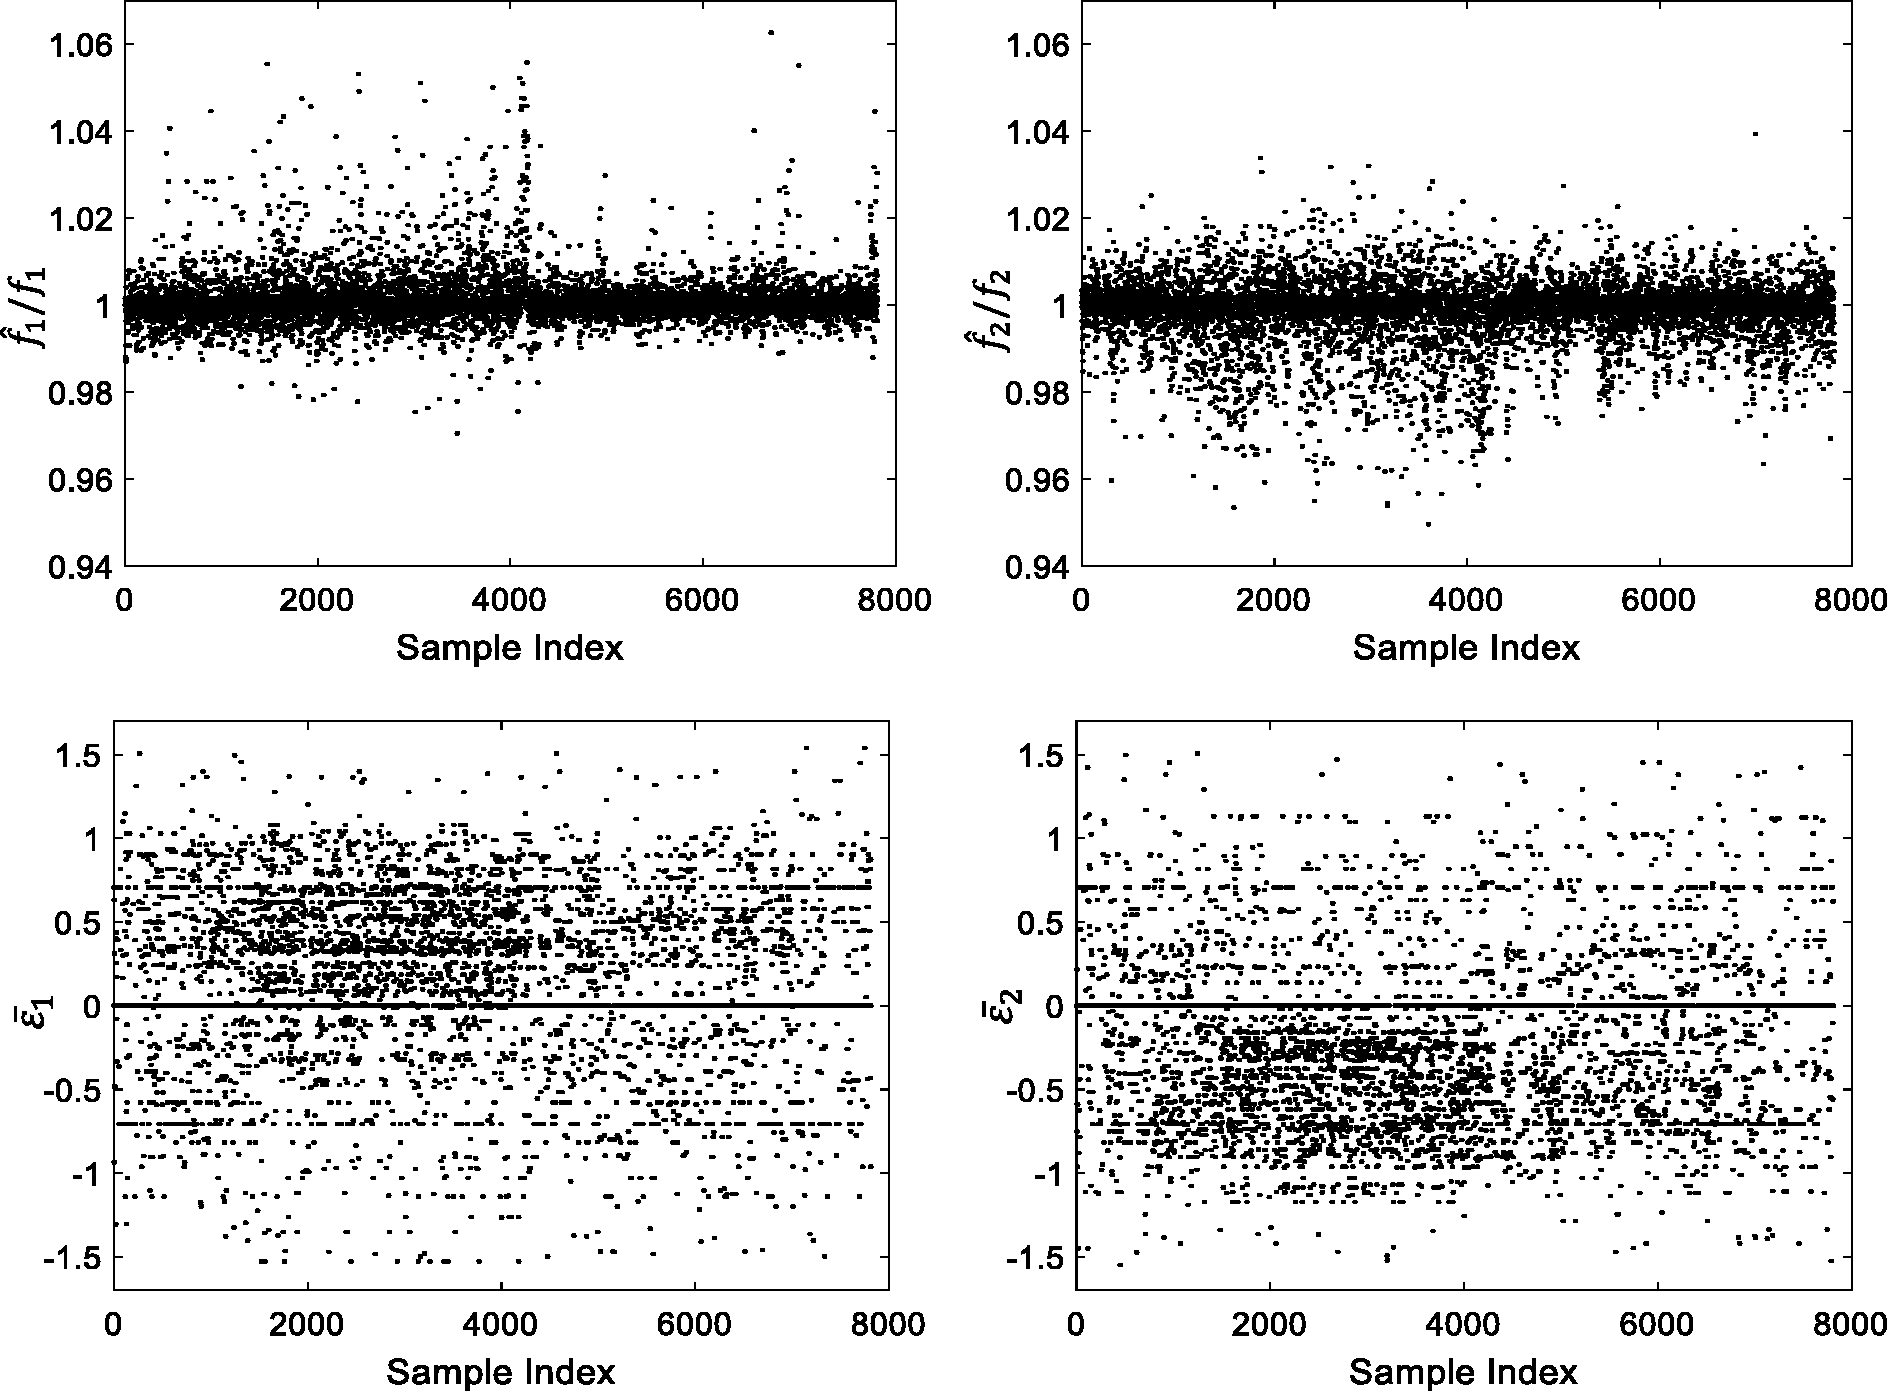
Predicted to measured ratios and normalized residuals by
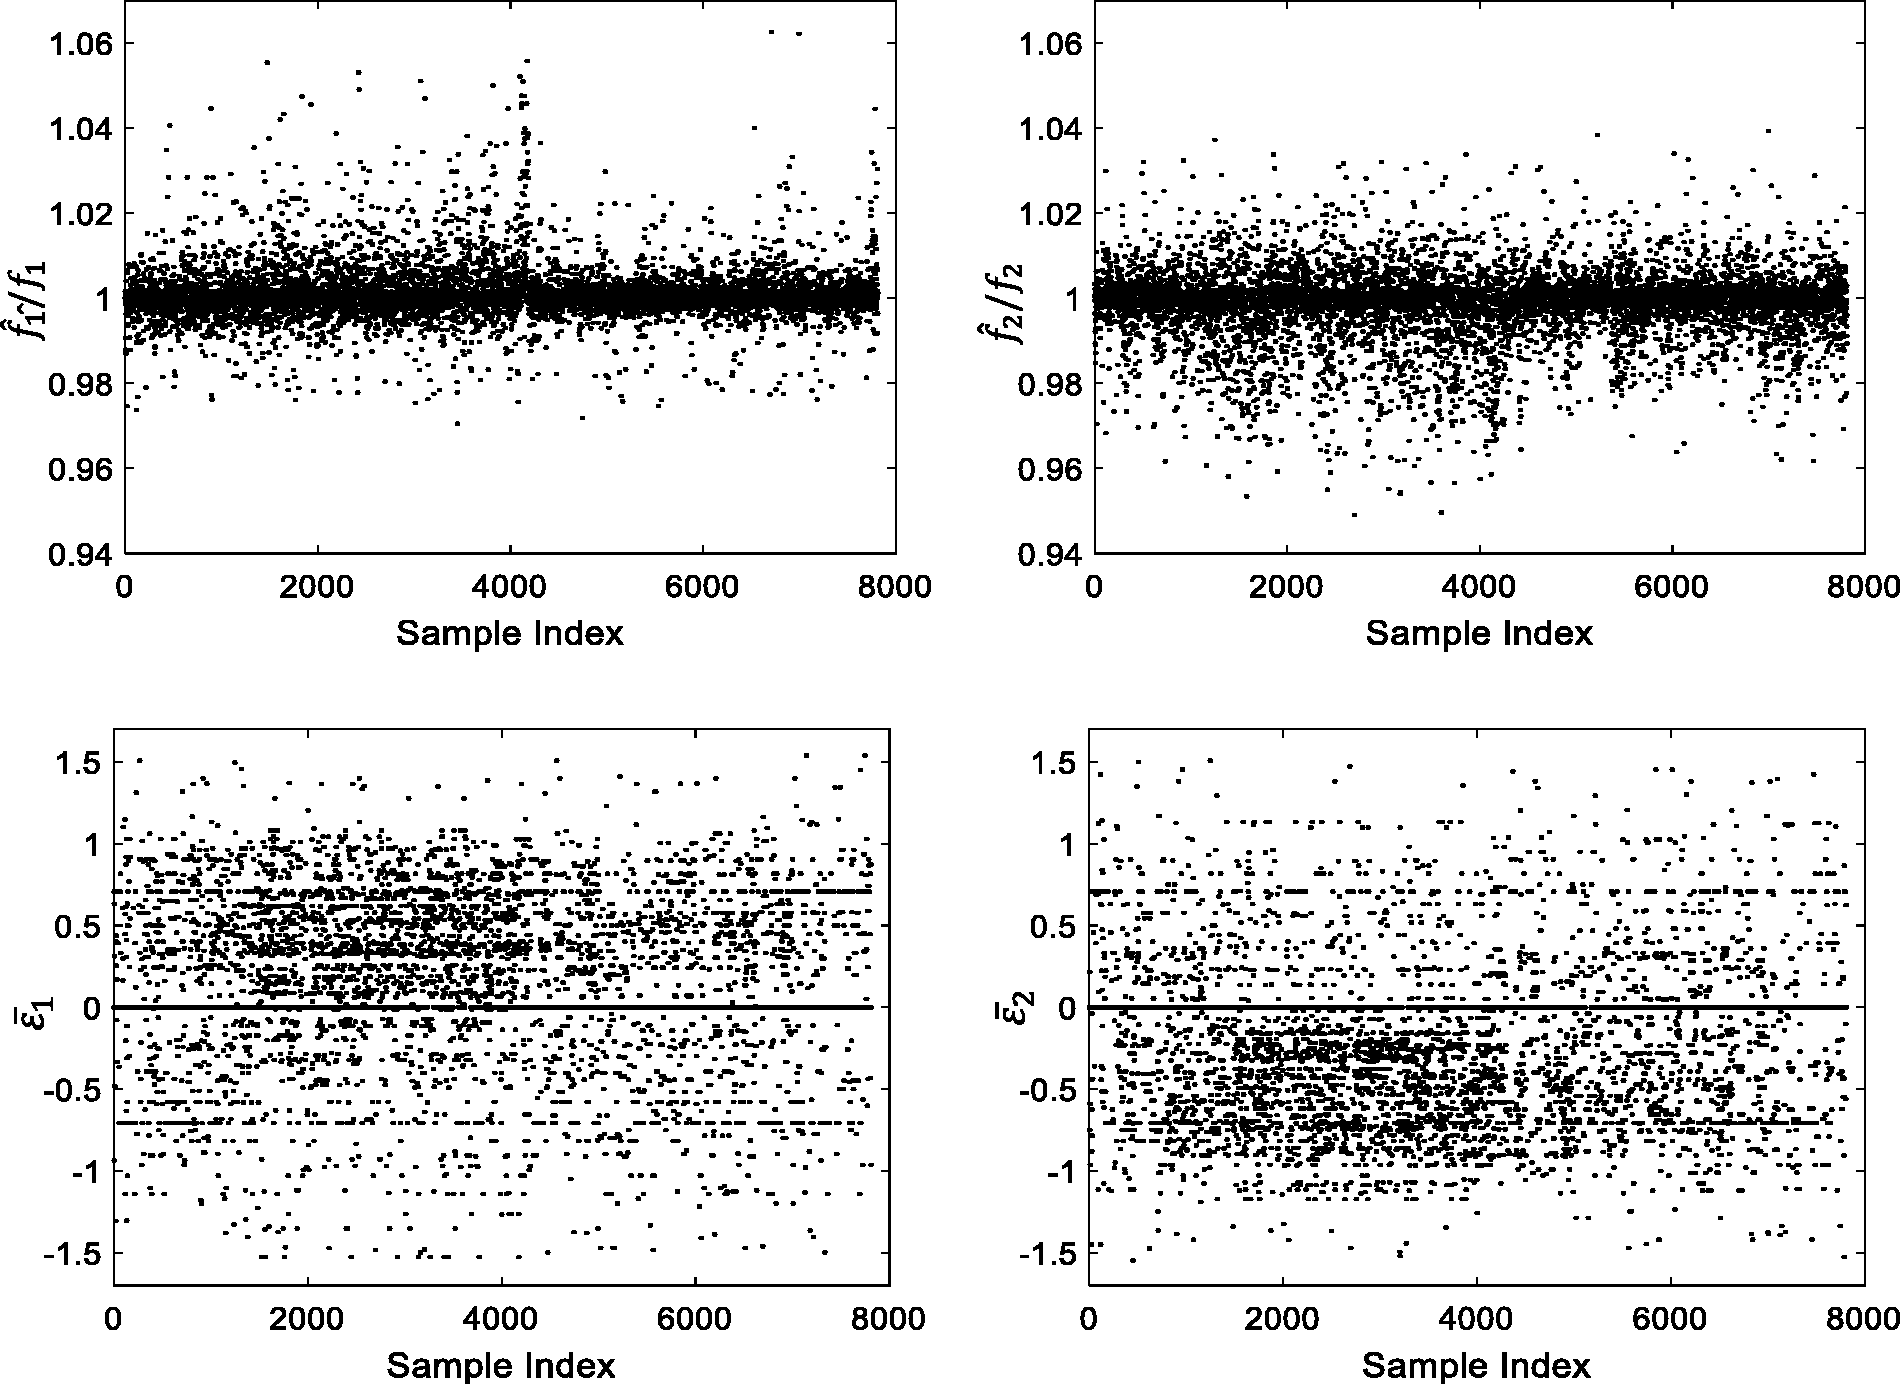
Predicted to measured ratios and normalized residuals by
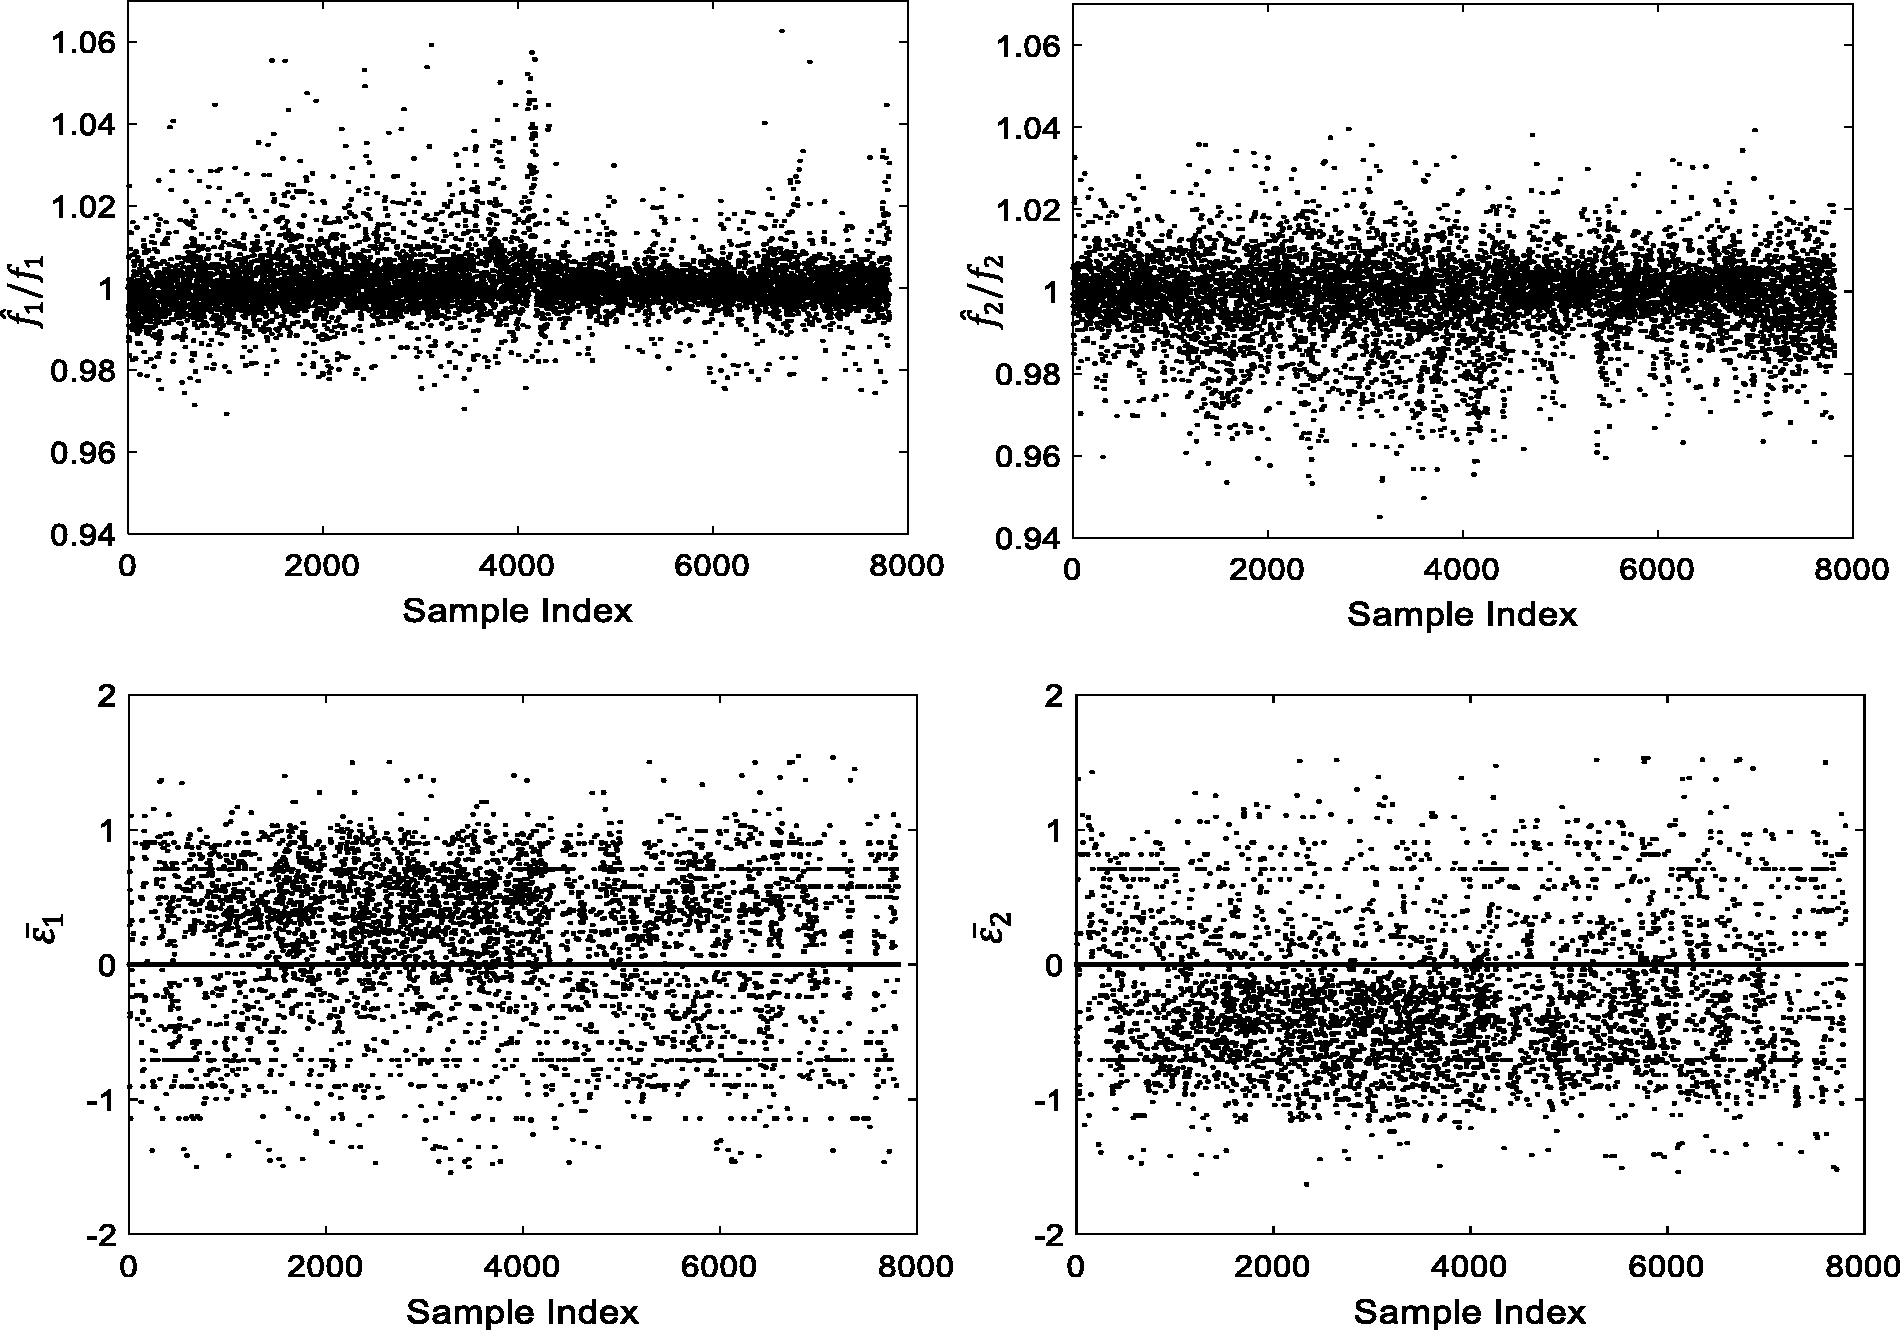
Predicted to measured ratios and normalized residuals by
Root-mean-square errors (RMSE) on predicted frequencies with different training and test data.
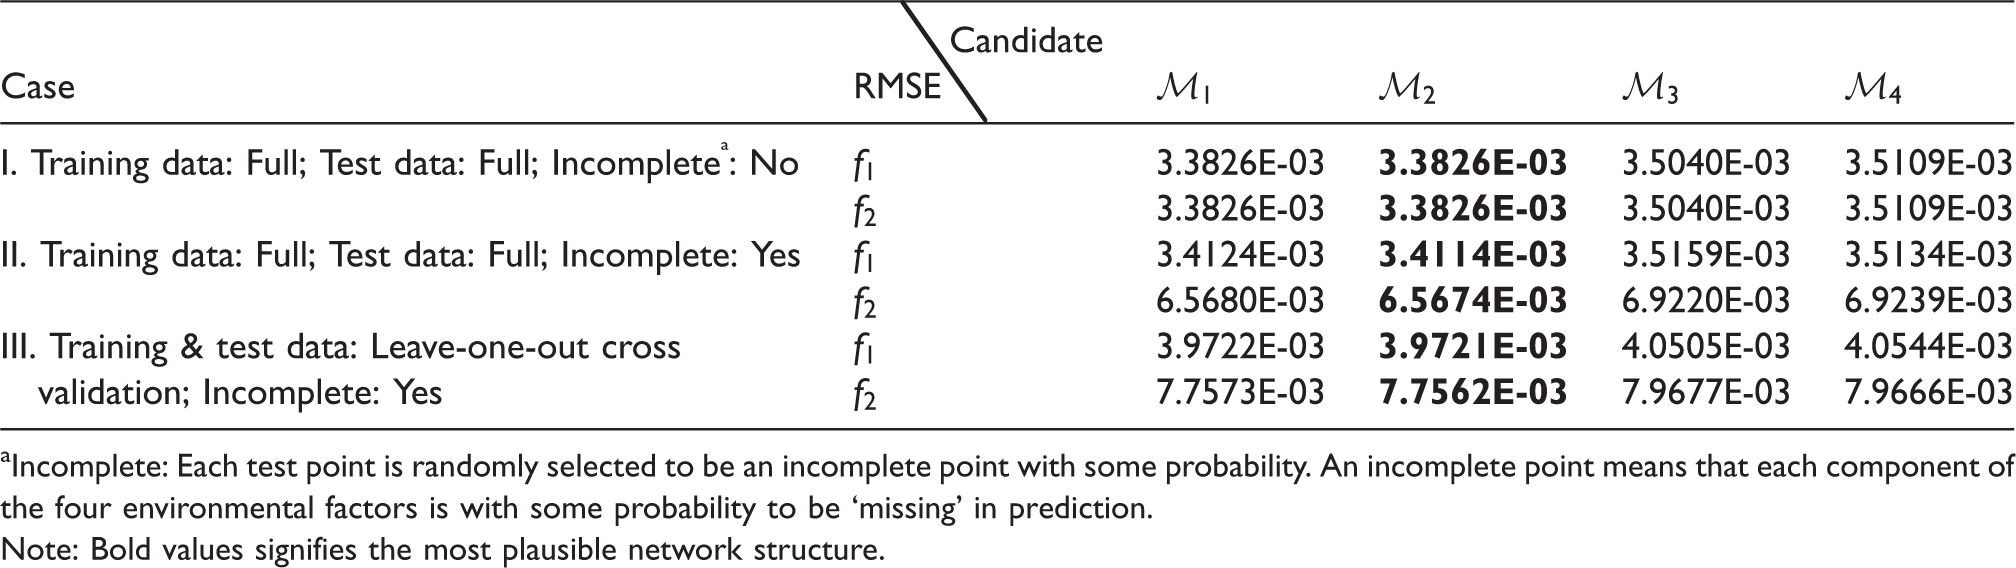
Incomplete: Each test point is randomly selected to be an incomplete point with some probability. An incomplete point means that each component of the four environmental factors is with some probability to be ‘missing’ in prediction.Note: Bold values signifies the most plausible network structure.
Conclusion
In this study, the BN-based algorithm is developed for recognizing the pattern between modal frequency–multiple environmental factors of the Xinguang Bridge based on long-term monitoring data (model frequencies, temperature, humidity, wind speed, and traffic volume). Taking the advantages of the BN approach, the uncertainty is quantified in both parameter and model levels in learning phase; and the inference is made under both complete and incomplete observed information in the prediction phase. Based on the monitoring data, the results of the most plausible network structure indicate that consideration of the correlation between the temperature and relative humidity can improve prediction, while consideration of the correlation between two frequencies cannot. The appealing feature of the BN for making prediction under incomplete observed information is demonstrated. The performances of different network structure are evaluated by the full training dataset along with full test dataset, the full training dataset along with full test dataset considering random incompleteness of test points, and the leave-on-out cross validation considering random incompleteness of test points. The positive evaluation results of the most plausible network structure confirm that the BN-based approach is capable to precisely recognize the pattern of modal frequency–multiple environmental factors. The proposed algorithm can be utilized in structural condition assessment. The predicted residuals of modal frequencies can be calculated and compared with a prescribed threshold. The predicted residuals being larger than the threshold can be treated as an alert for structural health, and the corresponding actions (further data analysis, engineering judgement and/or safety inspection) need to be taken.
Footnotes
Declaration of conflicting interests
The author(s) declared no potential conflicts of interest with respect to the research, authorship, and/or publication of this article.
Funding
The author(s) disclosed receipt of the following financial support for the research, authorship, and/or publication of this article: This work was supported by the National Natural Science Foundation of China (51508201, 51678252), the Natural Science Foundation of Guangdong Province, China (2017A030313262), Pearl River S&T Nova Program of Guangzhou (201806010172), and Science and Technology Program of Guangzhou (201804020069). This generous support is gratefully acknowledged.