
Abstract
Studies on ground vibration induced by railway operation usually focused on wagons running on ground or abutments, while vibration from a railway viaduct is often assumed to be much lower. Based on field test in the vicinity of a heavy freight railway viaduct above Shenshan Village, China, the attenuation of ground vibration induced by heavy freight wagons for coal transportation is studied. And evaluation is conducted on an adjacent house to access vibration disturbance to residents near a viaduct. Propagation and attenuation of vibration induced from viaduct are studied by analyzing peak particle velocity and spectra of ground and house vibration in the vicinity of the viaduct. Vibration signals were collected for 34 trains with different train speed and wagon weight. In all monitored situations, vertical vibration is generally larger than horizontal vibration. The relationship between distance to pier and PPV is revealed by a power function modified from Sadovskii formula with high correlation factor. Analysis also indicates a much lower dominant frequency induced by low-speed trains with or without acceleration than normal speed trains. A dramatic amplitude reduction is shown within frequency between 25 Hz and 35 Hz when train speed is reduced. Empty wagons also show smaller amplitude in most frequency bands, with significant difference in 15–25 Hz. Analysis on the house also shows larger vibration in vertical than horizontal, and vibration amplitude in some frequency bands has exceeded relative criteria. Analysis result shows significant ground and house vibration effect form a viaduct, and piers should be considered as vibration sources for ground and houses in future studies.
Introduction
Nowadays, vibration disturbance in various levels can nearly be detected everywhere, from large machines, heavy vehicles to explosion or even earthquake.1,2 With the fast-growing need of railway systems in developing countries like China, the annoyance induced by train operation is drawing increasingly significant attention.3,4 However, with much lower cost of time and money, railway is quite an efficient transportation measure on land. But in planning a new railway line or upgrading the capacity of an existing line, it is always bothering the designers how far from the railway would be disturbed beyond regulation, which would result in how many houses must be paid to relocate.
During recent years, many prediction models have been developed, such as analytical model, 5 numerical model, 6 and scope model. 7 Although numerical method is widely adopted in recent studies,8–10 analysis of field test is still required to provide direct evidence for validation of different prediction models.11–14 In the meantime, studies are also conducted to control vibration induced by railway.15–18
On the other hand, due to topographic influence, more and more railway viaducts are built, especially in mountainous area. However, most studies on railway viaduct are focusing on ballast stability for ballasted tracks, passenger comfort or viaduct stability problems induced by train operation.19–21 Some designers believed to control vibration within a narrower strip area below viaducts. However, along with attenuation and propagation through beam, pier and ground, vibration is also concentrated from a strip excitation to a point excitation, which might as well cause overlapping of stress wave. Fewer studies have been conducted on ground vibration induced by railway viaduct. Li et al. 22 established a numerical model based on train–track–viaduct–pier–soil interaction and revealed vibration reduction in frequency band below 40 Hz. Doménech et al. 23 conducted a parametric analysis on single load free vibration with a 3D BEM–FEM (Boundary Element Method – Finite Element Method) coupled numerical model focused on soil–structure interaction, which identified fundamental frequencies induced by impulse loading. Sevim et al. 24 combined numerical and experimental evaluation to predict the time history response for displacements and stresses, which indicated that near-fault ground motion imposes higher seismic demand on the arch bridge observed in both higher displacements and stresses.
In this paper, field test result of vibration response of ground and structure is studied by analyzing vibration peak particle velocity (PPV) and spectra induced by trains of different weight and speed on a railway viaduct. The relationship between vibration and distance to viaduct is analyzed by adopting power function. Results presented in this work are most applicable to heavy freight railway line design, particularly in mountainous area where more railway viaducts are distributed.
Methodology
Dynamic system of train–railway–viaduct
In a train–rail–viaduct–pier–ground system, the train model is a typical multi-body dynamic problem, which consists of independent wagons and dynamic loading on axles. 25 Below that, there are interactions between wheel and track, track and slab, slab and beam, beam and pier, pier and ground, then ground and structure. All the above interactions are complex. However, in a mature design process for the same railway line, most interactions are similar, thus dynamic load variation from train to ground is mainly from train speed and axle load. After interaction between piers and soil, it becomes a pure structure response problem to ground vibration.
Ground vibration
Ground vibration is studied widely from machinery excitation to explosive excitation in recent years. The prediction of ground vibration is critical to prevention of environmental complaints. It has three major essentials, namely excitation source, propagation media, and structural response, 26 with many similarities to other kinds of vibration such as blasting vibration.
Blasting vibration has a different generation mechanism from train vibration. Within a limited radius to blasting source, shockwave is formed, generating large amount of cracks and fragmentation. But beyond a certain radius from the blasting source, there is only stress wave in a normal elastic level similar to that induced by railway operation. As shown in Figure 1, theoretical researches and experiments indicate that the diameter of crushed zone is about 3–5 times that of a borehole, and the diameter of fractured zone is around 10–15 times that of borehole.27,28 That means shock wave induced by blasting is usually within the range of about 0.21–1.05 m in diameter (for a typical 70-mm borehole), which is even smaller than diameter of a viaduct pier. Therefore, ground vibration induced by a pier–soil interaction can be analyzed in a similar way to blast-induced ground vibration.
Excitation difference between pier and blasting.
Both excitation from pier–soil interaction and borehole explosion can be considered as a point source, thus it is reasonable trying to apply attenuation prediction equation of blasting vibration in train-induced ground vibration problem. Sadovskii formula is effective to predict ground vibration with a distance from the source (usually no less than 10 m). With this distance away from source, both vibrations induce by blasting and train are similar in their attenuation characteristics, thus it is applicable to predict viaduct railway induced ground vibration with Sadovskii formula.
The Sadovskii formula (equation (1)) is proved to be valid in a wide range during the past decades in estimating PPV of ground vibration induced by blasting, earthquake, etc.28–31 In this equation, PPV is in power functional relationship with distance to blasting source, which is similar to prediction equations in previous studies on railway-induced vibration.32–34 Therefore, it is reasonable to modify Sadovskii formula so as to describe propagation and attenuation of vibration induced by train operation on viaduct. Different from explosive weight in blasting operation, energy of vibration induced by train is mainly influenced by train speed and axial load, given other parameters constant for a same maturely designed railway line, as discussed before. Therefore, it is critical to consider these factors in order to replace explosive weight in Sadovskii formula.

The main purpose of this study is to monitor ground vibration in the vicinity of a railway viaduct. Since vibration spectra are vital to both the structural stability of a house and human comfort, test data would be analyzed on both PPV and spectra. Fourier transformation and one-third octave spectra are both effective measures of analyzing vibration induced by different freight weight and train speed for monitoring points (MPs) in different distance and position to the viaduct. In this way, it is convenient to discuss vibration energy distribution on different frequency bands.
The vibration velocity level is an index used to evaluate the magnitude of vibration. It is calculated by using the IS02631 standard, which is formulated by the International Standard Organize, and the formula is as follows:

Field test of railway viaduct over Shenshan village
Background
Shenshan Village, as shown in Figure 2, is located in the northeast of Yuanping City, Shanxi Province, North China. There are about, 5000 people living in this village, within a relatively small area. The railway viaduct over this village is one of hundreds of viaduct (or bridges) on Shuo-Huang railway line, as shown in Table 1. It is just in the connection area between mountain area and plain area. Shuo-Huang railway, with total length of nearly 600 km, is mainly designed for coal transportation. In 2013, its transportation capacity is 350 million tons, which would be upgraded to 450 million tons in near future. Due to terrain variation, viaducts and bridges consume about 10% of the total length, which makes it necessary to study the adjacent ground vibration and structure vibration induced by train operation on viaducts or bridges.
The location of Shenshan railway viaduct.
Viaduct/bridge distribution on Shuo-Huang Railway Line.
Train viaduct over Shenshan village is 24 m above ground, with step footing 8 m below ground, shown in Figure 3. In Shenshan Village, the ground can be divided into several layers, namely pebble soil, clay sand, gravelly soil from top. However, it was reclaimed into farmland decades ago and can be considered as homogeneous sand soil in depth of 16 m. Existing Chinese regulations on railway planning are mainly based on vibration influence from railway on the ground or embankment, while previous studies on railway viaducts were usually focusing on structure stability or passenger comfort. However, houses in the vicinity of the viaduct are not designed to resist vibration ground from train operation, although there is a long and complex attenuation process in vibration propagation. Therefore, ground vibration excitation, propagation, and attenuation characteristic should be studied to support vibration evaluation for house stability and human comfort for the residents.
(a) Illustration of the pier, soil layer, and foundation (unit:cm). (b) A–A section (unit:mm).
Vibration monitoring
This railway viaduct over Shenshan village is for coal transportation from Shanxi Province to the harbor in Tianjin. So it is necessary to consider the heavy freight train full of coal ore. On this railway viaduct, there are mainly three types of wagons, namely C64k, C70, and C80. The characteristic of different types of wagons is listed in Table 2. These three types of wagons are the major ones in operation in China, and their max gross load on axis are 21t, 23t, and 25t, respectively. Instead of steel, C80 wagons adopted A-alloy, which is less in density, thus its self-weight is much less than C64k or C70.
Characteristics of different types of wagons.
Monitoring points are arranged on two different routes perpendicular to viaduct axis, shown in Figure 4. Route PL starts from a pier, with four MPs (No. 2–5) in horizontal distance of 1 m, 7.5 m, 15 m, and 28 m perpendicular to viaduct axis. Route MR starts from the middle point between two adjacent piers, with MPs (No. 6–9) in horizontal distance of 7.5 m, 15 m, 22.5 m, and 30 m perpendicular to viaduct axis. Two more MPs (No. 10 and 12) are placed in the center of a room on the ground floor and on the roof, respectively. MP11 is on the foundation of the house. Both vertical sensor and horizontal sensor are set at each MP, as shown in Figure 5. All vibration sensors and antialiasing filter amplifier confirm requirements of ISO 4866: 1990.
Layout of measuring points in the field test (unit:m).
Sensors at the monitoring point on the ground.
During field monitoring, the weather has been sunny and calm for three days after a light shower. And 34 trains passed this viaduct pier during the test, including all three types of empty or full load freight trains at speed of 40 (slow) or 100 (normal) km/h, as well as some in accelerating situations.
Test results and discussion
Ground vibration propagation on different routes
MP3 and MP6, both in 7.5 m distance to viaduct axis, are compared vibration as representative data on Route PL and Route MR. Vibration waveform induced by a train with empty C64k wagons is shown in Figure 6. It is obvious that although MP3 and MP6 are in same perpendicular distance to viaduct axis, their waveform shows quite a difference in amplitude, as MP3 is much closer to a pier. For both MP3 and MP6, vibration amplitude has a relatively rapid increase during first 10 s, then keeps a mild decrease. But for MP3, there is another vibration velocity increase in the later half of the waveform. In the frequency domain of vibration at MP6, there are two main frequency bands at around 20 Hz and 40 Hz. As for vibration at MP3, amplitude increases gradually from 5 Hz to 30 Hz, which is more than twice of amplitude at MP6. But at frequency higher than 40 Hz, amplitude at MP6 suddenly becomes larger. It implies that vibration on Route PL is dominant in lower frequency bands.
Comparison between vertical vibration on different route with same distance perpendicular to viaduct axis.
It is also revealed that vibration at MP3 on Route PL is larger than MP6 on Route MR, even with overlapping of vibration from two piers. But, considering piers as vibration sources, this phenomenon can be easily explained, because the distances to a pier from MP3 and MP6 are respectively 7.5 m and 17.6 m. And consider different overlapping situation of vibrations from adjacent piers, MPs on these two routes are representative for ground vibration propagation and attenuation.
Both vertical and horizontal vibrations are analyzed by plotting their one-third octave spectra in Figure 7. MP 6 and MP7 on Route MR are compared with MP3 and 4 on Route PL. The comparison reveals relatively similar amplitudes between frequency from 15 Hz to 40 Hz, while difference is enlarged in the rest frequency bands, especially above 40 Hz. It indicates that vibration in frequency between 15 Hz and 40 Hz, where PPV lies, attenuates at a lower rate. The horizontal vibration amplitudes of MP 6 and MP 7 are smaller than MP 3 and MP 4, but the difference of vertical vibration is not obvious.
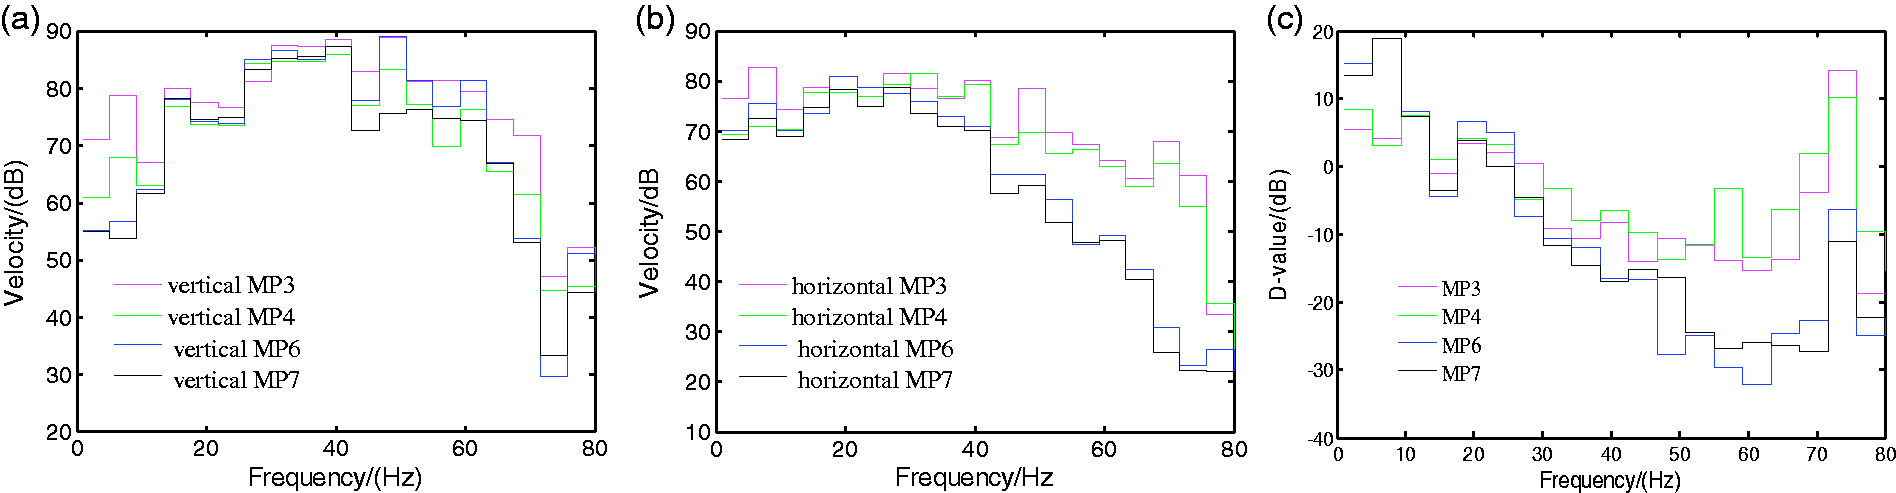
One-third octave spectra of the vibration at different MPs (dB-ref 10−9 m/s): (a) Vertical, (b) horizontal, and (c) D-value.
Obviously, at frequency from 36 Hz to 72 Hz, horizontal vibration amplitude for MPs on Route PL are increasingly smaller than MPs on Route MR. At frequency from 16 Hz to 36 Hz, amplitude difference for each MP is not so obvious. However, generally, amplitude is smaller when MP is further to the pier. Difference between horizontal and vertical vibration for each MP is calculated and named as D-value, shown in Figure 7. And it is interesting to find that horizontal vibration amplitude is larger than vertical in most frequency bands below 20 Hz and between 68 Hz and 76 Hz. In most frequency bands, vibration amplitude difference on Route MR is larger than on Route PL. And attenuation on Route PL tends to decrease amplitude difference between vertical and horizontal vibrations during propagation in most frequency bands above 12 Hz, while opposite trend can be found on Route MR.
The variation of vertical vibration velocity on both routes is analyzed on trains with empty wagons by comparing the root mean square (RMS) velocity level, which is calculated from equation (2), as shown in Figure 8.
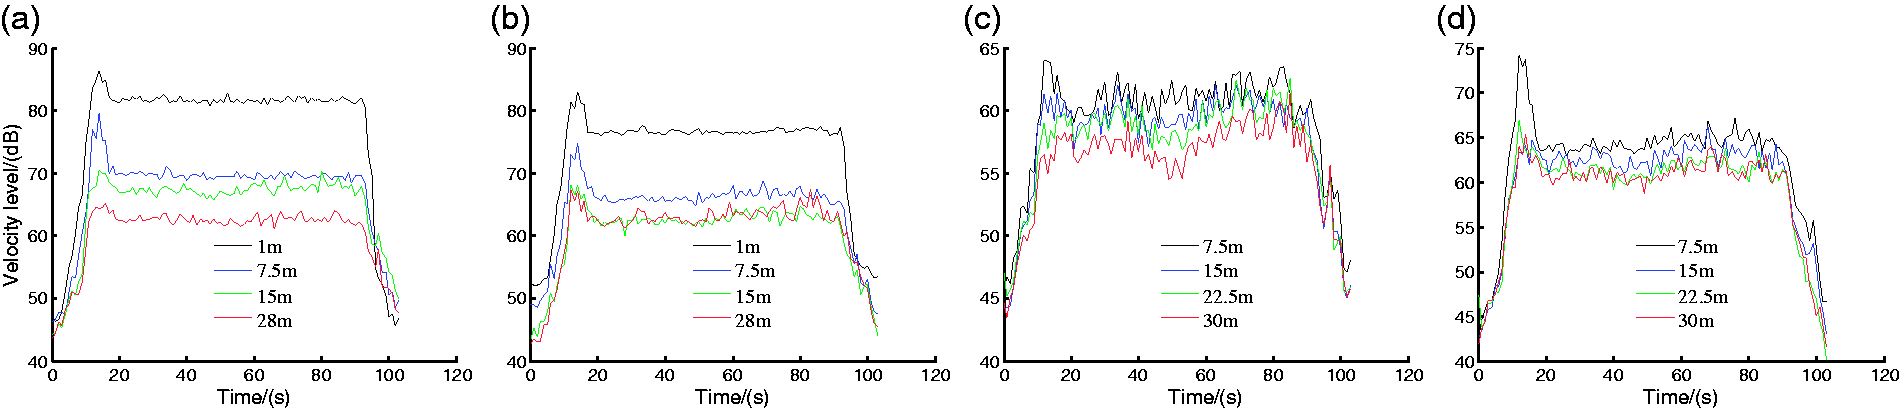
Comparison of vibration variation via distance on different route (a and b) Vertical and horizontal vibration on Route PL and (c and d) Vertical and horizontal vibration on Route MR.
All four figures of Figure 8 show a peak velocity level at about 10 s, which is the result of the rapid loading from a passing train. After that, RMS velocity level is relatively flat, then decreases as the train is away. It is quite interesting that the peak value at 10 s is equally obvious for MPs on Route PL, but dramatically different on Route MR. The peak is not so apparent for vertical vibration velocity level on Route MR and is exceptionally prominent for horizontal vibration. It can be inferred that overlapping of vibration from two piers has canceled part of vertical vibration, while enhanced part of horizontal vibration.
With increasing perpendicular distance to viaduct, vibration level is decreased. But the decrease is more obvious on Route PL and is more obvious when distance is smaller. It implies that vibration attenuation rate is decreasing when distance is increasing. Based on the theory brought by Sadovskii, vibration attenuation should be fitted by a power function relationship, as shown in equation (3).

However, in a standardized railway–viaduct system, the main influential factors to Q′ are train speed and total gross axle weight, but current test data are not sufficient to explain the detailed mechanism of the influence. Therefore, equation (1) is transformed as follows to equations (4) and (5).


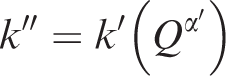
This modification makes k″ relevant to both α′ and Q′. Decades of study on k and α in Sadovskii formula have provided much valuable progress in predicting ground vibration, which is useful for ground vibration induced by viaduct. To avoid complicated research on Q′ and k′, three cases are studied to achieve a more reasonable result, with available data for full and empty C80, as well as full C64k, at normal speed.
In Figure 9, regression analysis with equation (5) shows relation coefficients (R) all over 85%, and the results are concluded in Table 3. However, the attenuation of PPV on Route MR does not fit in equation (5), since the distance to viaduct axis does not represent the distance to excitation source. Observation also shows that vertical velocity is larger than horizontal velocity. It is obviously influenced by the propagation process via pier, which reduced much of horizontal vibration from viaduct to ground.
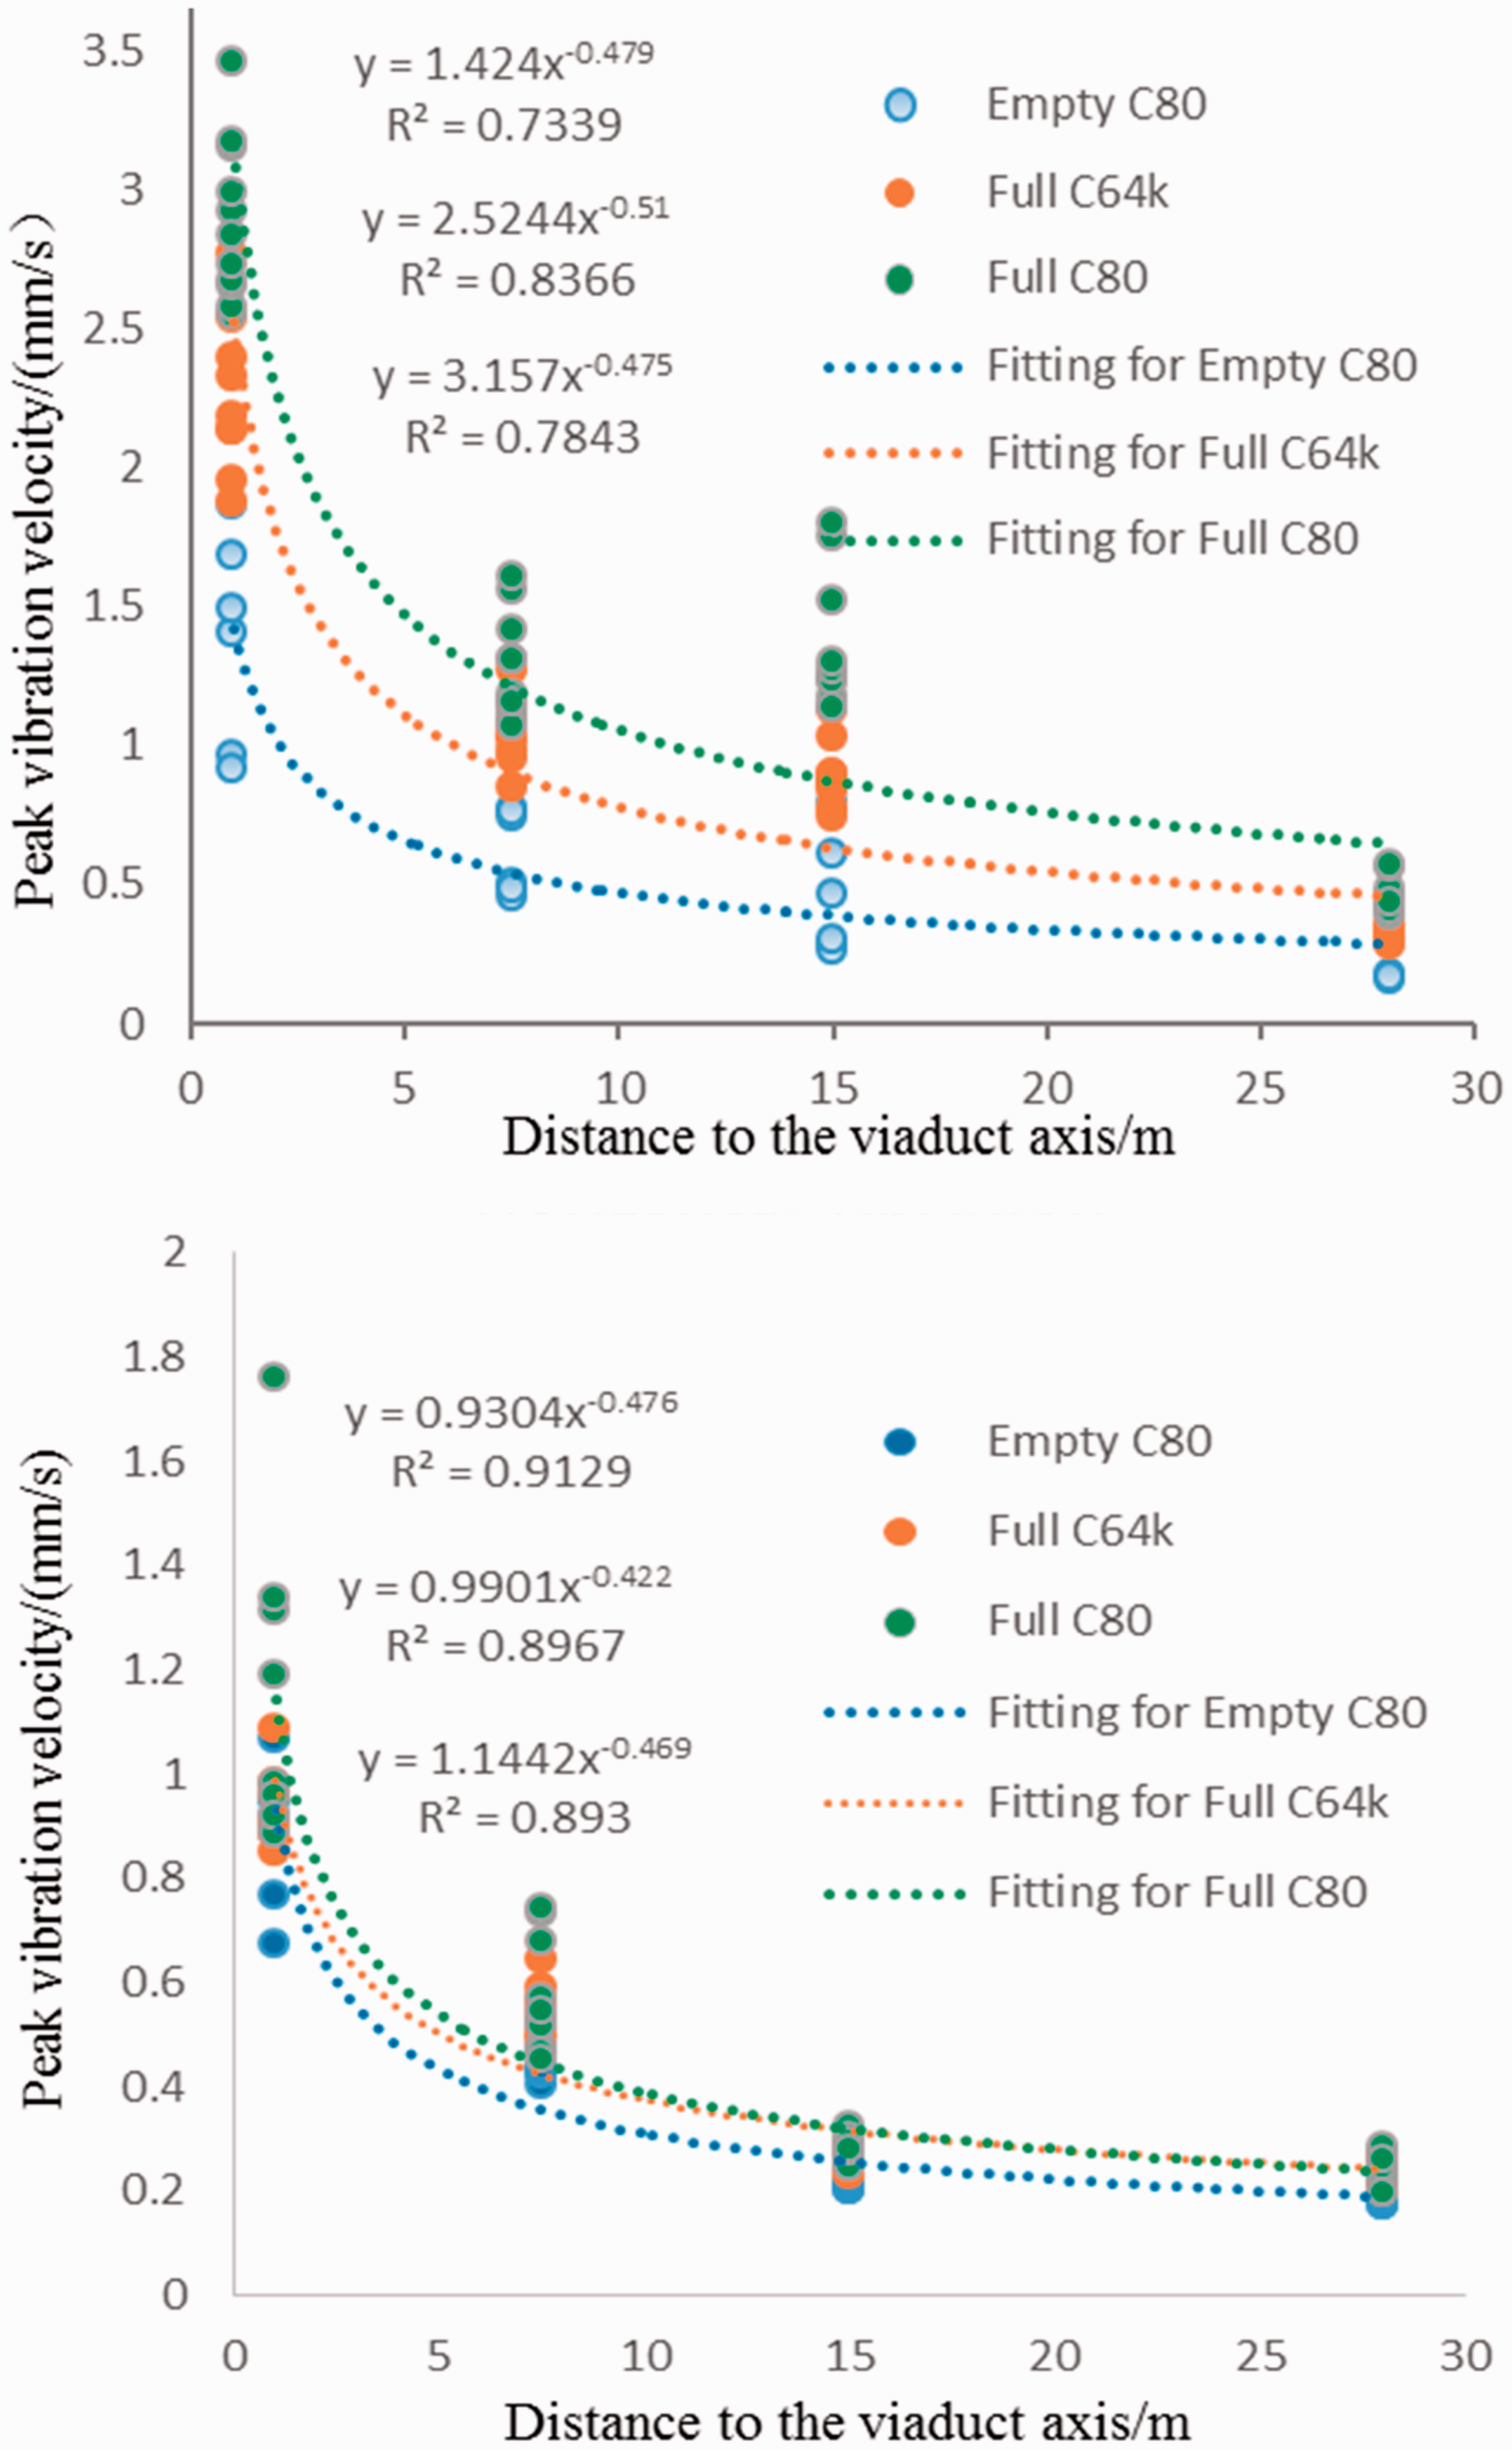
Regression analysis of PPV attenuation. (a) Vertical; (b) Horizontal.
Fitting of peak velocity versus distance.
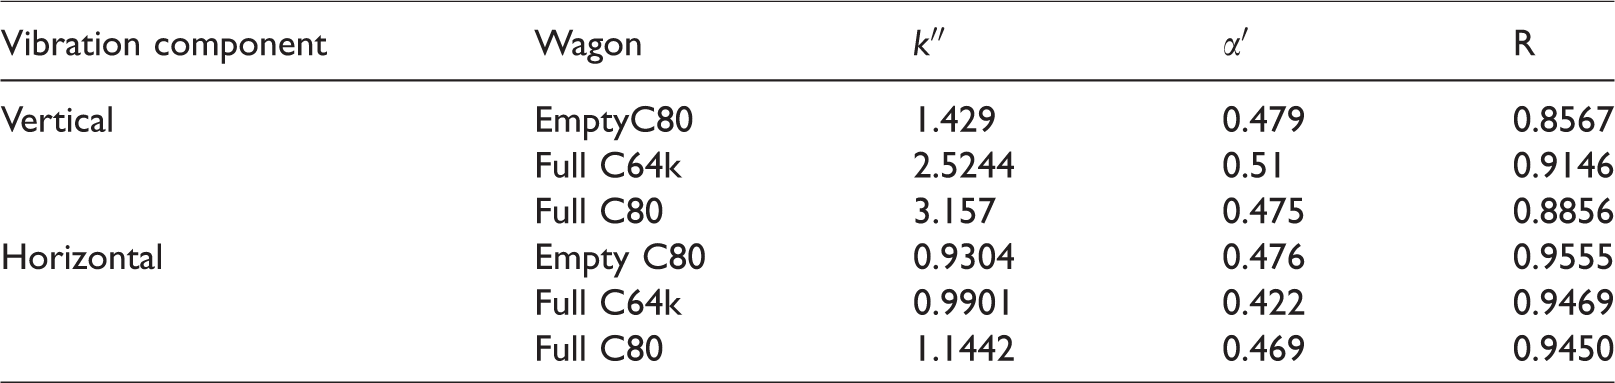
Seen from comparison in Table 3, variation of k′ due to changes in wagons type is quite large, especially for vertical PPV, as this factor is representing the change of wagon weight and speed. And α′ is mainly influenced by field condition, according to Sadovskii formula. With parameters in Table 3 and equation (5), it is now possible to predict ground PPV on Route PL, or any perpendicular route of a certain pier for this viaduct, for these three particular combinations of wagon type, speed, and freight.
Ground vibration induced by train acceleration
If the train and the viaduct are considered as one combined system, the main external force to this system is gravity, wind load (or wind resistance), and ground reaction to piers. It is not possible to study the vibration to the ground by analyzing the air dynamic pressure on each side of the train since the results of the wind tunnel test for the train are unavailable. However, obviously, as the speed of the train increases, air resistance will increase and wagon weight loading rate is higher. Then, with comparison to that during low (40 km/h) and normal (100 km/h) speed train motion, ground vibration induced during train acceleration (from 20 km/h to 50 km/h in 120 s) is analyzed in Figure 10. In this figure, there is a steep rise at the beginning of the vibration in both low speed and normal speed situation, due to the impact of an arriving train. During about 10–30 s, velocity level increases sharply, since quite a large load is applied onto a pier (taking one pier for consideration). In low-speed situation, this load of weight is applied in a longer duration. The rise of vibration is slower. However, it can be seen from the curve that vibration velocity rises rapidly in normal speed situation. While its peak value is relatively larger than low-speed situations, it reaches peak value much faster than the low-speed situation. And it is reasonable to see a decrease of vibration later in both low speed and normal speed situations since the impact from an arriving train is stabilized. Then finally when train is moving away from this pier, this vibration decreases similarly as fast as how it increases.But the vibration induced by an accelerating train is quite different. The curve of vibration velocity versus time also shows a sharp rise in the first 30 s, but it keeps increasing for a much longer duration until the train is passed. And the decrease of vibration at the end is faster than the increase at the beginning. The average velocity level of ground vibration induced by an accelerating train is just slightly smaller than the low-speed situation and much smaller than the normal speed situation, so is the average speed for these three situations. It can be inferred from above observation that ground vibration level is dependent to train speed, which is determinant not only to the value of external load but also to loading rate.
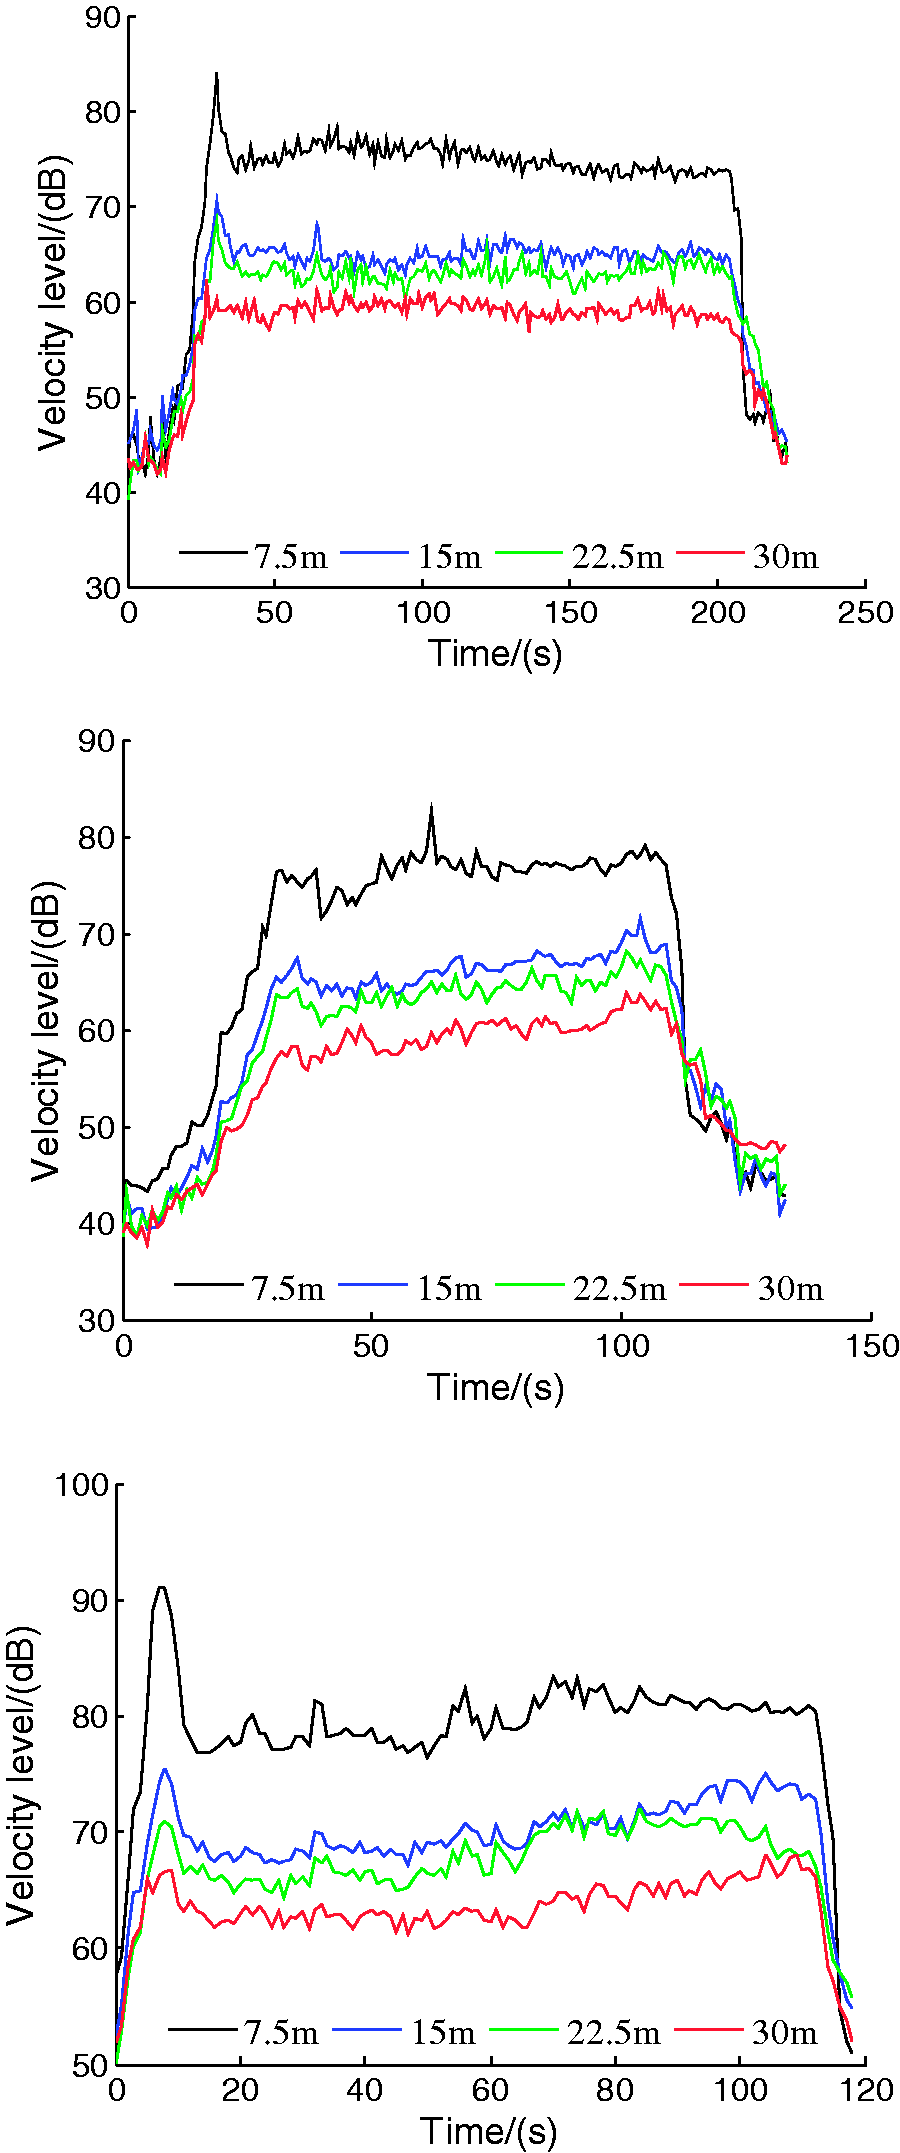
Ground vibration versus time induced during train motion in different speed. (a) Low speed; (b) Accelerating; (c) Normal speed.
It is revealed by further analysis of ground vibration spectra in Figure 11 that vibration frequency induced by low-speed train with or without acceleration is much lower than normal speed train. And vibration induced by accelerating is obviously smaller than that induced by low-speed train in frequency bands from 25 Hz to 35 Hz, but it is obviously larger in frequency bands below 10 Hz. It is also interesting to find that amplitude in frequency band between 32 Hz and 36 Hz is most insensitive to train speed.
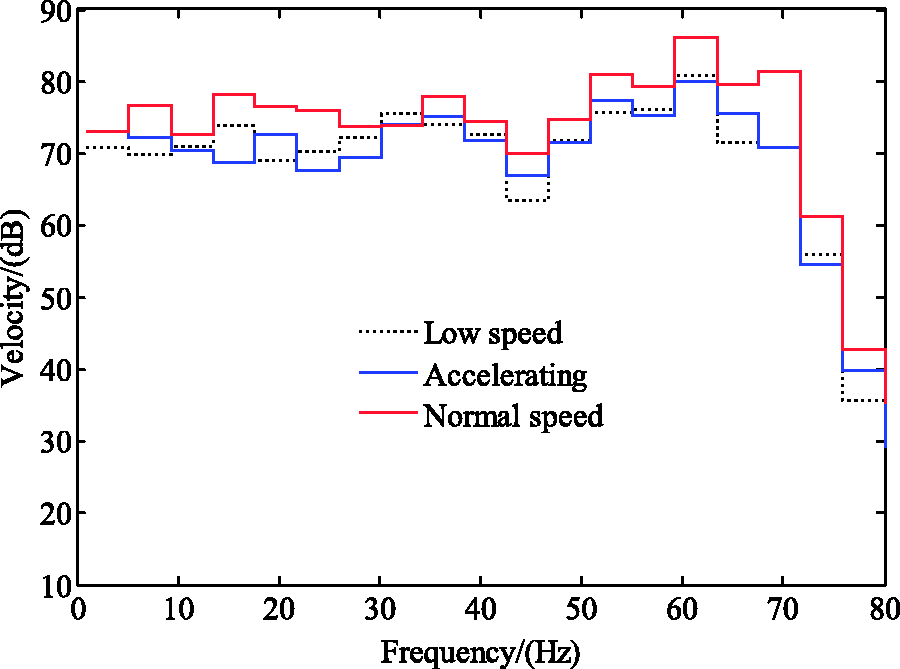
Vibrating spectra at different speed (dB-ref 10−9 m/s).
Vibration induced by heavy freight train
In order to analyze the influence of wagons weight on ground vibration induced by train on the viaduct, ground vibration data monitored at MP 1 near a pier are analyzed for five situations, which are empty C64k, C70, C80, and full C64k, C80 running at 100 km/h.
Spectra analysis shows the amplitude decreases gradually for all types of wagons. Since axle load of an empty wagon is one-fourth of full wagons, the spectrum should be obviously different. It is revealed by Figure 12, the amplitudes of empty wagons are lower in most frequency bands, and the largest differences are found in frequencies from 15 Hz to 25 Hz. The minimum amplitude at 20 Hz is 70 dB for empty C70, while the maximum is 98.5 dB for full C80 and the difference is 35dB. However, frequency difference is not so clear among different empty wagons, as their axle loads are quite similar. But among full wagons, amplitude of C80 is higher at frequency bands above 55 Hz and below 30 Hz. The amplitude of C64k full is slightly higher between 35 Hz and 50 Hz, where amplitudes of empty wagons are higher.
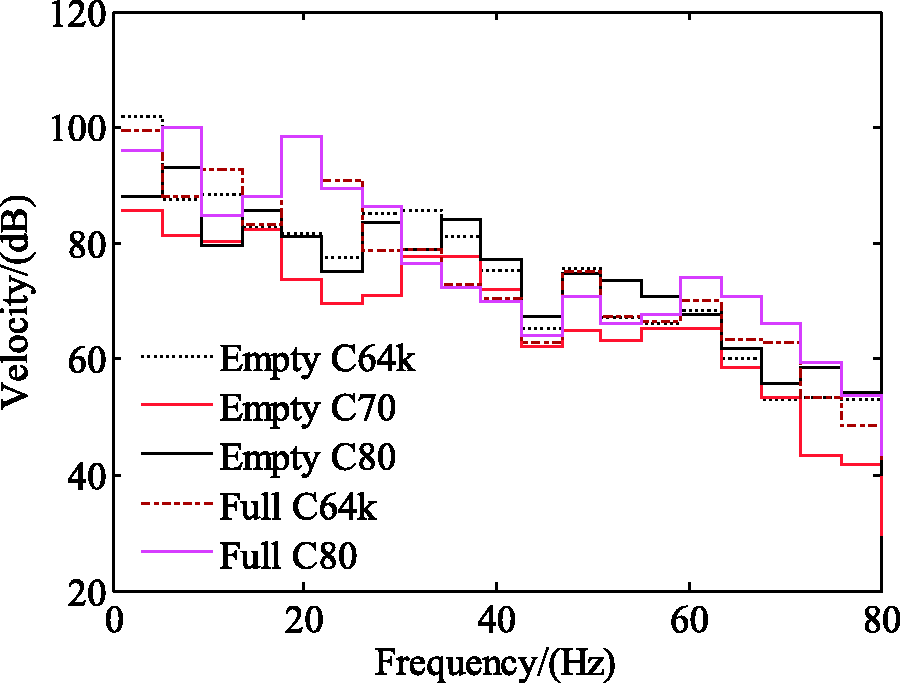
Ground vibration spectra for different situations (dB-ref 10−9 m/s).
Dynamic response of the structure
One-story farmhouses are common in the vicinity of the viaduct, most of which are brick–concrete structures. Few structures have two or more stories. Different from earthquake, train-induced vibration keeps a long duration for minutes. Although its vibration amplitude is much smaller, residents in these houses can be disturbed every 20 min or even less. In the meantime, accumulation of fatigue damage to the structure can result in cracks and failure. Generally speaking, all structure within a certain distance from railway axis should be evaluated for train disturbance, in case of noise or instability.
A typical one-story house with 28.5-m minimum distance to the viaduct is monitored for its dynamic response to the vibration induced by the train operation, shown in Figures 4 and 13. The house is 6.7 m in length, 3 m in width, and 2.8 m in height. There are two rooms in total. Its wall is 240 mm in thickness, door is 0.9 m in width and 2.4 m in height, and windows are 2.6 m in width and 1.5 m in height. Depth of its strip foundation is approximately 0.3m. As shown in Figure 13, three MPs are set on the structure, namely MP 11 at foundation, MP 10 at room center of ground floor, and MP 12 on the roof just above MP 10.
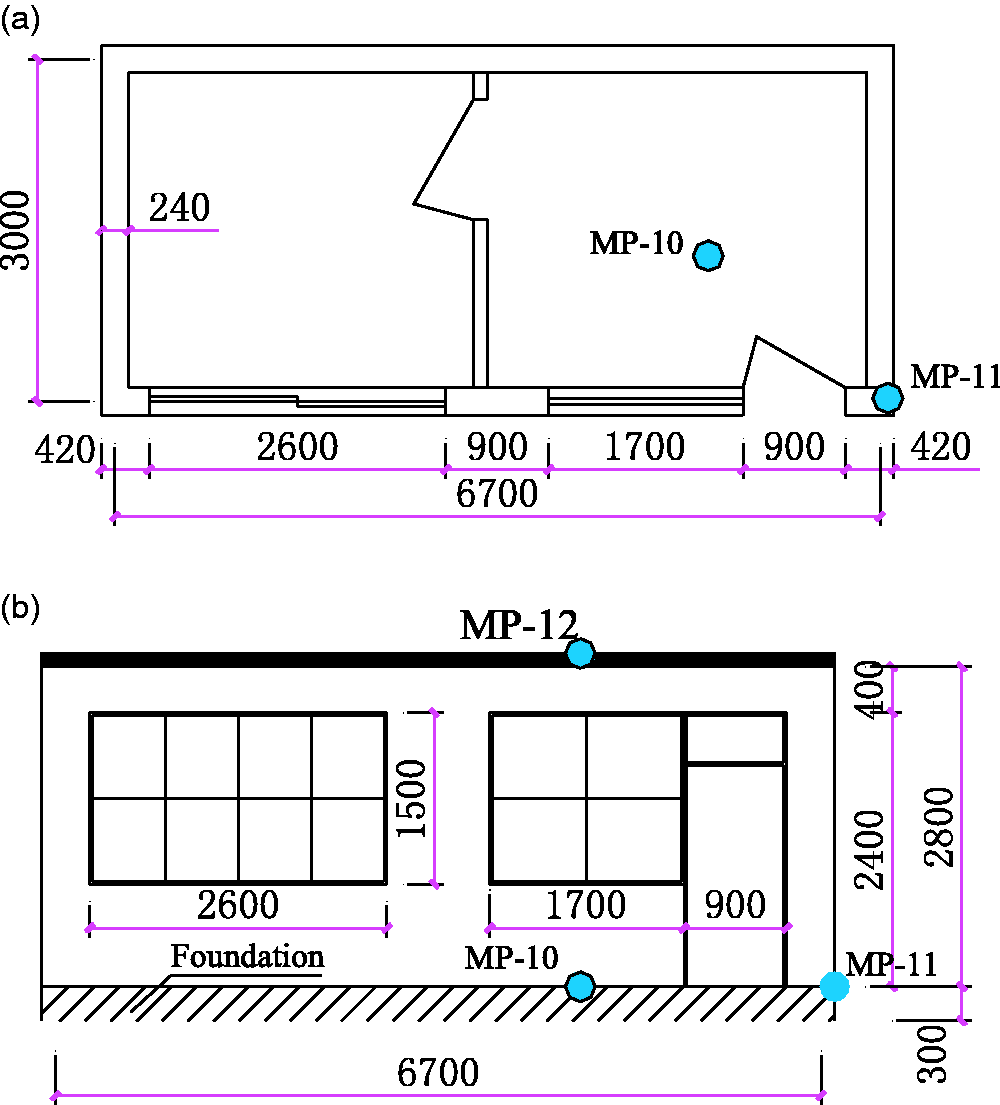
The structure of house: (a) Plan and (b) elevation (unit: mm).
Usually, we use PPV to measure the effect of vibration on the structure. Maximum vibration velocity of MP10, 11, and 12 are respectively 0.1161 (vertical), (vertical), and 0.59214 mm/s (horizontal). It indicates that PPV of each direction of the base and top measurement points is much smaller than the limit (2 mm/s) regulated by Transit Noise and Vibration Impact Assessment. Therefore, the train vibration will not affect the safety performance of the structure, but it will affect the comfort of the human body inside the building.
As shown in Figure 14, acceleration spectra are acquired by Fourier transformation to study vibration energy distribution in each frequency bands, so as to apply different cancellation measures for energy-concentrated frequency bands. Because of the natural vibration characteristics of the structure or the influence of the soil–structure interaction, 35 the velocity amplitude of the roof measuring point is usually larger than that of the base point in frequency domain. The vertical vibration frequency is mainly distributed between 10–20 Hz and 30–40 Hz, which may be caused by resonance. However, the vertical vibration from base to top is magnified three times, between 30 Hz and 40 Hz. Because of faster attenuation of high-frequency part as analyzed above, the vibration amplitude over 50 Hz is very weak. The horizontal and portrait vibration frequencies are mainly distributed between 10 Hz and 20 Hz, and the amplitude of the roof is generally five times larger than the foundation, thus the horizontal vibration reduction measures should be considered for these locations. If this regulation can be further approved by more data in the future, it would be possible to predict vibration velocity on the structure based on the modified Sadovskii formula.
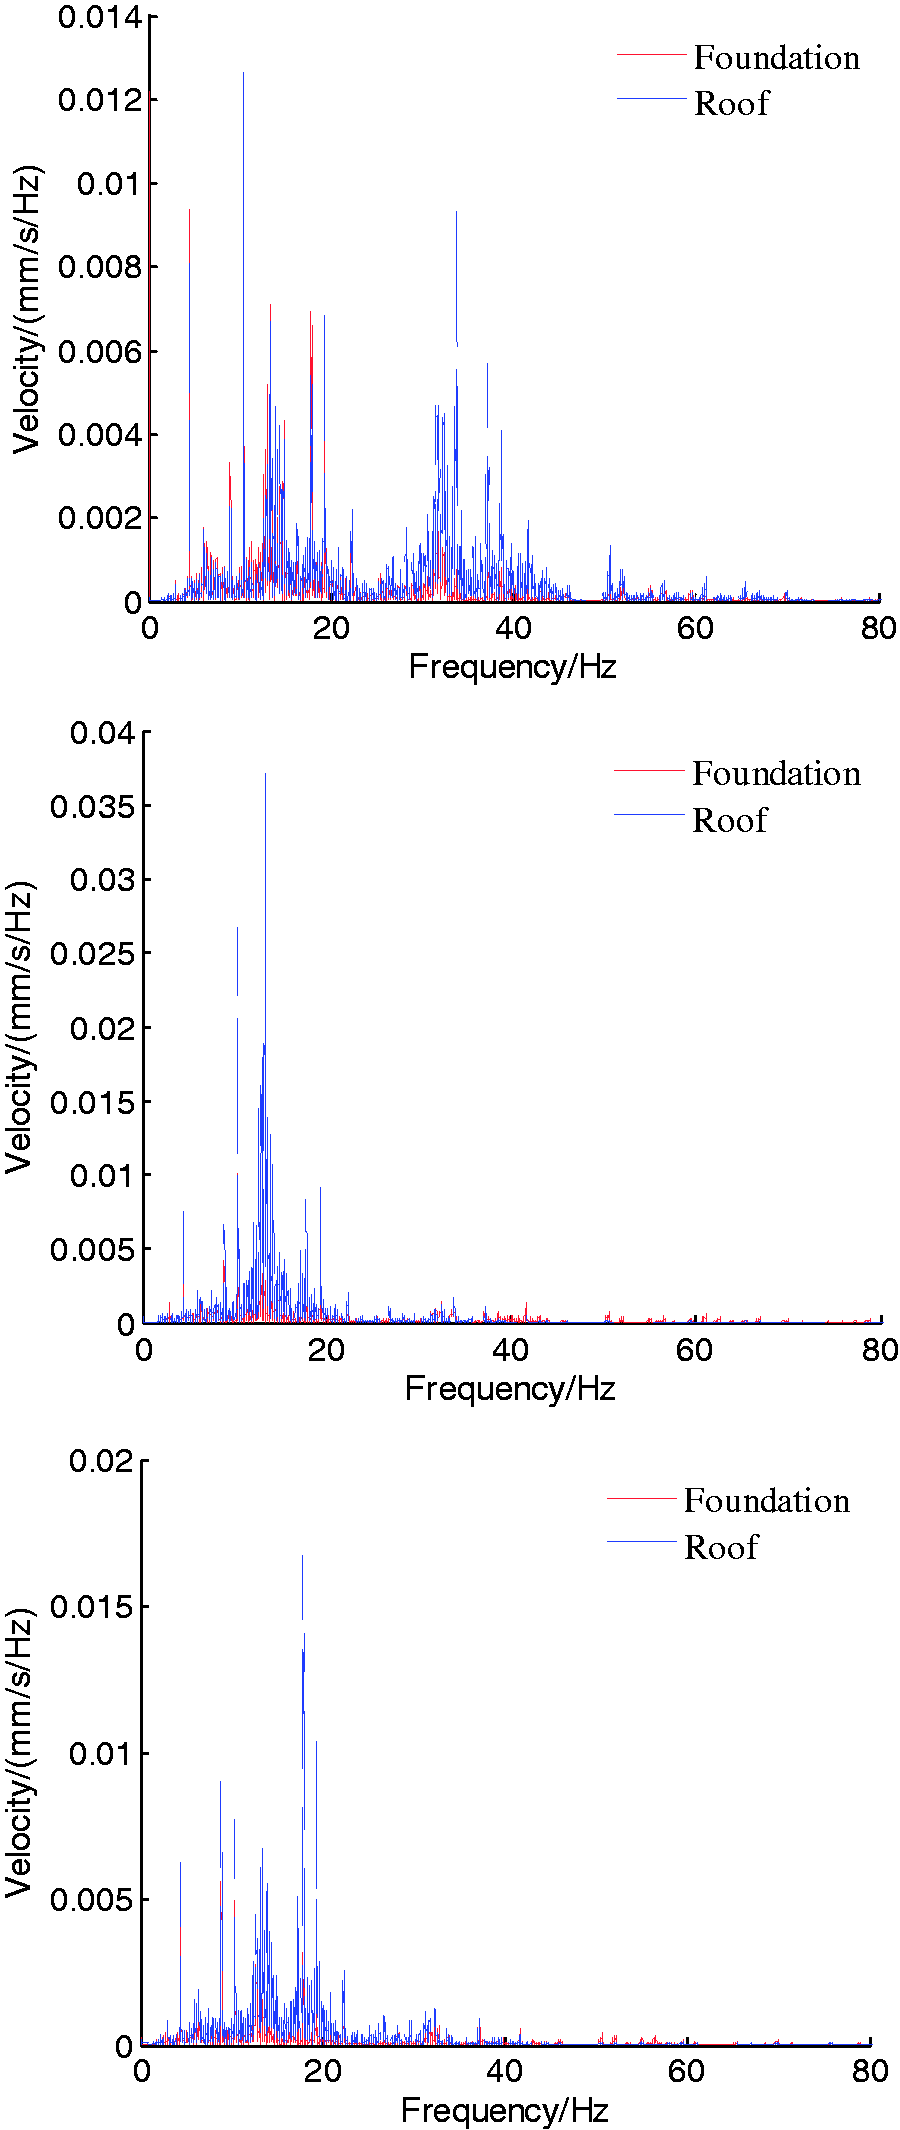
Vibration velocity spectra of the structure on foundation and roof. (a) Vertical; (b) Horizontal; (c) Portrait
The vertical and horizontal vibration acceleration levels (VALs) corresponding to each frequency band are analyzed using one-third octave spectra shown in Figure 15. For all vibrations, the dominant frequency is 20 Hz frequency, and horizontal vibration amplitude on the roof is the largest. In frequency bands below 10 Hz, vertical amplitudes are greater than horizontal amplitudes for both ground points, while the horizontal amplitude is the largest on the roof. But, between 30 Hz and 50 Hz, the vertical amplitude of roof point vibration is the largest, and the vertical amplitude on the ground indoor is the smallest. In frequency bands above 50 Hz, the horizontal amplitude indoor ground turns the largest. It indicates for vibration over 30 Hz, horizontal vibration amplitude is decreased, while vertical amplitude is slightly increased, when elevation is higher. But for vibration below 10 Hz, opposite regulation can be observed. Thus, vibration elevation amplification characteristic is opposite for different vibration components and frequency bands.
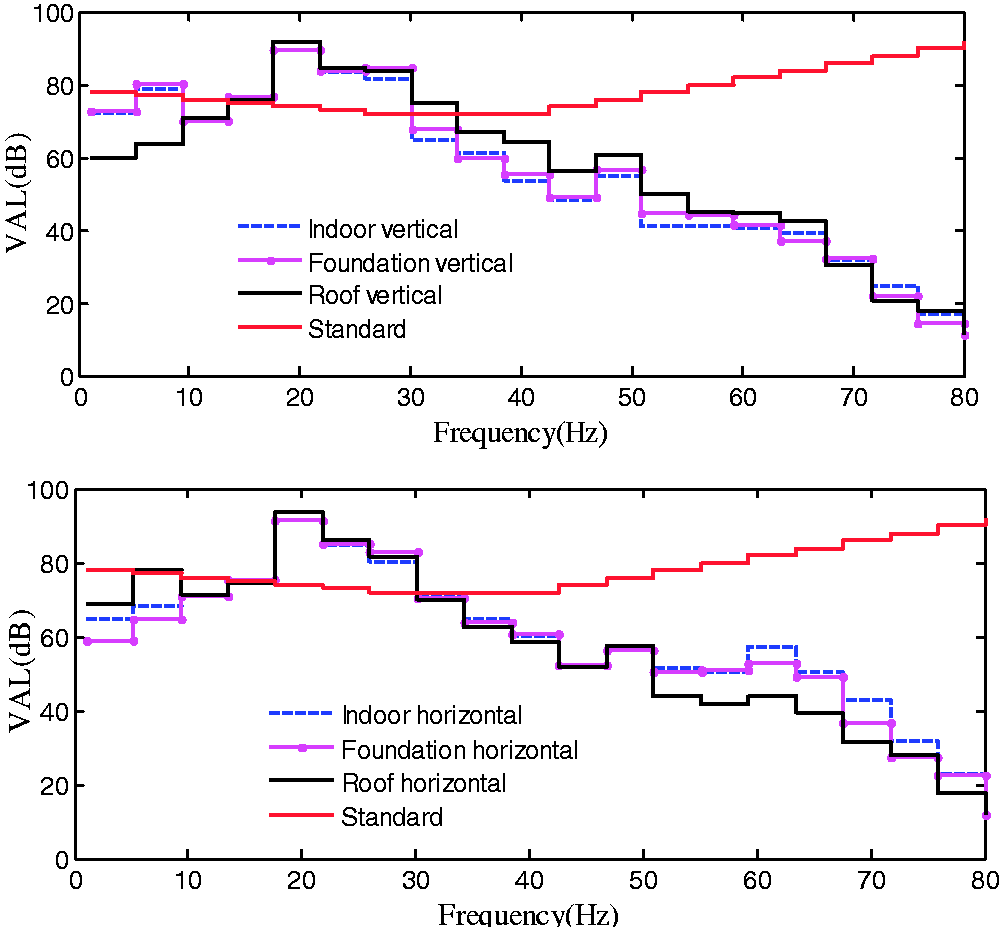
Wave spectra induced by full C80 wagon (dB-ref 10−6 m/s2). (a) Vertical; (b) Horizontal.
Compared with the limit value for human comfort specified by “Residential Building Indoor Vibration Limits and Measurement Methods,” VAL in 20–30 Hz frequency band is over limit, for all monitored points on the structure. Therefore, measures such as isolation lead-rubber bearings should be taken to reduce vibration.
Conclusion
Based on field test in the vicinity of railway viaduct above Shenshan Village, the attenuation of ground vibration induced by heavy freight wagons for coal transportation is studied. And evaluation is conducted on an adjacent house to access vibration disturbance to residents along railway viaduct. Following conclusions can be drawn from analysis of vibration induced by wagons in different speed and freight.
Propagation and attenuation of vibration within 30 m from viaduct axis is studied by analyzing the relationship between peak particle vibration velocity and distance to pier. And regulation function is acquired from regression analysis with a modified Sadovskii formula with high correlation factor, which can be used for predicting ground vibration for specific situations. Vibration induced by low-speed wagons with or without acceleration is dominant in lower frequency than vibration induced by normal speed wagons. With increasing distance to the viaduct, more obvious amplitude reduction is shown within frequency bands between 10 Hz and 35 Hz. Empty wagons also show smaller amplitude in most frequency bands, with most significant difference within 15–25 Hz. Frequency difference is not obvious among empty wagons of different type but is significant for full wagons. House vibration response is dominant around 20 Hz, and the amplitude is much higher on the roof. And vibration reduction for structure should focus on low-frequency part. Vibration elevation amplification characteristic is opposite for different vibration components and frequency bands. For vibration over 30 Hz, when elevation is higher, horizontal vibration amplitude is decreased, while vertical amplitude is slightly increased. But for vibration below 10 Hz, opposite regulation can be observed.
With further studies and validations in the further, it would be possible to conduct reasonable prediction in ground vibration sourced from pier with modified Sadovskii formula. However, more specific influence of freight and speed should be identified in later research.
Footnotes
Declaration of conflicting interests
The author(s) declared no potential conflicts of interest with respect to the research, authorship, and/or publication of this article.
Funding
The author(s) disclosed receipt of the following financial support for the research, authorship, and/or publication of this article: This work supported by the National Natural Science Foundation of China (51378500).