
Abstract
Six years of wind data are used to investigate the statistical characteristics of general and strong winds acting on the Donghai Bridge, a sea-crossing bridge in China. The general wind at the bridge site shows a relatively stable annual repeatability, and the discrepancies are found between the measured wind field parameters and those suggested by the design code. For strong winds, both the 10-min mean wind speed and the turbulent variance greatly exceed those of general winds, while the turbulence intensity, integral length scale, and gust factor do not exhibit any noticeable quantitative trends. The measured wind spectra of both general and strong winds show a shift toward the high-frequency range compared with Simiu’s spectrum (along-wind direction). The wind measurements at the bridge site are easily interfered with the bridge structure itself, resulting in a greater turbulence along the bridge axis and a higher turbulent kinetic energy in the high-frequency range, which needs to be considered in designing structural health monitoring systems in the future. This study provides field evidence for the wind-resistant design and evaluation of long-span sea-crossing bridges.
Introduction
Wind is one of the dominant loads on large-span flexible structures. 1 The research on wind-induced vibrations of bridges is becoming more important with the continuous emergence of bridges with new record-span lengths.2–5 For example, flutter determines structural safety under high-speed winds; vortex-induced oscillations greatly influence bridge performance in low-speed winds; and buffeting can influence bridge fatigue even under normal wind conditions. Therefore, wind resistance safety assessment is critical for both the design and operation of large-span bridges. With the development of structural health monitoring (SHM) technologies, many bridges are fitted with structural health monitoring systems (SHMSs),1,3,6 and the monitoring of wind conditions and wind-induced vibrations is an important aspect of such systems. If proper methods are applied, and the measured data are accurate and reliable, field measurement is often the most effective tool for determining on-site wind characteristics at a bridge site. It also provides more accurate wind-induced responses of full-scale bridges than numerical simulation or wind tunnel tests. Field measurement is not suitable for studying the mechanisms underlying specific phenomena because of disadvantages, such as susceptibility to interference of various unknown factors, a high degree of randomness, and a limited number of measurement points. However, massive amounts of long-term, real-time monitoring data can be used to analyze the statistical relationships between variables and verify the theoretical calculations and wind tunnel test results.
In recent years, research on wind resistance of bridges based on SHM data has attracted an increasing amount of attention all around the world. A series of on-site observations of general and extreme winds were conducted at the sites of the Runyang Yangtze River Bridge7,8 and the Sutong Yangtze River Bridge, 9 and the wind spectra in Eastern China obtained by these studies were compared with those suggested in the corresponding codes. 10 Furthermore, the wind-induced vibrational responses of the main girders and towers of such large-span cable-stayed bridges were analyzed. 11 As to the full-scale measurements of wind fields and wind effects, other case studies include the Tsing Ma Suspension Bridge, 12 Dongting Lake Bridge, 13 Xihoumen Suspension Bridge, 14 Hangzhou Jiubao Bridge, 15 Akashi Kaikyo Bridge, 16 Hakucho Bridge, 17 Fred Hartman Bridge, 18 and so on. Note that the aforementioned bridges are all located inland or onshore.
Each bridge has a unique structure and near-ground wind characteristics. As a result, wind-related phenomena may vary greatly among different bridges. Hence, field measurement is the most straightforward and effective way to detect the behavior of a bridge under wind loads. This study focuses on the on-site wind characteristics of the Donghai Bridge in the East China Sea based on up to six years of field monitoring data, whereas the wind-induced vibration will be covered in another paper. The Donghai Bridge, which is the first off-shore, sea-crossing bridge in China, is located in the typhoon-prone area of the northwestern Pacific Ocean. Research on this bridge is extremely valuable because of the distinct wind characteristics at the bridge site compared with the ordinary inland bridges, which can provide important reference information for a wind-resistant design and evaluation of bridges in the southeast coastal region of China. Meanwhile, the influence of the bridge itself on the measured flow is observed from this long-term monitoring, and it gives precious clues on how to improve the performance of monitoring system. Additionally, the Donghai Bridge is close to a 102 MW offshore wind farm, namely, the Donghai Bridge Wind Farm. The field measurements herein could also serve as a reference for the health monitoring of wind turbines in this wind farm, which has been an increasingly hot topic recently.19,20
The next section presents a brief introduction to the studied bridge structure and its SHMS. The subsequent sections discuss the characteristics of general and strong winds at the Donghai Bridge site, respectively. General wind is discussed based on field monitoring data from 2007 to 2012, and strong wind is discussed using data from the five strongest typhoons and one short-lived intense convective weather event during 2007 to 2012. The last section presents a summary of the paper.
Engineering background
The Donghai Bridge is a super infrastructure that links the Luchao Port to the Yangshan deep-water container port in the East China Sea. It has a total length of approximately 32.5 km, including a main navigable span formed by a two-tower, single-cable-plane, cable-stayed bridge with a 420-m span and steel-concrete composite girders (Figure 1). The main girder, which is a flat closed-box girder that is 33 m wide and 4 m tall, is oriented in an approximately north–south direction (Figure 2).
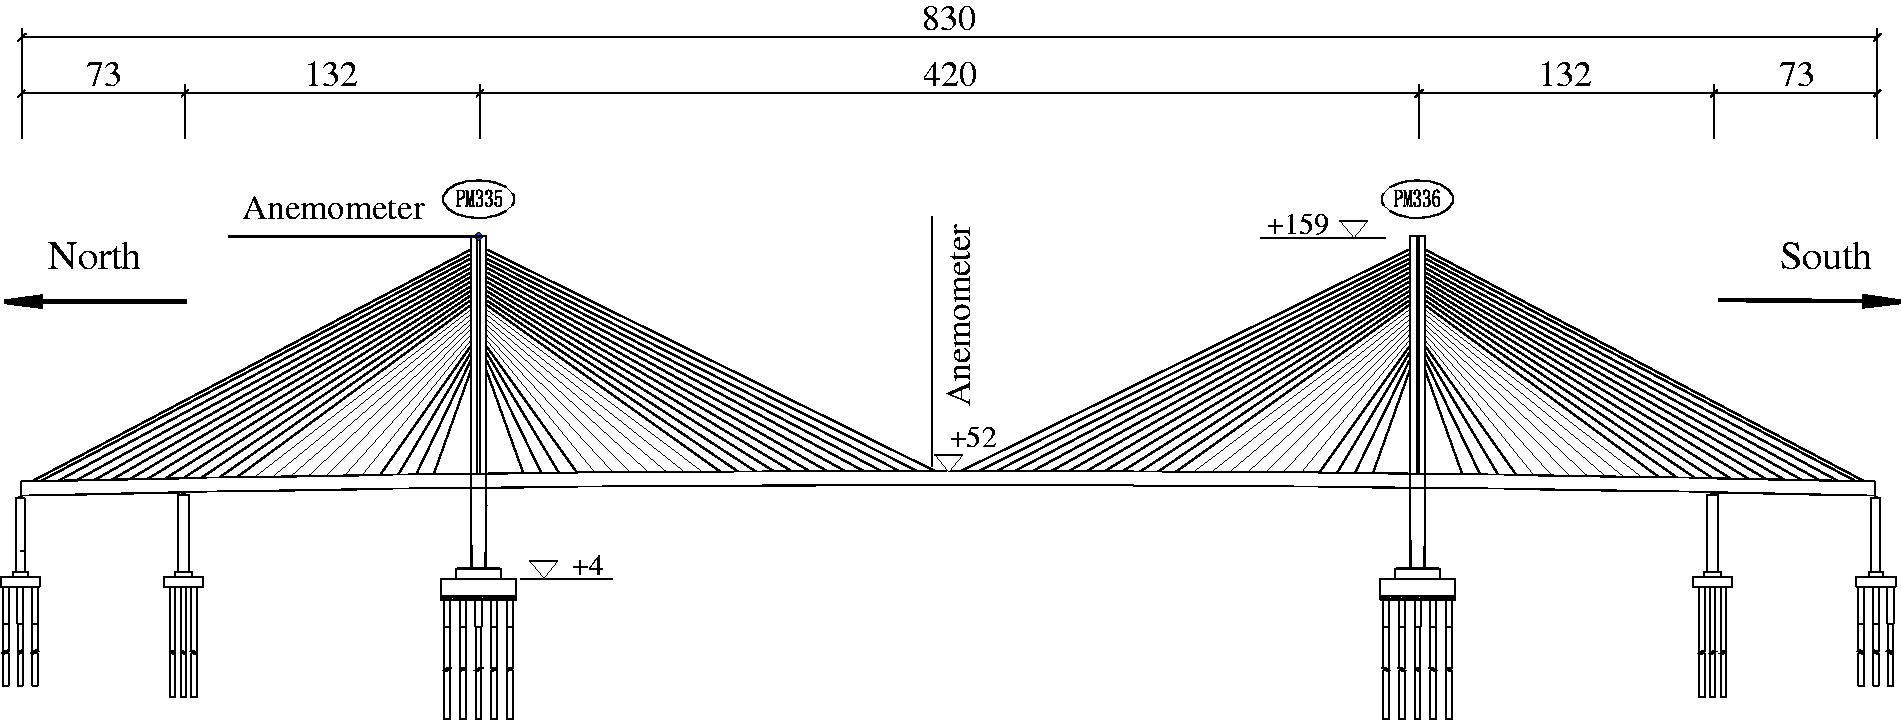
Side view of the Donghai Bridge and arrangement of anemometers (unit: m).
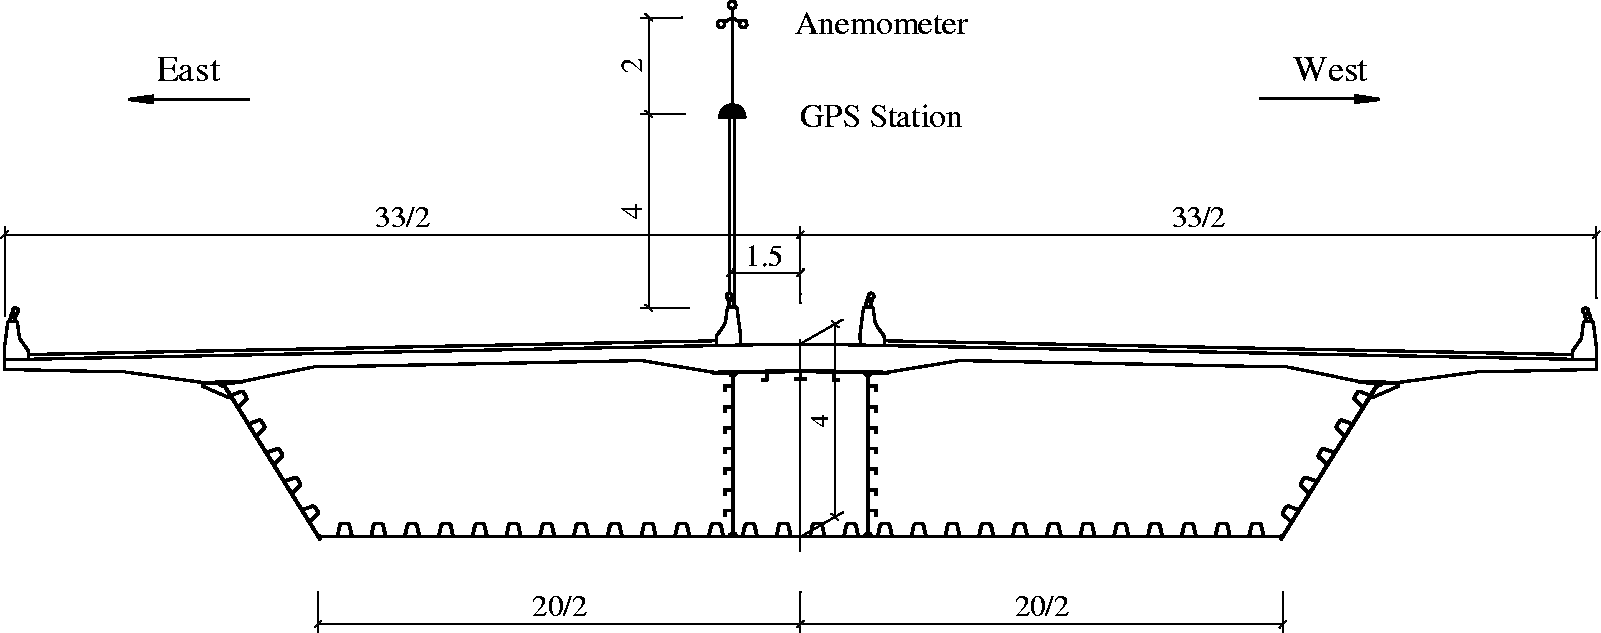
Cross section at the mid-point of the main span (unit: m).
The SHMS of the Donghai Bridge was assembled and put into operation in September 2006. It measures real-time static and dynamic responses (e.g. vibrational acceleration, displacement, and strain), dynamic characteristics (e.g. modal frequencies and mode shapes), and environmental/operational actions (e.g. atmospheric temperature and humidity, wind field, and structural temperature field). The wind field monitoring subsystem is composed of two anemometers: one in the middle of the main span and one on the top of the north tower (Figure 3), both of which can measure wind speed and direction in the horizontal plane at a sampling frequency of 1 Hz with a start-up wind speed of 0.4 m/s. The anemometer on the top of the tower, including the height of the supporting rod, is 0.5 m above the bridge structure, while the anemometer on the bridge deck is 6.0 m above the deck. The vast amount of monitoring data recorded by them provides a solid basis for this study.
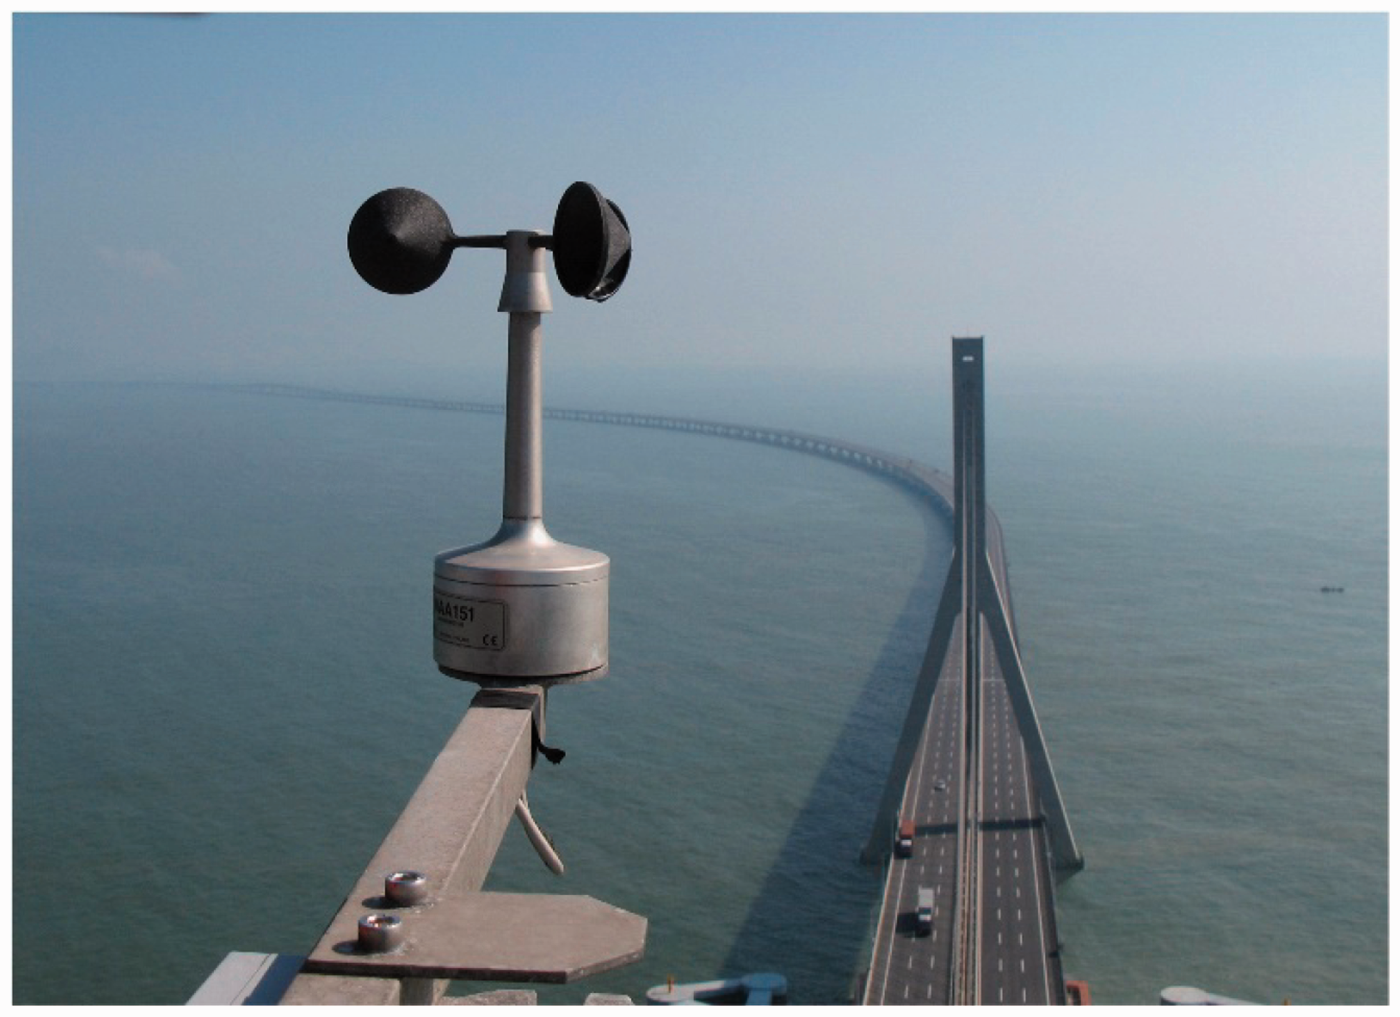
Tower-top anemometer.
Characteristics of general wind
Wind direction and wind speed data at the Donghai Bridge during 2007–2012 are used to analyze the average wind characteristics and turbulent wind characteristics at the bridge location. The measured parameters are then compared with the values recommended in China’s “Wind-Resistant Design Specification for Highway Bridges”
21
(hereinafter referred to as the Code) or the assumed design values.
22
After removal of obvious outliers in the wind speed and direction measurements, a vector decomposition method is used
23
with 10-min averaging time intervals to obtain 10-min mean wind speed
Wind direction frequency
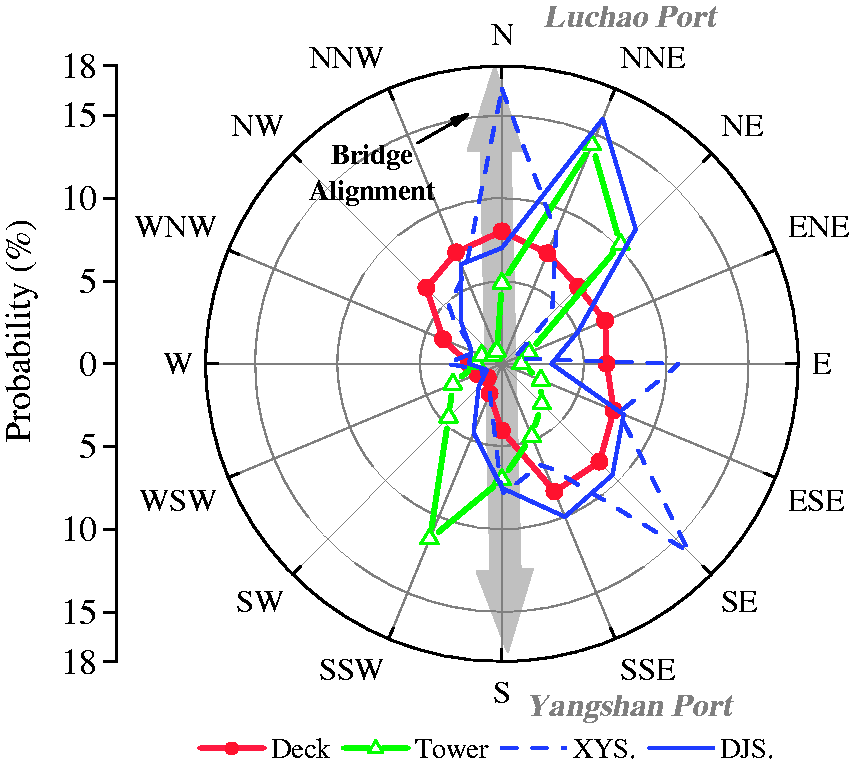
Figure 4 shows the wind roses at the top of tower and at the bridge deck according to the six-year mean wind data. 24 Clearly, there is a difference in the prevailing wind direction between the two measurement locations. This might be attributed to the deflection of near-ground wind or, more likely, to the changes in the wind field at the top of the tower and at the bridge deck caused by the bridge structure itself. Therefore, a reasonable evaluation of the disturbance of the bridge structure on the wind field is critical for determining the “true” winds. However, this is not the topic of focus in the present study.
Measured wind frequencies versus design values.
Prior to the construction of the Donghai Bridge, the designers assessed the wind characteristics at the bridge location using the wind speed and wind direction data from the weather stations in Dajishan and Xiaoyangshan, which are approximately 21 km and 12 km away from the main navigable span of the bridge, respectively. Figure 5 shows the position relationships between the two stations and the mid-span of the Donghai Bridge. The Dajishan and Xiaoyangshan weather stations are 81.00 m and 32.90 m above sea level, respectively. Figure 4 presents the wind roses at the Dajishan weather station (denoted as “DJS”) and the Xiaoyangshan weather station (denoted as “XYS”) 22 included in the design document. Although the northeast (NE) wind frequency at the tower top is consistent with that measured at the Dajishan weather station, the overall wind frequency characteristics remarkably differ among the three measurement locations. Clearly, the wind characteristics at the two points 20 km apart in this sea area do not show a close correlation.
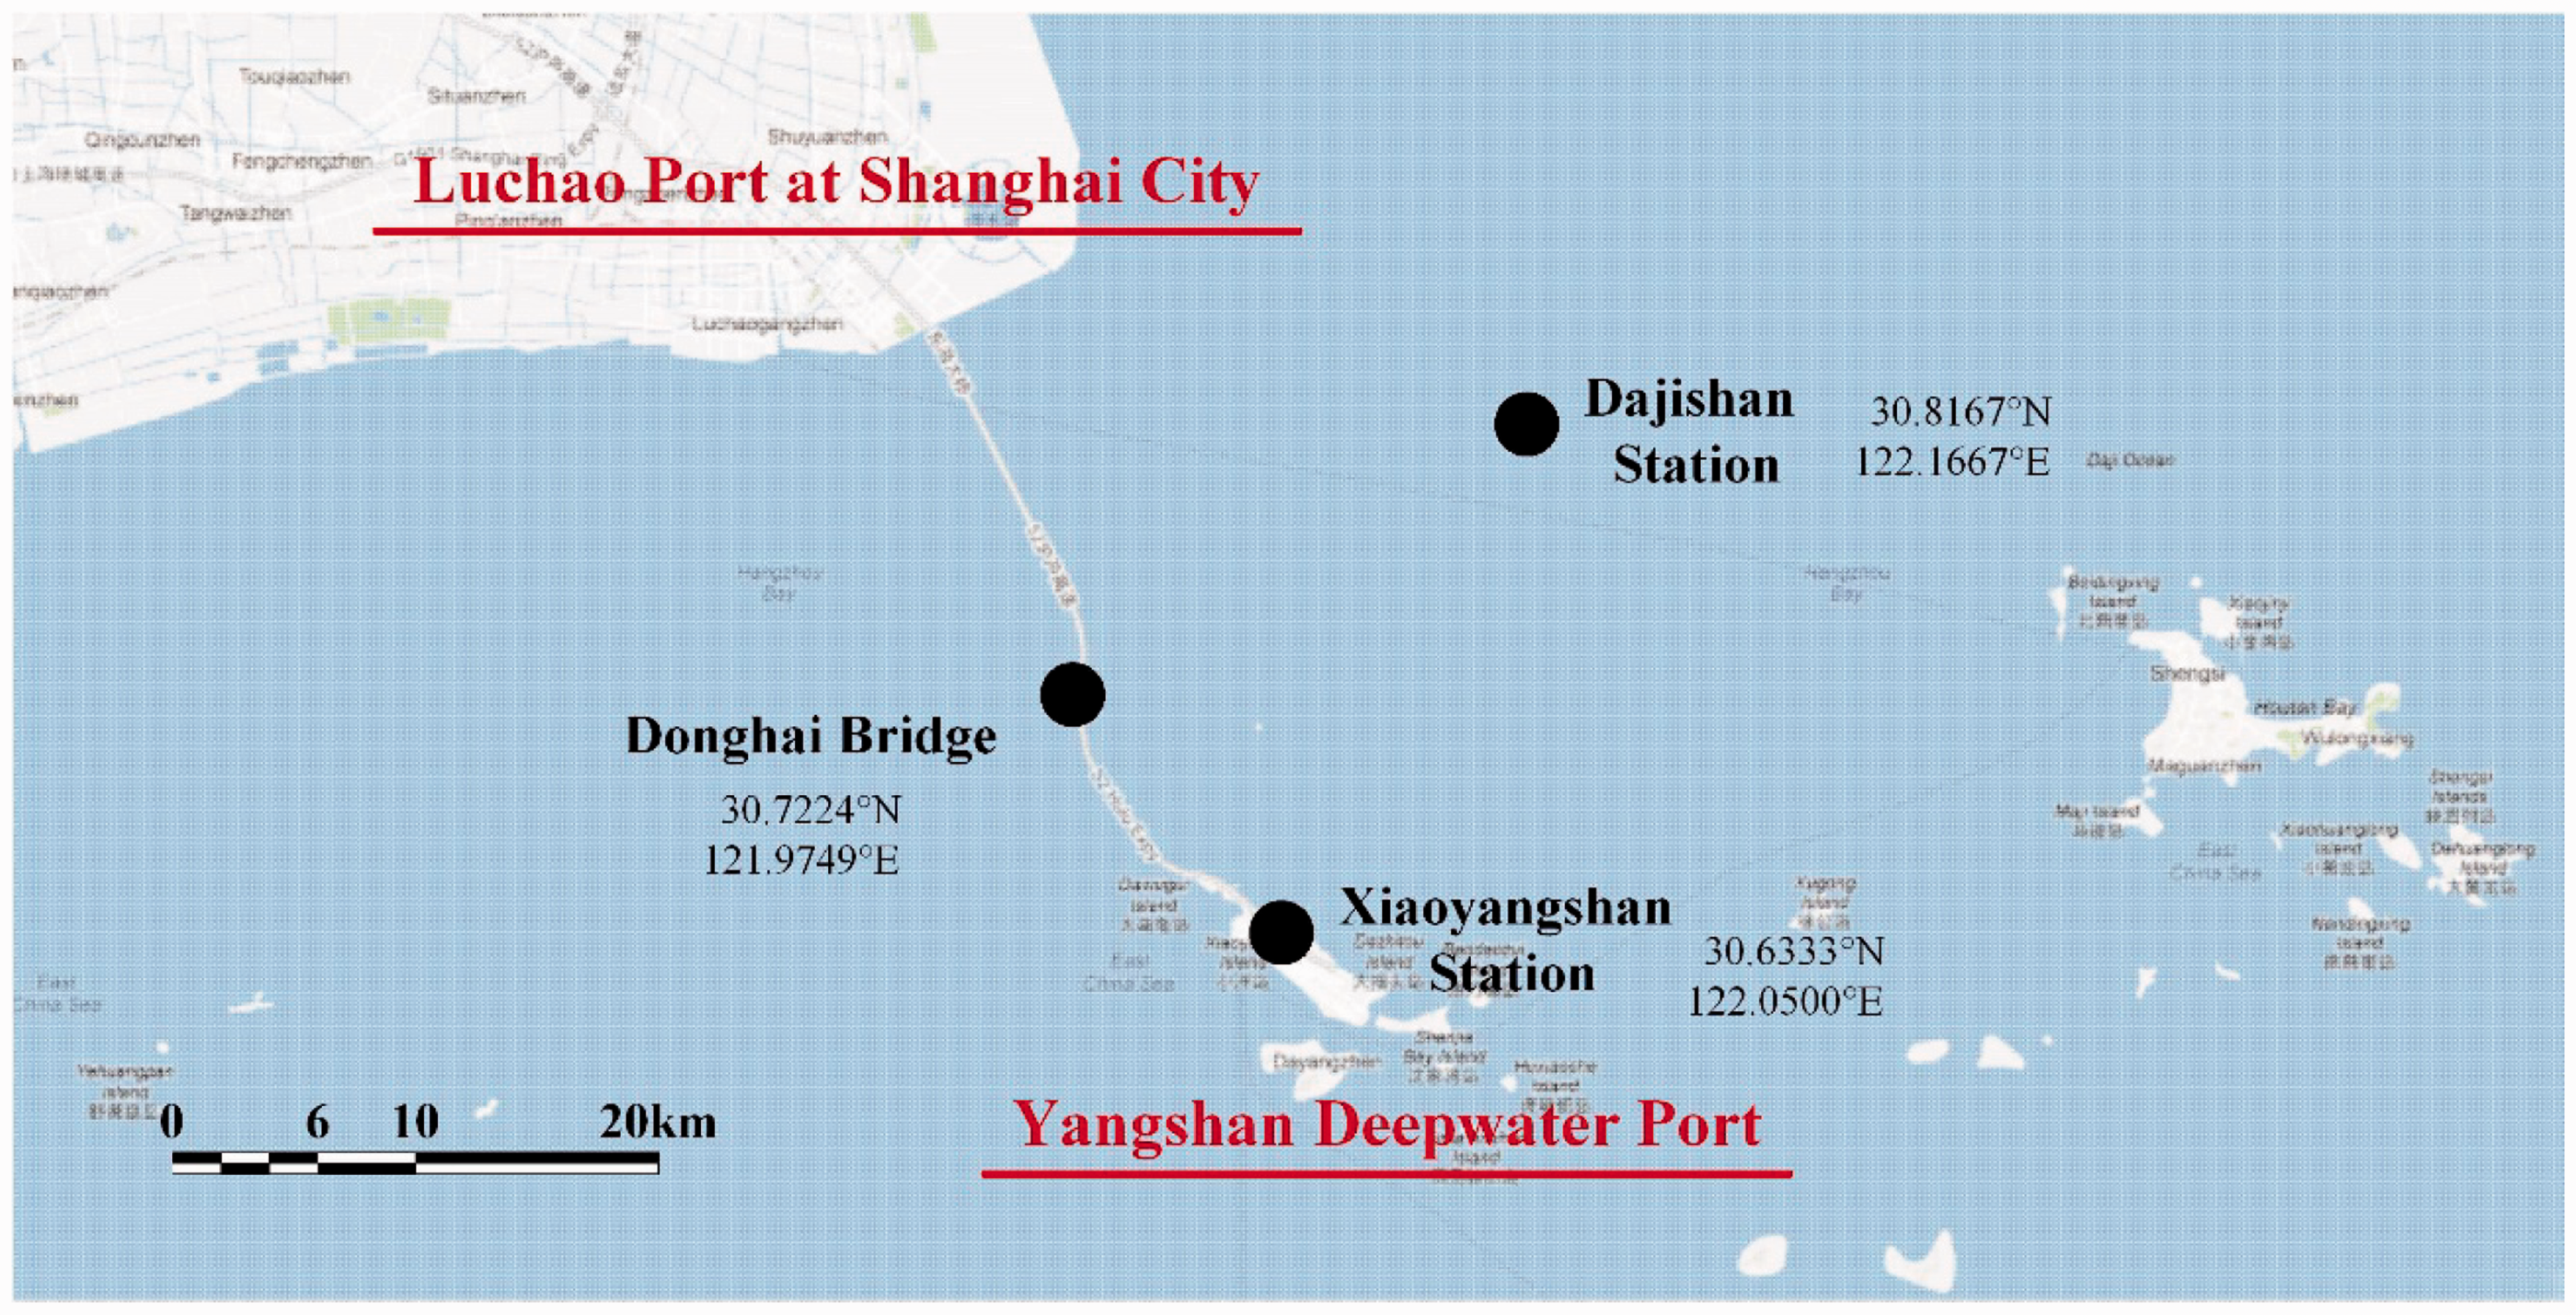
Map of the wind monitoring stations.
Mean wind profile
Using the data from the tower top and the bridge deck valid during the same time intervals, the mean wind profile is estimated based on the power-law profile recommended in the Code.
21
The 10-min mean wind speeds at the bridge deck (

Considering the main girder as the focus for structural evaluation, for simplicity’s sake, the section below discusses only the wind conditions at the bridge deck.
Mean wind speed distribution
Figure 6 shows a histogram of 10-min mean wind speed at the bridge deck, which closely resembles a Weibull distribution. The Weibull distribution is commonly used for wind speed fitting and is only suitable for random variables that are always positive. Its probability density function is

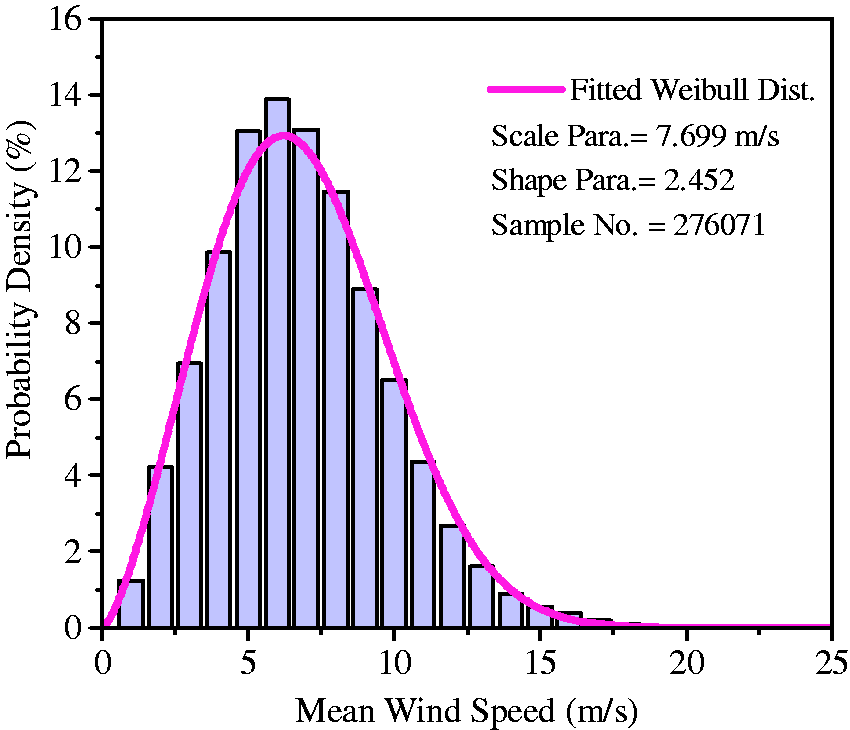
Histogram of the mean wind speed at the bridge deck.
Annual repeatability of winds
Figures 7 and 8 show the wind roses of the 10-min mean wind and the daily maximum 10-min mean wind at the bridge deck for each year, respectively. The former represents the distribution of all wind speed data, while the latter shows the data distribution of strong winds. It is worth noting that the radial length of each plot in the wind rose is proportional to the percentage of the data samples for a given wind speed and direction in the total number of data samples, while the tangential length of the plots enhances visualization, but is, otherwise, meaningless. The wind speed groups in Figures 7 and 8 are based on the Beaufort wind scale
25
without height modification. In Figure 7, 0–7.9, 8.0–13.8, and
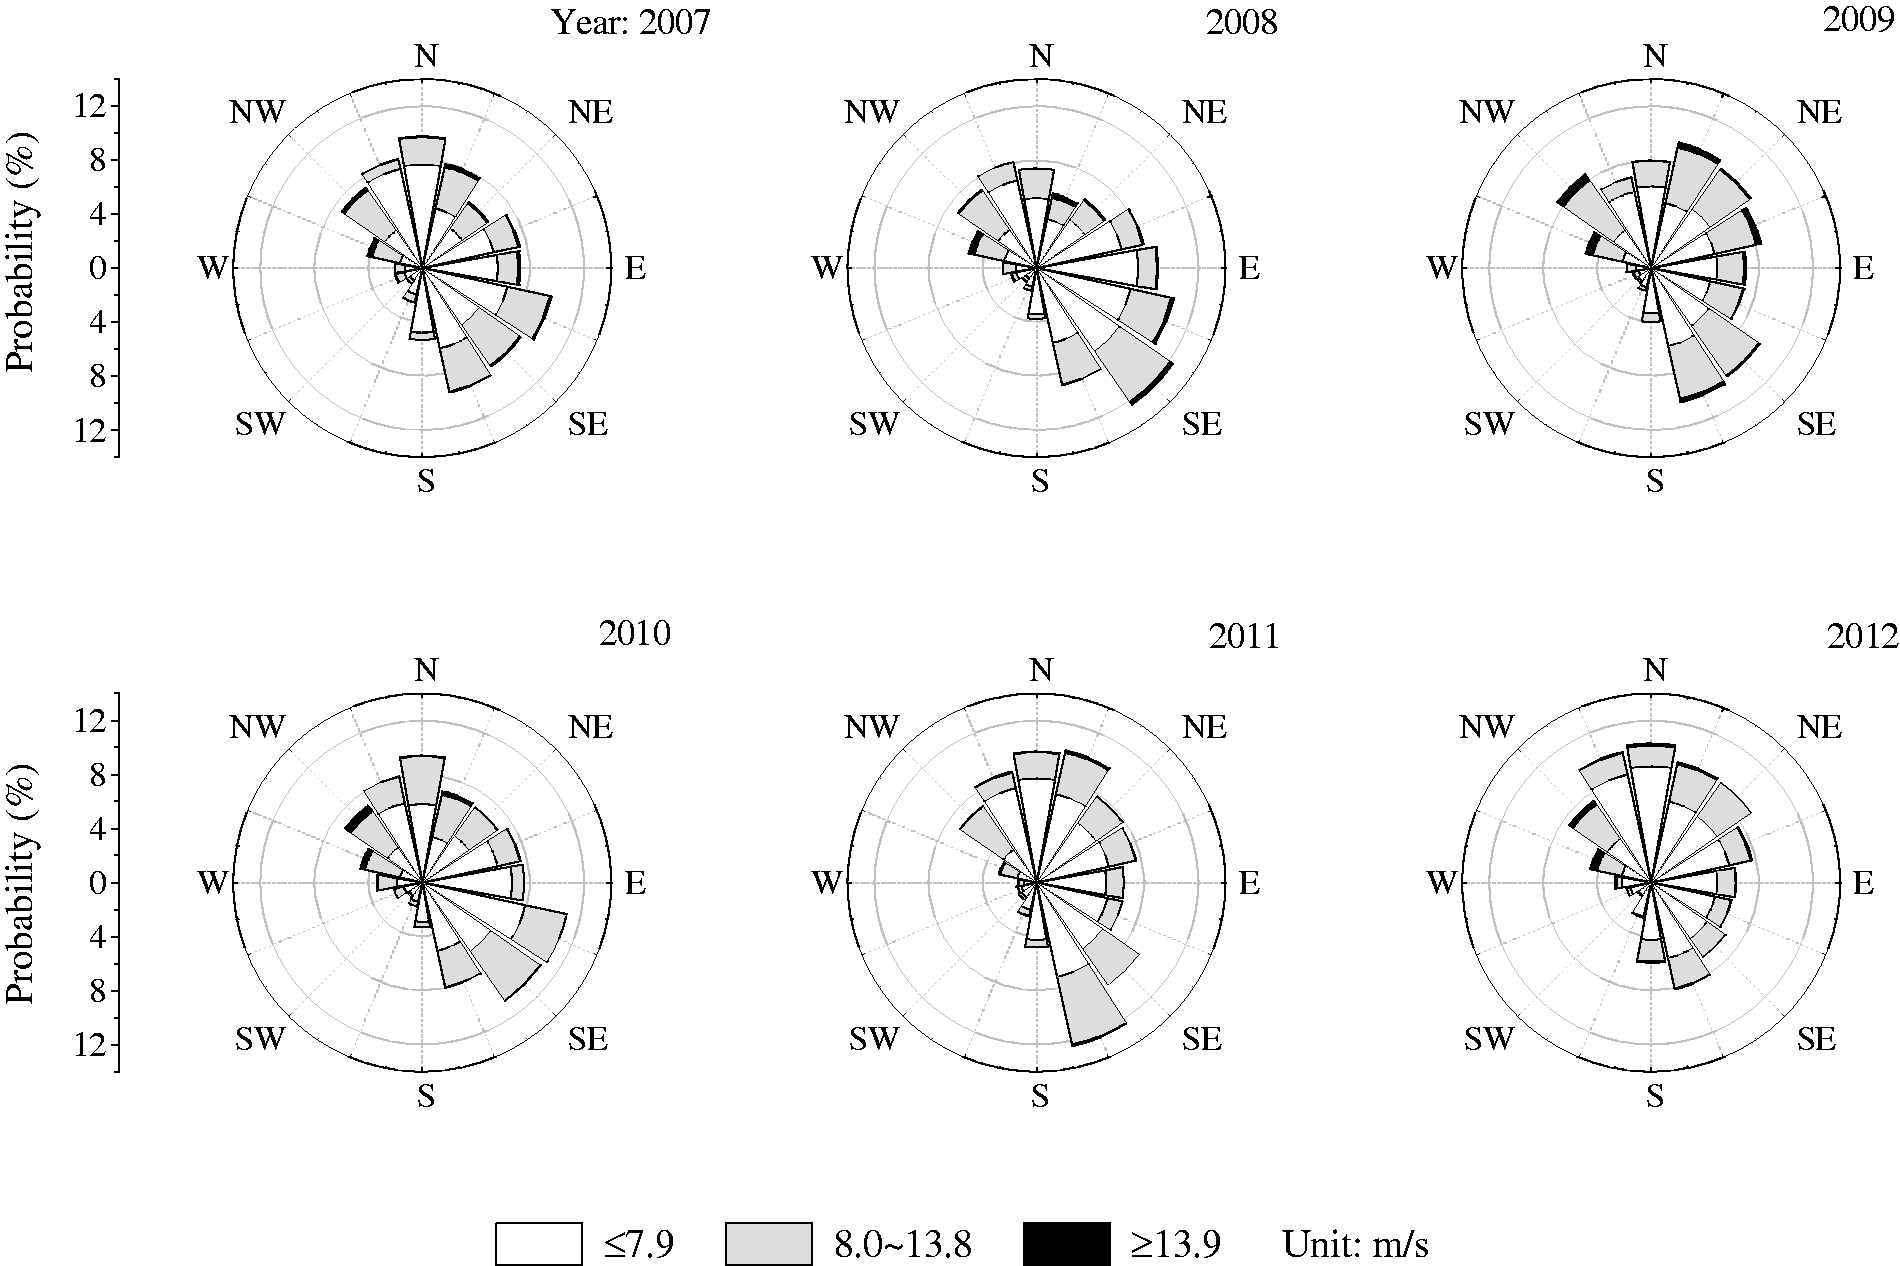
Mean wind roses for each year at the bridge deck.
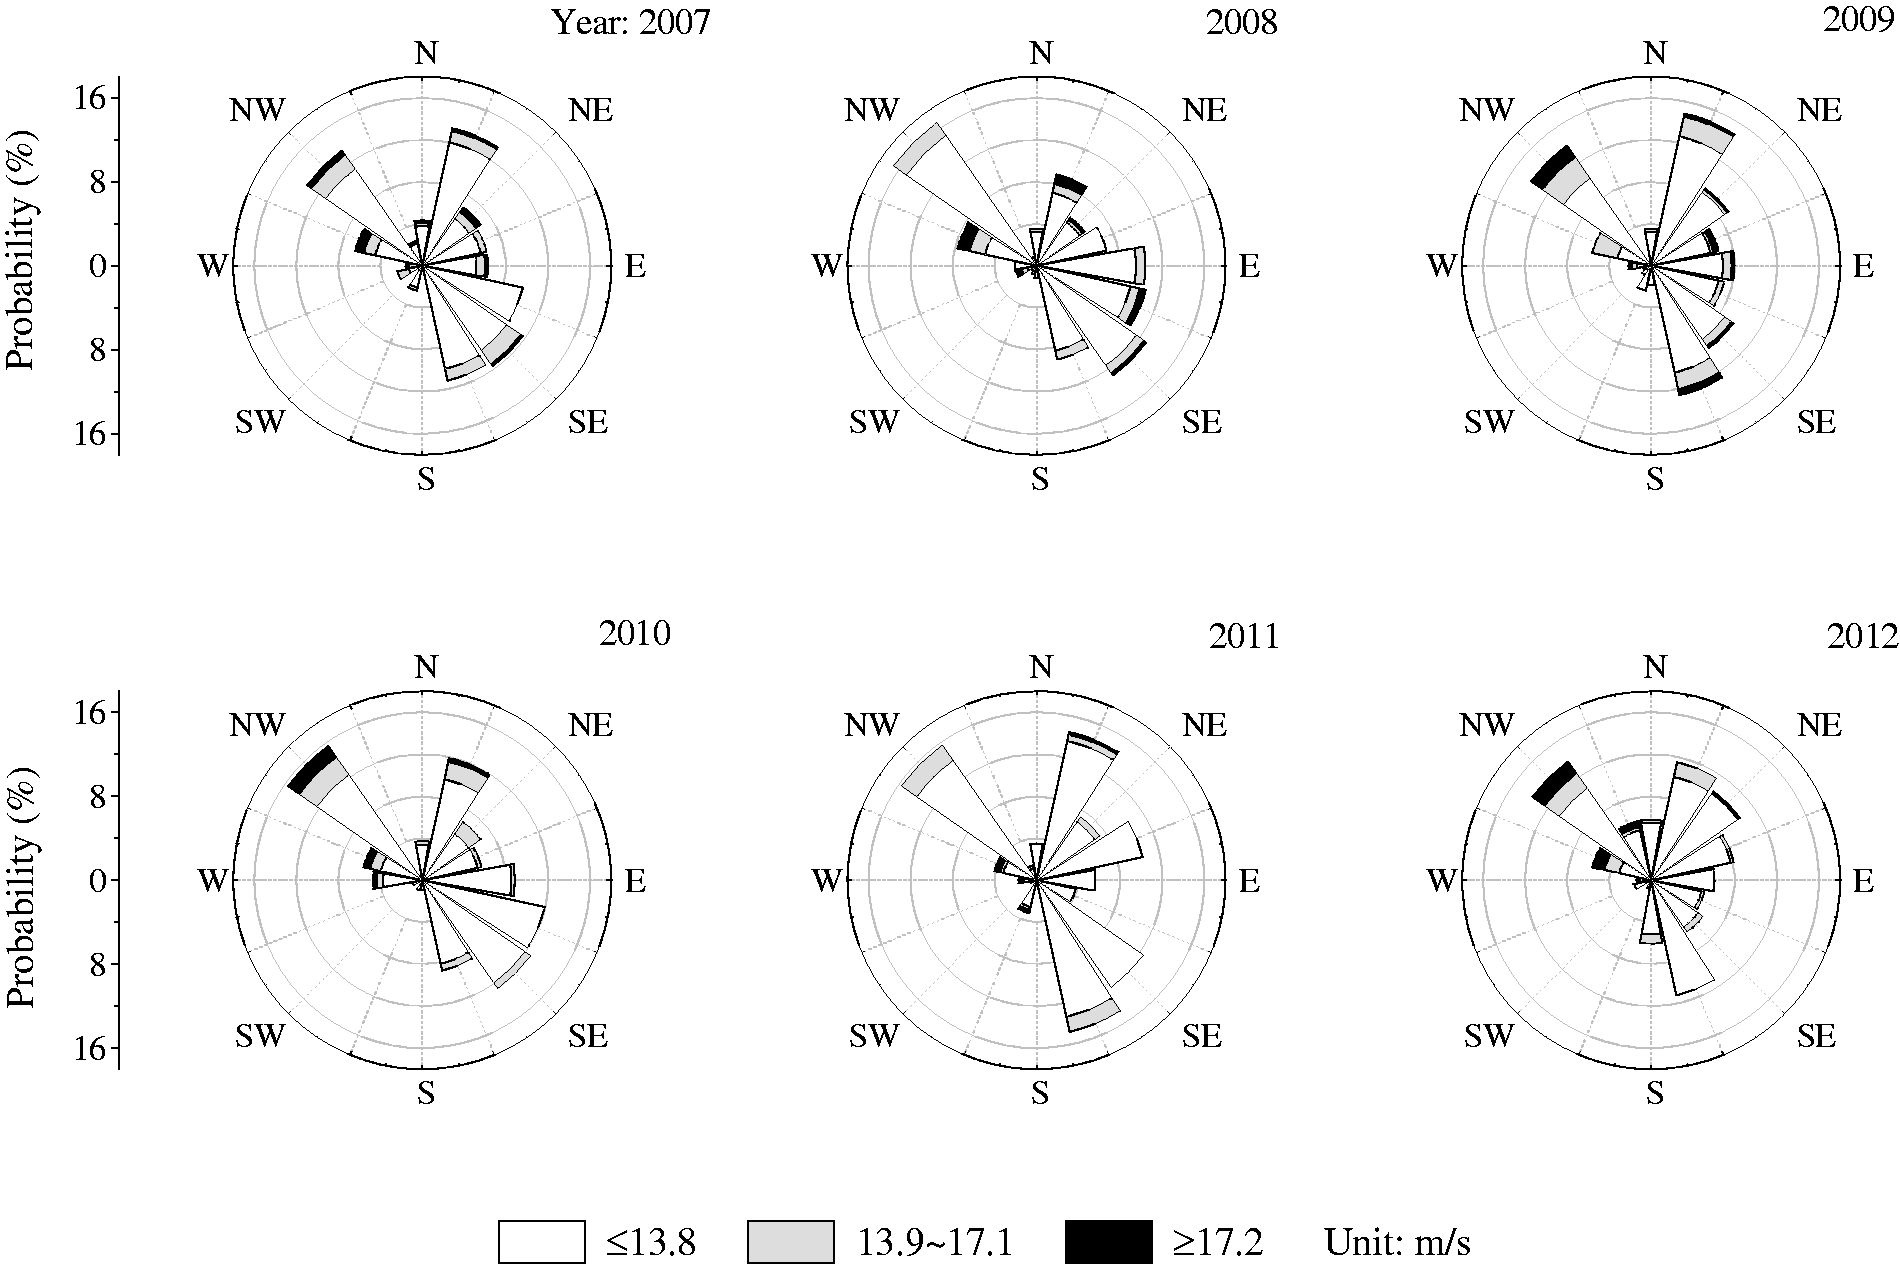
Daily maximum 10-min mean wind roses for each year at the bridge deck.
Turbulence intensity and integral length scale of fluctuating winds
Turbulence intensity and integral length scale are two important parameters describing wind pulsation. Turbulence intensity I is defined as the ratio of the standard deviation of the fluctuating wind speed to the mean wind speed in the 10-min averaging period

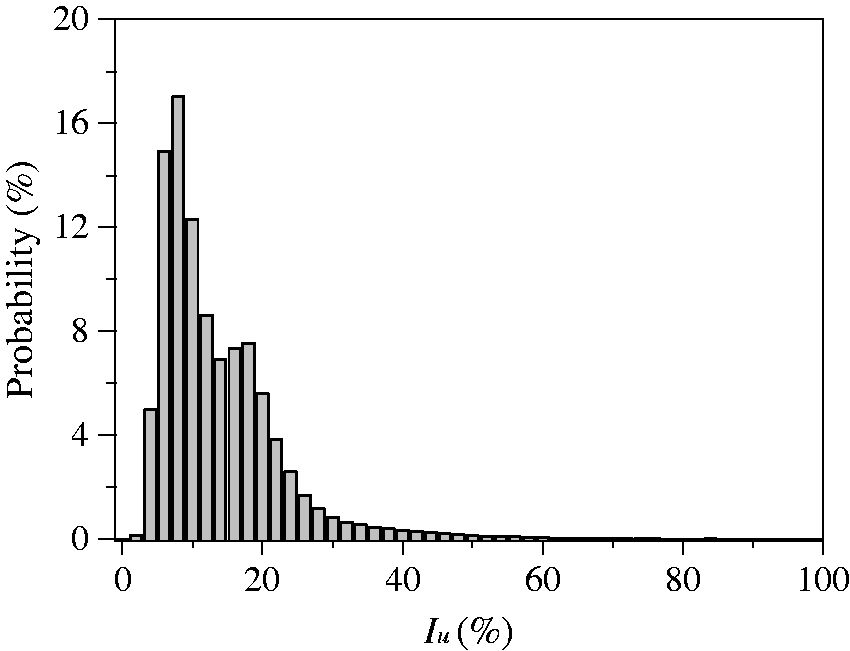
Distribution of
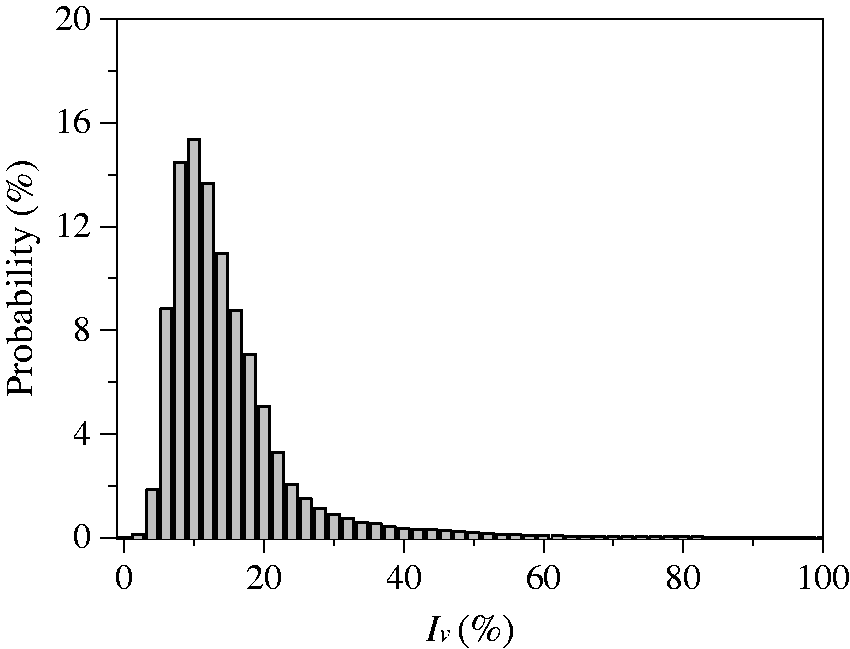
Distribution of
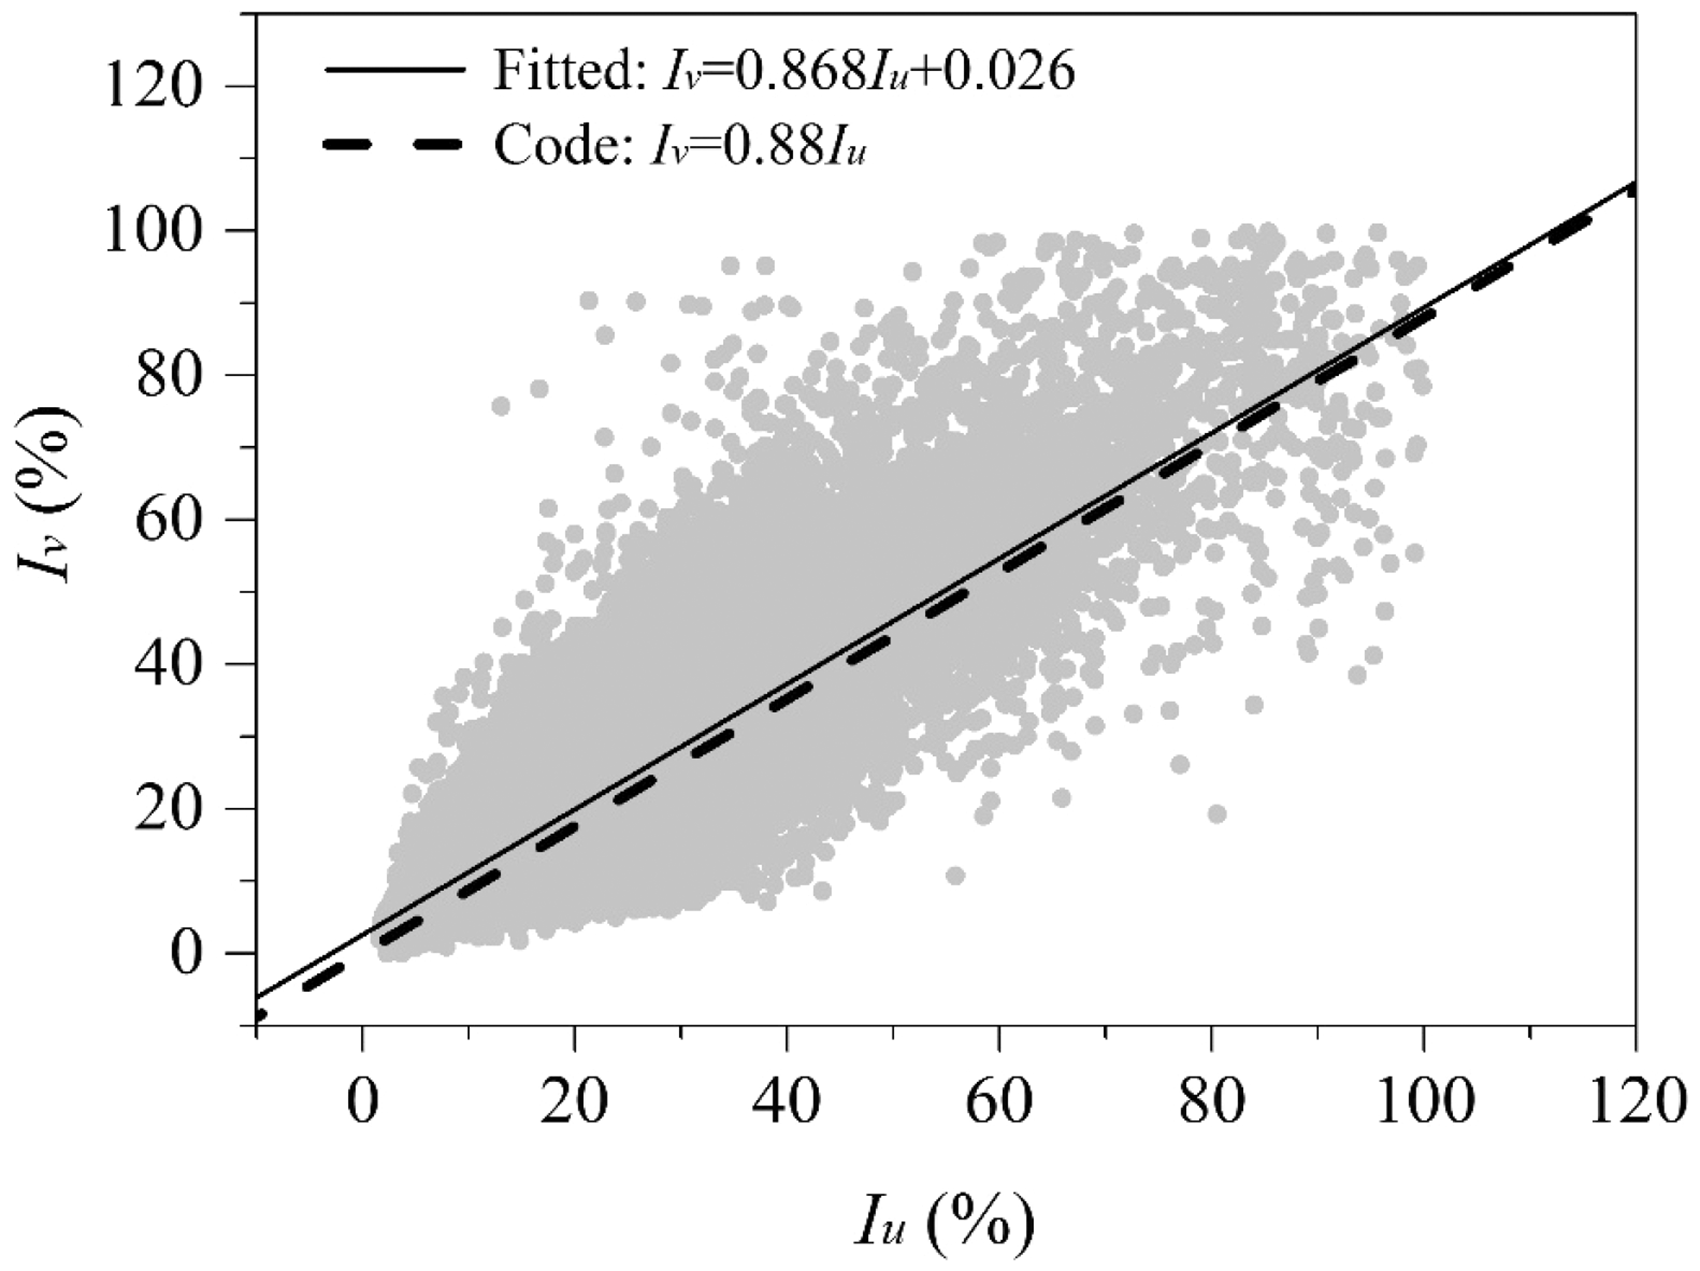
Scatter plot of
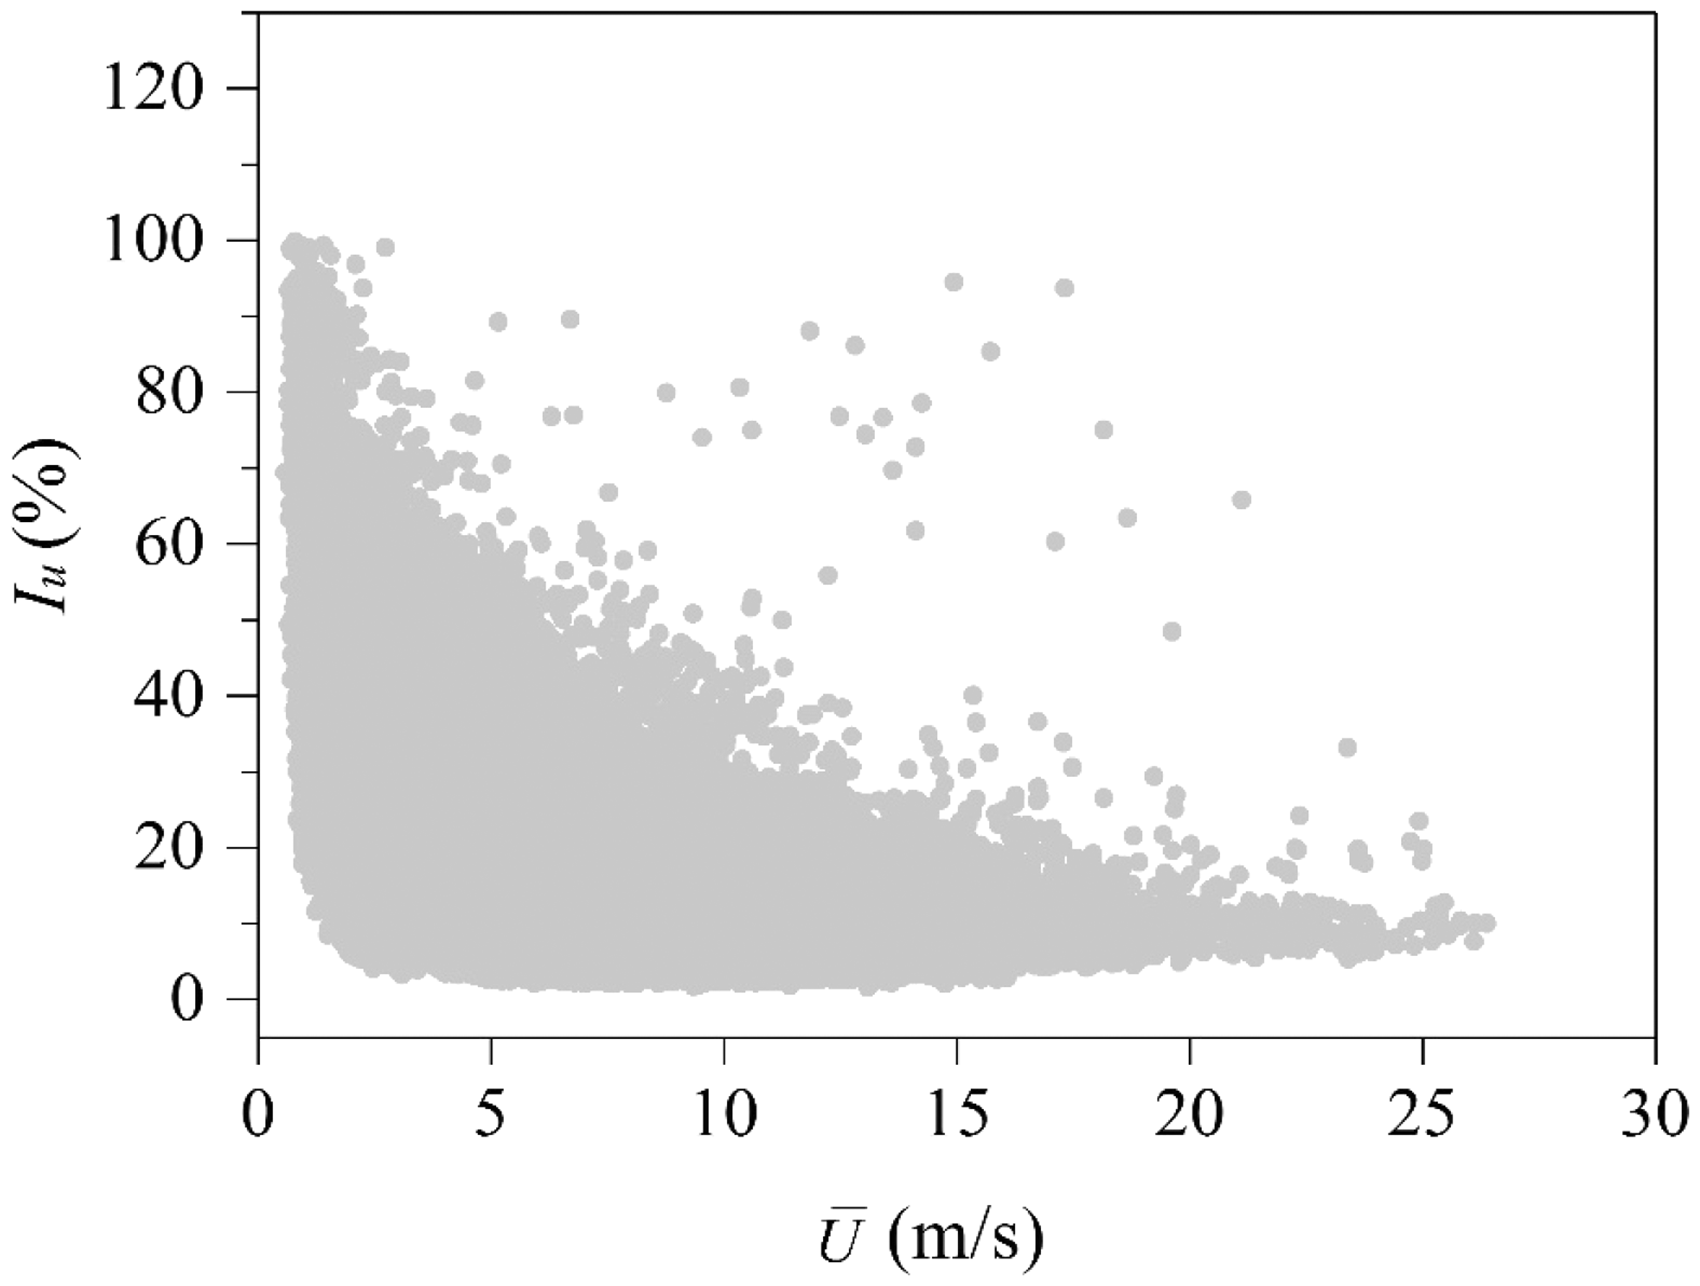
Scatter plot of
The turbulent integral length scale reflects the average size of vortices in a fluctuating wind and is defined as follows


During the calculation,
Figures 13 and 14 show the distributions of the turbulent integral length scales at the height of the bridge deck. The measured average
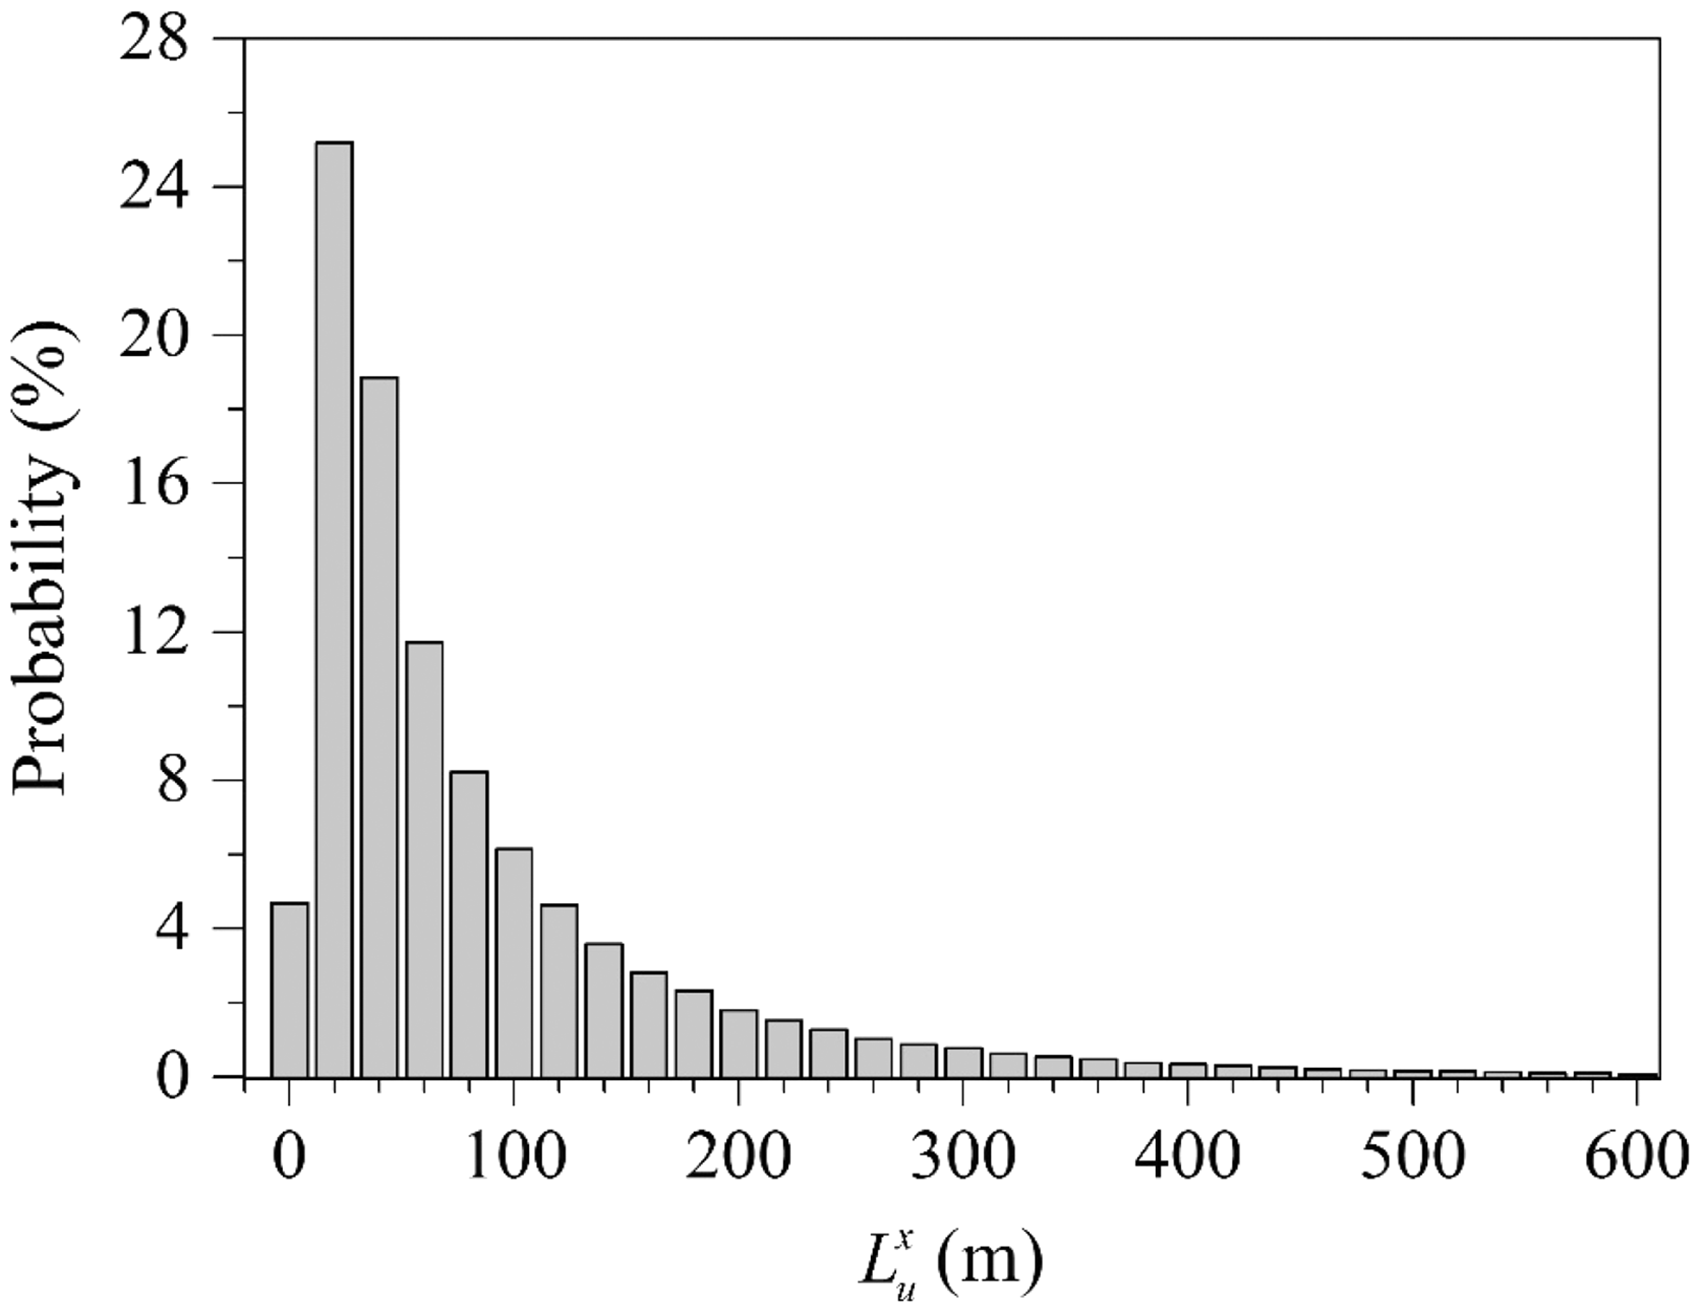
Distribution of
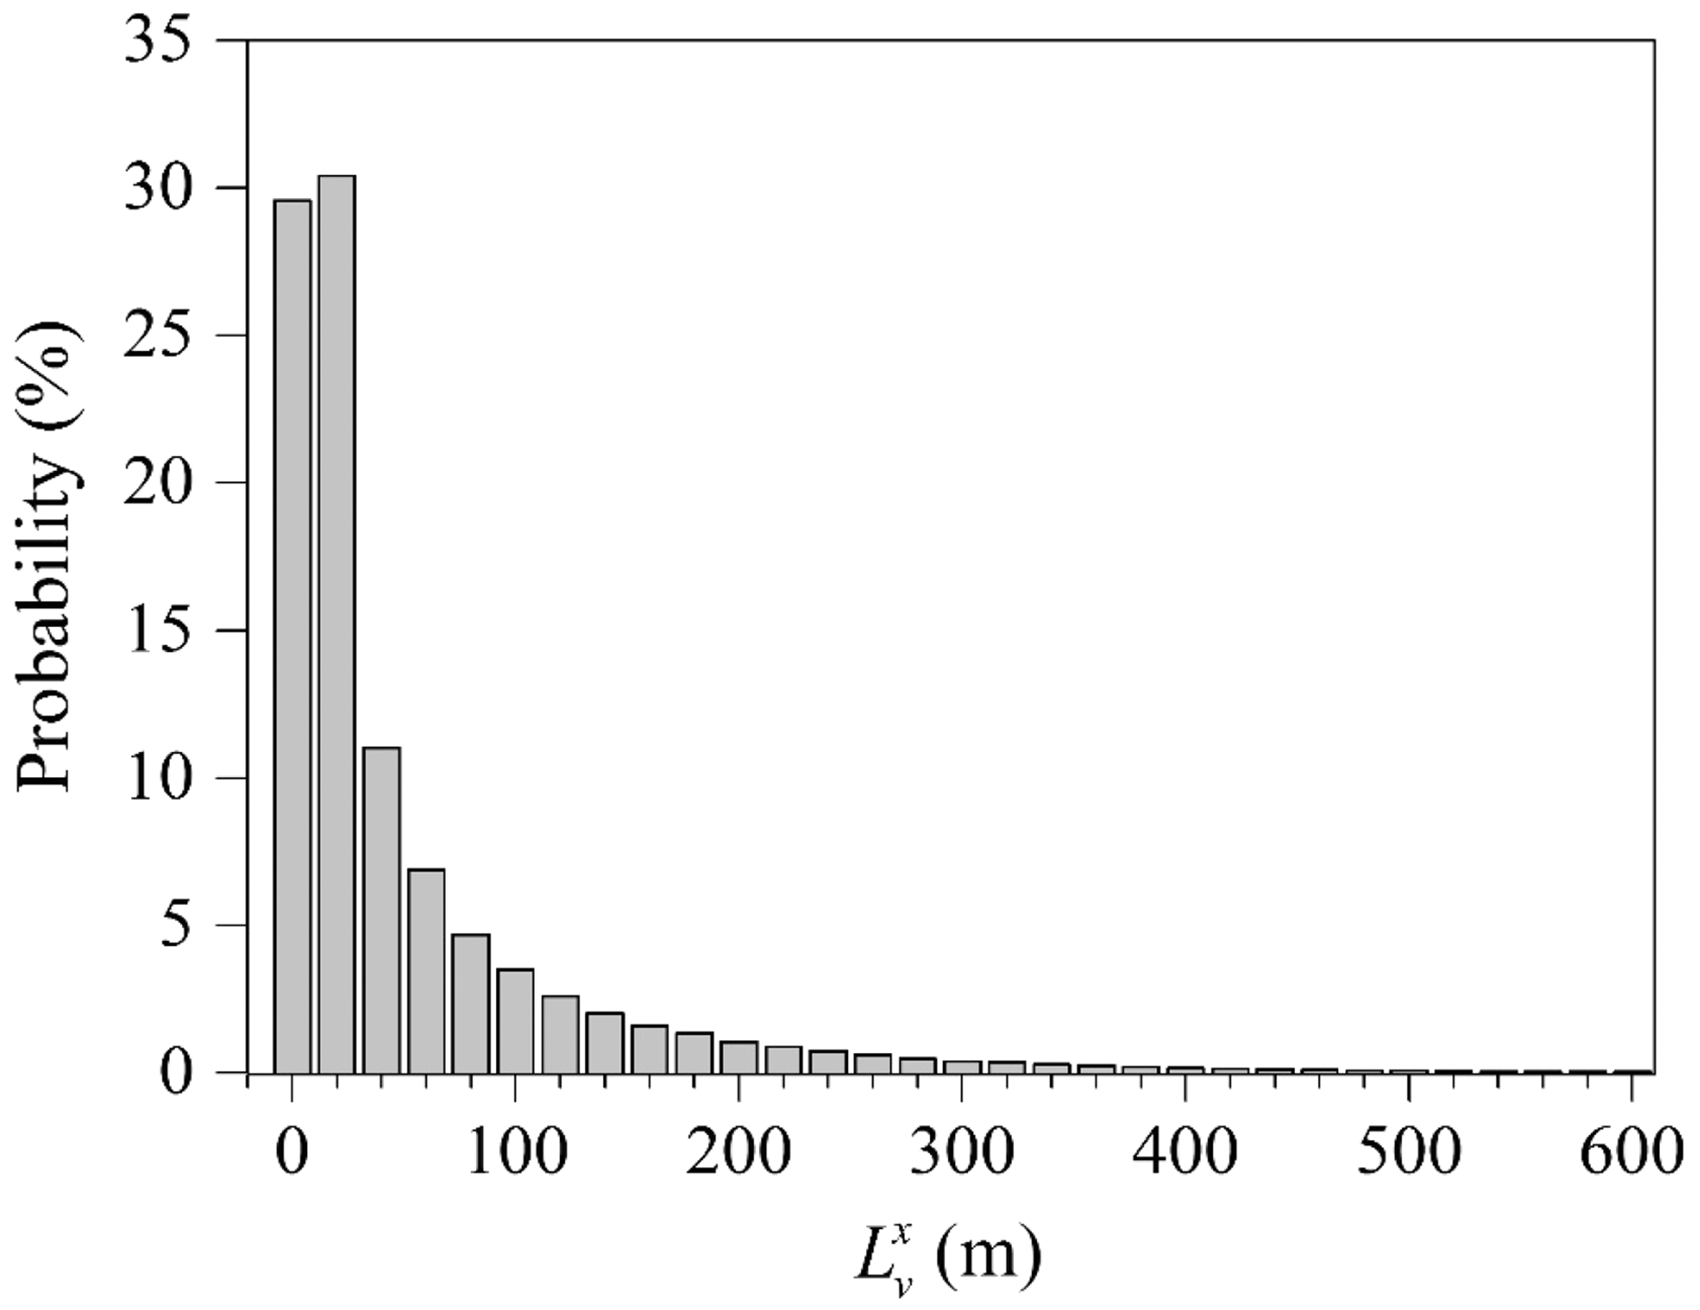
Distribution of
In addition, the changes of the turbulence intensity and the integral length scale with the wind direction are further investigated. Figures 15 and 16 present the average values of
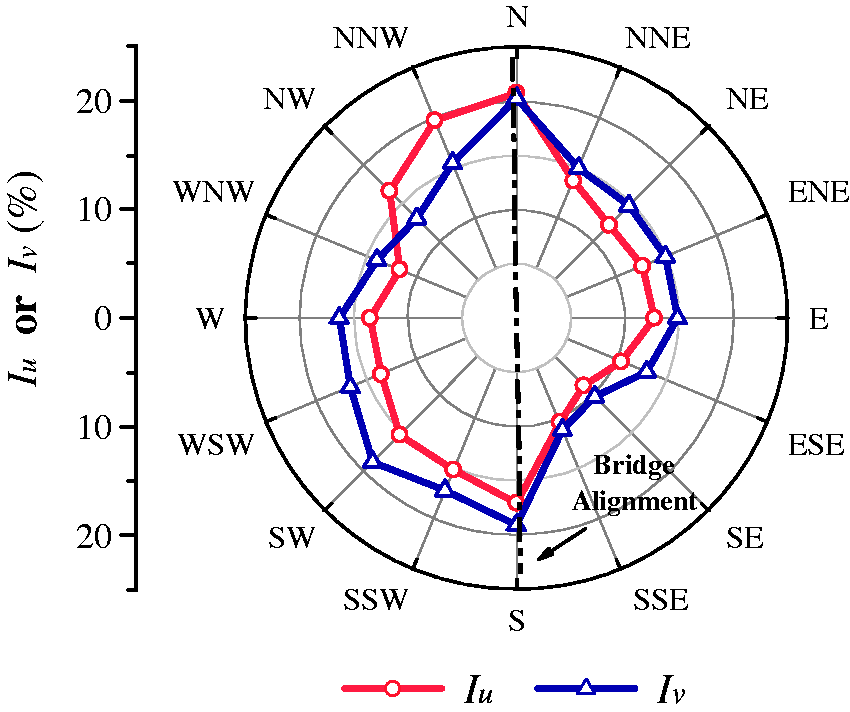
Changes in
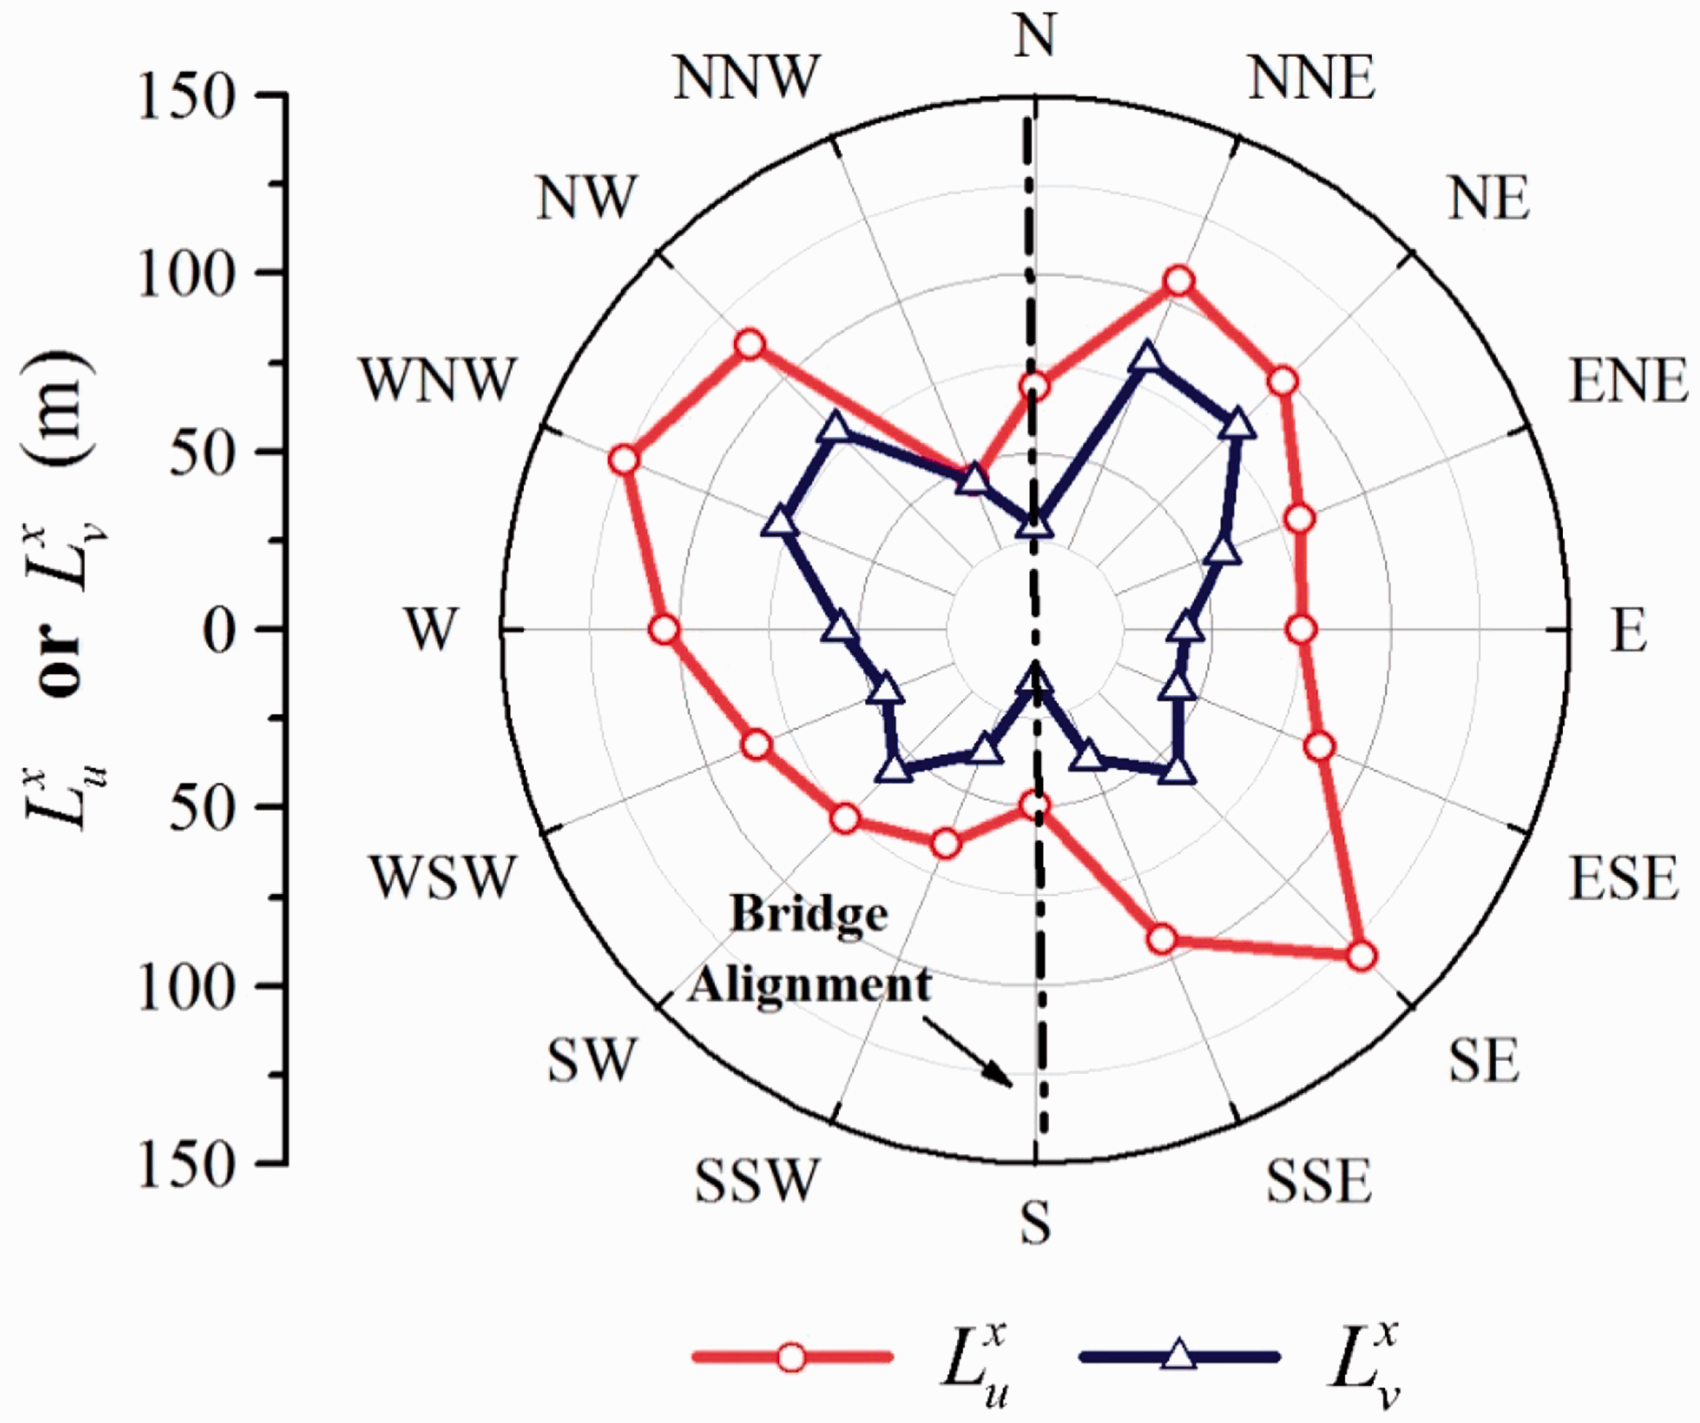
Changes in
In addition to the turbulence intensity and the integral length scale, other characteristic parameters of fluctuating winds, such as turbulence variance and gust factors, are also calculated. Table 1 presents all the statistical results.
Statistics of the wind characteristics at the bridge site.
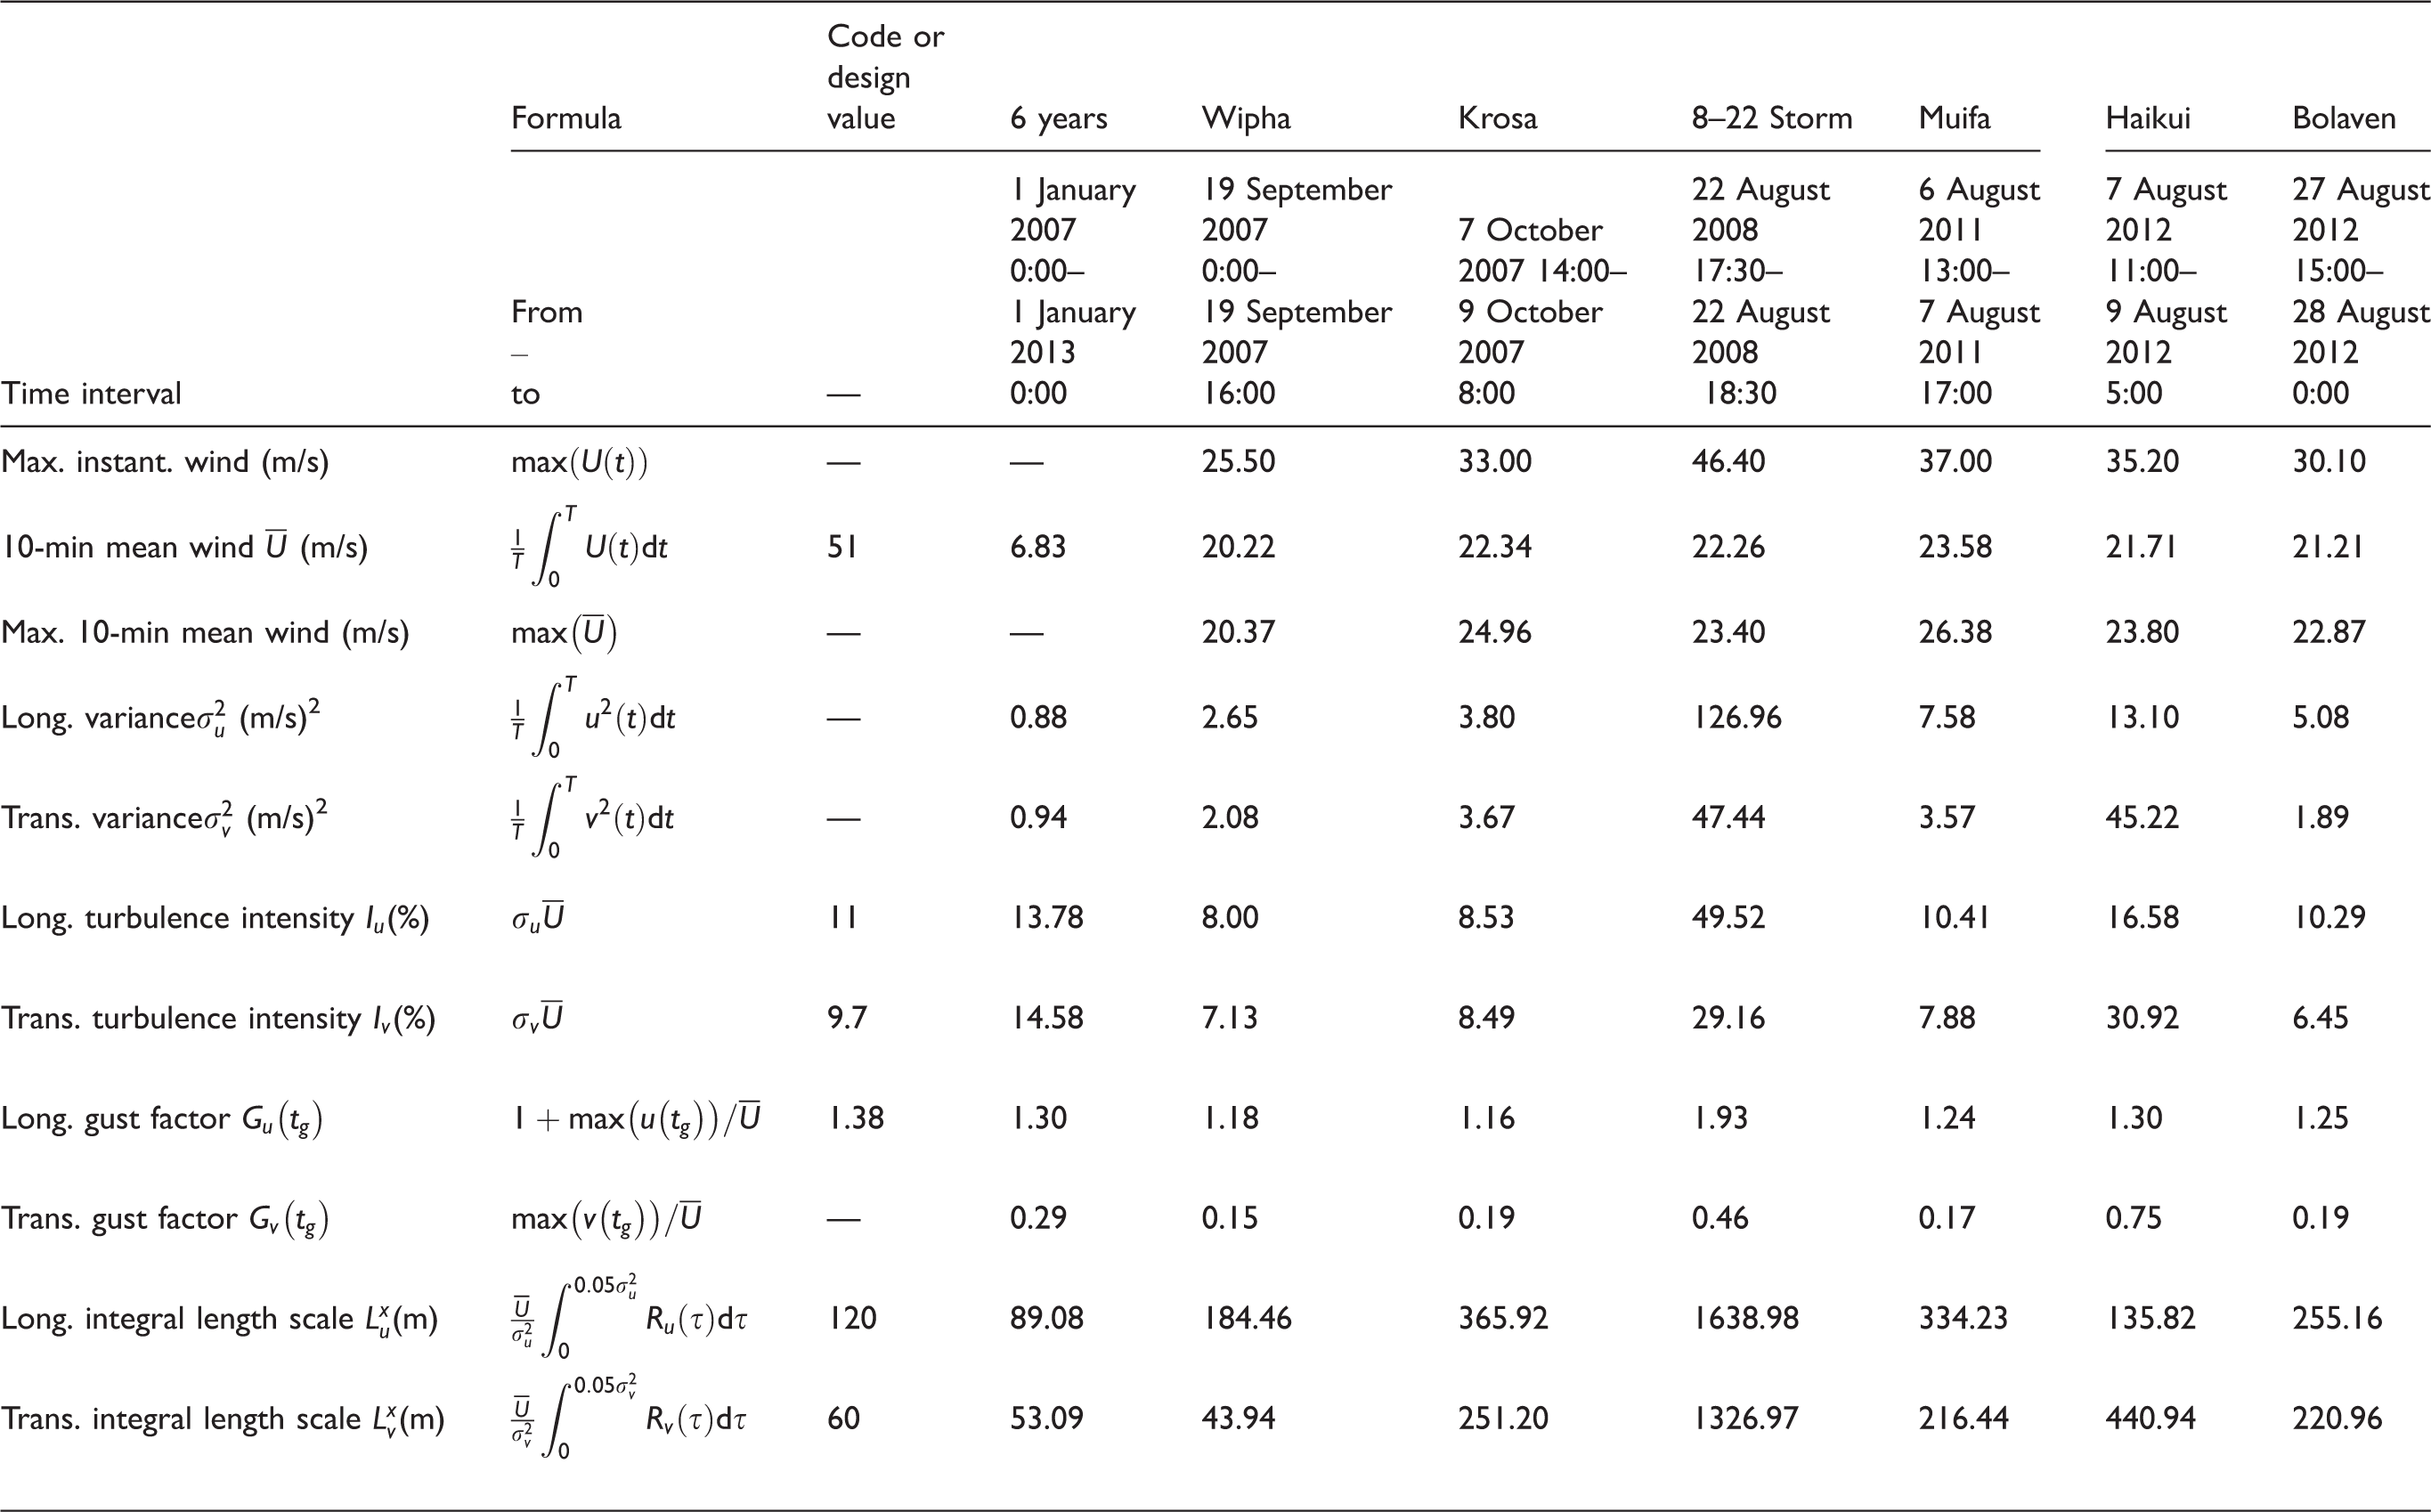
Note: The statistics for strong winds only consider the data sets with
Turbulent wind spectrum
The power spectral density (PSD) function (i.e. wind spectrum) for turbulent winds is essential for the calculation of random wind-induced responses. It reflects the distribution of the turbulent kinetic energy with the frequency of fluctuating winds. In a wind-resistant design, the PSD function of longitudinal turbulent winds is of greater concern than that of transverse winds. This study fits the parameters of Simiu’s spectrum, the longitudinal wind spectrum recommended in the Code, based on the measured data to more accurately describe the wind spectrum at the Donghai Bridge site.
The Simiu’s spectrum is expressed as follows


Coefficients A and B in equation (7), which must be greater than zero, are determined using a non-linear least-squares method. Figure 17(a) demonstrates the parameter fitting process based on one 10-min data set. As for the spectral analysis of general winds, the measurements from strong wind and typhoon events are excluded. The data sets, where the ratios of the standard error to the estimated values of A and B are larger than 0.3, are also removed. Finally, approximately 240,000 valid fitted curves of Simiu’s spectrum are generated using 10-min wind speed and direction data at the bridge deck. The optimal parameter values in equation (7) are estimated based on the arithmetic mean of the fitted curves. The fitted curve of Simiu’s spectrum is determined using the optimal parameters
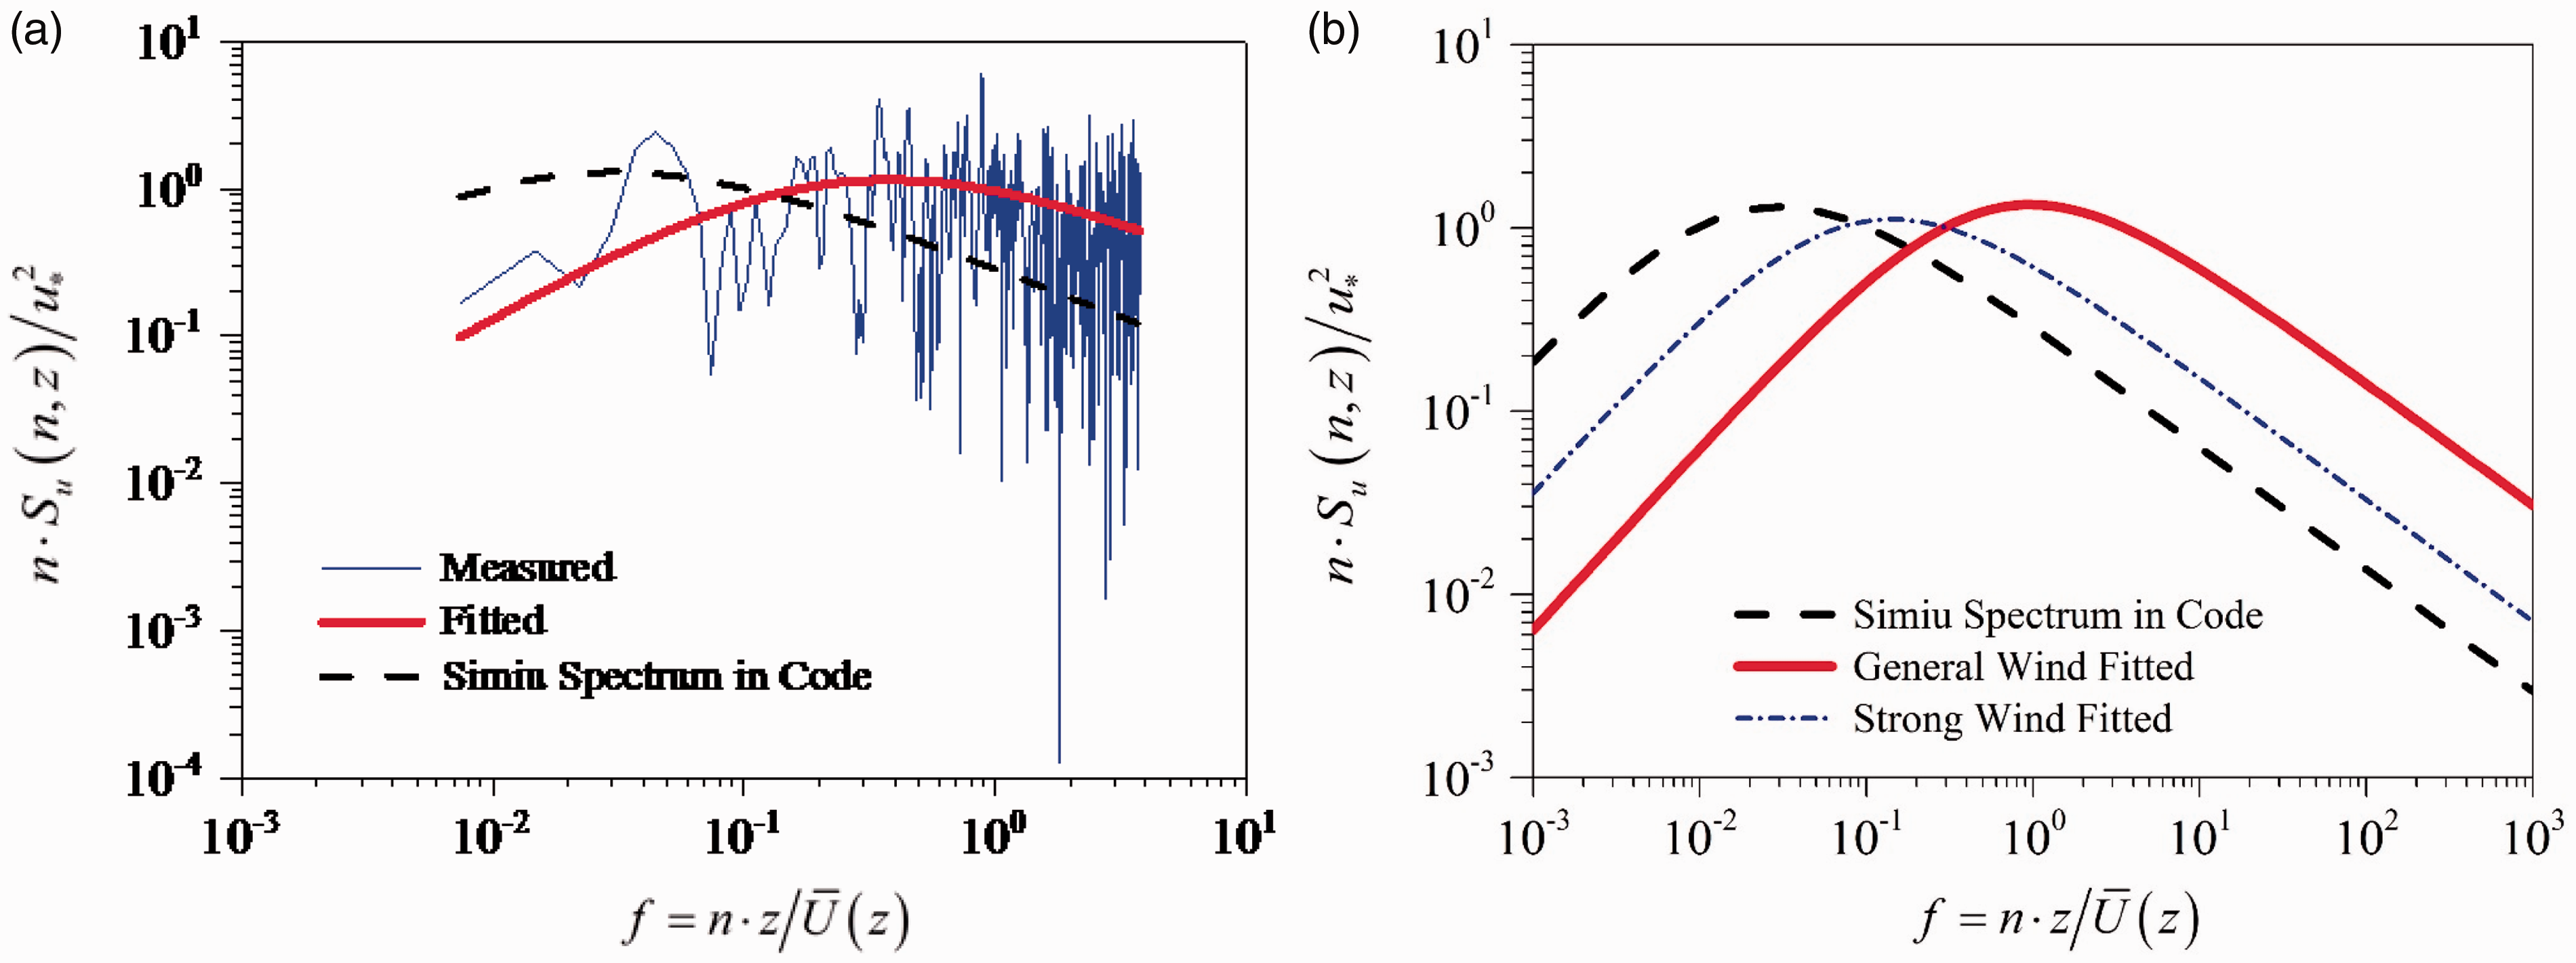
Wind spectrum fitting results. (a) For one 10-min data set, (b) Summary of all data sets.
Characteristics of strong winds
The mechanisms generating strong winds and typhoons differ from those generating general wind, resulting in different wind characteristics between these two kinds of winds. From 2007 to 2012, 17 typhoons entered the area (within a radius of 400 km) surrounding the main navigable span of the Donghai Bridge. 27 This study includes five typhoon events (i.e. Whipa, Krosa, Muifa, Haikui, and Bolaven), which had an instantaneous wind speed record exceeding 25 m/s, for the wind field analysis. Figure 18 shows their paths. In addition, the highest instantaneous wind speed during the six-year period occurred during a short, strong convective weather event on 22 August 2008 (hereinafter referred to as the 8–22 storm). This event is also selected for further analysis.
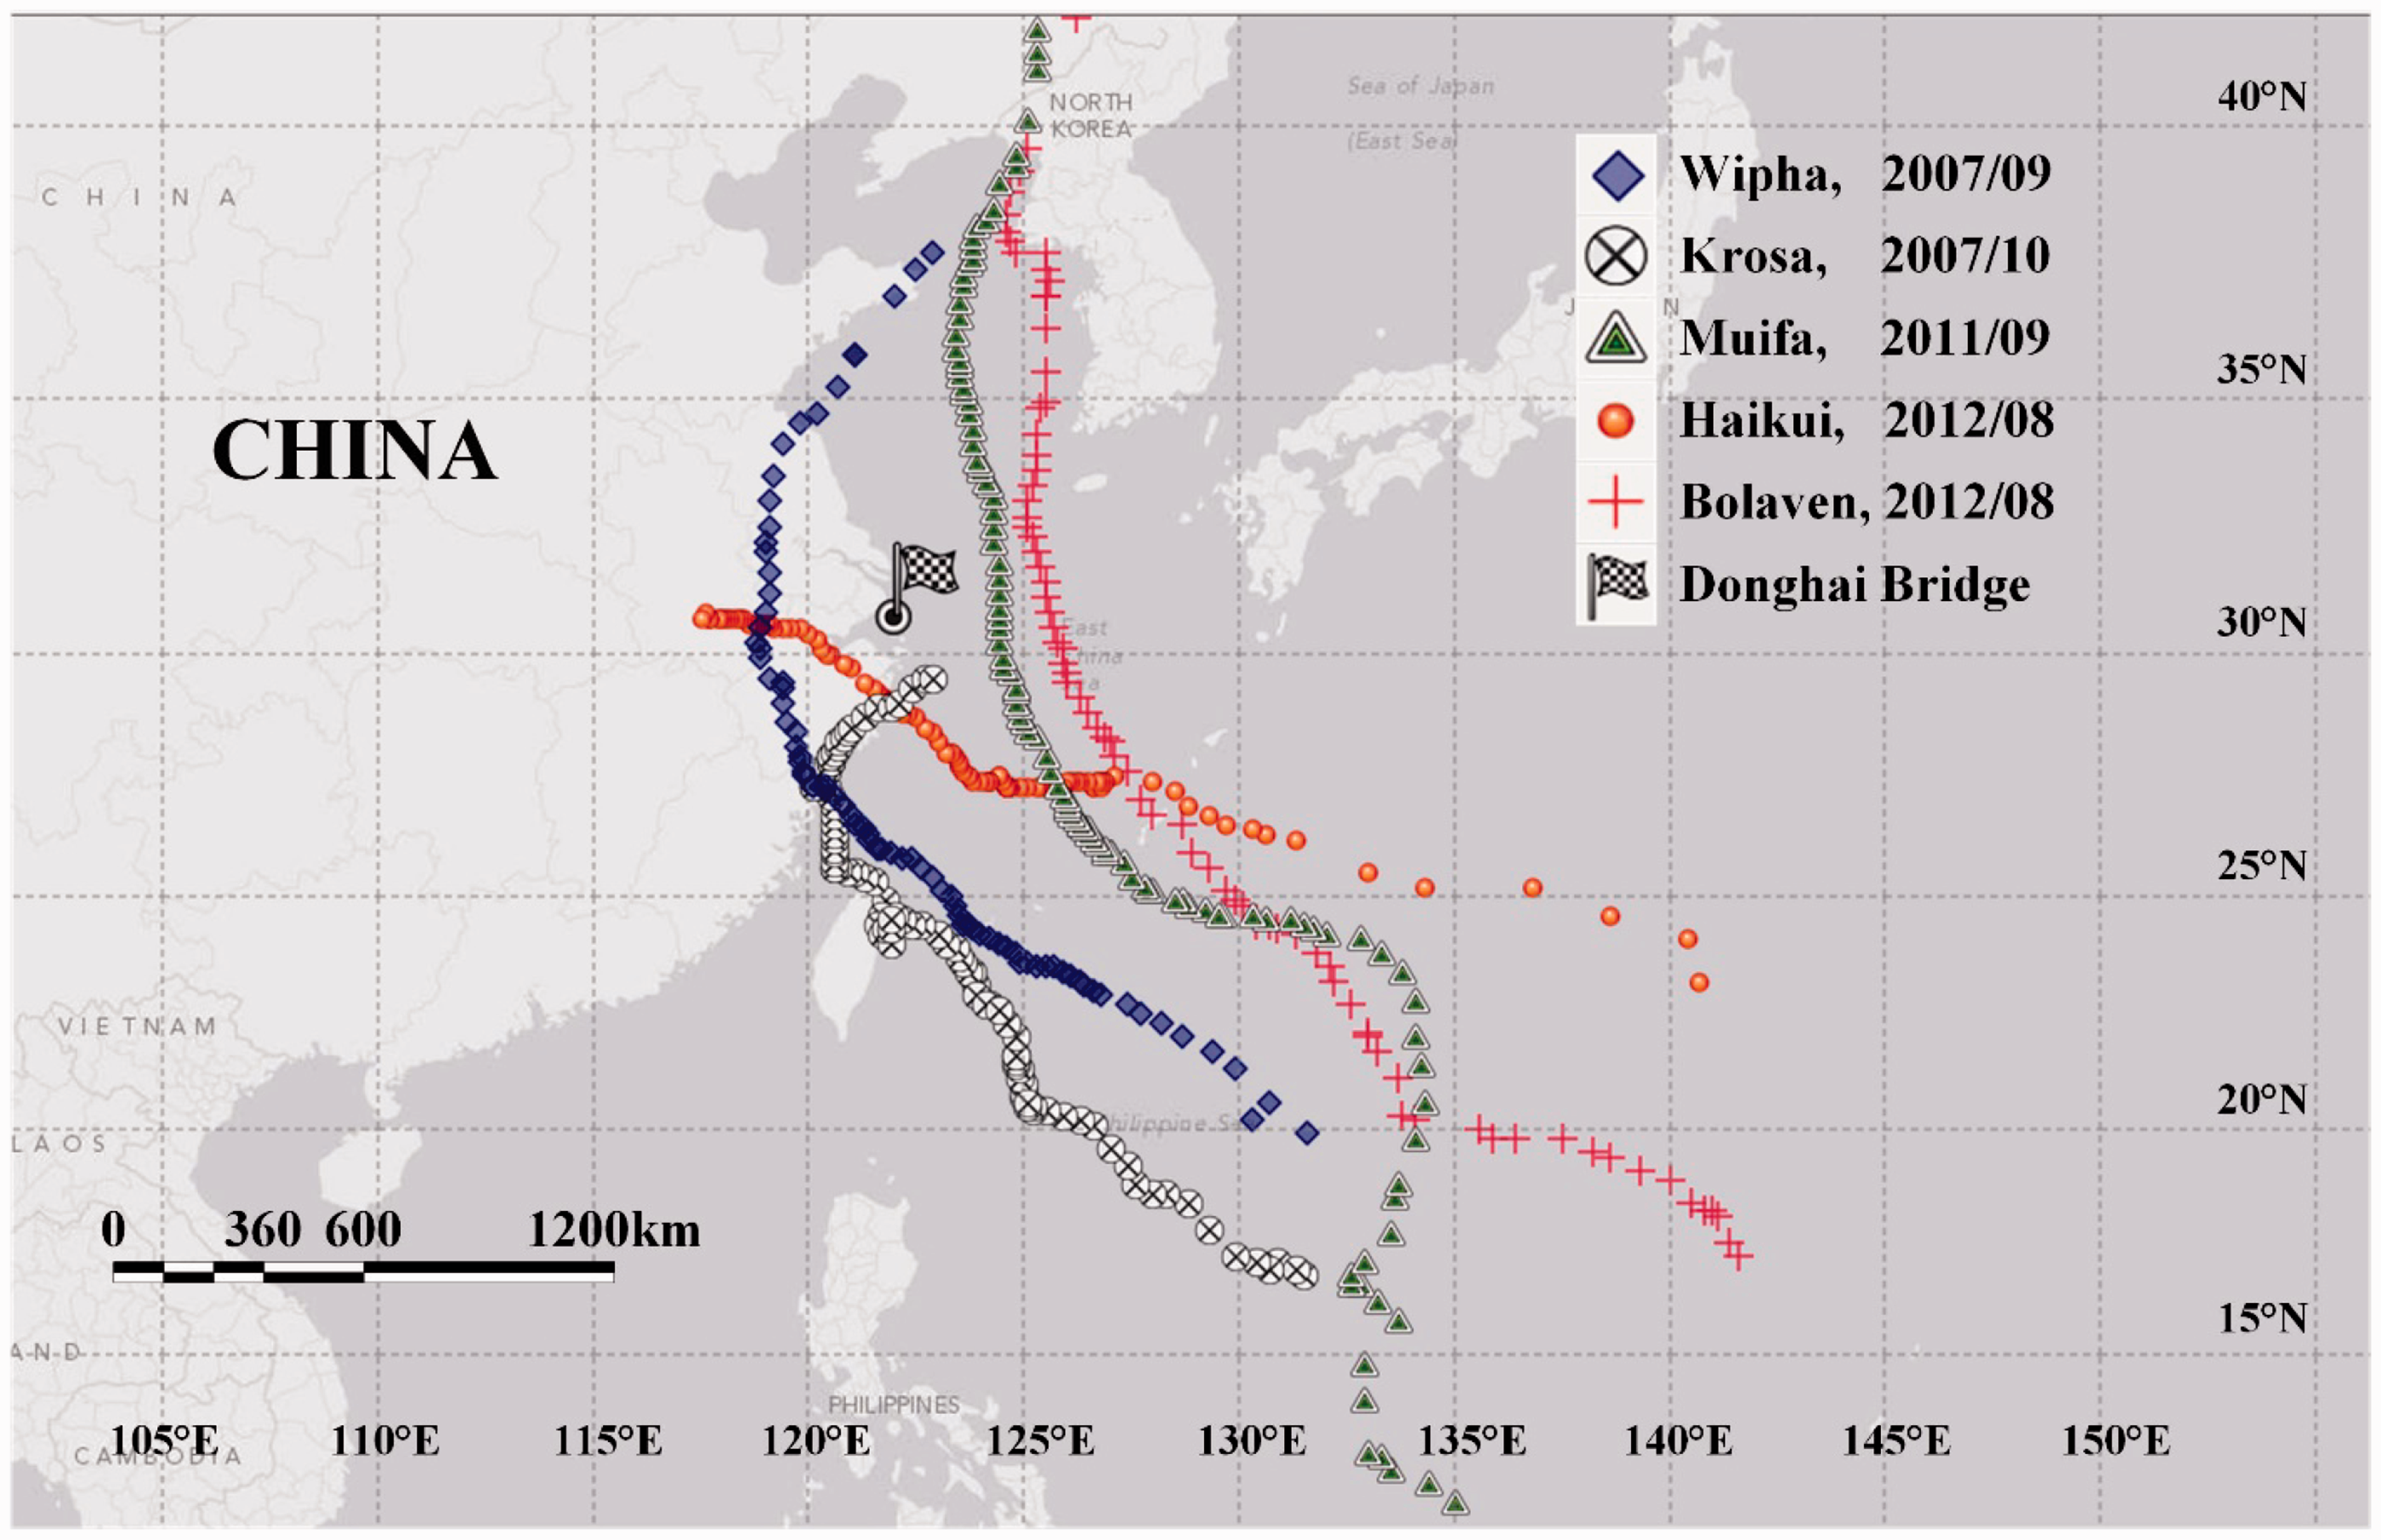
Typhoon paths.
Figure 19 shows the wind speed and the direction evolutions of the six strong wind events. The dotted lines indicate the time during which the main navigable span of the Donghai Bridge encountered winds of grade 7 or stronger (i.e. wind speed > 15.4 m/s). 27 As denoted by the dot-and-dash lines in Figure 19(e), the wind speed at the site was even higher than 25.7 m/s (grade 10 or stronger) during Typhoon Haikui, accompanied by frequent and drastic changes of the wind direction. Table 1 lists the statistical wind characteristics at the deck of the Donghai Bridge using the 10-min averaging period required by the Code. The typhoon’s studied time intervals in the second row of Table 1 correspond to the time ranges when the bridge was within the grade 7 wind circle. The data sets with a 10-min mean wind speed below 20 m/s were excluded to better demonstrate the strong wind characteristics.
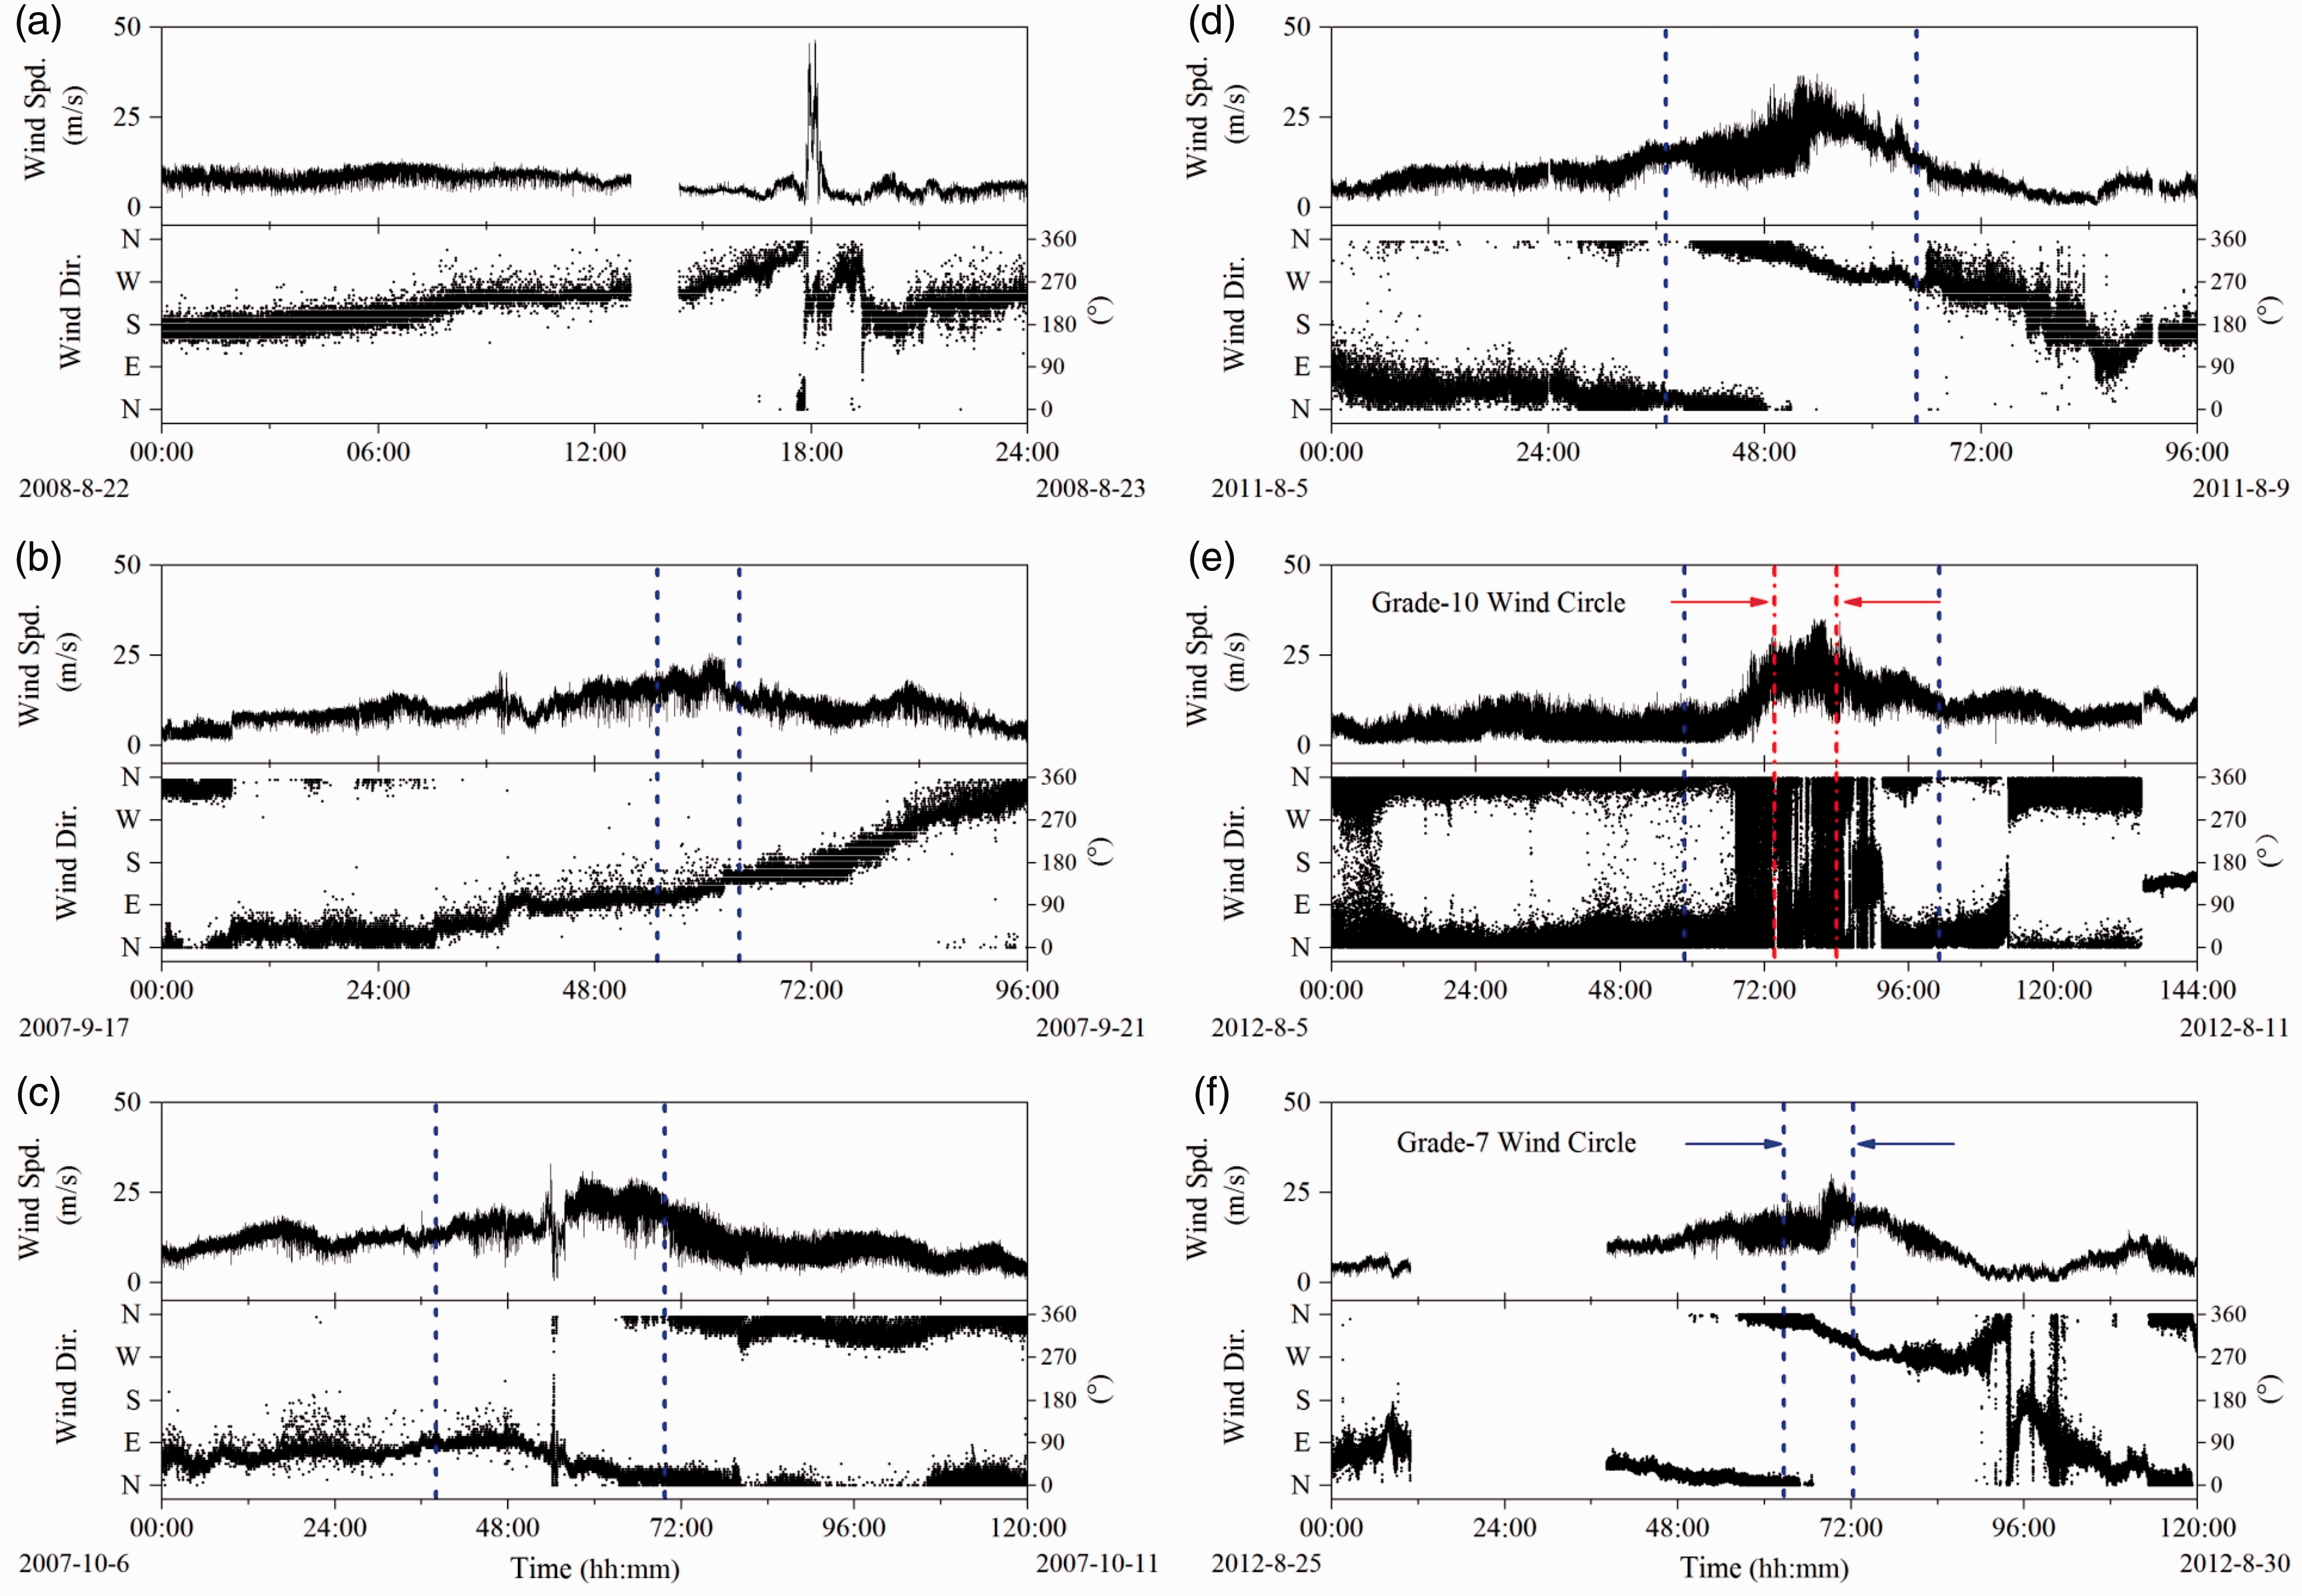
Wind speed and wind direction evolutions at the bridge deck for each strong wind event. (a) 8. 22 Storm, (b) Whipa, (c) Krosa, (d) Muifa, (e) Haikui, (f) Bolaven.
The comparison of the wind characteristics for general and strong winds in Table 1 reveals that the mean wind speed
Due to the increase of non-stationarity during strong wind events, it might not be suitable to use a 10-min averaging duration for statistical analysis of wind characteristics. In such cases, 1-min statistical time intervals are used. In Figure 20, the 8–22 storm is taken as an example to compare the mean wind speed, mean wind direction, turbulence intensity, integral scale length, fluctuating variance, and gust factor at the bridge deck using the two different averaging durations. The mean wind speed and wind direction based on the 1-min time interval are closer to the original measurement results (with a sampling frequency of 1 Hz) than in the 10-min averaging time interval, which shows that the shorter time interval reduces the slowly time-varying trend components in turbulent winds. As a result, the parameters in Figure 20, including
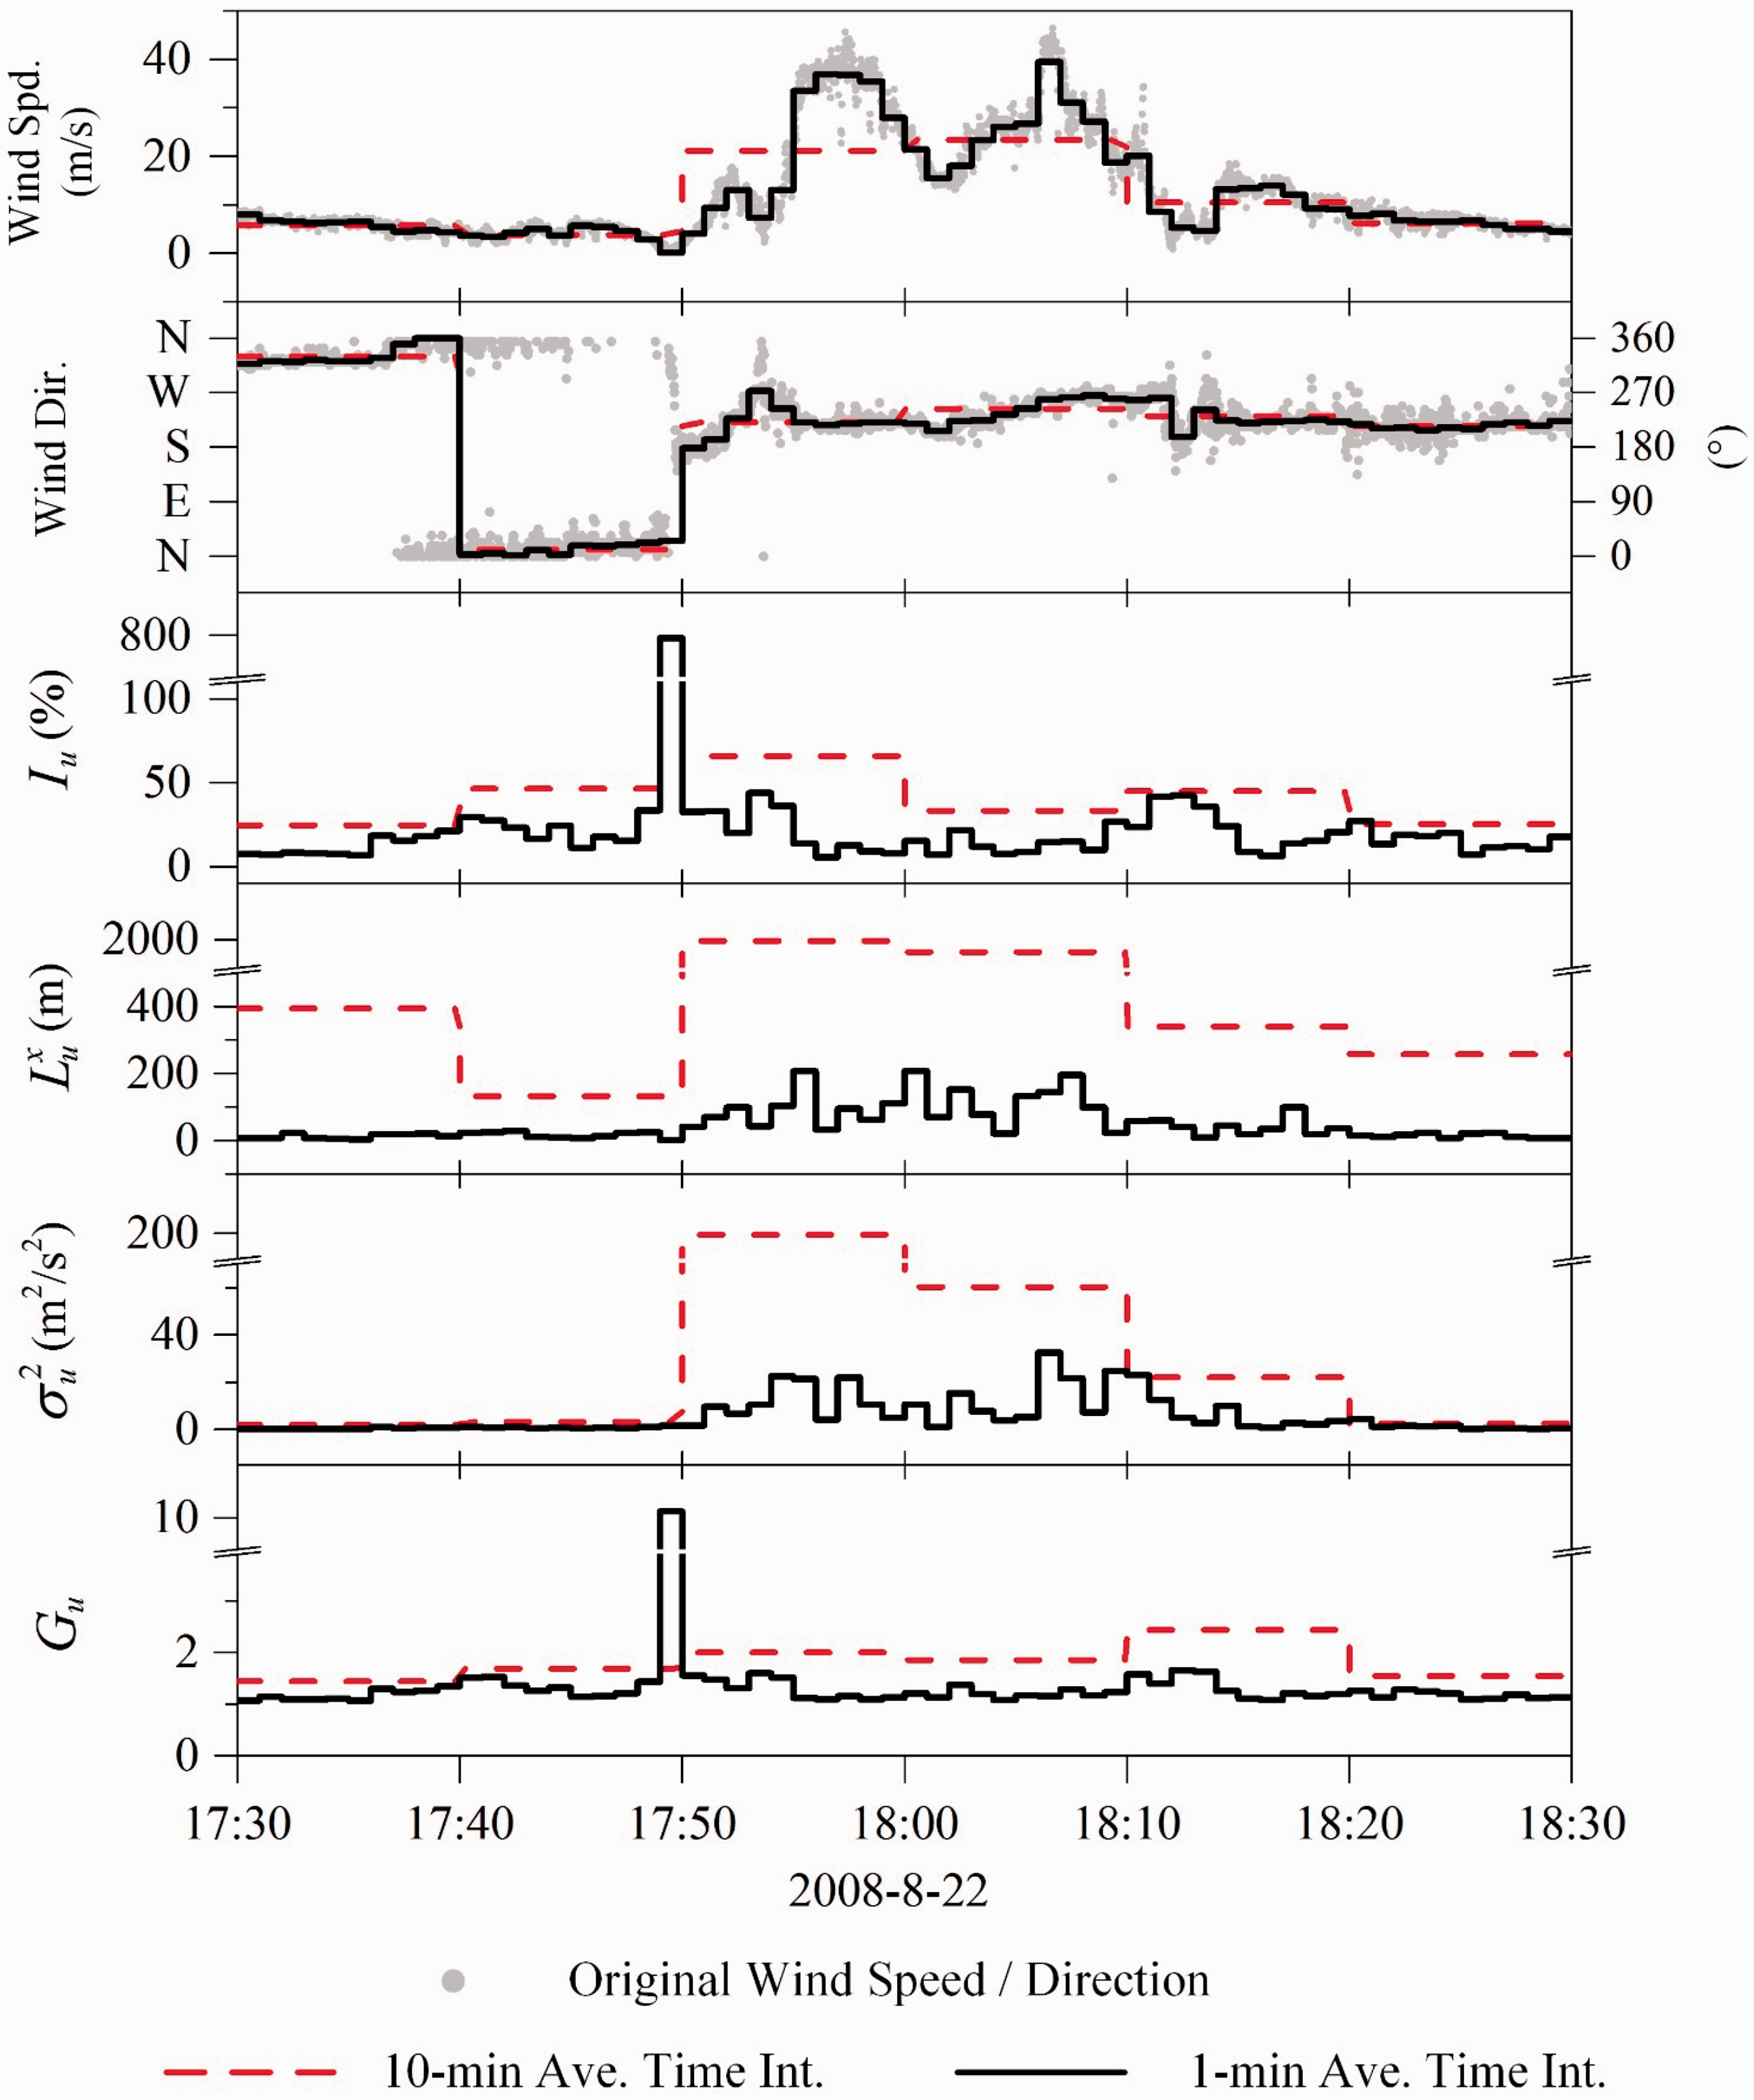
Comparison of the wind characteristics during the 8–22 storm using different averaging time intervals.
In Figure 21, the 10-min and 1-min averaged turbulent characteristics of strong winds are compared based on the data sets with a mean wind speed higher than 20 m/s. Overall, the parameters calculated based on an averaging time of 1-min time intervals are smaller and vary less than those with 10-min averaging intervals among different strong winds. Except for the 8–22 storm, the relative reduction of each turbulent wind parameter is at the same level among different strong wind events when the averaging time interval decreases from 10-min to 1-min. The turbulent integral length scale
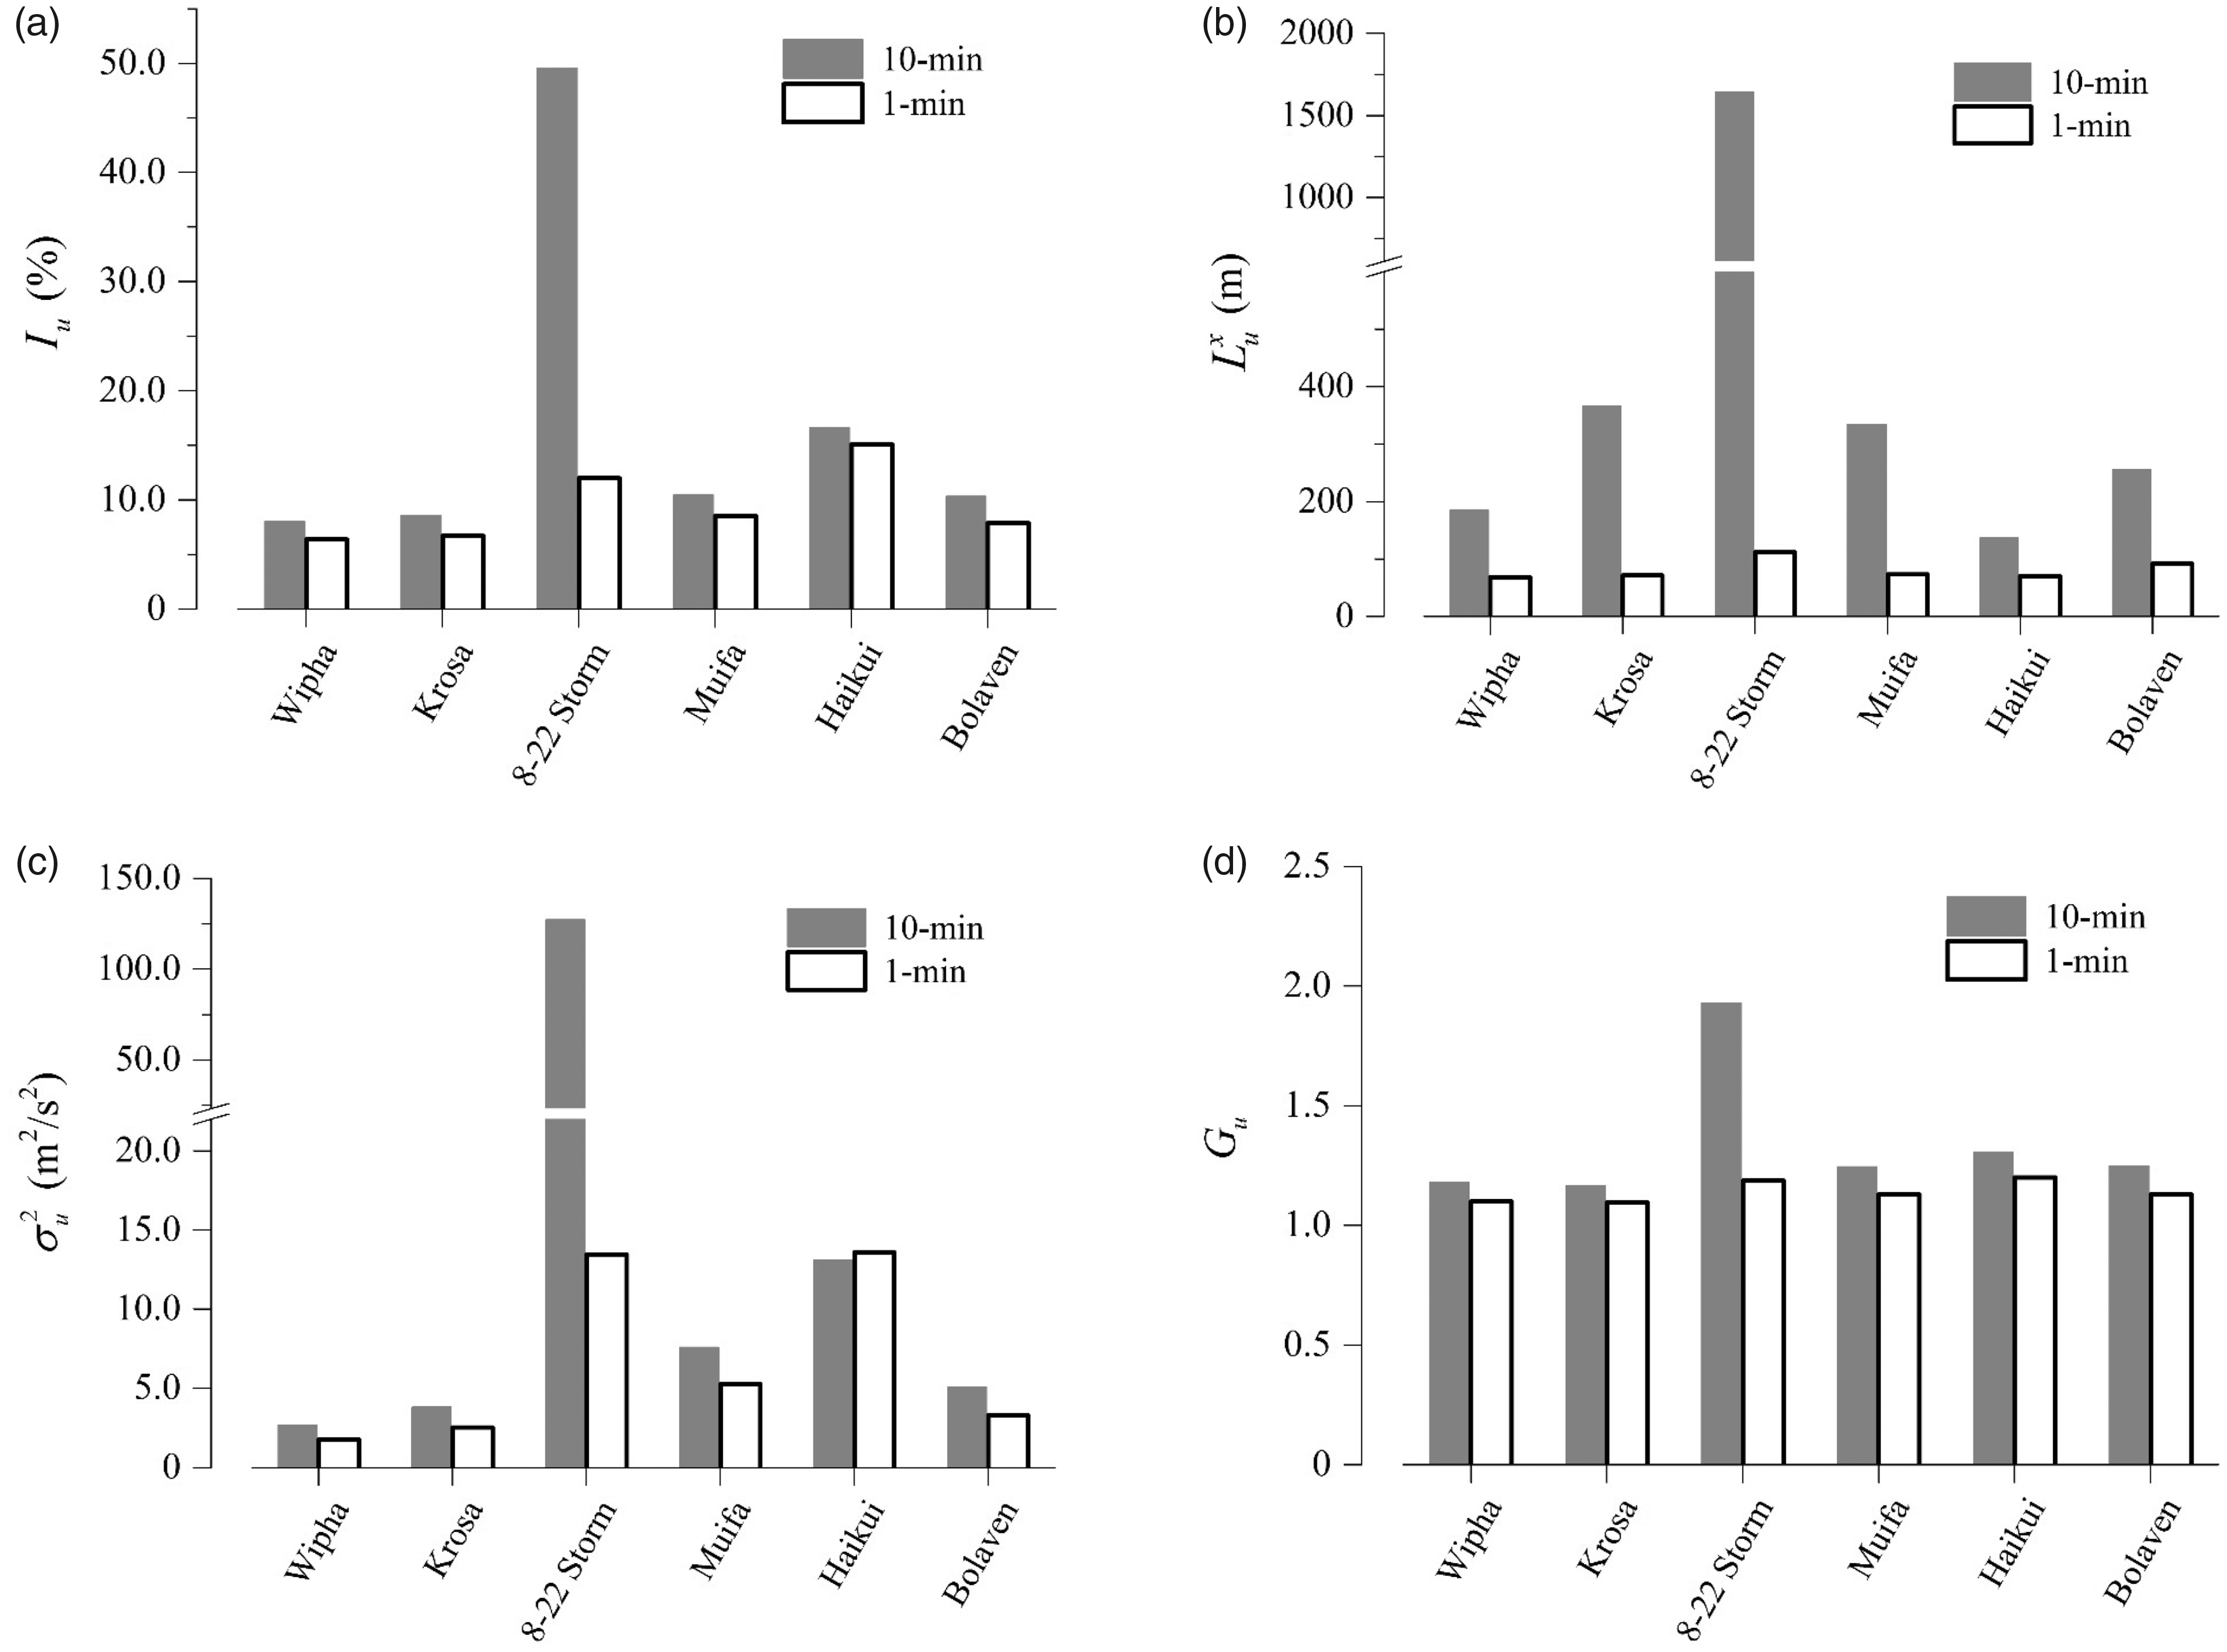
Comparison of the strong wind characteristics calculated using different averaging time intervals. (a)
Conclusions
This study investigated the wind characteristics at the site of the Donghai Bridge based on six years of field monitoring data. Both the mean and turbulent wind characteristics are discussed. The following conclusions are drawn:
The annual repeatability of the wind characteristics at the Donghai Bridge site was observed. However, some discrepancies are found between the measured wind field parameters and the design parameters or the suggested values in the Code, which indicates the necessity of validating the bridge design assumptions based on field measurements. Compared with general wind, the 10-min mean wind speed and the turbulence variance of strong winds at the Donghai Bridge are considerably higher. However, the turbulence intensity, integral length scale, and gust factor do not show any quantitative pattern. Moreover, the measured turbulence kinetic energy distribution of both general and strong winds shows a shift toward higher frequencies with regard to Simiu’s spectrum in the Code. It is preferable to adopt a shorter averaging time than 10-min to calculate turbulent wind parameters because of the high non-stationarity of strong winds. The turbulent characteristics of strong winds over 1-min time intervals are remarkably smaller and vary less among different strong winds than those over 10-min time intervals. The monitoring results showed that the winds at the bridge deck are more turbulent along the longitudinal axis of the Donghai Bridge, and the field wind spectrum shifts toward the high-frequency range. Both phenomena probably resulted from the interference of the bridge structure itself, which should be considered in the SHMS design in the future.
Footnotes
Acknowledgments
The authors would like to thank the Shanghai Donghai Bridge Management Co., Ltd and the Shanghai Just One Technology Development Co., Ltd for their great assistance and support.
Declaration of conflicting interests
The author(s) declared no potential conflicts of interest with respect to the research, authorship, and/or publication of this article.
Funding
The author(s) disclosed receipt of the following financial support for the research, authorship, and/or publication of this article: This work is supported by the National Natural Science Foundation of China (51608034), the China Postdoctoral Science Foundation (2016M600925), and the Fundamental Research Funds for the Central Universities (FRF-TP-16-012A1).