
Abstract
Finite element human vibration models were developed and implemented for use in human-tended spacecraft-coupled loads analysis, an analytical process used to predict low-frequency spacecraft loads which occur during dynamic phases of flight of such as launch, ascent, or ascent aborts. Human vibration may also affect stress predictions for spacecraft systems which the crew interacts with, such as crew seats and crew impact attenuation systems. These human vibration models are three-dimensional, distributed-mass representations of 1st-percentile female, 50th-percentile male, and 99th-percentile male American crew members and provide a relatively simple linear and low-load representation of the nonlinear dynamic response of a seated human. The most significant features of these finite element models are anthropometrically based geometric human mass distribution, soft tissue vibration attributes, and skeleton and joint stiffness.
Introduction
Finite element (FE) modeling is a critical component of coupled loads analysis (CLA), an analytical process used to predict spacecraft responses which occur during dynamic loading events such as launch, ascent, ascent aborts, and landings. CLA involves development of spacecraft/system FE models, mathematical coupling of those models, and assessment of the resultant loads. CLA for human-tended spacecraft previously used simplistic, lumped mass representations of human crew members. These overly simplistic models did not accurately distribute human mass nor represent human vibration characteristics. While crew mass constitutes a very minimal percentage of overall spacecraft mass, the manner in which the mass is distributed in the model, as well as inclusion of human vibration characteristics, could have a potentially significant effect on the accuracy of loads predictions. Deficiencies in modeling human vibration may also affect the accuracy of stress predictions for spacecraft systems which the crew interacts with, such as crew seats and crew impact attenuation systems. Other FE models, such as biodynamic models used to provide predictions of crew injury risk from dynamic spacecraft accelerations, rely on the output from CLA as input parameters. Thus, models which yield inaccurate predictions of spacecraft accelerations may also affect the accuracy of assessments of the crew response to dynamic accelerations.
Three-dimensional, distributed mass human vibration models (HVMs) representing 1st-percentile American female, 50th-percentile American male, and 99th-percentile American male spacecraft crew members were developed in this study. The primary purpose of these HVMs is for use in spacecraft CLA. Thus, they are not purported to be high fidelity, biomechanical FE models of human crew members. Rather, they are flexible multibody models containing 51 nodes and consist of four basic types of components including: (1) a simplified skeleton constructed with beam elements; (2) joints, represented by rotational springs and translational constraints; (3) major soft tissue elements, rendered as concentrated mass and inertias; and (4) major internal organs in the thorax, abdomen, and pelvis, modeled as concentrated masses with translational springs. The model coordinate system used in this paper is representative of a spacecraft seat coordinate system. LS-DYNA® and NASTRAN® were the two formats used to develop the models created in this study since those are the software tools used by NASA’s human spaceflight programs, but the models can easily be converted to alternate code for other FE programs used to analyze linear or nonlinear response of structures.
Prior to the development of the HVMs, an extensive literature survey was conducted to determine critical model parameters including distributed human mass and geometry data, joint rotational stiffness magnitudes, and soft tissue vibration modes and mode shapes. While literature on human vibration is extensive, prior research has been heavily focused on human tolerance of vibration rather than providing detailed information necessary for the development of FE models of human vibration.
50th-percentile American male HVM
Geometric mass distribution
The most significant feature of the HVM is the inclusion of anthropometrically based human mass distribution, which also affect other variables, such as joint stiffness. Correct distribution of crew mass restrained in a spacecraft seat is critical to improve the accuracy of crew seat loads and for the correct interpretation of human vibration data. The first model developed in this study was representative of a 50th-percentile American male since that was the sole subject size used in the original, single lumped-mass model. The primary source for mass and geometry data for the 50th-percentile male HVM was AAMRL-TR-88–010, Anthropometry and Mass Distribution for Human Analogs, Volume I: Military Male Aviators. 1 This anthropometric data was generated from a population which is analogous to male astronauts and was specifically intended for use in mathematical models to analyze responses to impact and other mechanical forces.
The mass representing a 50th-percentile American male is 179.5 lb (81.4 kg). Due to the significant mass of equipment worn by crew members during human spaceflight missions, such as pressure suits and helmets, it was necessary to account for this additional mass in the HVM. Multiple potential approaches to represent this mass in the FE model were explored including distributing the additional mass by increasing the bone density, adding additional mass on top of the bones, or adding additional mass directly at the joints. In a high-fidelity biomechanical model, the approach selected could potentially affect the model response. However, because the HVMs are relatively simple stick and joint models, with the sticks representing relatively stiff bones, the model response to vibrations was determined to be insensitive to the method selected to account for the additional mass of crew-worn equipment. Thus, the approach selected was to distribute the mass in the FE model by simply increasing the bone density. Since a new NASA launch and entry suit was under development, a maximum weight of 80 lb (36.3 kg) was estimated based on legacy suit systems and used as the representative weight for the unpressurized suit and helmet. To represent this additional mass in the model, the suit mass was distributed evenly throughout the skeleton by scaling the bone density. The total weight of the 50th-percentile human model, including the ascent/entry suit and helmet, was 259.42 lb (117.7 kg).
To determine the appropriate geometric mass distribution, the human mass and inertia was divided into 17 segments, including head, neck, three trunk segments, and 12 symmetric arm and leg segments as shown in Figure 1.1,2 The mass of the three trunk segments was further divided so that the soft tissue vibration modes could be represented. Mass distributions were based on regression equations developed from stereophotographic assessments of human subjects and the assumption that distribution of mass is comparable to the distribution of volume. 1 Figure 2 shows the locations of the center of mass of each of the body segments, converted into United States customary units, as derived from AAMRL-TR-88–010.
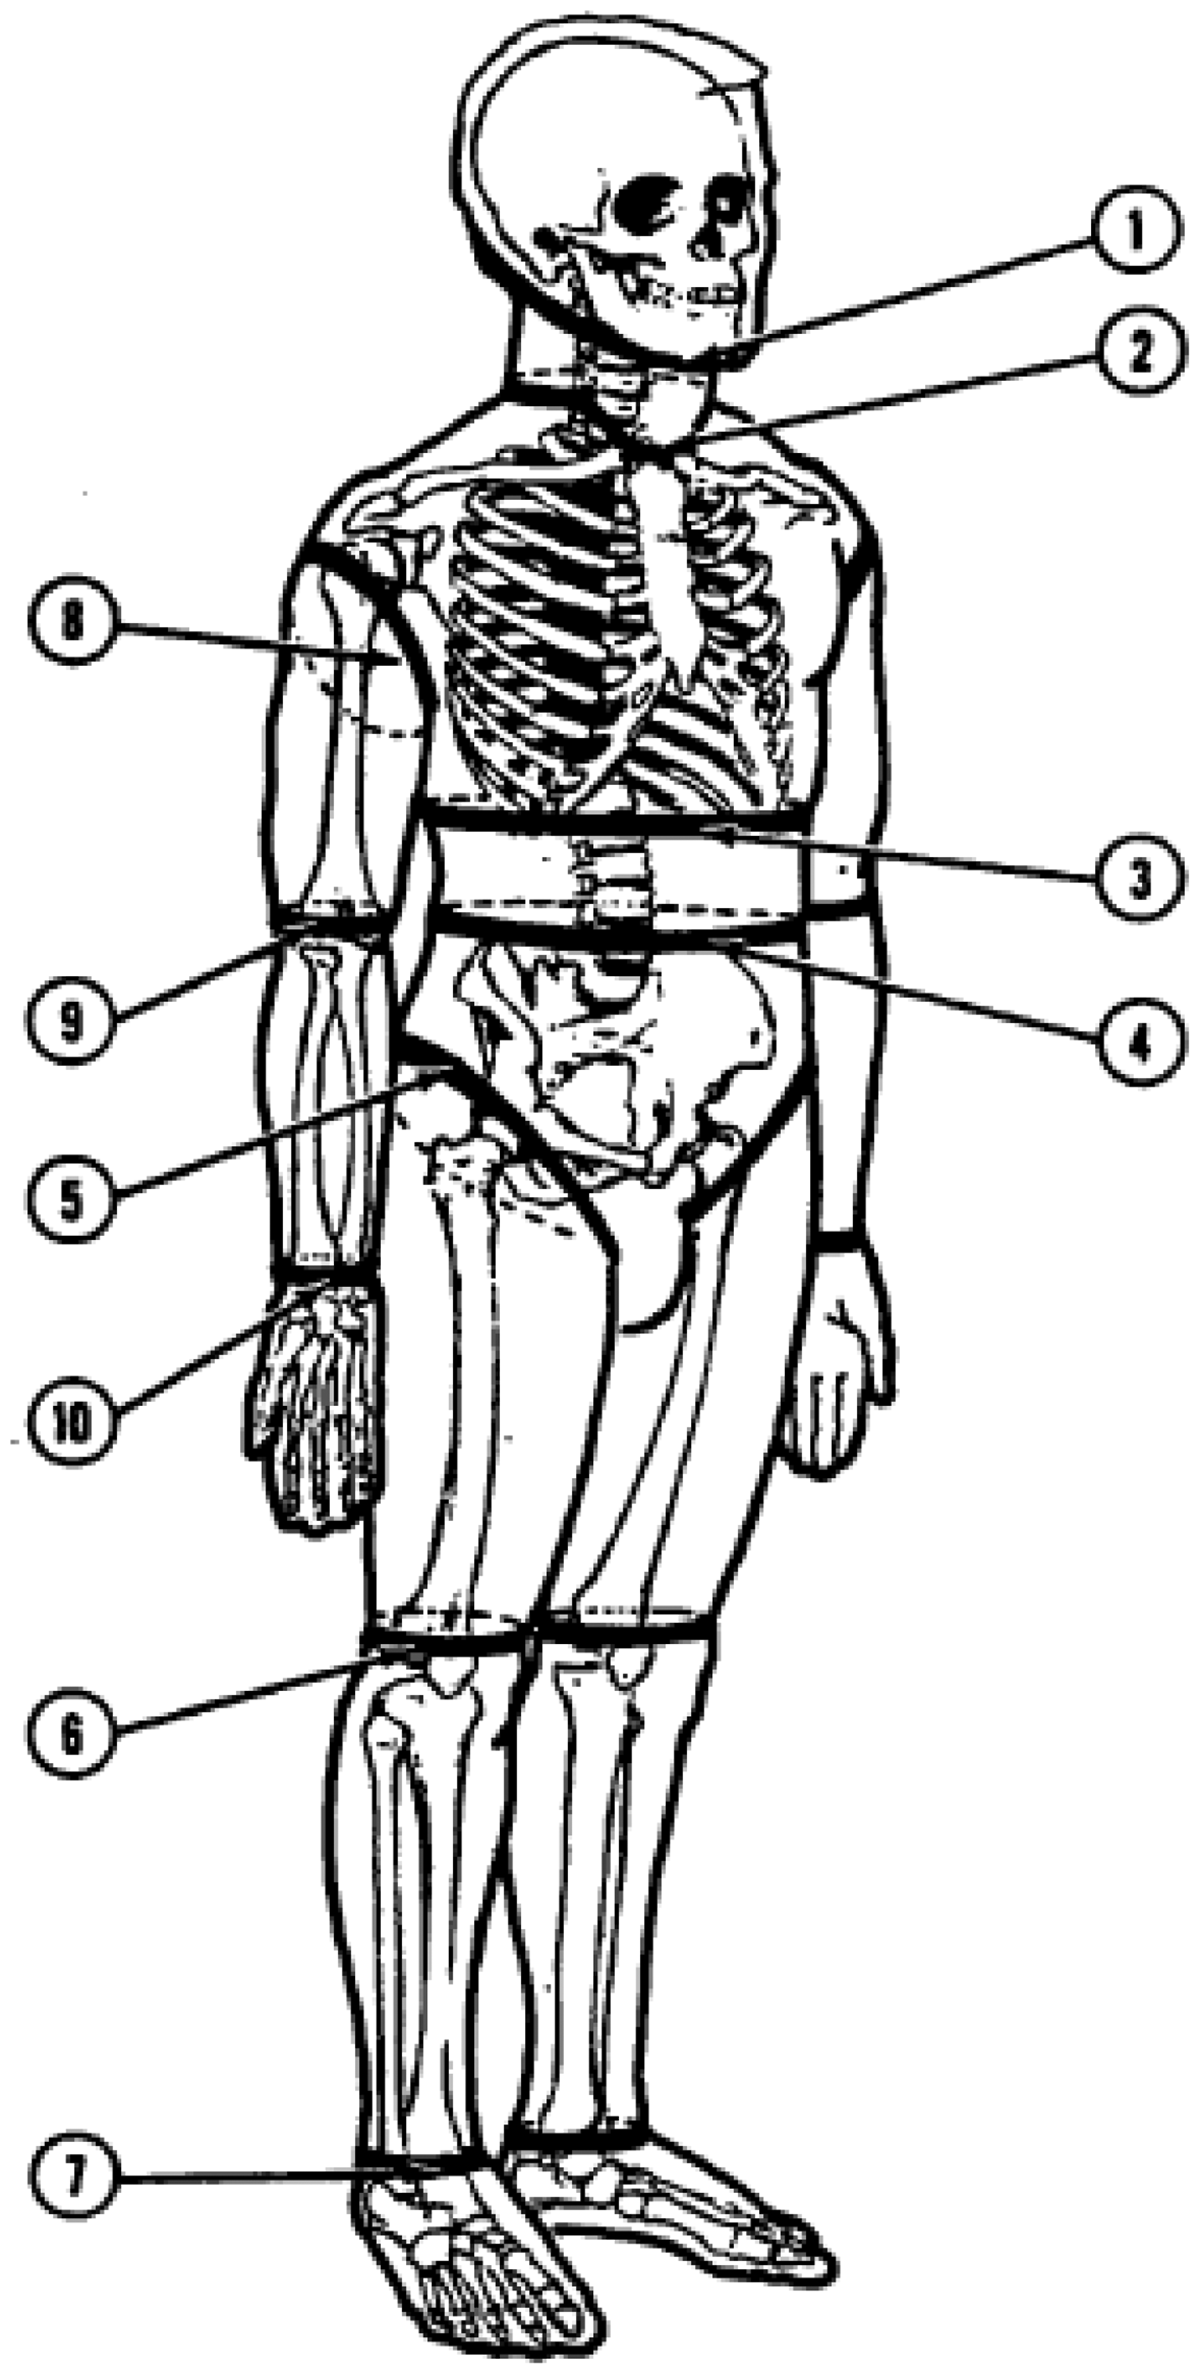
Planes of body segmentation. 1
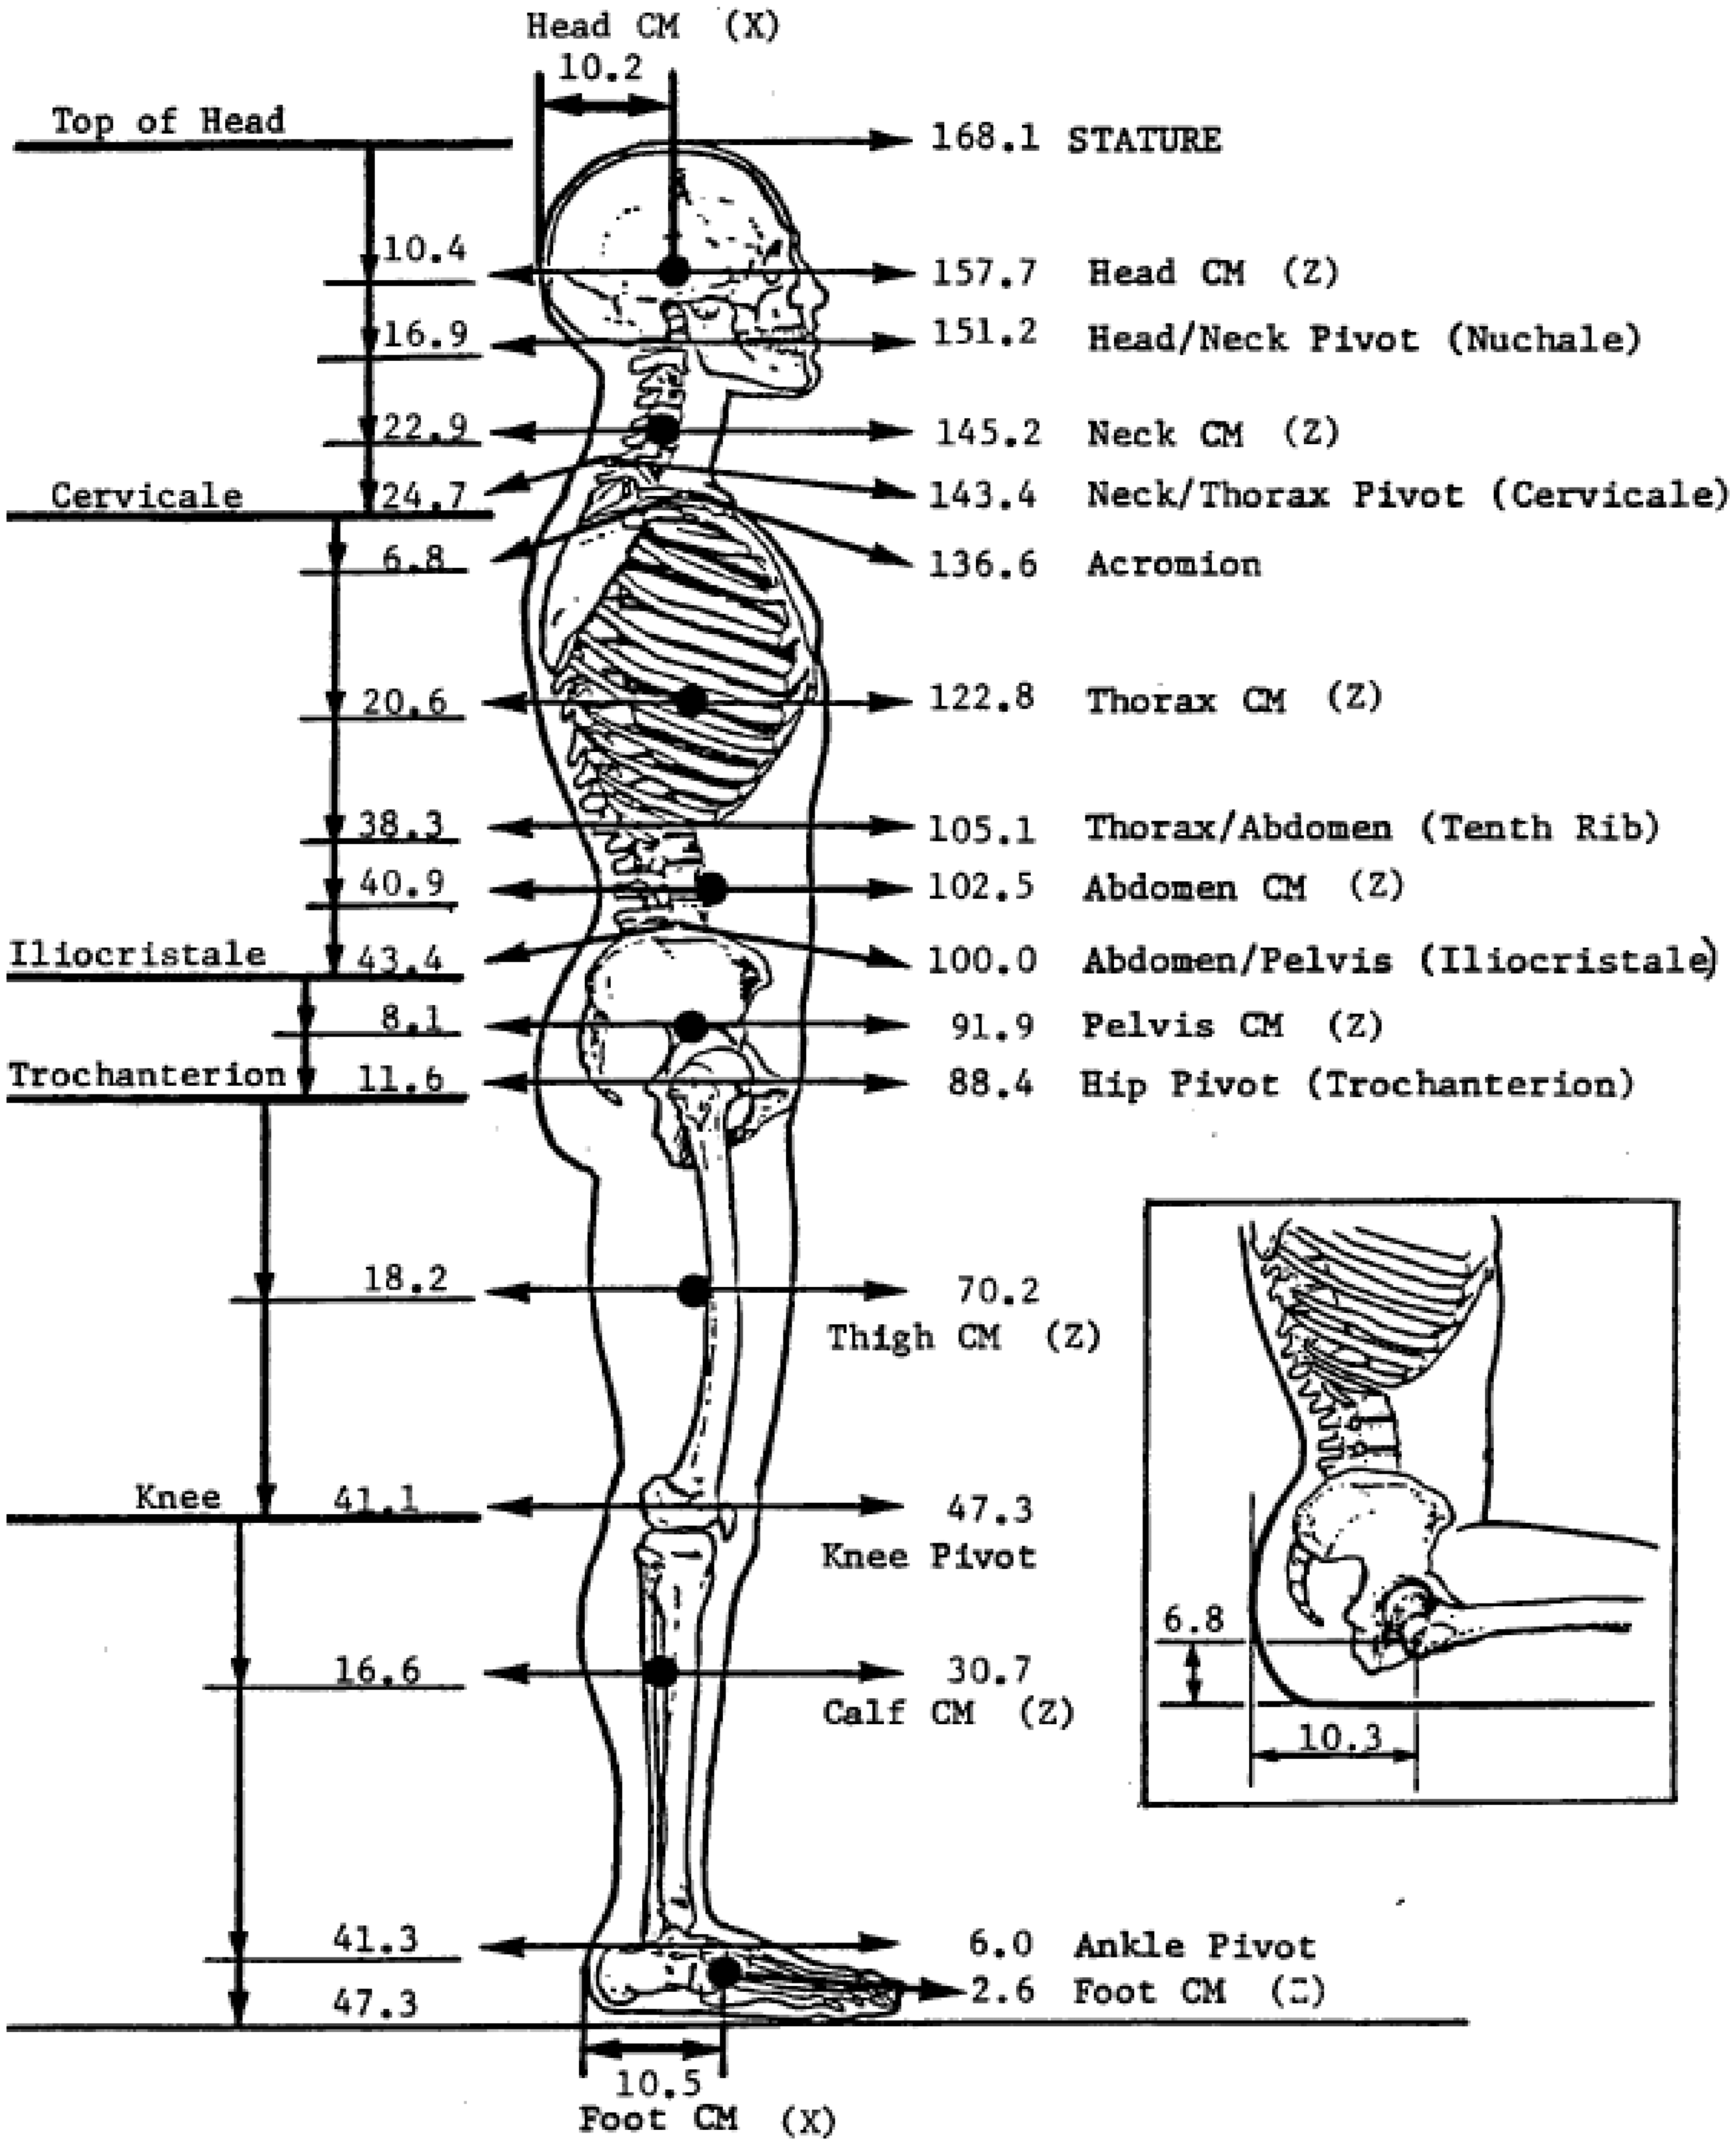
Body linkage and center of mass, 50th-percentile male. 1
Once the FE model was constructed for a standing position, it was transformed to a representative seated crew position using relevant anthropometric data for a seated military aviator, 1 including elbow rest height (dimension 50), elbow-wrist length (dimension 51), eye height, sitting (dimension 52); and forearm-hand length (dimension 57) as illustrated in Figure 3. Then, using the body linkage information, element connectivity was defined.
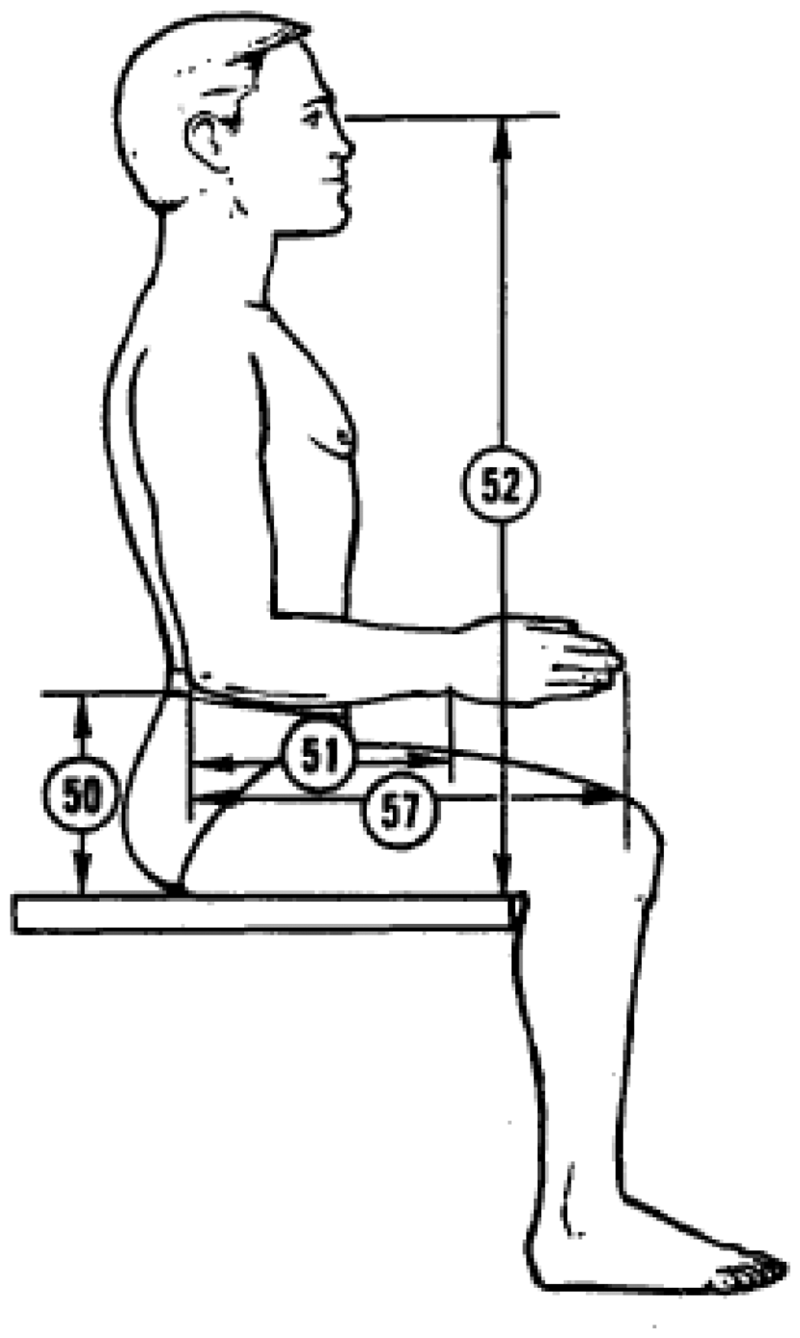
Seated position. 1
Inertia coordinate systems
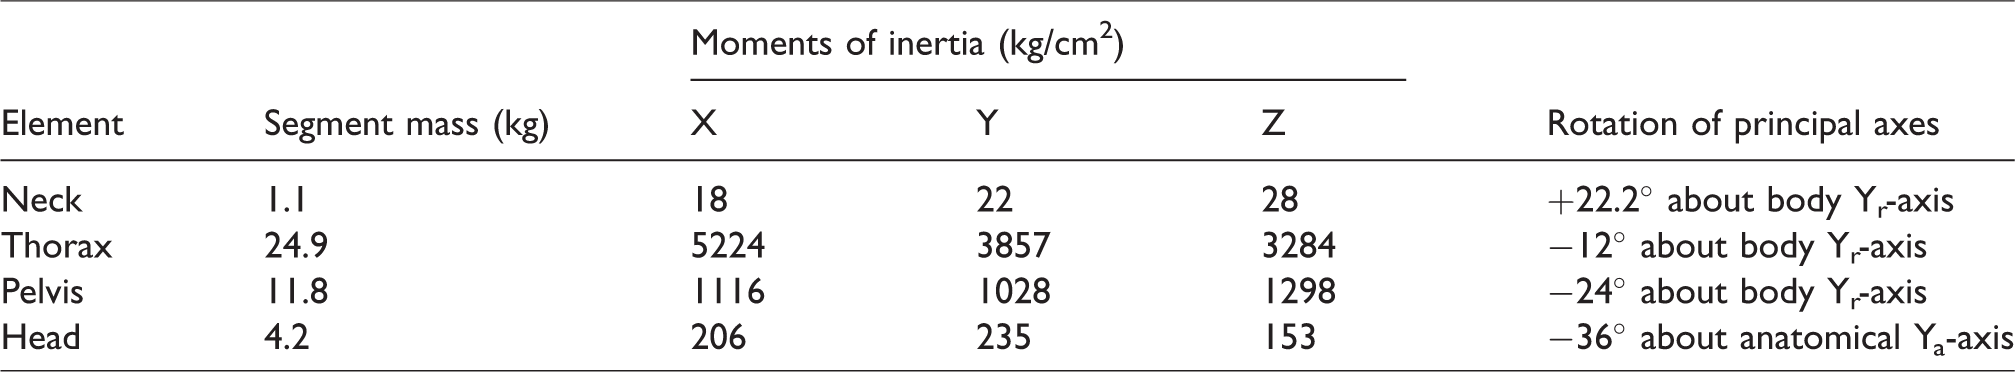
Masses and moments of inertia for the 50th-percentile American male head, neck, thorax, and pelvis are listed in Table 1. 1 Inertia coordinate systems for the head, neck, thorax, and pelvis are not coincident with the FE body model coordinate system (r) in which the Xr-axis is anterior, the Yr-axis points left, and the Zr-axis is superior and positive rotation is in the clockwise direction. Instead, the coordinate systems for inertial properties of the neck, thorax, and pelvis depicted in Figure 4 were defined with the origin at the body section center of mass and the principal axes rotated with respect to the FE body model Yr-axis, as described in Table 1.1,3 For the head, a local anatomically-defined coordinate system (a) was used as the reference coordinate system as shown in Figure 5 and the principal axes were rotated about the anatomical Ya-axis. 1
Masses and moments of inertia 50th-percentile male. 1
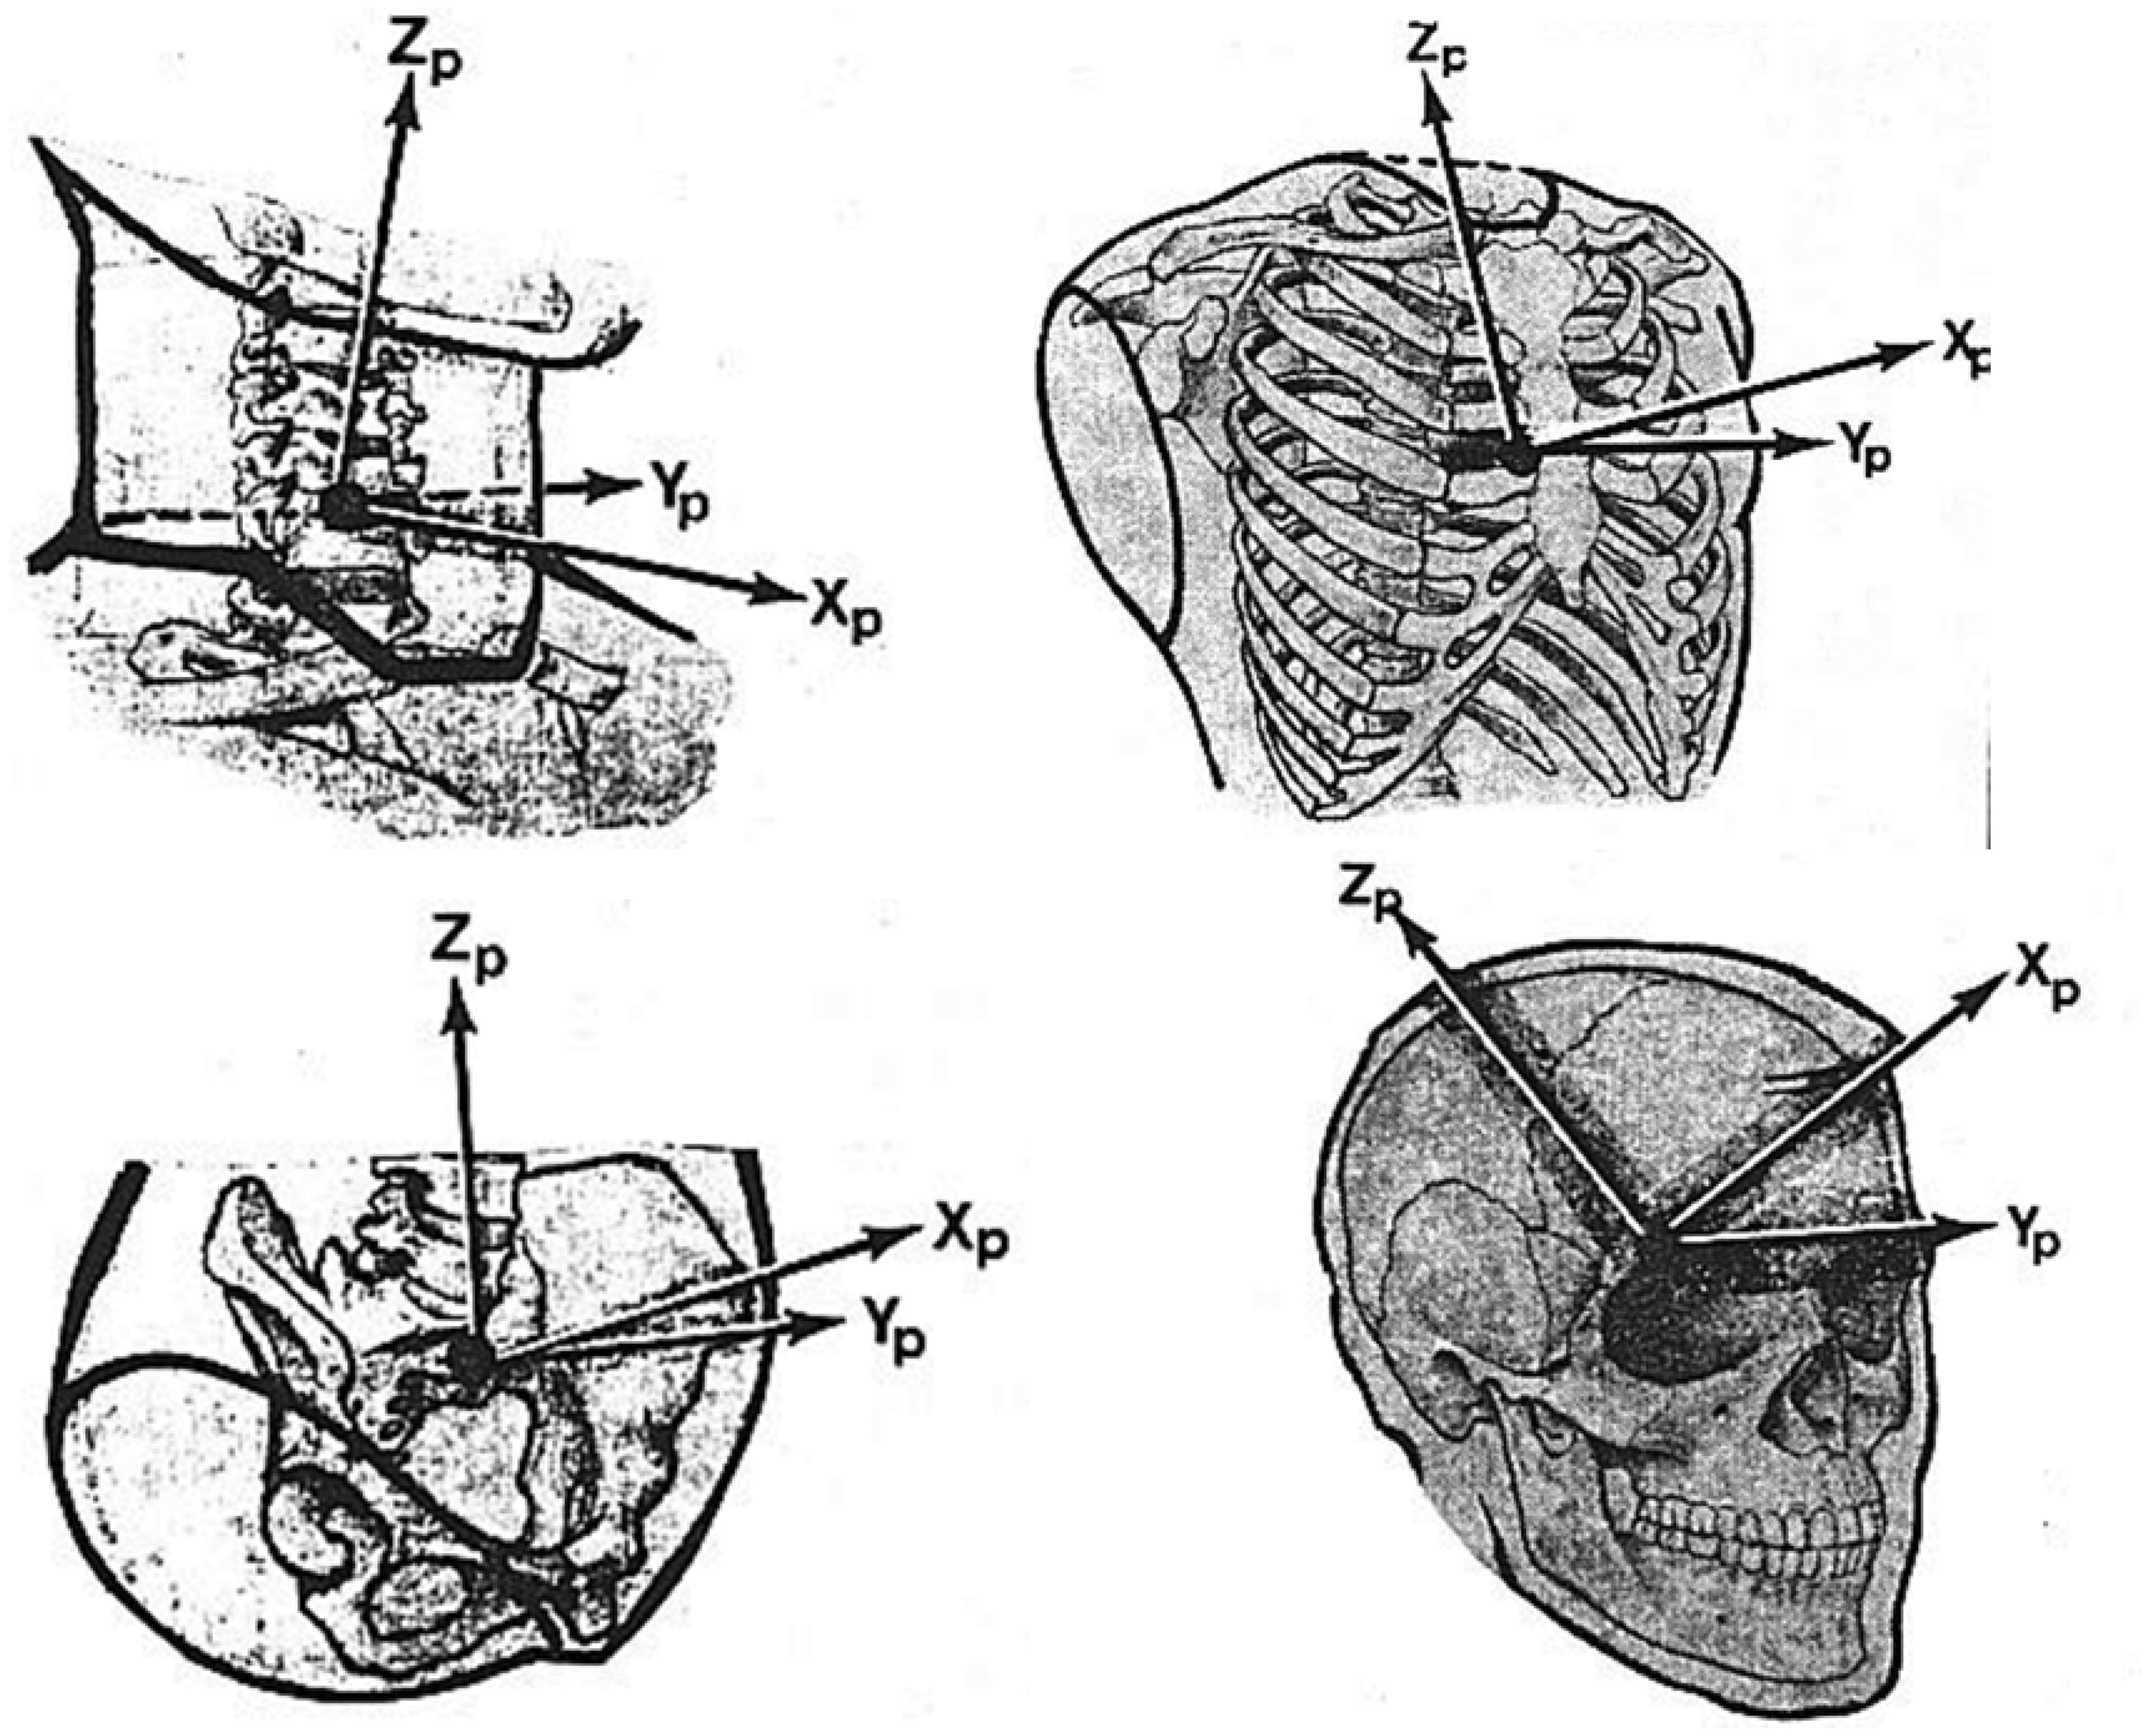
Inertial coordinates – neck, thorax, pelvis, head. 1
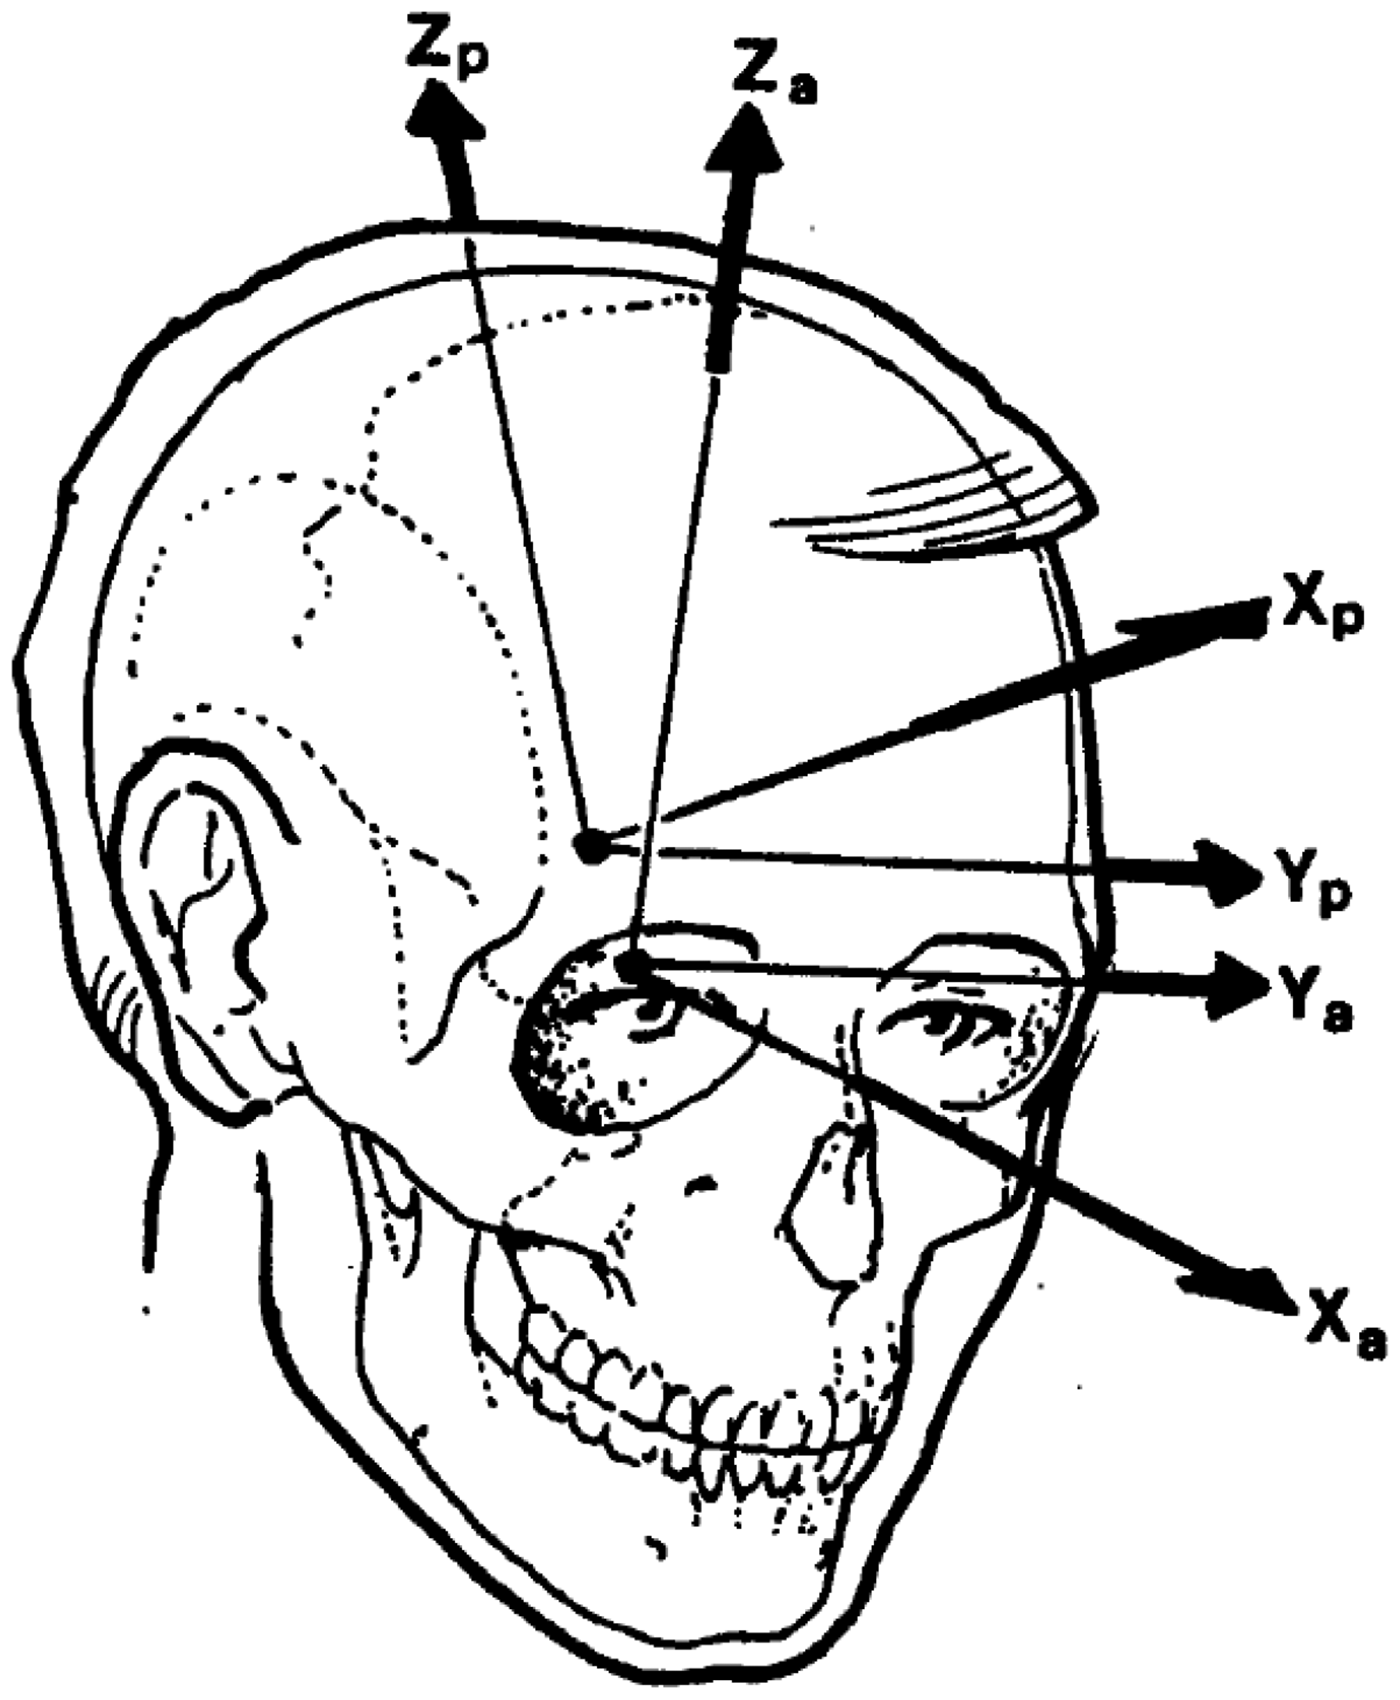
Principal axis orientation for the head. 1
Soft tissue vibration modes
The literature on human vibration modes is extensive, though not highly detailed. Results from vibration testing using human volunteer subjects4–15 and analysis using dynamic models of the human body16,17 were reviewed to determine appropriate soft tissue vibration modes for the HVM. Soft tissue vibration modes occur when a person’s internal organs (e.g. organs in the thorax, abdomen, and pelvis) vibrate independently from the rest of the human body. Based on testing reported by Coermann 4 of human response to low frequency vibrations in both the standing and sitting position, soft tissue vibration modes are sensitive to postural position. Spacecraft crew member body position is based on several factors such as cockpit layout, crew seat design, or mission phase (e.g. ascent position may be different than the position for entry and landing).
All references cited in this paper report human soft tissue response within a frequency range of 3 Hz to 14 Hz. The frequency can vary depending on test subject variables such as age, mass, sex, subject’s muscle tensing, and whether a pressure suit is worn.4,16,17 Soft tissue vibration modes may also vary depending on whether a backrest was used and seat restraint system design.4,9 However, Smith 12 reported that seat cushioning does not significantly affect soft tissue response. Dynamic excitation level and the static loading level also affect soft tissue response.4–8 These low-frequency modes may exist in all three axes, at approximately the same frequency in each axis.
A description of the effective mass of these soft tissue modes was not found during the literature survey. Therefore, no direct quantification of the participating mass was possible, and actual values for idealized mass and stiffness cannot be determined; only the ratio (i.e. frequency) can be estimated. Not knowing the effective mass is important since a large vibration response with little effective mass may have little impact on the overall response, while a response with large effective mass may have a significant effect. The mass of the trunk (i.e. the thorax, abdomen, and pelvis) was examined so that the soft tissue vibration modes could be represented in the FE model. Since the effective mass of these modes was not identified in the available literature, an estimated division of the mass was determined by using the following method, consistent with the model created by Smith. 17 Two-thirds of the trunk mass, after reduction for bone mass, was assigned to the soft tissue (∼45 lb or 20.4 kg) while one-third of the trunk remained with the “skeleton” (∼23 lb or 10.4 kg).
Translational springs were used in the model to connect the thorax, abdomen, and pelvis soft tissue nodes with the skeleton nodes. The soft tissue nodes are coincident with the skeleton nodes. The spring constant was varied to obtain the desired natural frequency. The three soft tissue nodes were connected to each other in the model to avoid multiple, individual soft tissue modes. Since the purpose of the model was for use in CLA, discrete dampers were not included. However, damping was considered on a frequency basis as described in Section 3.
The initial 50th-percentile male HVM was created using a natural soft tissue frequency of 6 Hz. However, the soft tissue frequency may be tailored in the model within a range of 3–14 Hz. Static g-conditions may shift the frequency to as high as ∼12 to 14 Hz. Thus, it may be useful to align soft tissue frequency with the predicted CLA peak excitation frequency for a given spacecraft, since this would yield the most conservative (worst-case) estimates for HVM response.
Skeleton and joint rotational stiffness
The human skeleton is relatively stiff compared to soft tissue and joints. Further, the frequency of individual bone modes is higher than the range of interest for human spacecraft CLA. However, numerical modeling issues and limitations prohibited the use of a completely rigid “skeleton” in the HVM. For example, LS-DYNA® does not allow rigid elements to be connected to one another, and overly stiff elements can lead to excessively small integration time steps if the model is used for numerical simulations. Thus, the approach used in creating the HVM was to represent the skeleton using beam elements. The beam elements implemented in the model were created using published bone material properties including bone density. The diameter of the beams was set to one inch. This modeling approach provided a rough order of magnitude prediction of skeleton stiffness. Each lumped mass and inertia was reduced by the mass of the adjoining skeleton element, maintaining the correct total mass and distribution.
Relaxed (passive) joint stiffness values used in the HVM are based on those reported by Engin and Cheng.18,19 Joint stiffness values are assumed linear in this model since joint rotations are less than ±0.5 radians (∼28°). 20 Additional joint characteristics – range of motion, load curve scale factor, and damping coefficients – were extracted from the LS-DYNA® implementation of Engin and Cheng’s work for the pelvis, waist, lower neck, upper neck, shoulder, elbow, hip knee, and ankle. Each joint/pivot point is defined in the model by two nodes that are constrained in translation and connected rotationally with linear rotational springs.
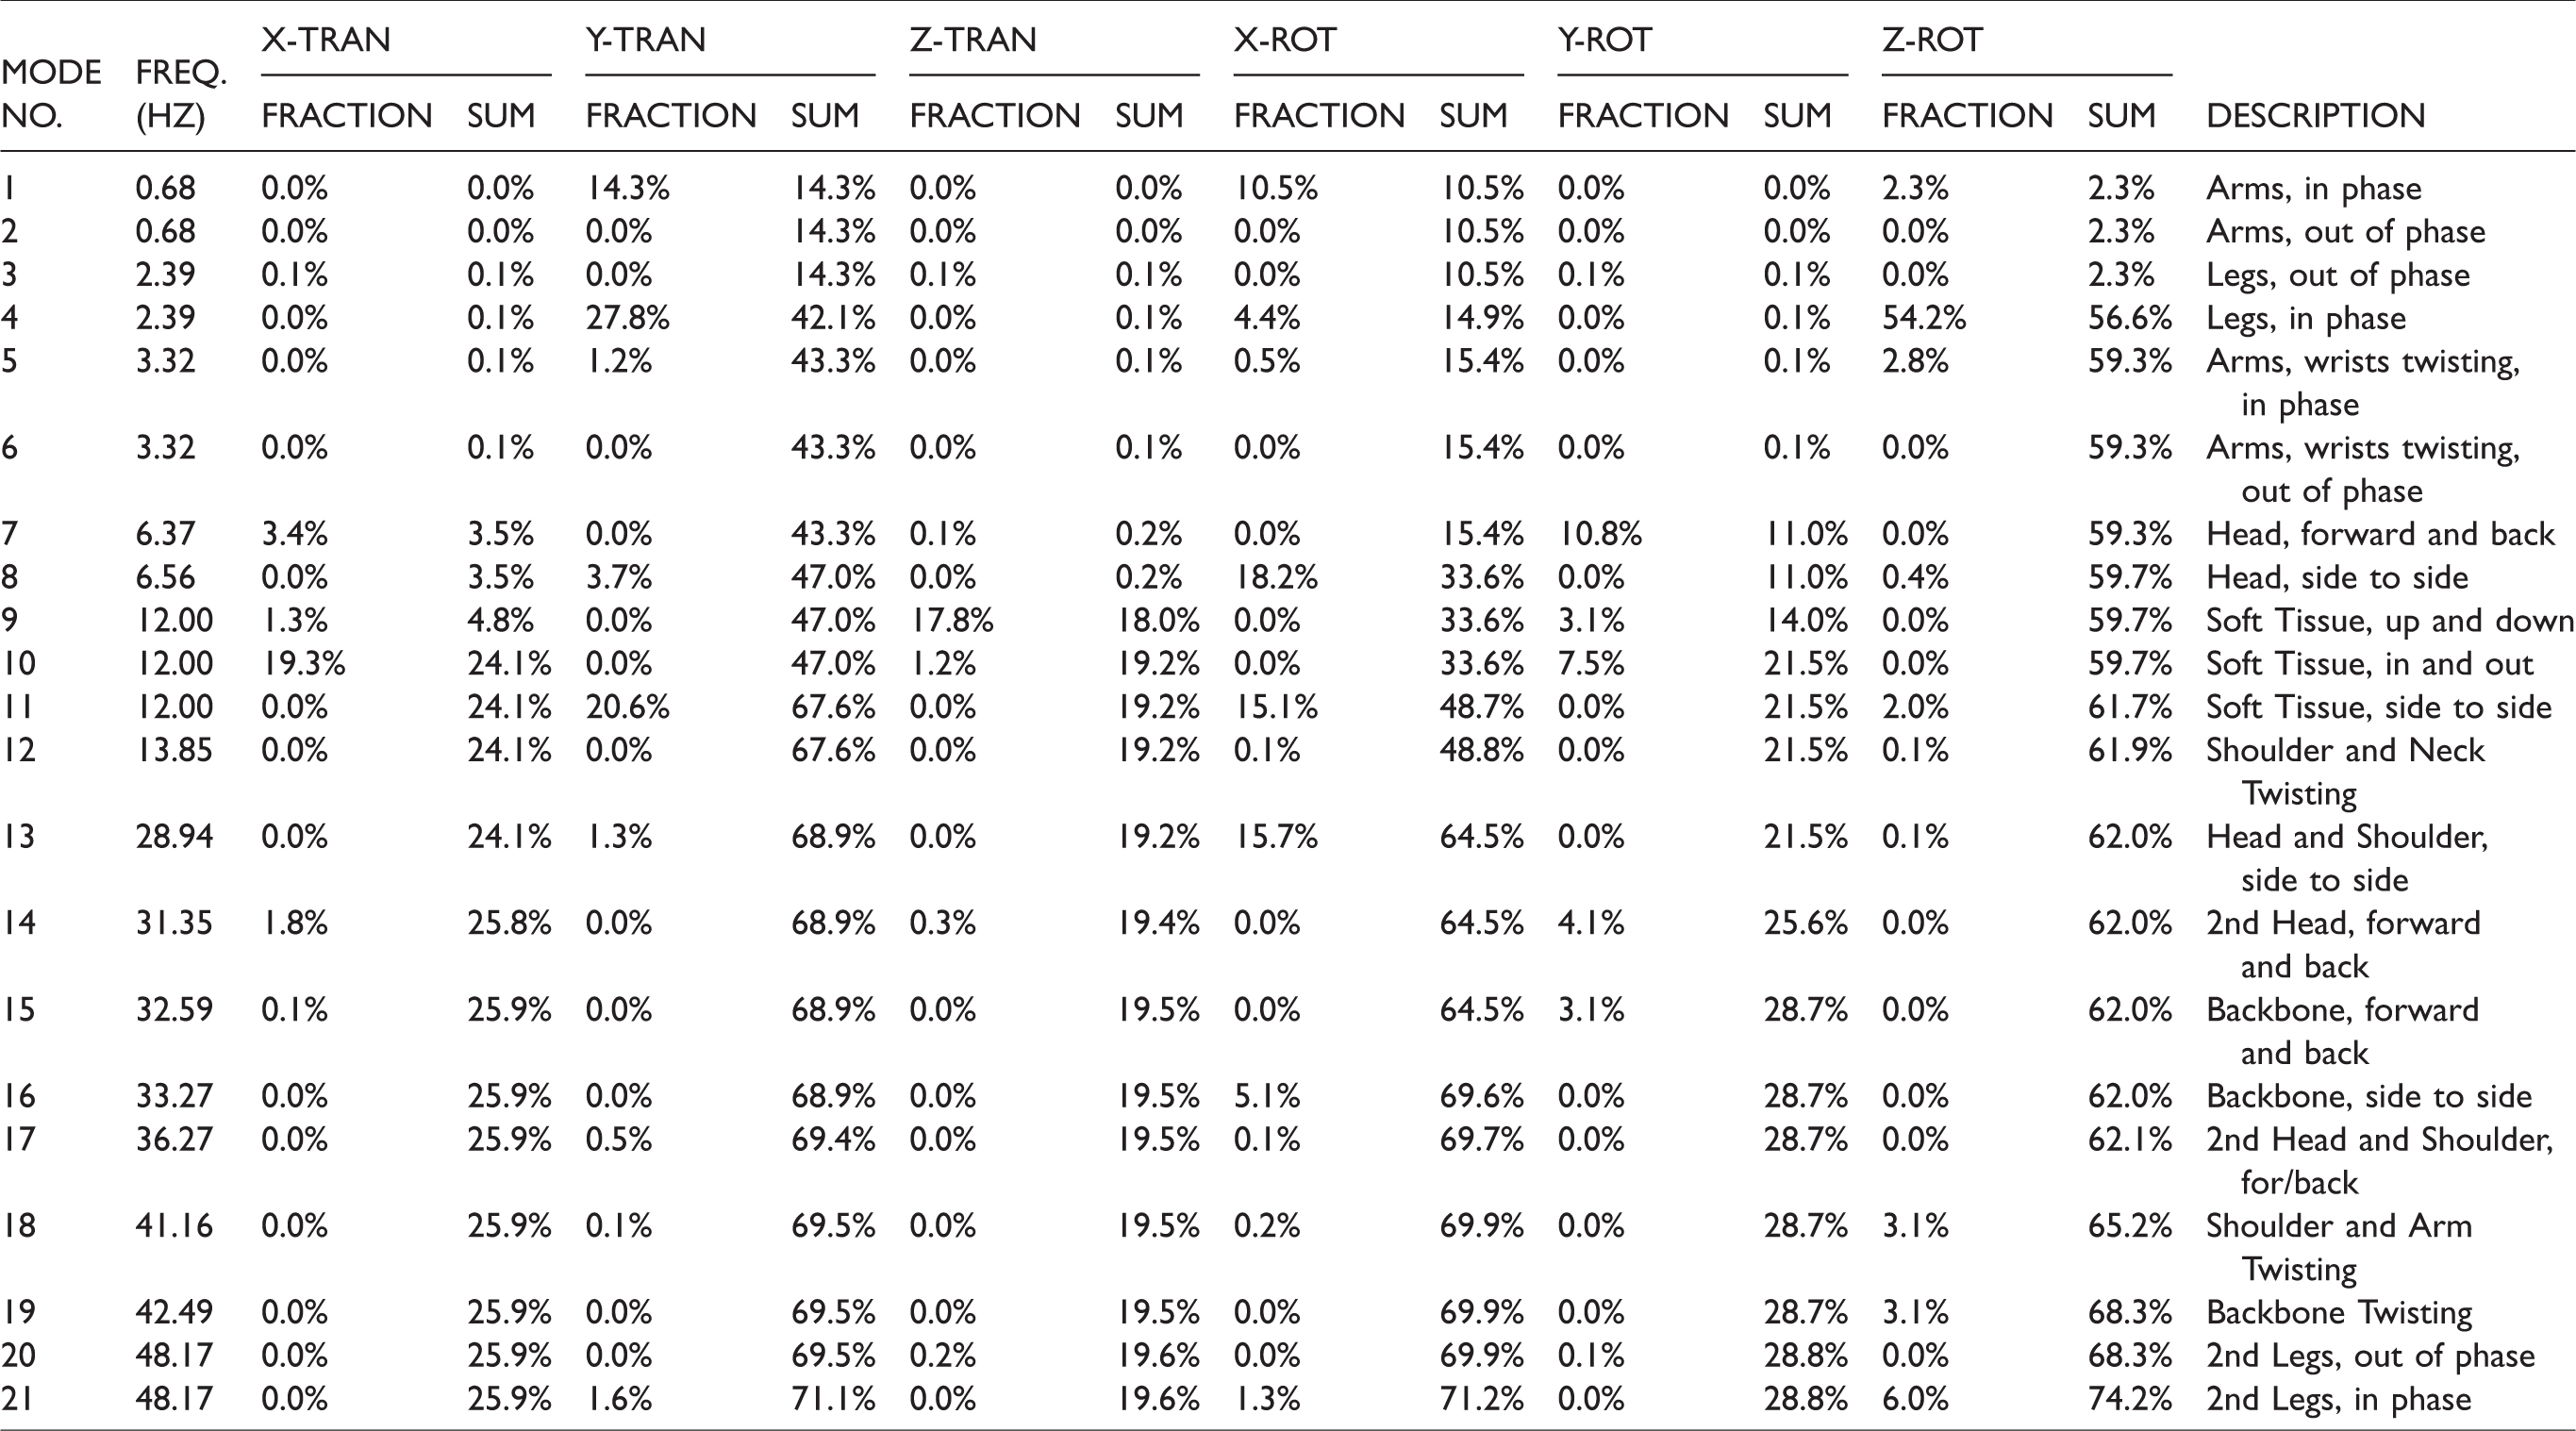
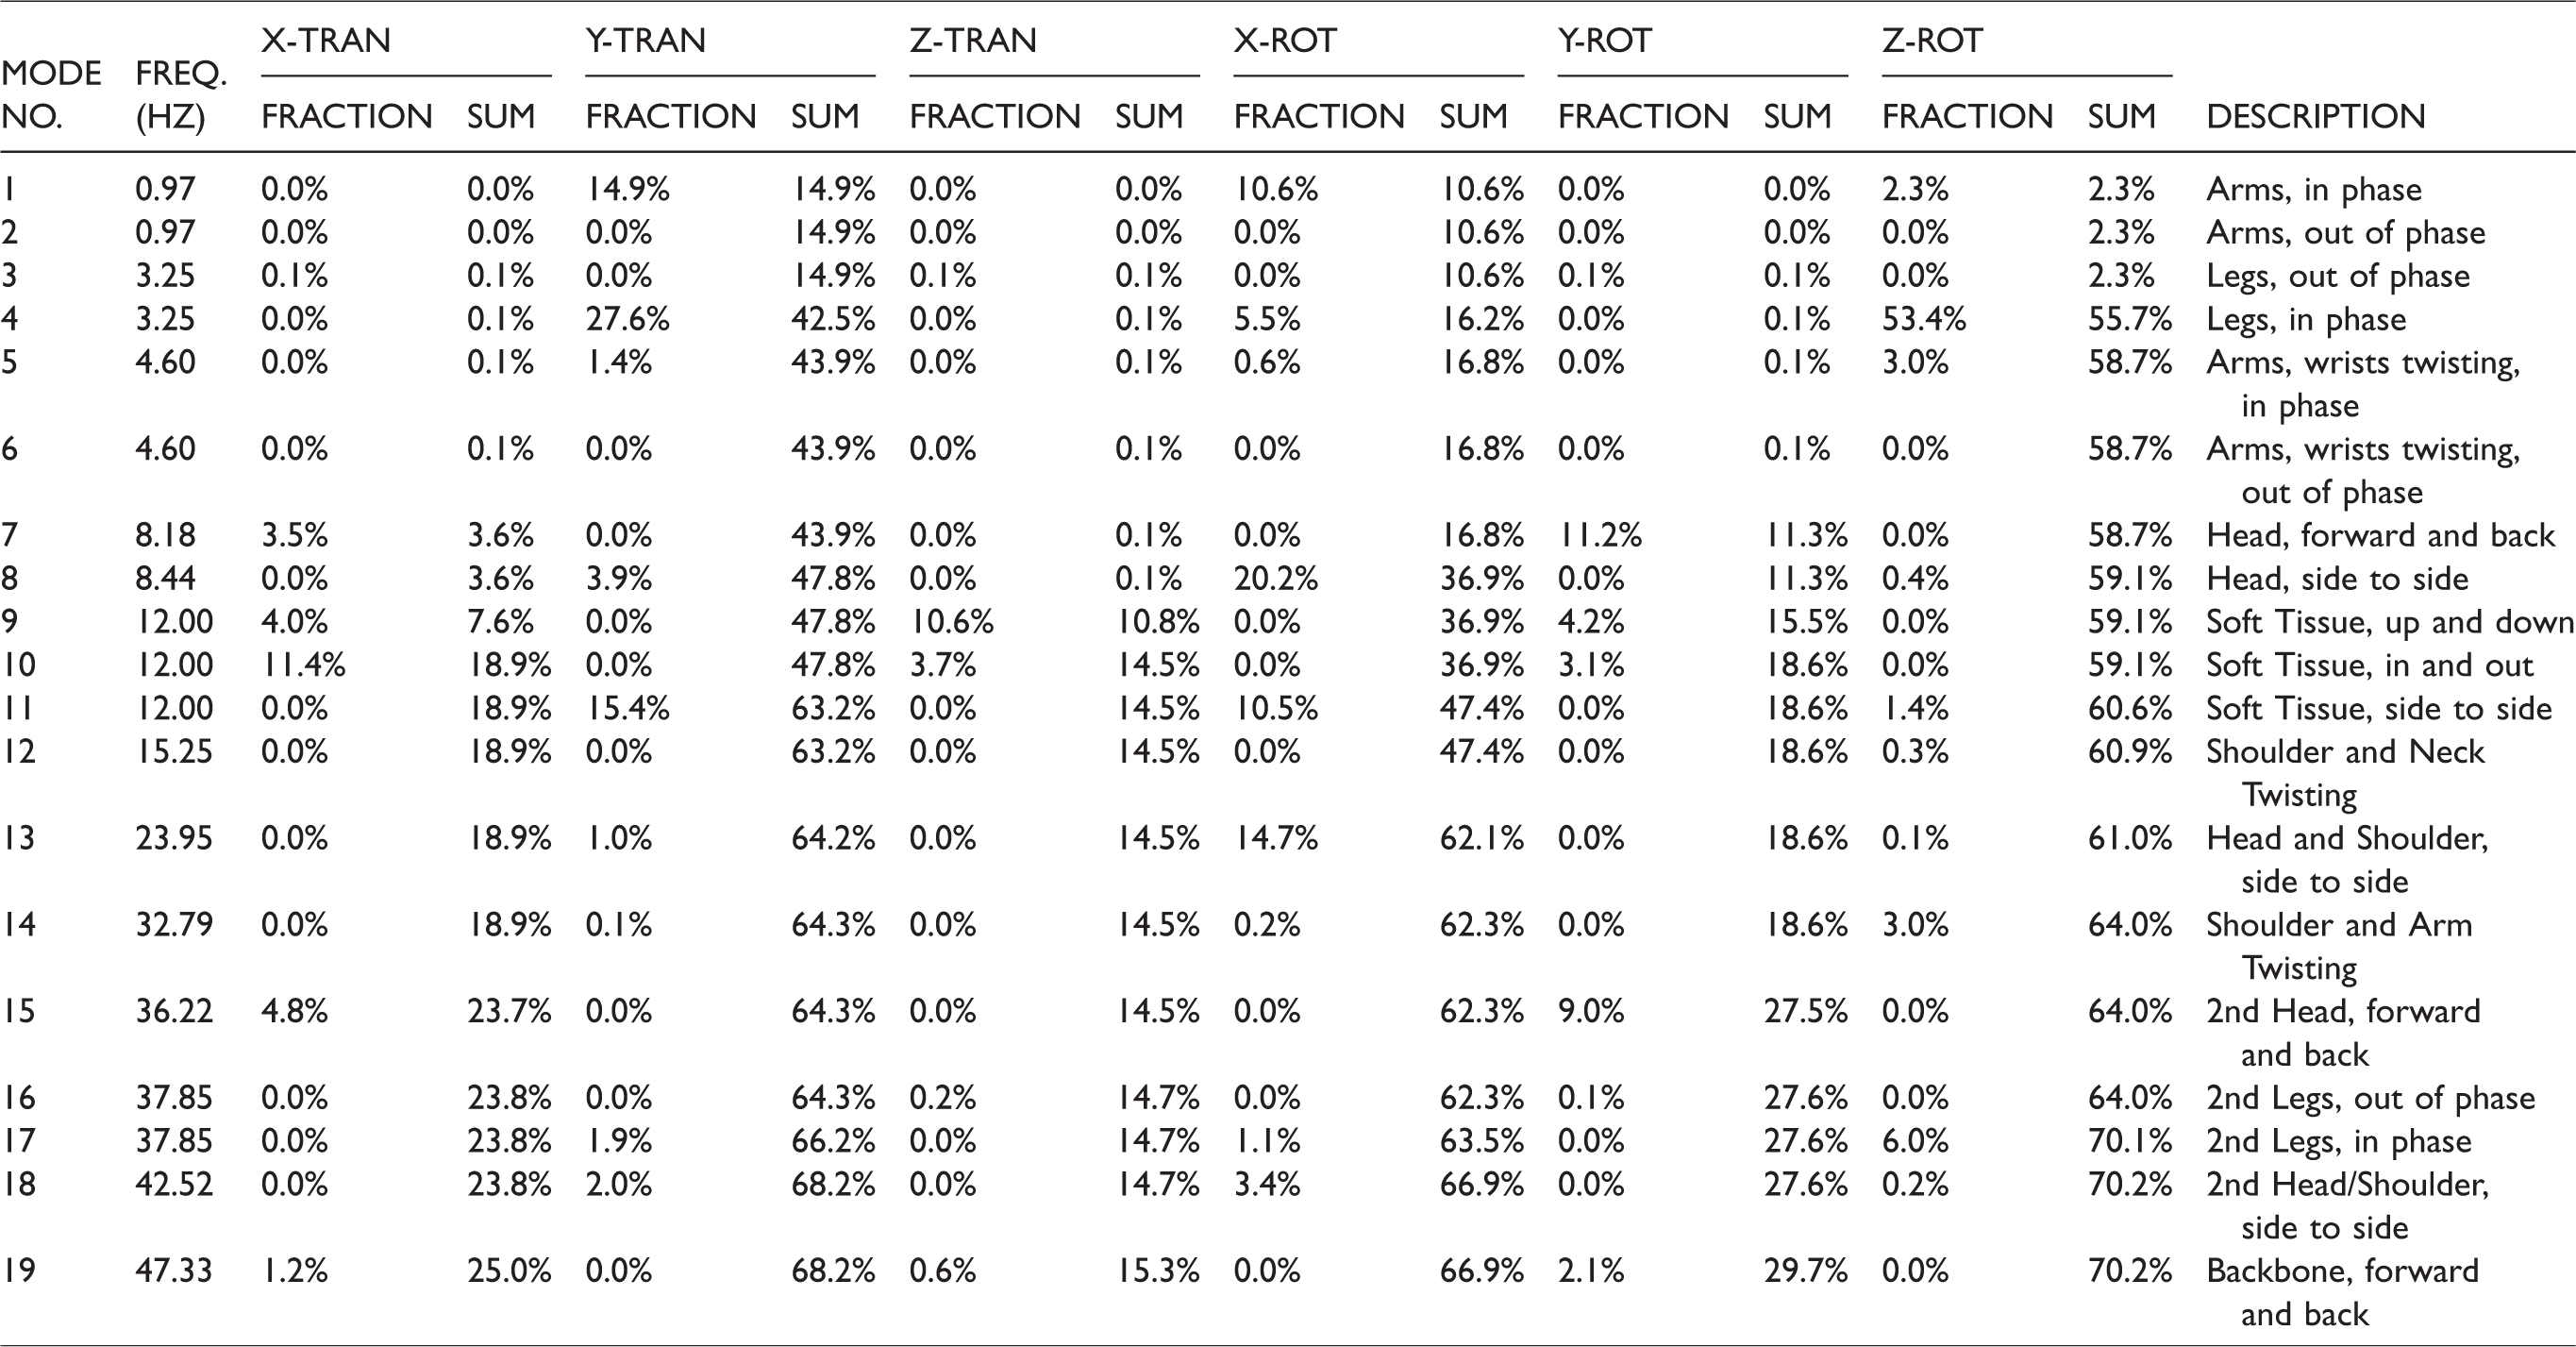
The thorax, pelvis, hands, and feet are defined as boundary points to denote motion constraints imposed by typical spacecraft seat and restraint designs. When the HVM is integrated with a FE seat model, these nodes can be connected to seat nodes and the boundary conditions can be modified to reflect any imposed constraints to motion. During initial standalone model validation, natural frequencies and mode shapes of the 50th-percentile male HVM were calculated with the thorax, pelvis, hands, and feet fixed to the ground to minimize low effective mass modes caused by limb flail. The vibration modes, frequencies, and a description of the associated mode shapes for the 50th-percentile male HVM are listed in Table 2.
Frequency modes for 50th-percentile male HVM.
Model correlation
Vibration testing was conducted at the NASA Johnson Space Center using a 50th-percentile male manikin in a spacecraft seat/restraint system as shown in Figure 6. Accelerometer data recorded during that testing was post-processed to derive vibration mode shapes and frequencies for use in simulation studies to compare the performance of the 50th-percentile male HVM developed in this study to the previous lumped-mass vibration model used in spacecraft CLA. Both models were integrated into a FE model of the crew seat used during vibration testing.
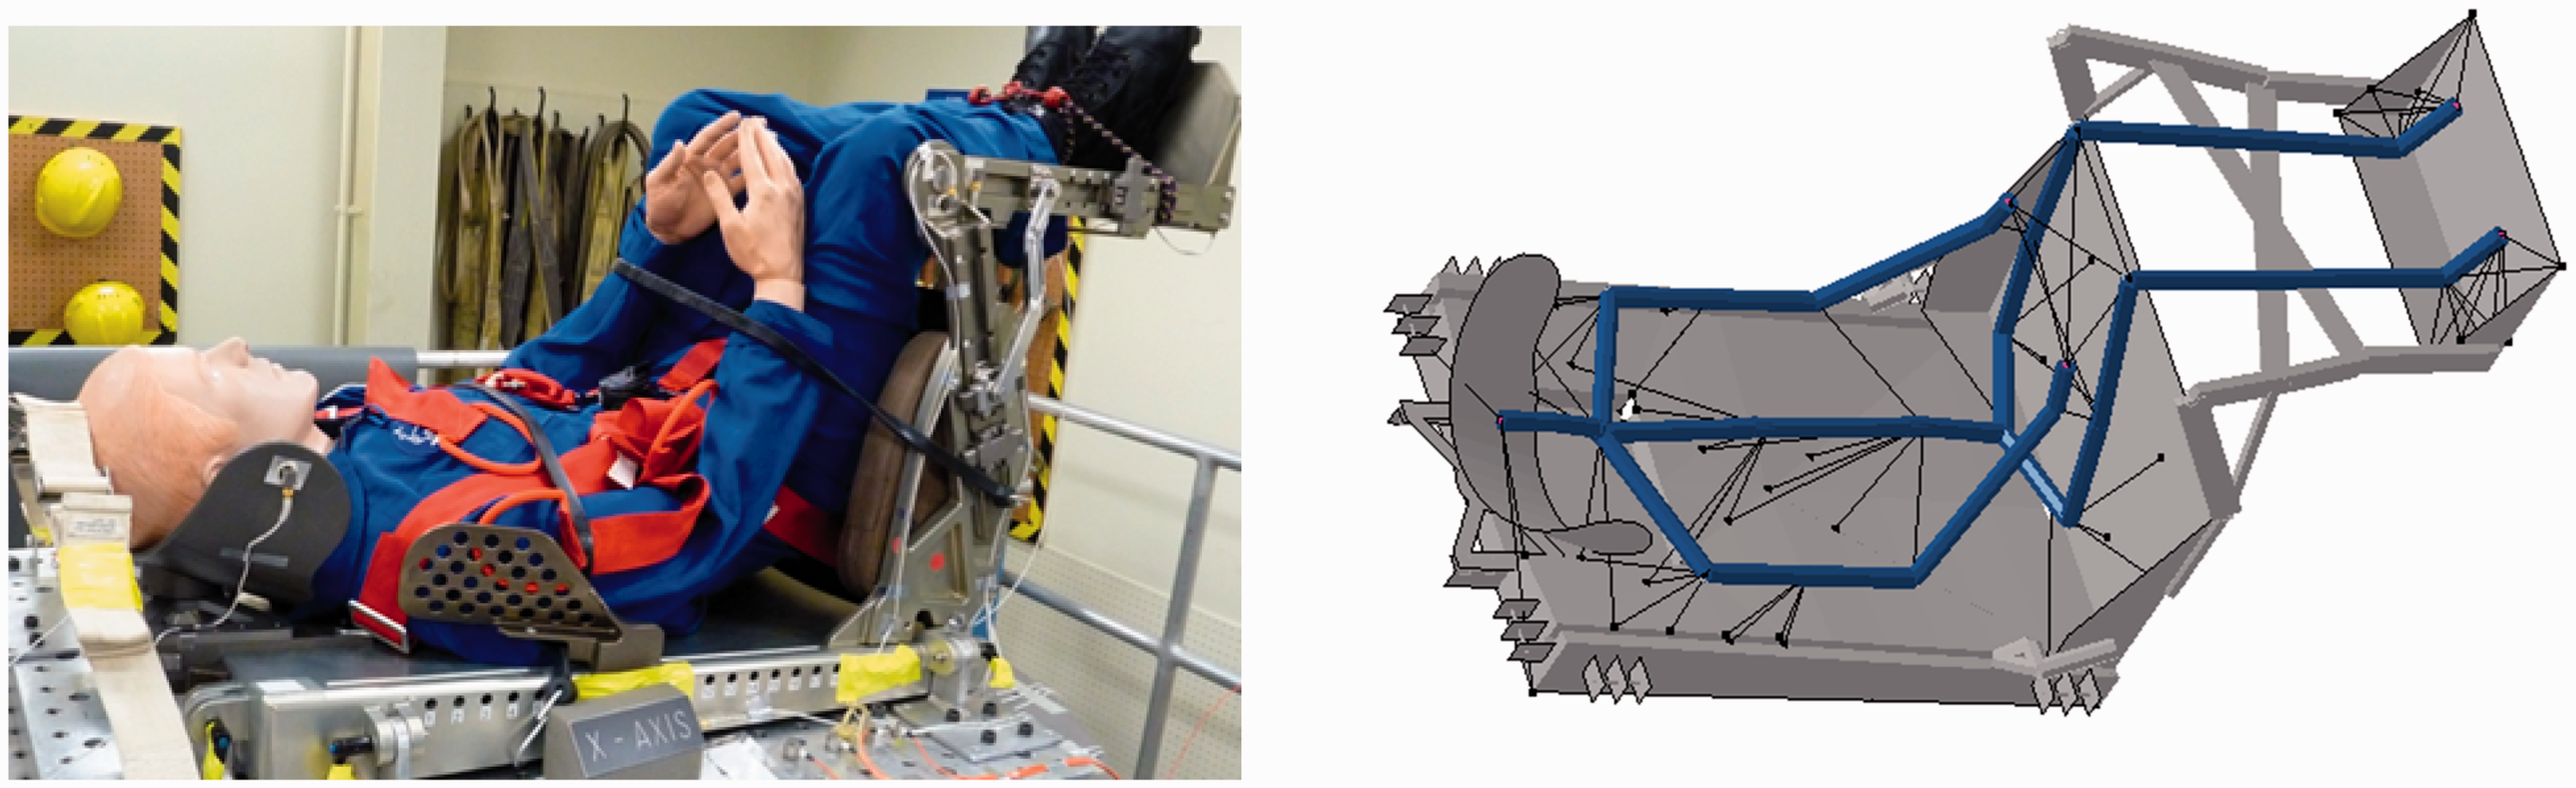
Seat vibration tests with 50th-percentile male manikin (left) and FE model of seat test (right).
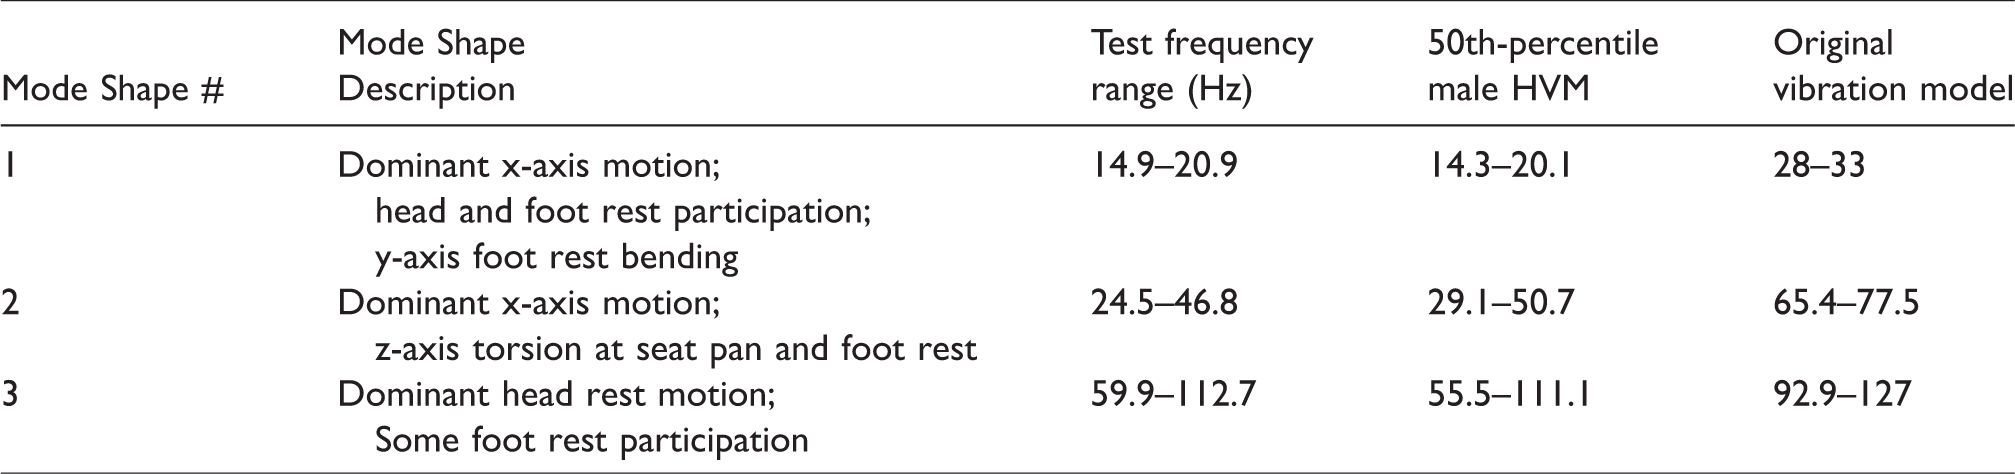
Model correlation results, shown in Table 3, demonstrate that the 50th-percentile male HVM demonstrated good correlation to the mode shapes and low frequencies recorded during crew seat vibration testing with a representative manikin. Alternatively, the original lumped-mass model was excessively stiff and did not sufficiently represent the mode shapes or frequencies of the combined crew/seat response. Seat test data exhibited response modes in the 14.9–20.9 Hz range, primarily due to axial motion of the seat back, seat pan, and foot rest. Some torsion was also noted. Modal analysis using the 50th-percentile male HVM reproduced first mode frequencies in the range of 14.3–20.1 Hz; whereas the first mode in the original lumped-mass HVM was in the range of 28–33 Hz, with no low-frequency torsion detected.
Comparison of seat vibration data to model analysis results.
First-percentile American female and 99th-percentile American male HVMs
Additional HVMs representing 1st-percentile American female and the 99th-percentile American male crew members were also developed in order to perform CLA sensitivity studies over the full range of anthropometric sizes of crew specified in NASA human–systems integration requirements. The same model development process used to create the 50th-percentile HVM was used to create these models with the exceptions noted below. Figure 7 depicts FE representations of the three-seated HVMs–1st-percentile female, 50th-percentile male, and 99th-percentile male, respectively.
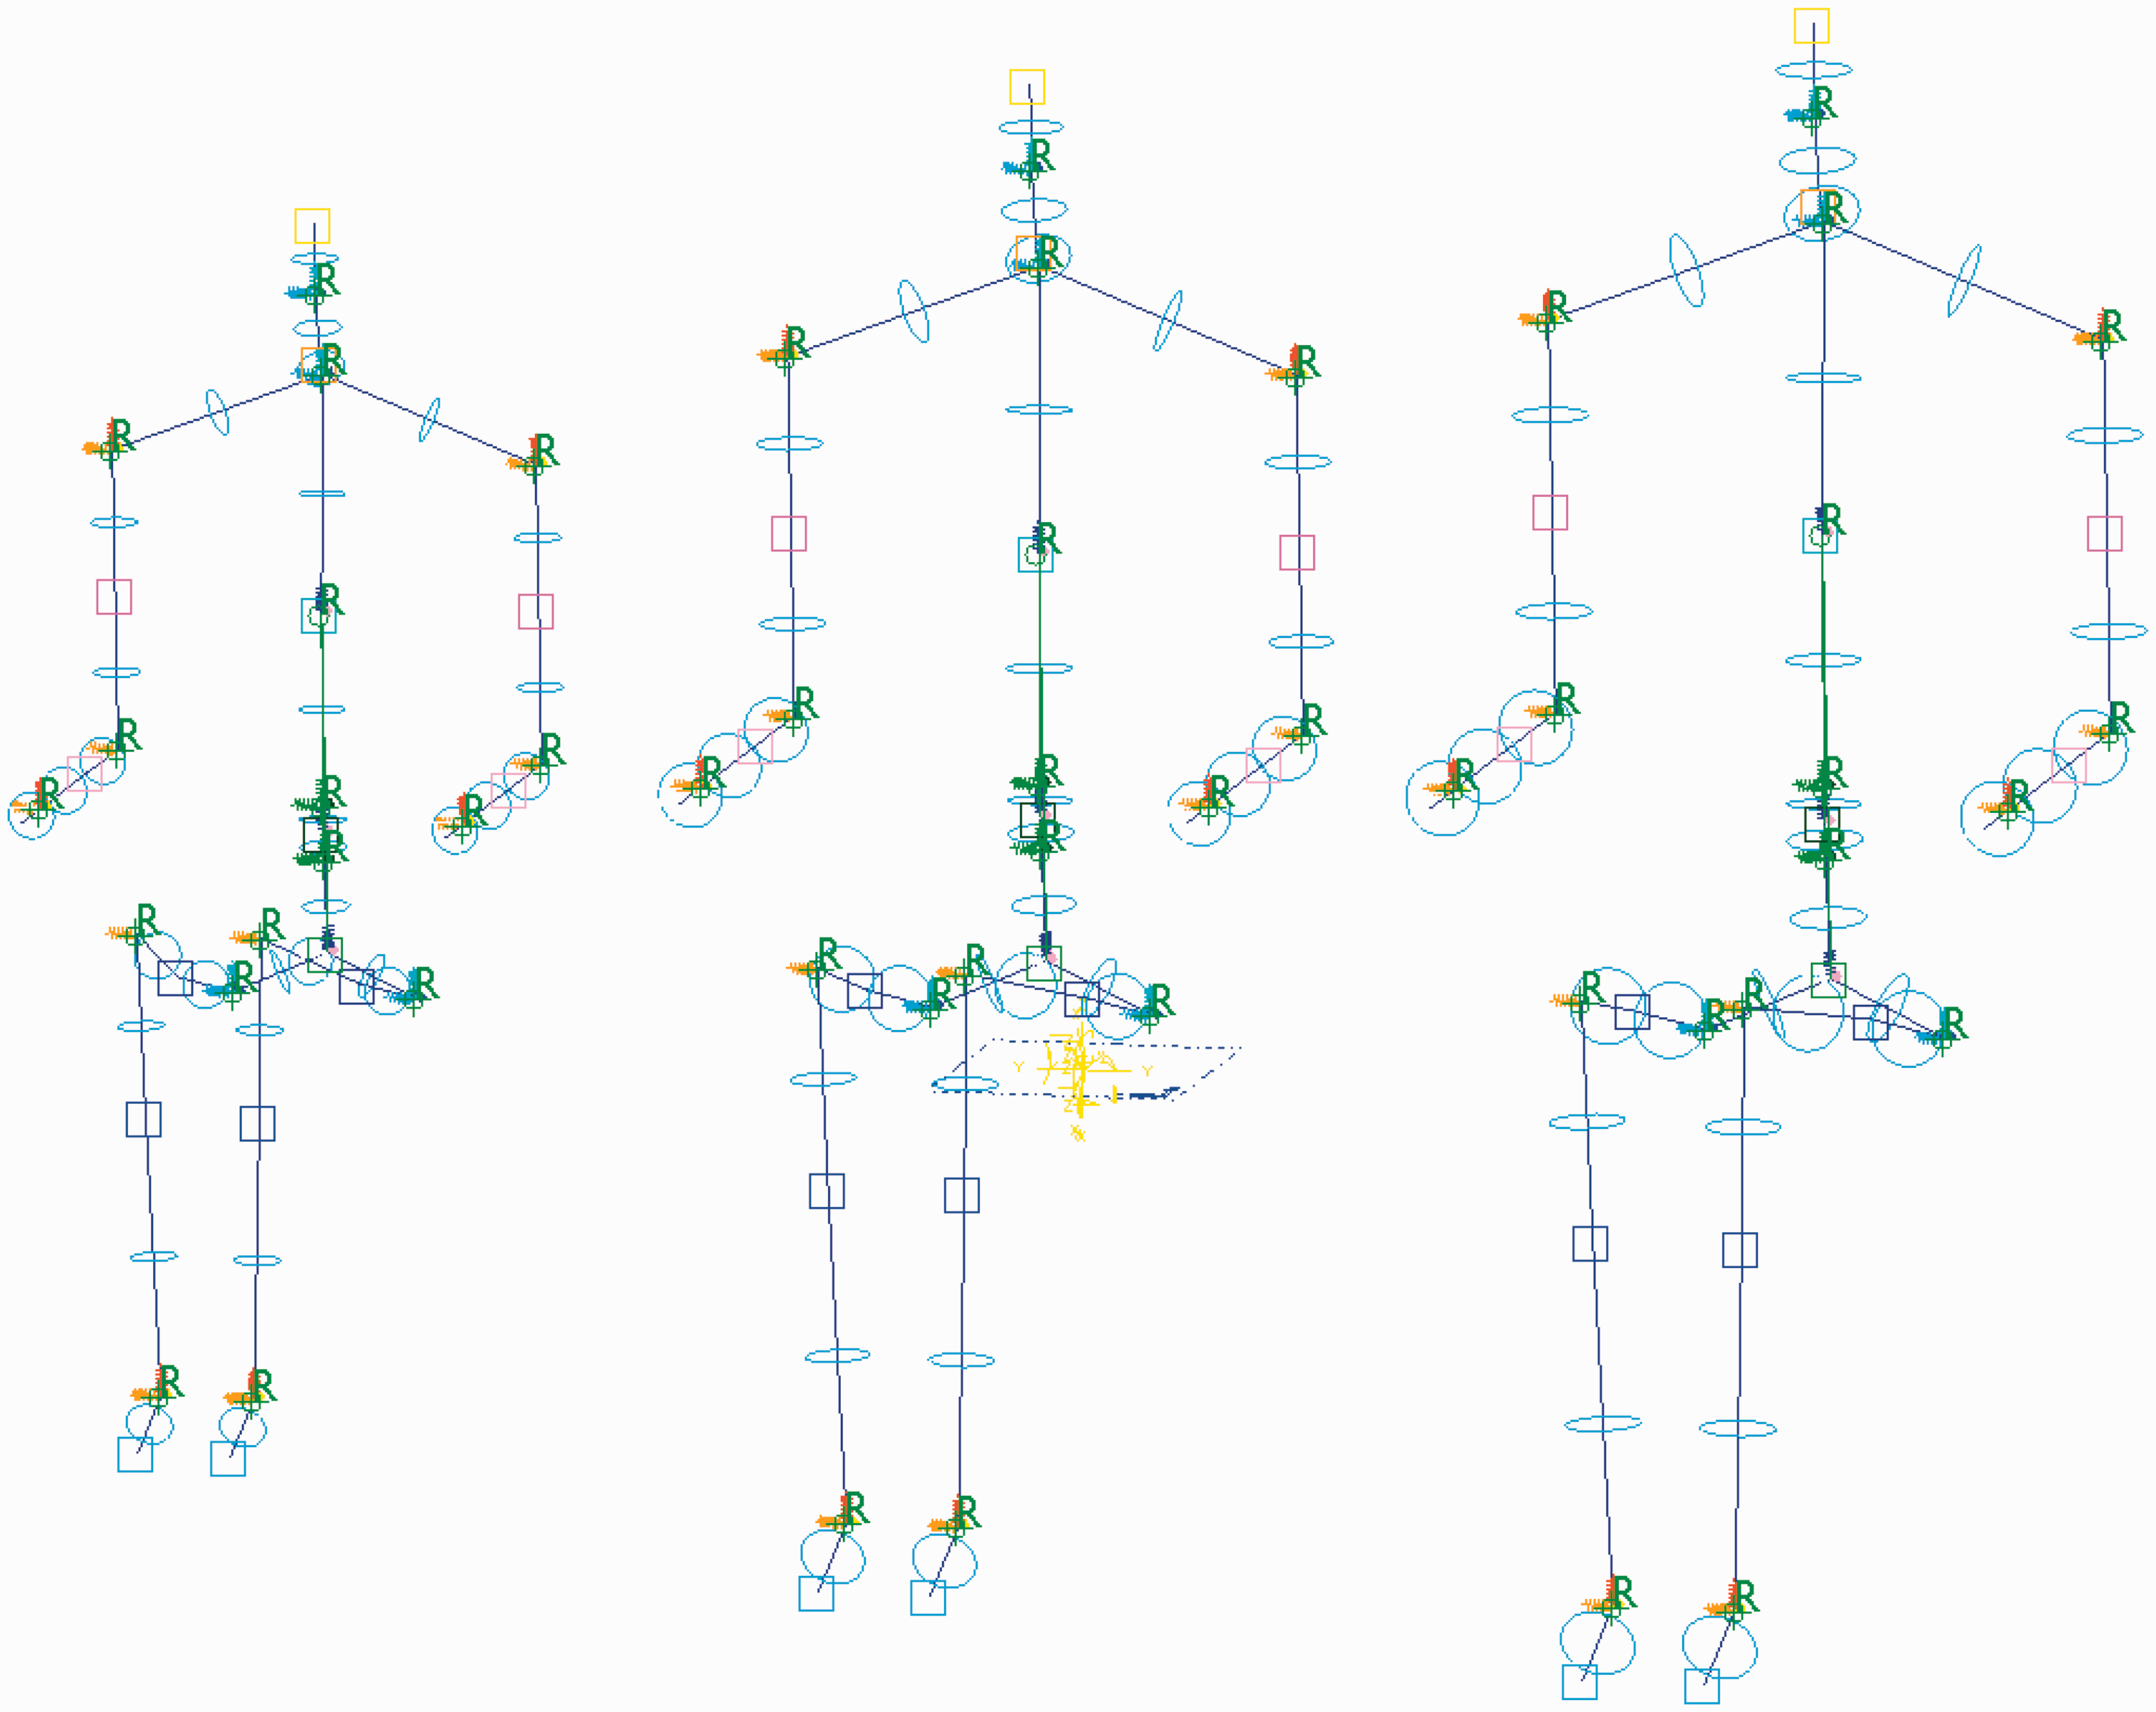
1st-% female, 50th-% male, 99th-percentile male HVMs in seated position.
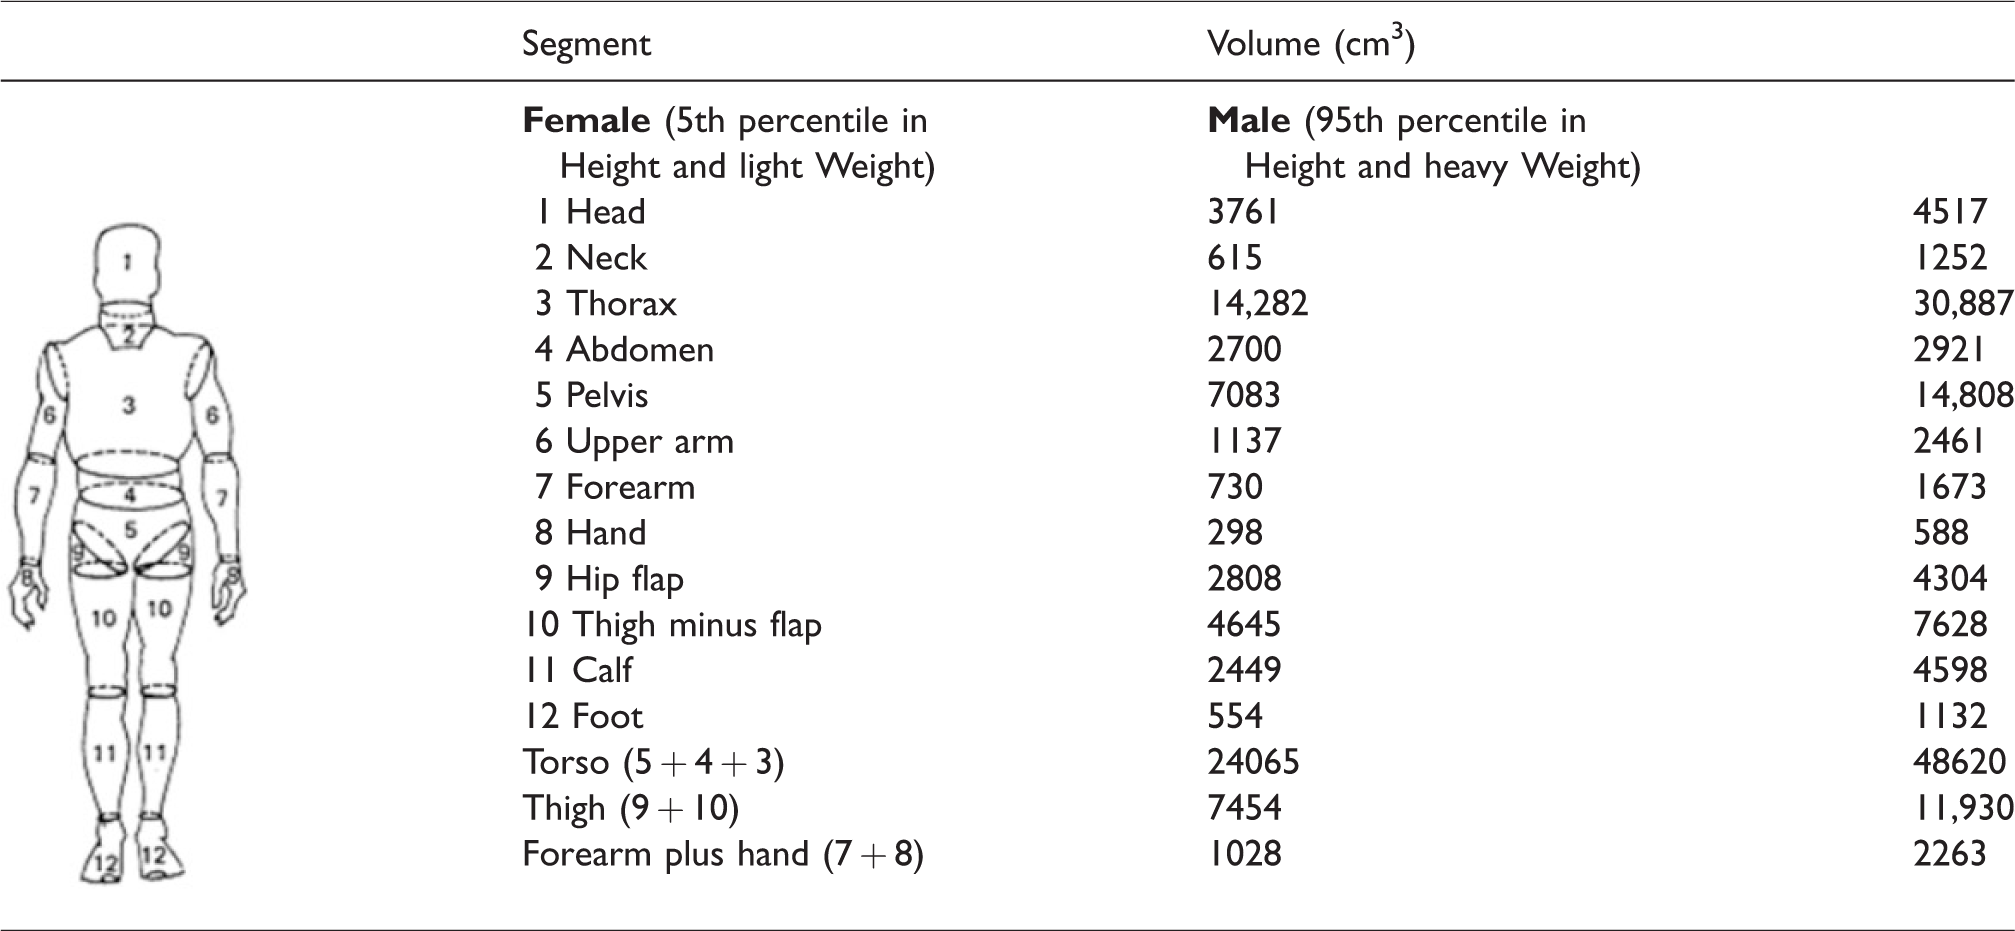
Mass properties, stature, sitting height, and body segment mass values for 1st-percentile female (min) and 99th-percentile male (max) are provided in NASA’s human-systems integration requirements and design standards and are listed in Tables 4 and 5.21,22 Suited mass values include the worst-case estimate for crew-worn equipment mass. Individual body segment lengths were derived by scaling the 50th-percentile male model. Body segment lengths for the 1st-percentile female HVM were derived by scaling the 50th-percentile male body segment lengths by a factor of 0.833, derived from the ratio of 1st-percentile female to 50th-percentile male stature. Similarly, the scaling factor for 99th-percentile male body segment lengths, 1.091, was derived from the ratio of 99th-percentile male to 50th-percentile male stature. This scaling approach was necessary because the distribution of segment length for a given anthropometric subgroup (e.g. 1st-percentile American female) is not available. An individual’s physical attributes rarely, if ever, have the same percentile ranking. For example, a female who is 1st-percentile in stature may have 73rd-percentile arm length. While there is some correlation among various anthropometric measurements, the correlation is not strong across all measurements. 22 Thus, it is extremely rare, if not impossible, for the same percentile classification to apply to all anthropometric dimensions for a single person. In essence, a 1st-percentile person is unrealistic. Also, anthropometric percentiles do not obey the laws of addition and subtraction. For example, the 1st-percentile arm length cannot be calculated by adding the 1st-percentile lengths of the upper and lower arm segments. While this scaling approach may provide a reasonable estimate of body segment length, it is important to note that consideration of the effects of body part length distributions on vibration response was considered beyond the scope of this study.
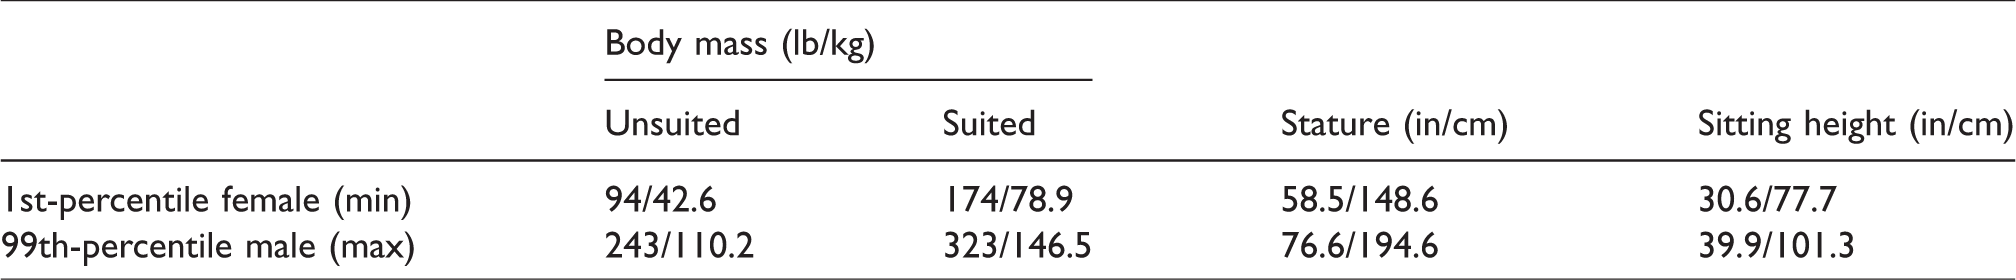
Body segment masses, min (1st-percentile female) and max (99th-percentile male).
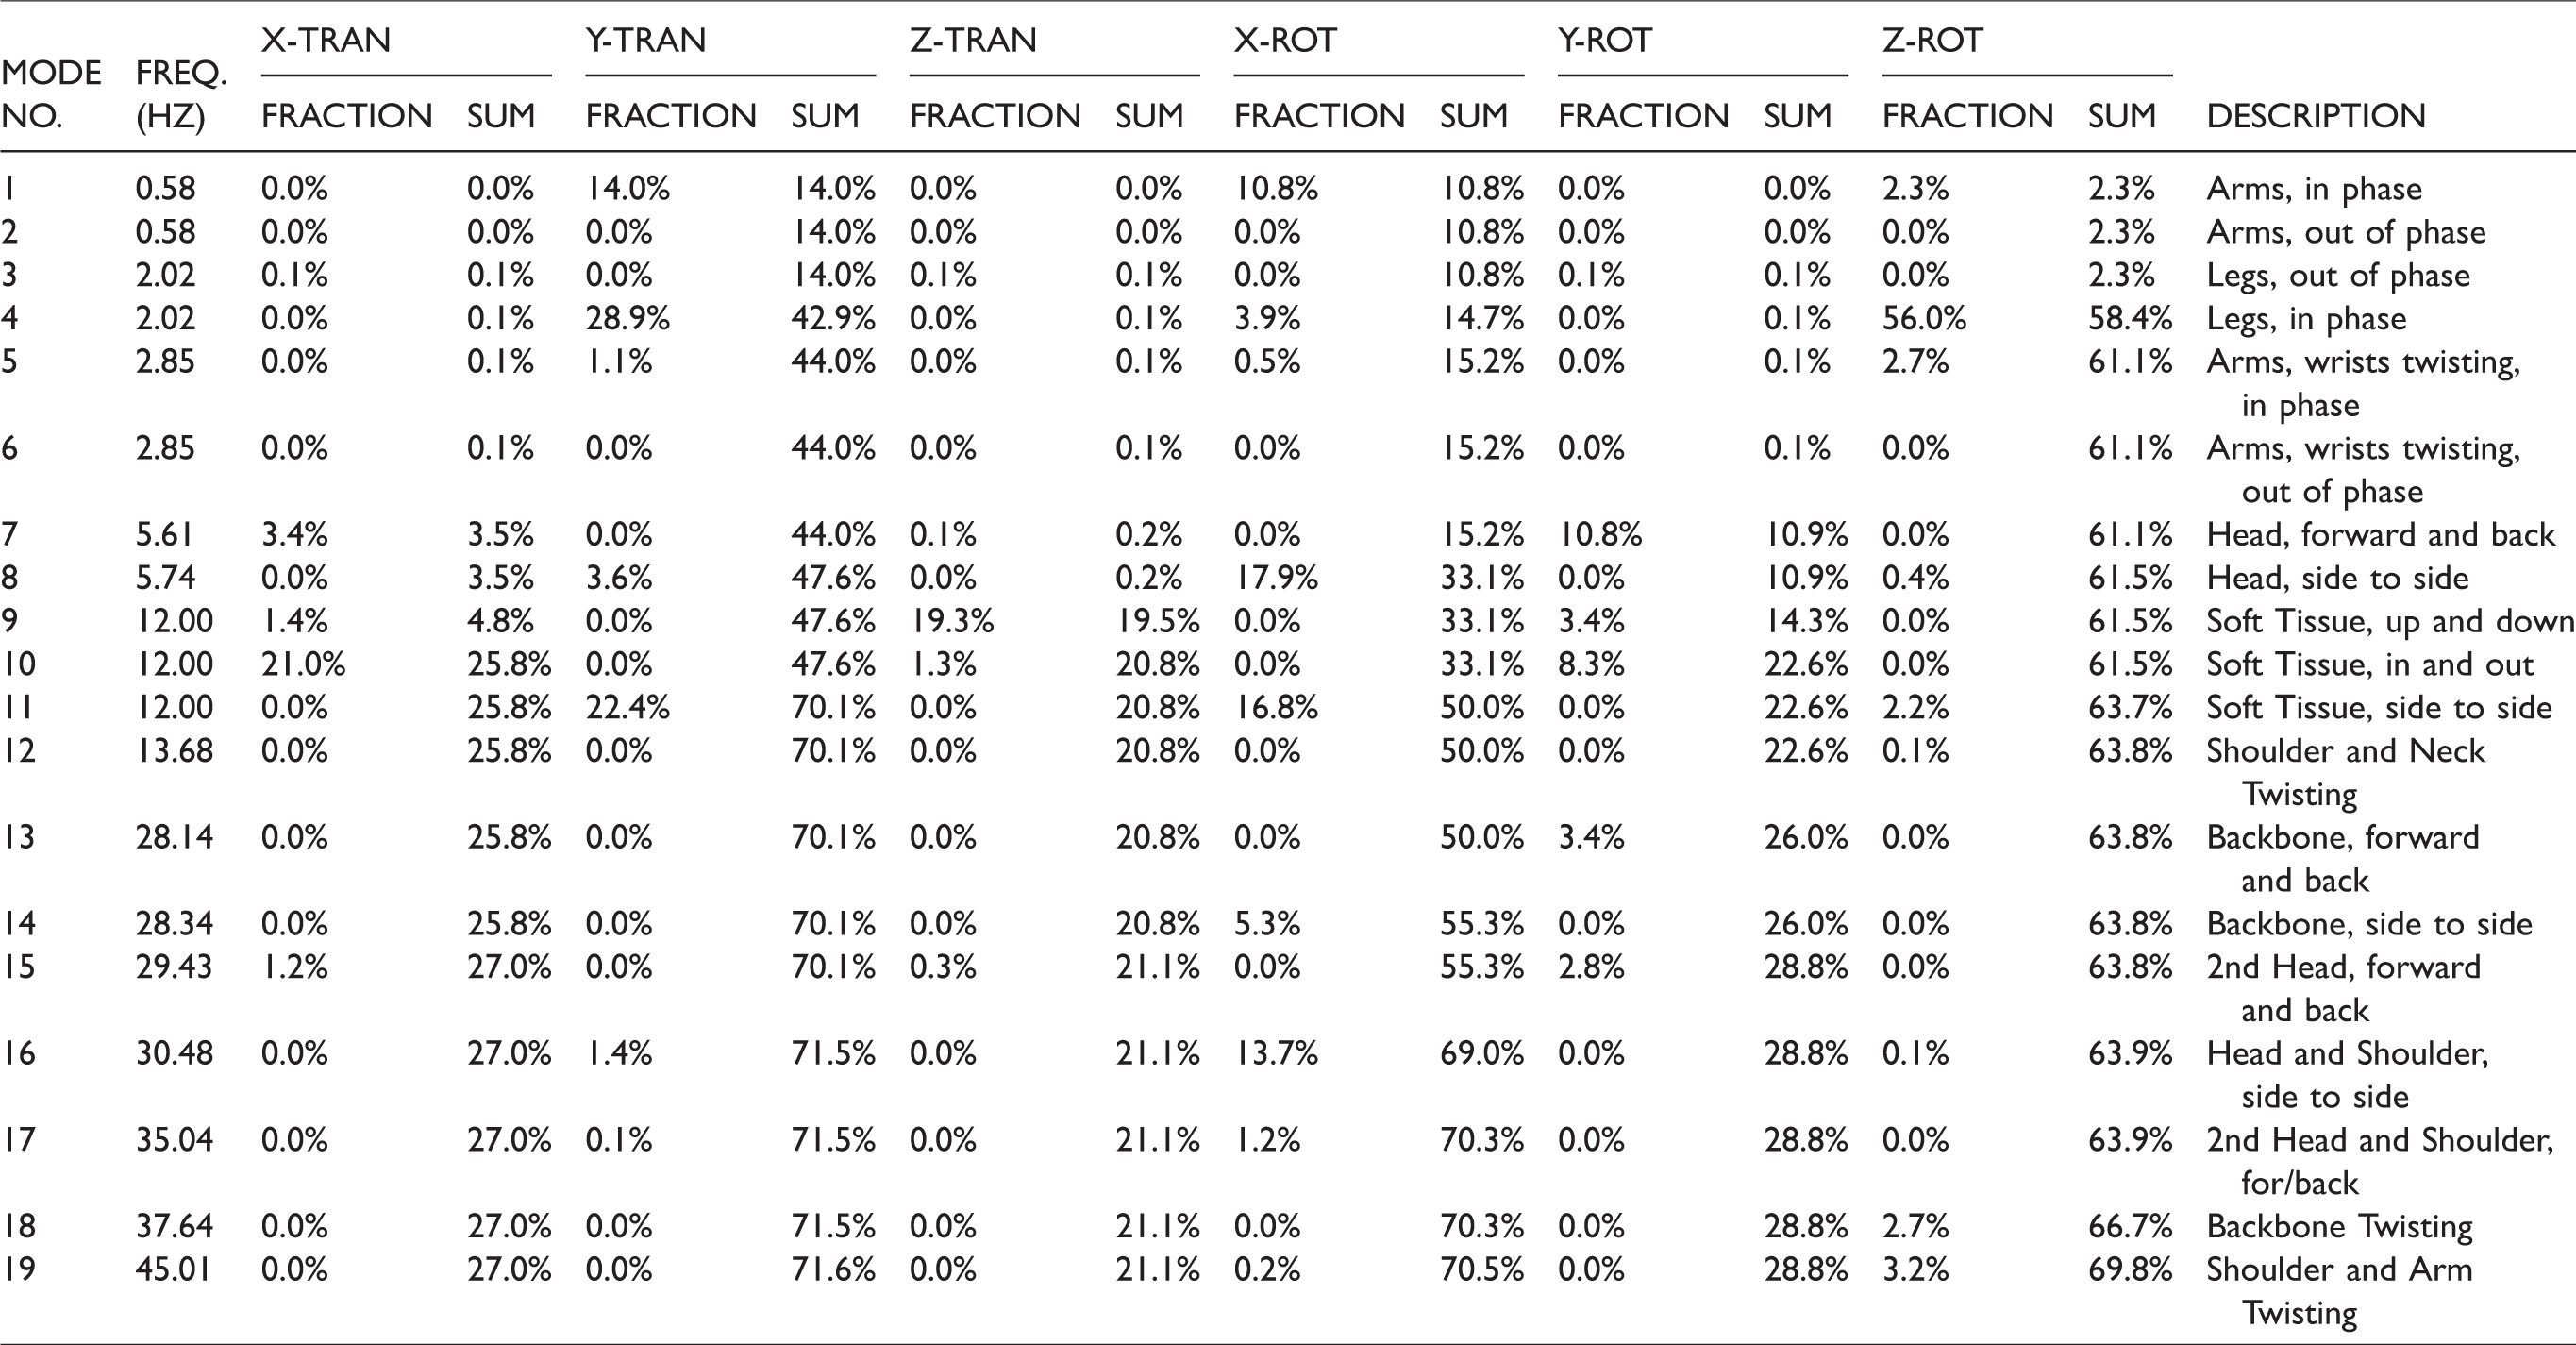
Vibration modes, frequencies, and a description of the associated mode shapes for the 1st-percentile female and the 99th-percentile male are shown in Tables 6 and 7, respectively. Mode shape and order for the first 12 modes are the same for all three models; however, frequencies vary between the models. Furthermore, modes and mode shapes will vary based on boundary conditions.
Frequency modes for 1st-percentile female HVM.
Frequency modes for 99th-percentile male HVM.
A survey of literature on damping of human vibration modes was conducted.4–7,16 Variations in damping coefficients for soft tissue vibration modes are similar to variations observed in vibration frequency and are dependent on the test subject, the dynamic excitation level, and the static loading level. Stech reported values for soft tissue damping varying from ∼22% to ∼37%. 16 However, damping ratios for appendage modes (i.e. arms, legs, and heads) are less well documented. Damping ratios were calculated using the 50th-percentile male human vibration mode shapes (12-Hz soft tissue mode version). The calculated damping ratios varied from ∼4% to ∼62%. This range is consistent with ratios reported in previous studies by Coermann. 4 A conservative approach to selecting a damping ratio is to use the lowest value appearing in the literature. These values are 20% for the soft tissue vibration modes and 4% for the remaining modes.
Conclusion
FE HVMs were developed and implemented for use in human-tended spacecraft CLA. These three-dimensional, distributed-mass representations of 1st-percentile female, 50th-percentile male, and 99th-percentile male crew members were developed based on a relatively simple linear and low-load representation of the nonlinear dynamic response of a seated human. The most significant features of these FE models are the addition of anthropometrically based human mass distribution and the inclusion of soft tissue vibration modes. These models can be used to characterize human mass and stiffness effects on structures and integrated into structural models for CLA. As part of a CLA, the model can be used to predict vibration levels at the human/seat interface. However, this model is not intended for direct use as a predictor of actual human vibration levels or to predict crew injuries due to vibration.
Footnotes
Acknowledgements
The authors would like to thank Dr Mark Baldwin (Lockheed Martin) and Dr Charles Lawrence (NASA, retired) for their assistance in reviewing and providing constructive feedback on the models developed during the course of this study. Structural dynamics analysis performed by Jonathan Austin and Lance Proctor (NASA, Langley Research Center) contributed greatly to understanding the sensitivities of the HVMs.
Declaration of conflicting interests
The author(s) declared no potential conflicts of interest with respect to their research, authorship, and/or publication of this article.
Funding
The author(s) received no financial support for the research, authorship, and/or publication of this article.