
Abstract
In the analysis of vibration systems, classical transfer functions are used. Usually, it is the ratio of Fourier or Laplace transforms. The wavelet transfer function is proposed in this work. In this paper, the wavelets transfer function is the ratio of output and input wavelet transforms. It is considered as a distinctive correlation of the output and input system signals. The wavelet transform consists of coefficients, where the first is a scale and second time shift. To get input and output signals in the human body–seat system the dedicated test stand was made. The stand consists of a seat, moved by special shaker, which is used as a mechanical vibration device. The control program included in the source file is taken to imitate angular position of the engine. Motor shaft is connected with exciter’s moving parts and stand base, which influences directly on the seat position. The disturbance signal usually simulates a horizontal road influence on a driver. It can be considered as a low-frequency signal. It is measured by accelerometers called inertial sensors, which are placed on the platform of the shaker. The output signal is measured by an accelerometer placed on a seat and on the human head. Both signals are recorded by the Inertia Studio software wireless in the real time. After the measurement, the signals are transformed into wavelet coefficients by using Matlab package functions. The transfer function and its visualization are presented in two dimensions scale-time. The scale is related to frequency (pseudo-frequency). By the transfer function it is possible to analyze the systems, evaluate safety, compare the systems, and many more.
Introduction
Vibrations have become one of the most important parts in engineering. Therefore, it becomes essential to study this phenomenon in vehicles, aircrafts, and their influences on human. 1 Typically, a car seat moves up and down in response to the road surface and pitch around an axis perpendicular to the direction of motion. Modeling and optimization of the seat suspension system is an unavoidable part in designing the seat that has to ensure required comfort of the driver and also the safe handling of the working machine. Prolonged exposure to vibrations in working environment leads to early fatigue and in some cases to a deteriorating health state. The most affected is a spine and internal organs. The standard commercial seats are suspended by use of passive suspension systems.2,3 The studies of vibrations seat’s problem have been of academic and industrial interest for a long time. At first, the passive suspensions have been investigated.4,5 However, passive suspension’s system reached their top and that is way semi-active and active suspension systems are gradually more and more used in practice.6–8 Unfortunately, they are more expensive, complicated and, therefore, less reliable than passive suspension systems. Moreover, active suspension systems require an external source of energy and their energetic demand is high. 9 Wavelets provide a new tool for the analysis of recorded vibrations. They allow to change the spectral composition of a nonstationary signal, which is measured and presented in the form of a time–frequency map. Moreover, wavelet maps provide a graphical picture of the frequency composition of a vibration signal. 10 The wavelet method has been used in a few contributions in structural mechanics. It is necessary in our work to refer to Newland book, where an example of damped vibrations is presented. 11 Kyprianou and Staszewski12,13 discussed an example of forced single-degree-of-freedom (SDOF) vibration system using the cross-wavelet analysis. The latter has also analyzed damping in SDOF and multi-degrees-of-freedom systems (MDOF).12,13 In most of these articles, vibration problems are considered as examples to illustrate theoretical results. Using the computers to discrete wavelet transform solved the problems. In this paper, it is shown that in some simple cases the wavelet transform can be carried out in vibration systems in different ways. It is alternative to the cross-wavelet transform. The new method of analysis of seat suspension systems, used in vehicles or heavy machines, is proposed. Usually, the dedicated test rigs and measurements are used to evaluate of the specific seat suspension. These researches are aimed on the fact, when the specific frequencies (vibrations) occur and they need to be reduced. The vibration propagation within the human body is a different problem. It is often omitted as the separate. The paper introduces a new method, which combines the seat and body human interaction. This combined method, as distinct from the previous, provides for a time factor. It gives the opportunity to evaluate a quality of tested seat suspension. It takes into consideration the seat system and its influence on essential human organs. In this study, horizontal vehicle vibration analysis is carried out. The article consists of three main sections. In the first section the test rig is presented, including the placement and directions of the sensors. Second, the measurement procedure is described and the list of steps in the procedure is presented. Third, wavelet transfer function (WTF) is defined and calculated by using wavelet transformations of proper signals. The discussion and conclusions sections summarize the article.
Experimental stand for the study human vibration
There are five nodes used (numbered 1, 2,…, 5 in circles, Figure 1(b)). Nodes are placed on the platform (sensor 1), on the seat (sensor 2), and at front of head (sensor 5). For each sensor, its orientation (X–Y–Z) is adjusted in relation to the Earth reference frame as roll, pitch, and yaw (R–P–Y) angles. It makes parallel the axes laying on proper surfaces. Sensors 3 and 4 are not applied in this work and will be used in further analysis.
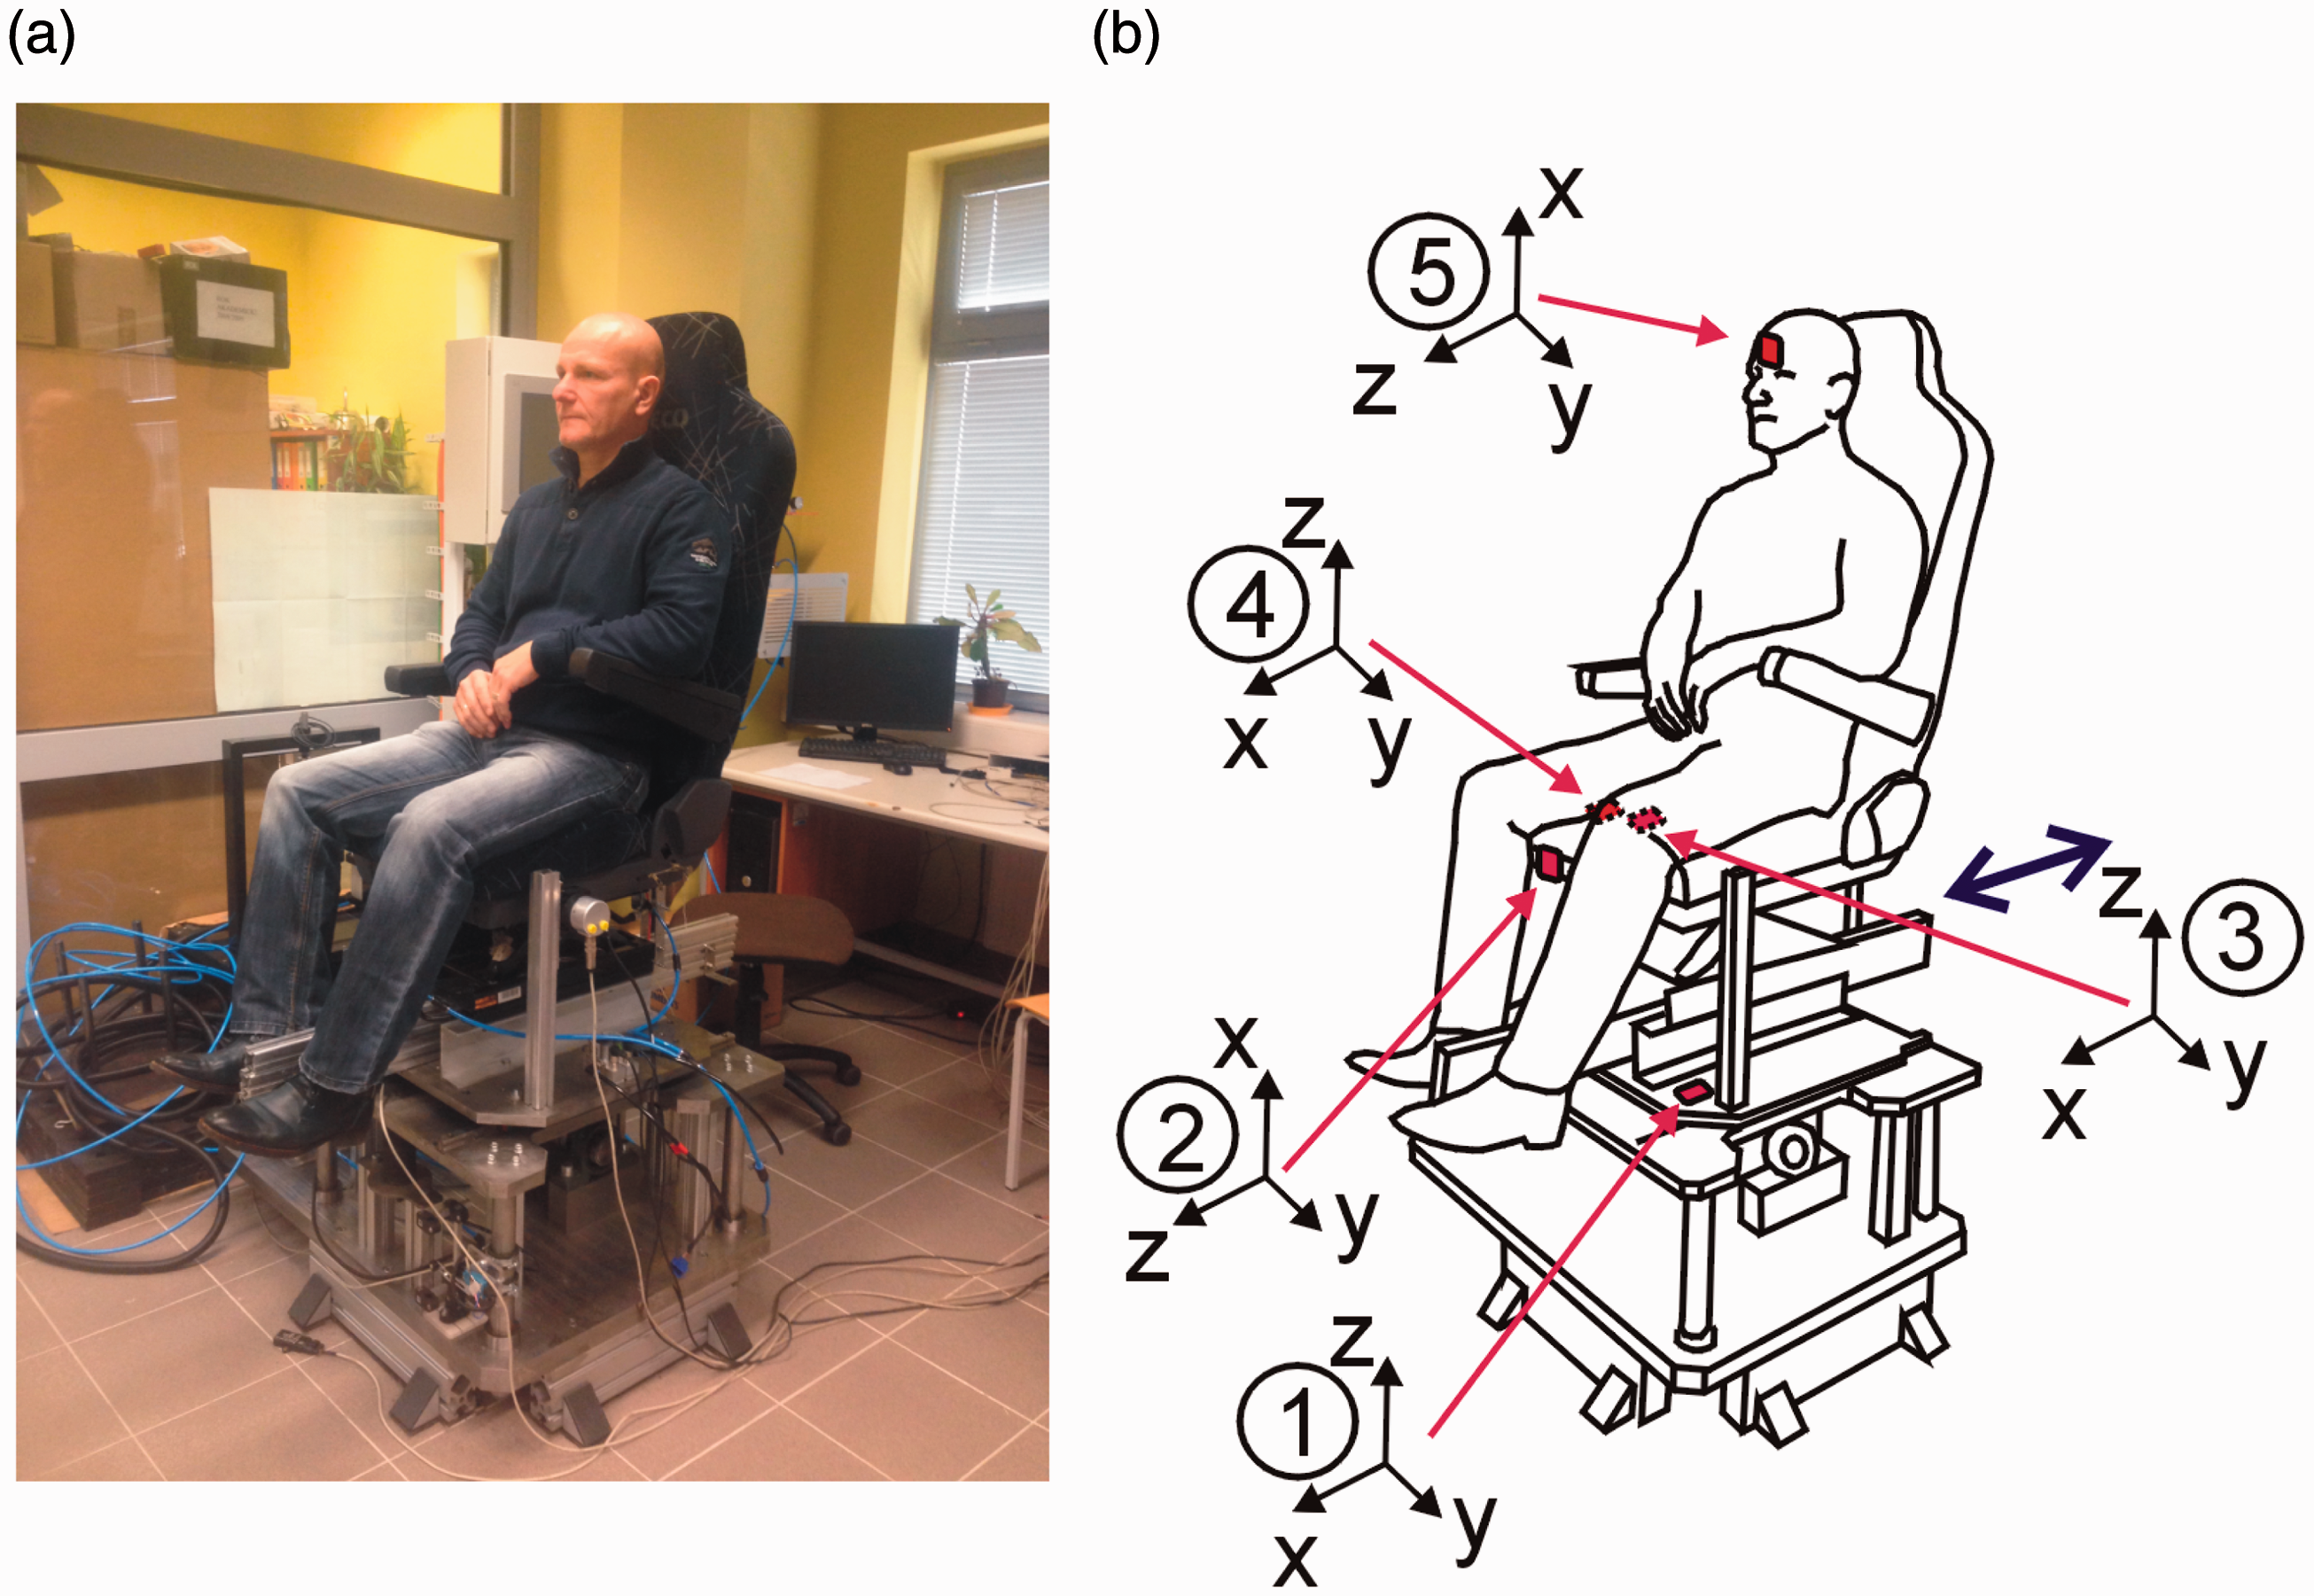
(a) Seated subject; (b) numbering of sensors, location, and axes orientation.
The accelerometers are used for the measurement of transmissibility. The sensing system is composed of sensors nodes based on ProMove mini platform. 14 The system creates the bridge between inertial measurements units and wireless sensor networks. The parameters of one sensor are: 10 degrees-of-freedom inertial sensors: ±2 to 16 g accelerometer, ±250 to 2000°/s gyroscope with resolution 0.007°/s and ±250°/s range and magnetic field intensity (compass), 2 GB flash memory in each sensor, low-power RF transceiver in the 2.4 GHz license-free band. Inertia gateway is a central hub for synchronized data collection <100 ns. Battery capacity is 4 h in full streaming mode. Sensor units with Inertia Gateway are presented in Figure 2, with dimensions 51–46–15 mm and weight 20 g (including battery). The Inertia Studio software enables real-time visualization of sensor data, as well as over-the-air reconfiguration of the sensors and wireless parameters. The Inertia Studio software for post-analysis collects all retrieved data.
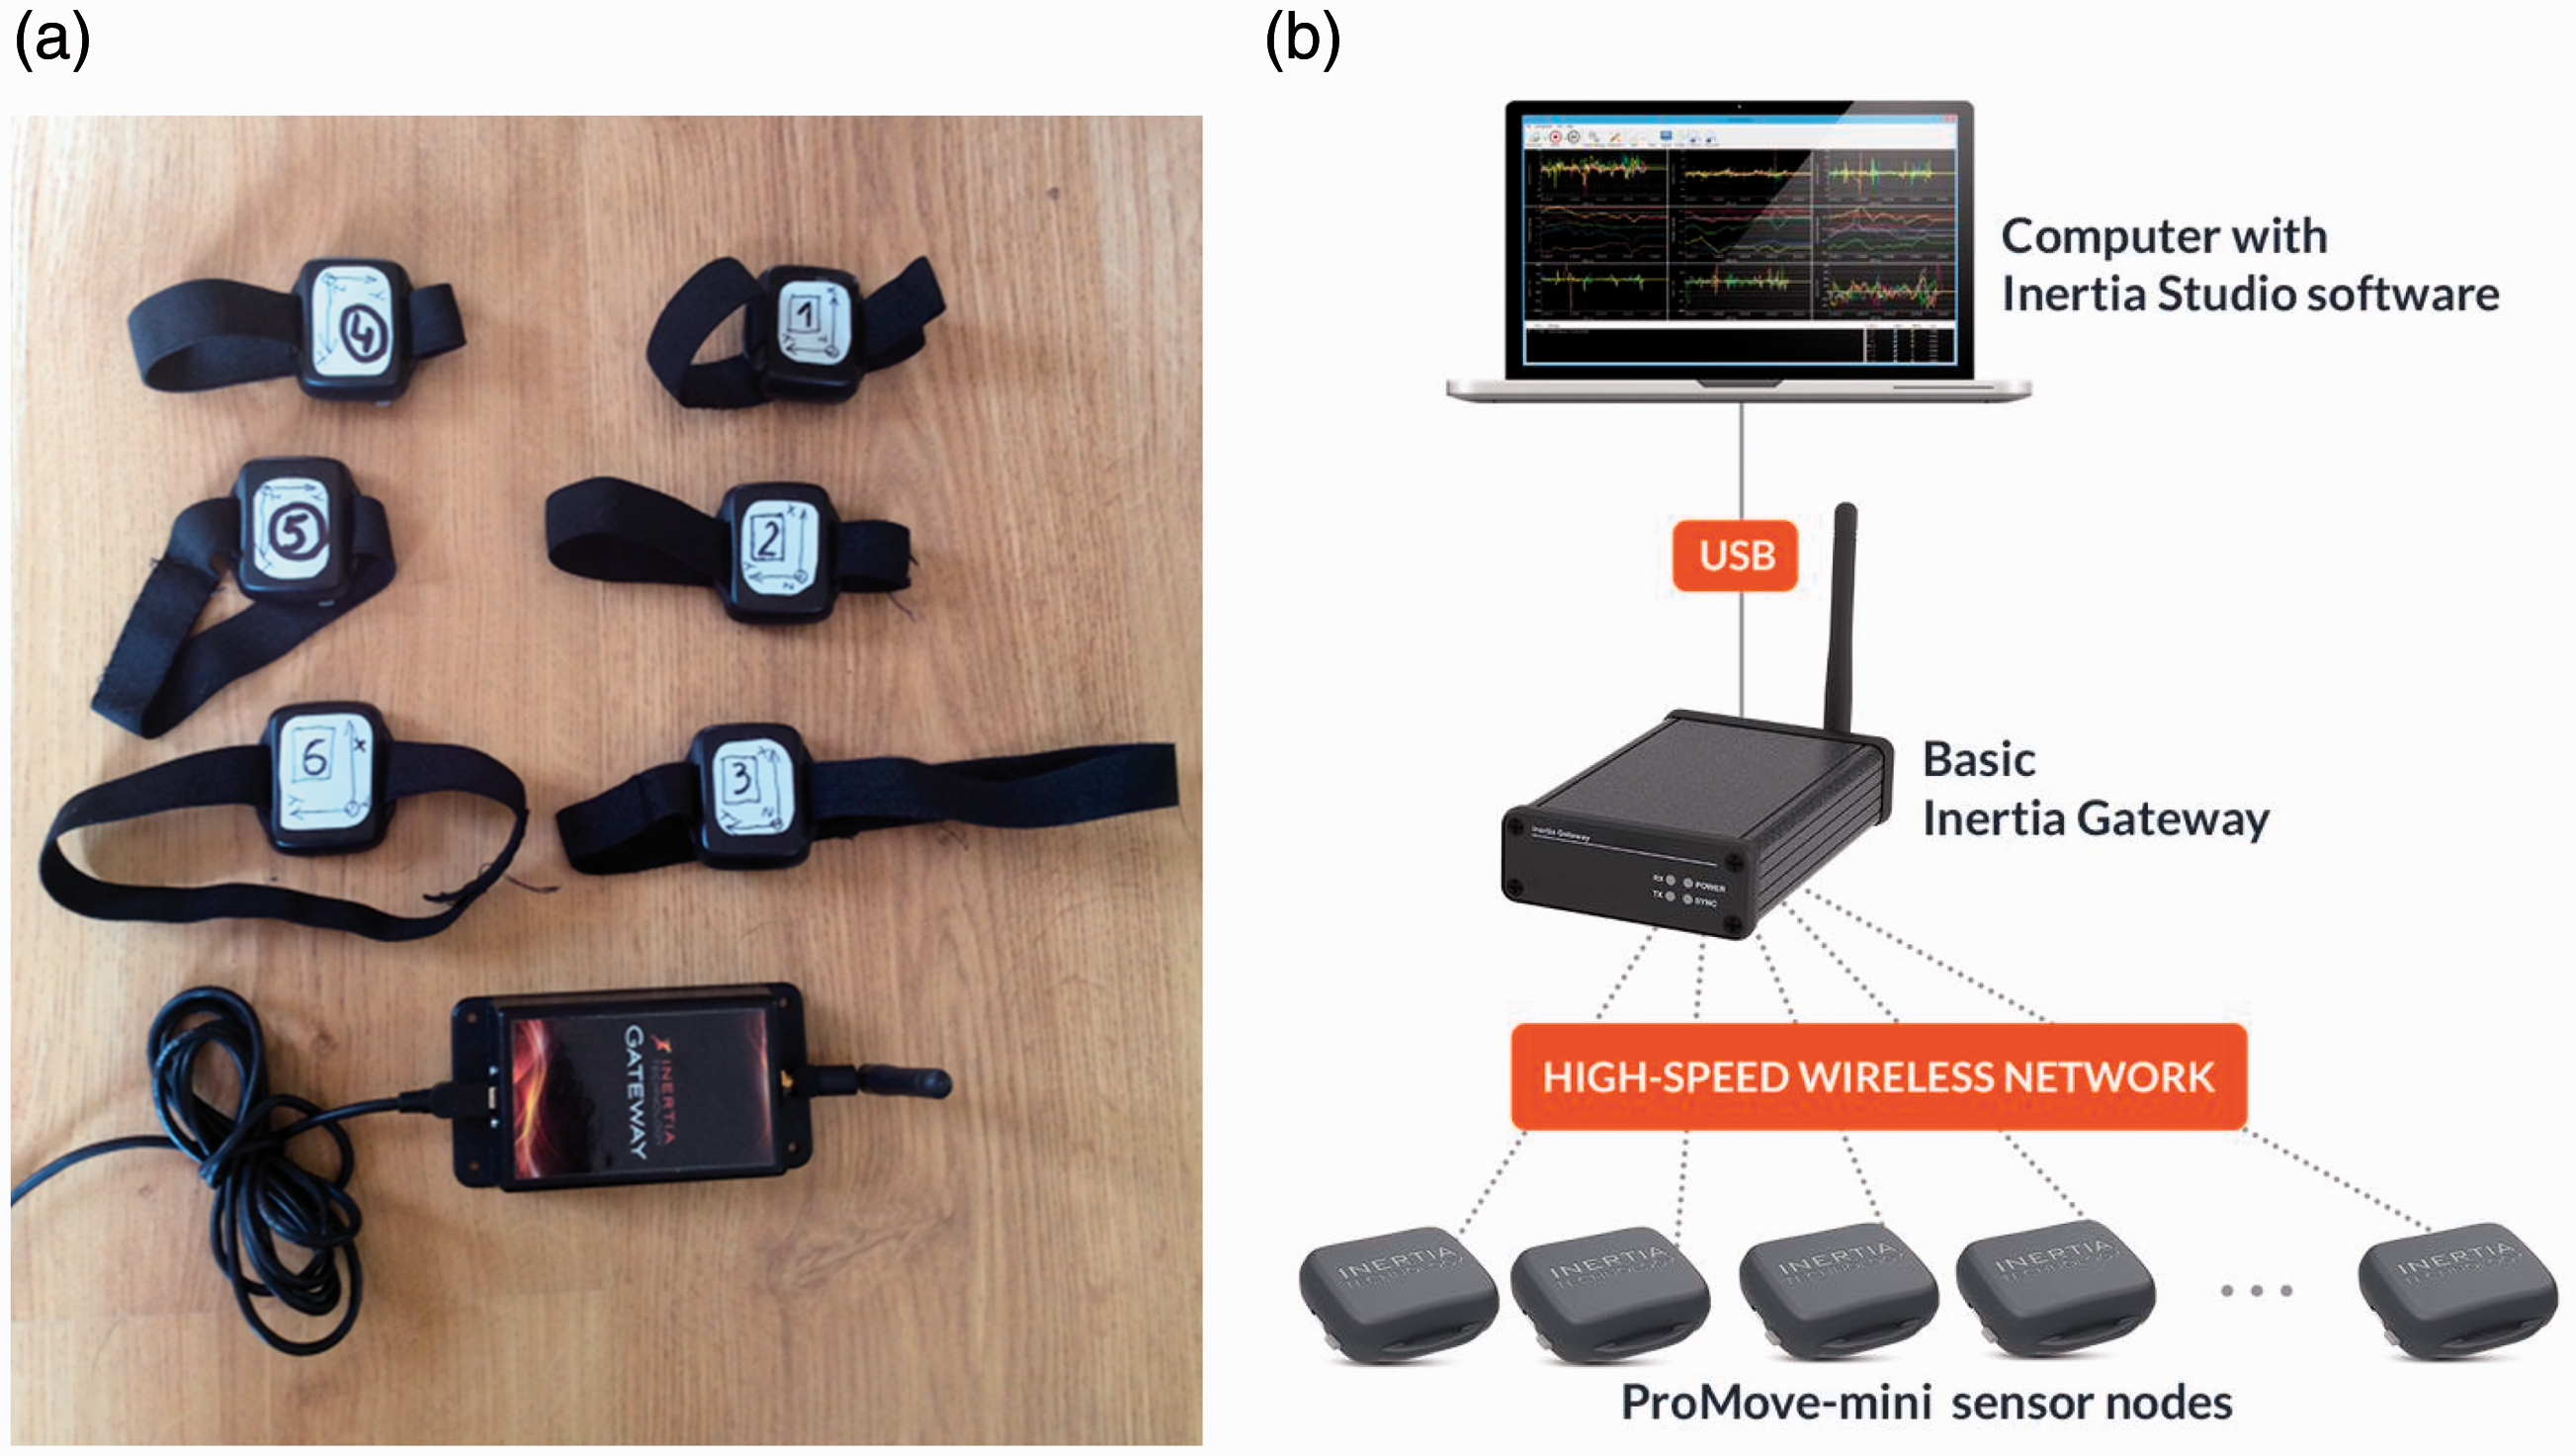
(a) ProMove mini sensors with Inertia Gateway; (b) system configuration. 10
Vibration experiment and procedures
The vibration experiment is conducted to measure the transmissibility from the platform to the seat surface and to the measurement points (the head sensor). The model is constructed to express the experimental transmissibility from platform to head. The person seats on a rigid surface, and it is exposed to vibration in the horizontal direction (X). The nodes are placed on the platform, the seat forefront, and on the seat. The last one is placed on the forehead. All of them measure accelerations respectively (Figure 1). A total of 15 measurements are obtained; five measurements in X, Y, and Z direction at each location. The duration for each excitation is about 40 s. A healthy man (53 years, 175 cm, 80 kg) was subjected to the experiment.
The experiment was conducted by following procedure:
The chosen signal was implemented to the seat shaker computer in the form of a source file. It generated a proper force on the seat with the white noise characteristics. The ProMove sensors were calibrated. It was done in two steps. Firstly, the sensors’ orientation was automatically setup by the software and all sensors were oriented in the same way on the platform. Secondly, the power density functions of excitation signal were calculated. Next, each of these functions was compared to the density function obtained by using the reference sensor (Mikrotechnik+Sensorik D-077451 Jena Type: 2166.1031). The sensors were installed on the seat shaker and on the seat cushion (on the human head) with orientation as shown in Figure 1. The gateway was connected to the computer and simulation parameters were set (with sampling of 200 Hz).
The sampling frequency (sampling rate) was based on Whittaker–Nyquist–Kotelnikov–Shannon theorem. During a process of converting a signal of continuous time into a numeric sequence, it is sufficient when sampling frequency is at least double the highest frequency contained in signal. In this case, the excitation is limited to 20 Hz. The sampling 200 Hz was chosen as anything larger than double 20 Hz. It allows analyzing the signals even higher than 20 Hz limit.
5. The sensor orientation was reset (was necessary to hold the nodes without moving for a few seconds to stabilize their orientation). 6. The recording and vibration were started and stopped. 7. The raw data from all sensors were collected via the USB and recorded. 8. The wavelet analysis was done by using Matlab software.
15
The time–frequency analyses using wavelets are itself the specific filtering process. There is no need to filter the measured signals, and then the raw signals were analyzed. It is aimed to detect high- and low-frequency components. The filtering could have caused serious problems such as elimination of signal components in the decomposition. In this research, the frequency was limited to the excitation range.
Wavelet transfer function
The classic signals analysis, by using fast Fourier transform (FFT), allows perfect frequency localization. In some cases, it delivers enough information about the signal character. The windowed Fourier transform or short time Fourier transform (STFT) can be applied, when time signal feature localization is needed. These analyses are based on the signal and pure harmonic function (sine and cosine) correlation. The wavelets are different approach in comparison to pure harmonic. The wavelets ψ(t) are functions, which have to meet specific requirements. The well-known wavelet features can be briefly summarized as follows:
the wavelet family represents the basis, which has a Fourier transform Ψ(ω); the wavelet functions oscillate; the value of wavelets tends to zero in minus and plus infinity of its domain (time is the domain of wavelet in this case).
The wavelet functions and their Fourier transform with power 2, provide the time (tl, th) and frequency (ωl, ωh) intervals (limited by index l-low and index h-high values). This interval contains main amount of energy Emain, for instance 90%. It means


In these cases, it is possible to find center of areas of the integrands. It shows exact time and frequency values.
In classical Fourier transform, it is not possible to localize the energy concentration in the time domain, because the basis functions change periodically. On the other hand, the basis functions give infinitely sharp localization in the frequency domain in form of Dirac delta function. Some solutions bring STFT. In this case FFT analysis is performed in the following parts of considered signal, which is separated by using special time windows. The features of both transformations are well explained in Daubechies.
16
Directly it can be defined as the correlation between an examined signal S(t) and pure harmonic functions of ω. In case of FFT it is exp(-jωt), whereas STFT exp(-jωt) is modulated by window g(t-b). FFT results of coefficient values are related to frequency ω. STFT brings coefficients in window shifted with period b in the time domain. The differences of methodology application of STFT and wavelets are described in Błażejewski et al.
17
and Glowinski et al.
18
One of the pitfalls of the STFT is that it has a fixed resolution along both, time and frequency domains. Generally, the wavelet transformation contains information similar to the STFT. However, the wavelets have special properties. These prosperities show up at the resolution in time at higher frequencies in analysis. It means that the wavelet transformation is good in time resolution of high frequencies. While for slowly varying signals the frequency resolution becomes higher. It corresponds to better frequency resolutions, since there is less ambiguity regarding the value of the exact frequency. On the other hand, poorer time resolution occurs. There is more ambiguity, regarding the value of the exact time. At the higher frequencies the time resolution gets better, whereas the frequency resolution gets poorer. It makes wavelets a preeminent analysis, by giving feature to focus on signals, dynamic problems, processes with proper resolution adjusted to time and frequency and minimal ambiguity. The wavelet function is shifting with b in time and scaling with a in frequency domain. Eventually, wavelet transform of an arbitrary signal S(t) is calculating as follows


The Morlet wavelet is one of possible wavelets, which can be applied and is the most known function. Different kinds of wavelet should not affect the final results. Mother wavelet, normalized to maximal value 1, is defined in the following form

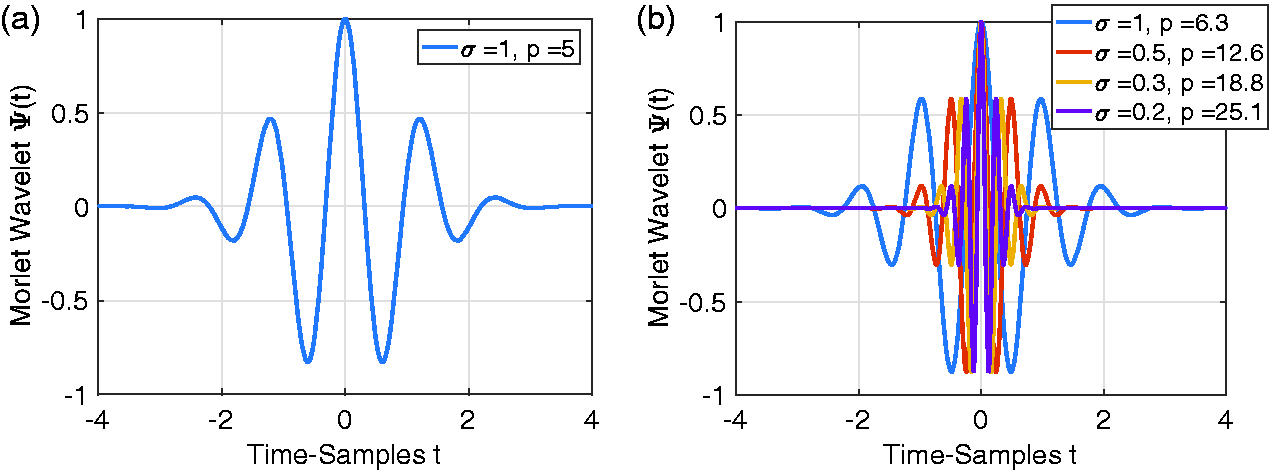
Morlet mother wavelet: (a) parameters p = 5 and σ = 1; (b) Morlet wavelet family with different parameters: p = 6.3, σ = 1; p = 12.6, σ = 0.5; p = 18.8, σ = 0.3; p = 25.1, σ = 0.2.
The methodology of wavelet transfer function
The initiating signal (shaker signal) is induced in the form of force. It is acting on a seat platform in direction X (sensor 1 – Figure 1(b)). The force frequency spectrum is a white noise. It has a constant power spectral density up to 20 Hz. The initiating signal (measured by sensor 1) is compared to the reference signal measured by an independent-reference sensor (procedure – step 2). The signals comparison is shown in Figure 4.
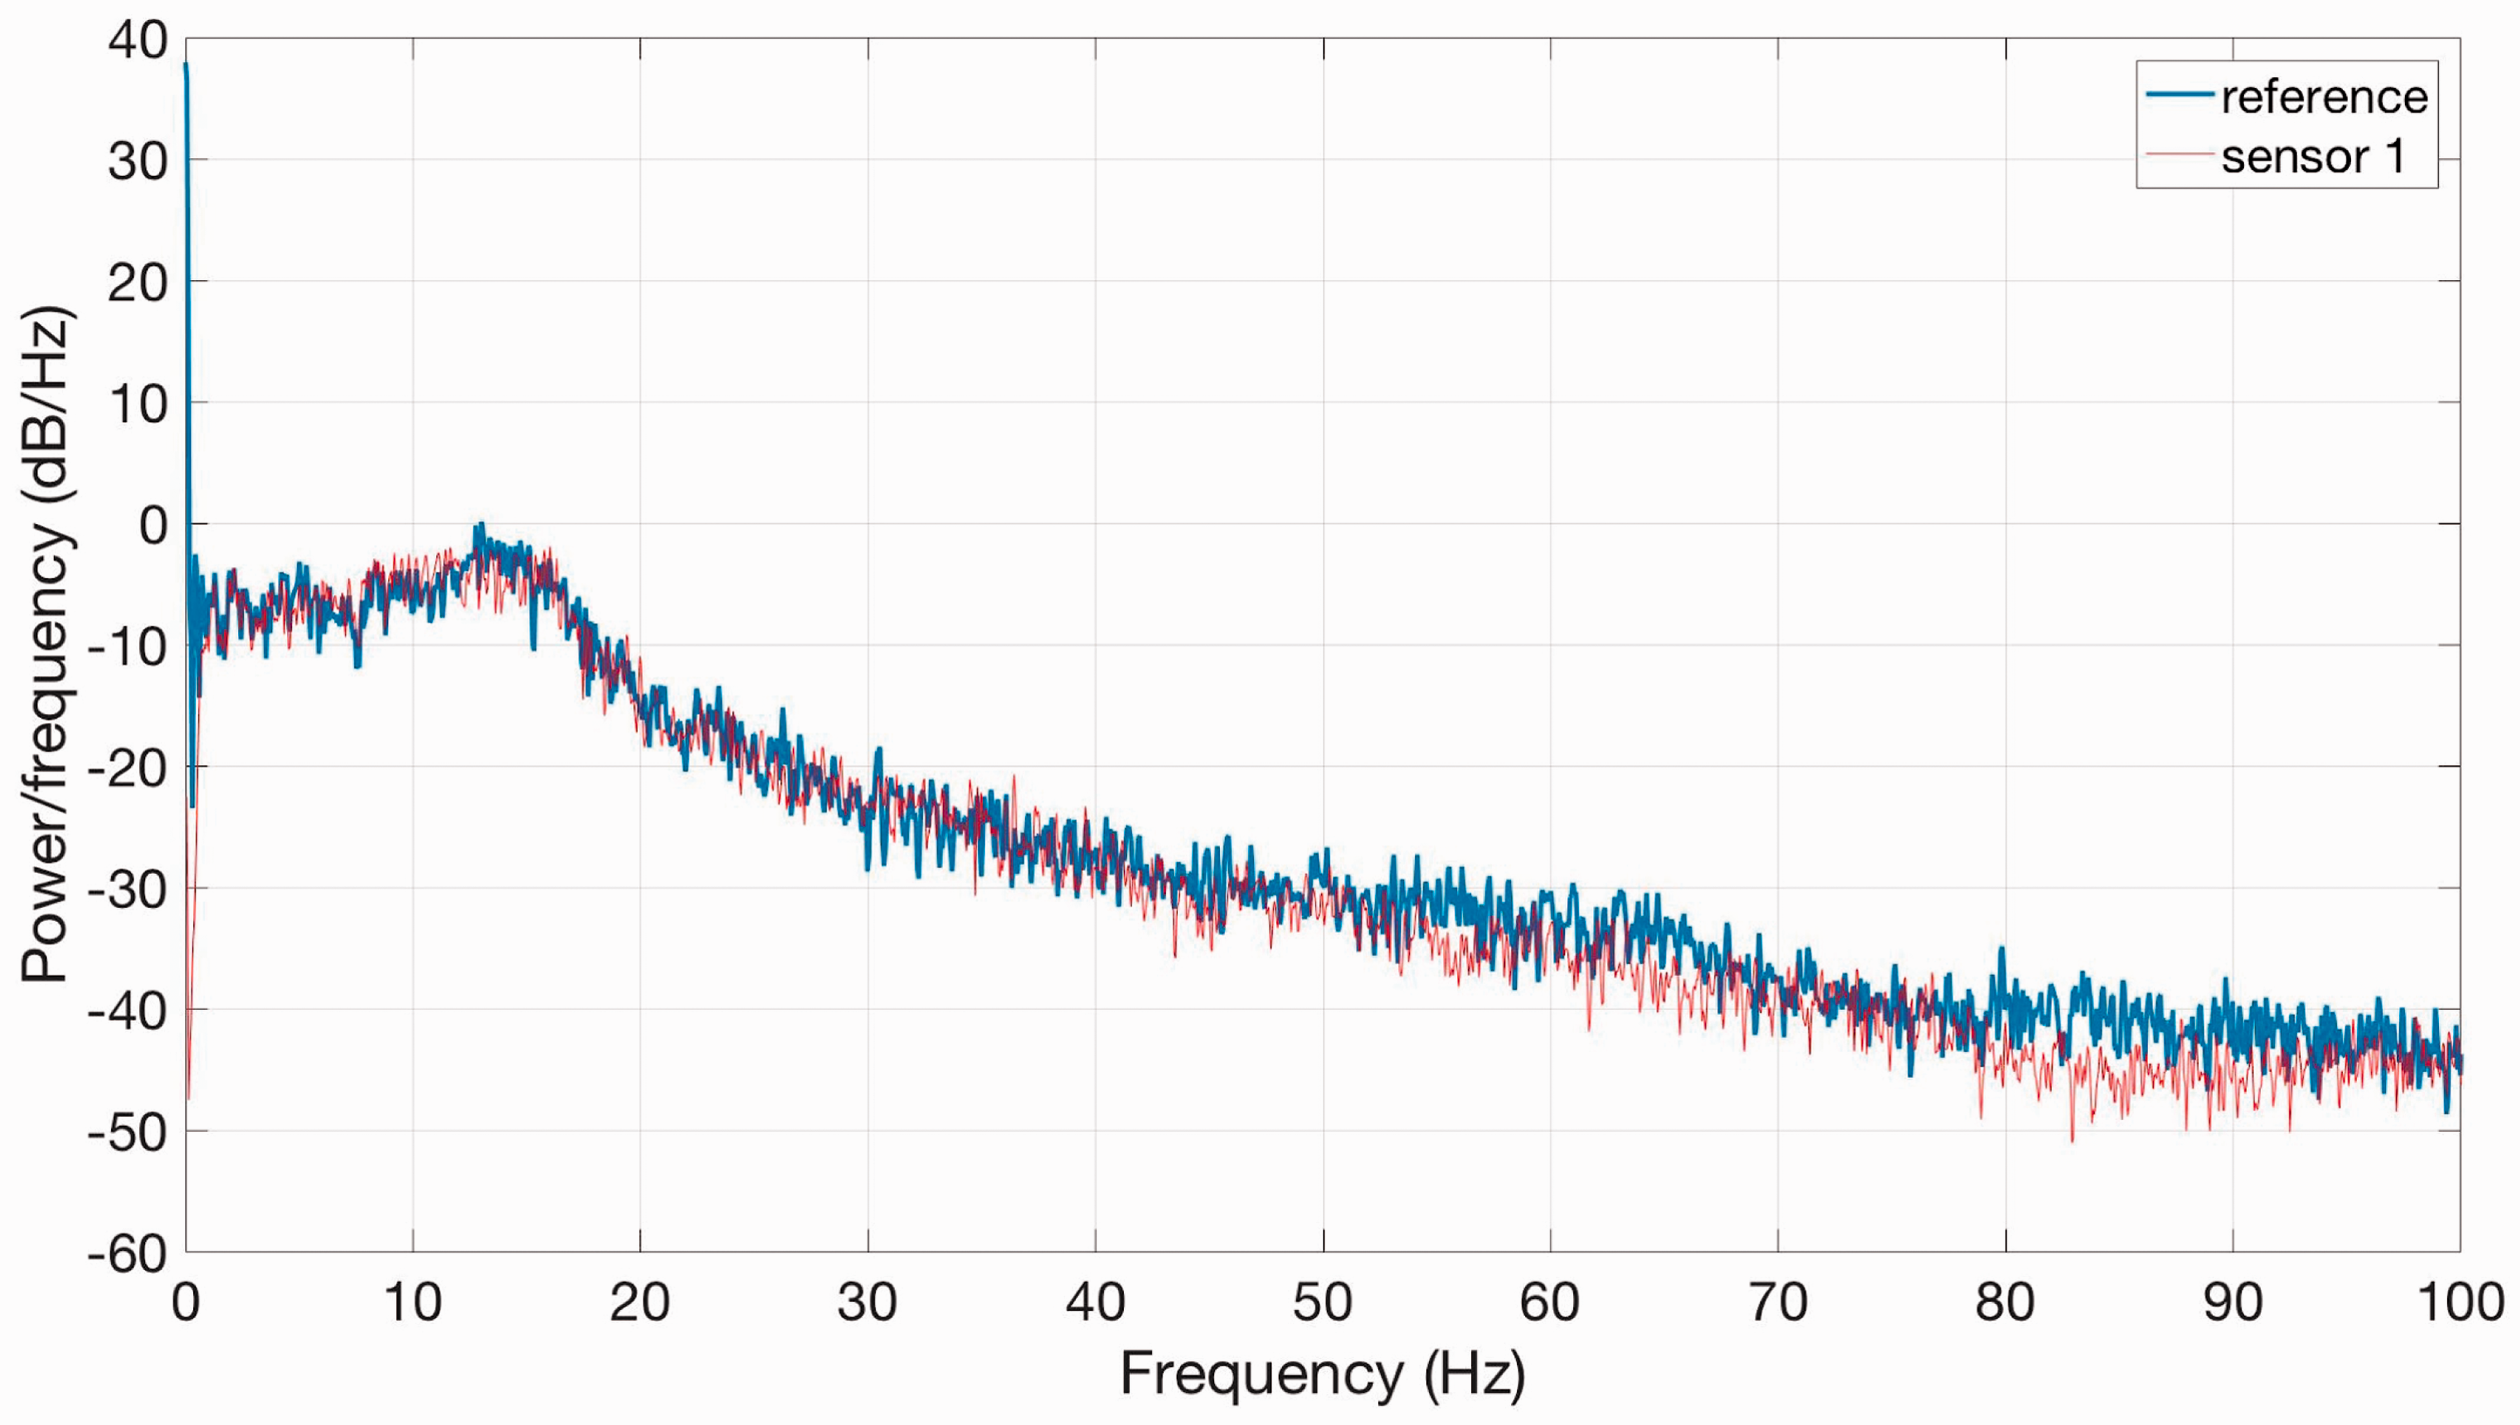
The signals’ power spectral density functions from sensor 1 and reference sensor.
All transformations are calculated according formula (3). The input signal I(t) is measured by sensor 1. The wavelet transform Sin(a, b) is obtained by applying Morlet wavelet with parameter 4. Figure 5 shows the set of coefficients related to pseudo-frequency and is directly related to the time domain. The legend indicates values of wavelets coefficients S(a, b) on the right-hand side of this figure.
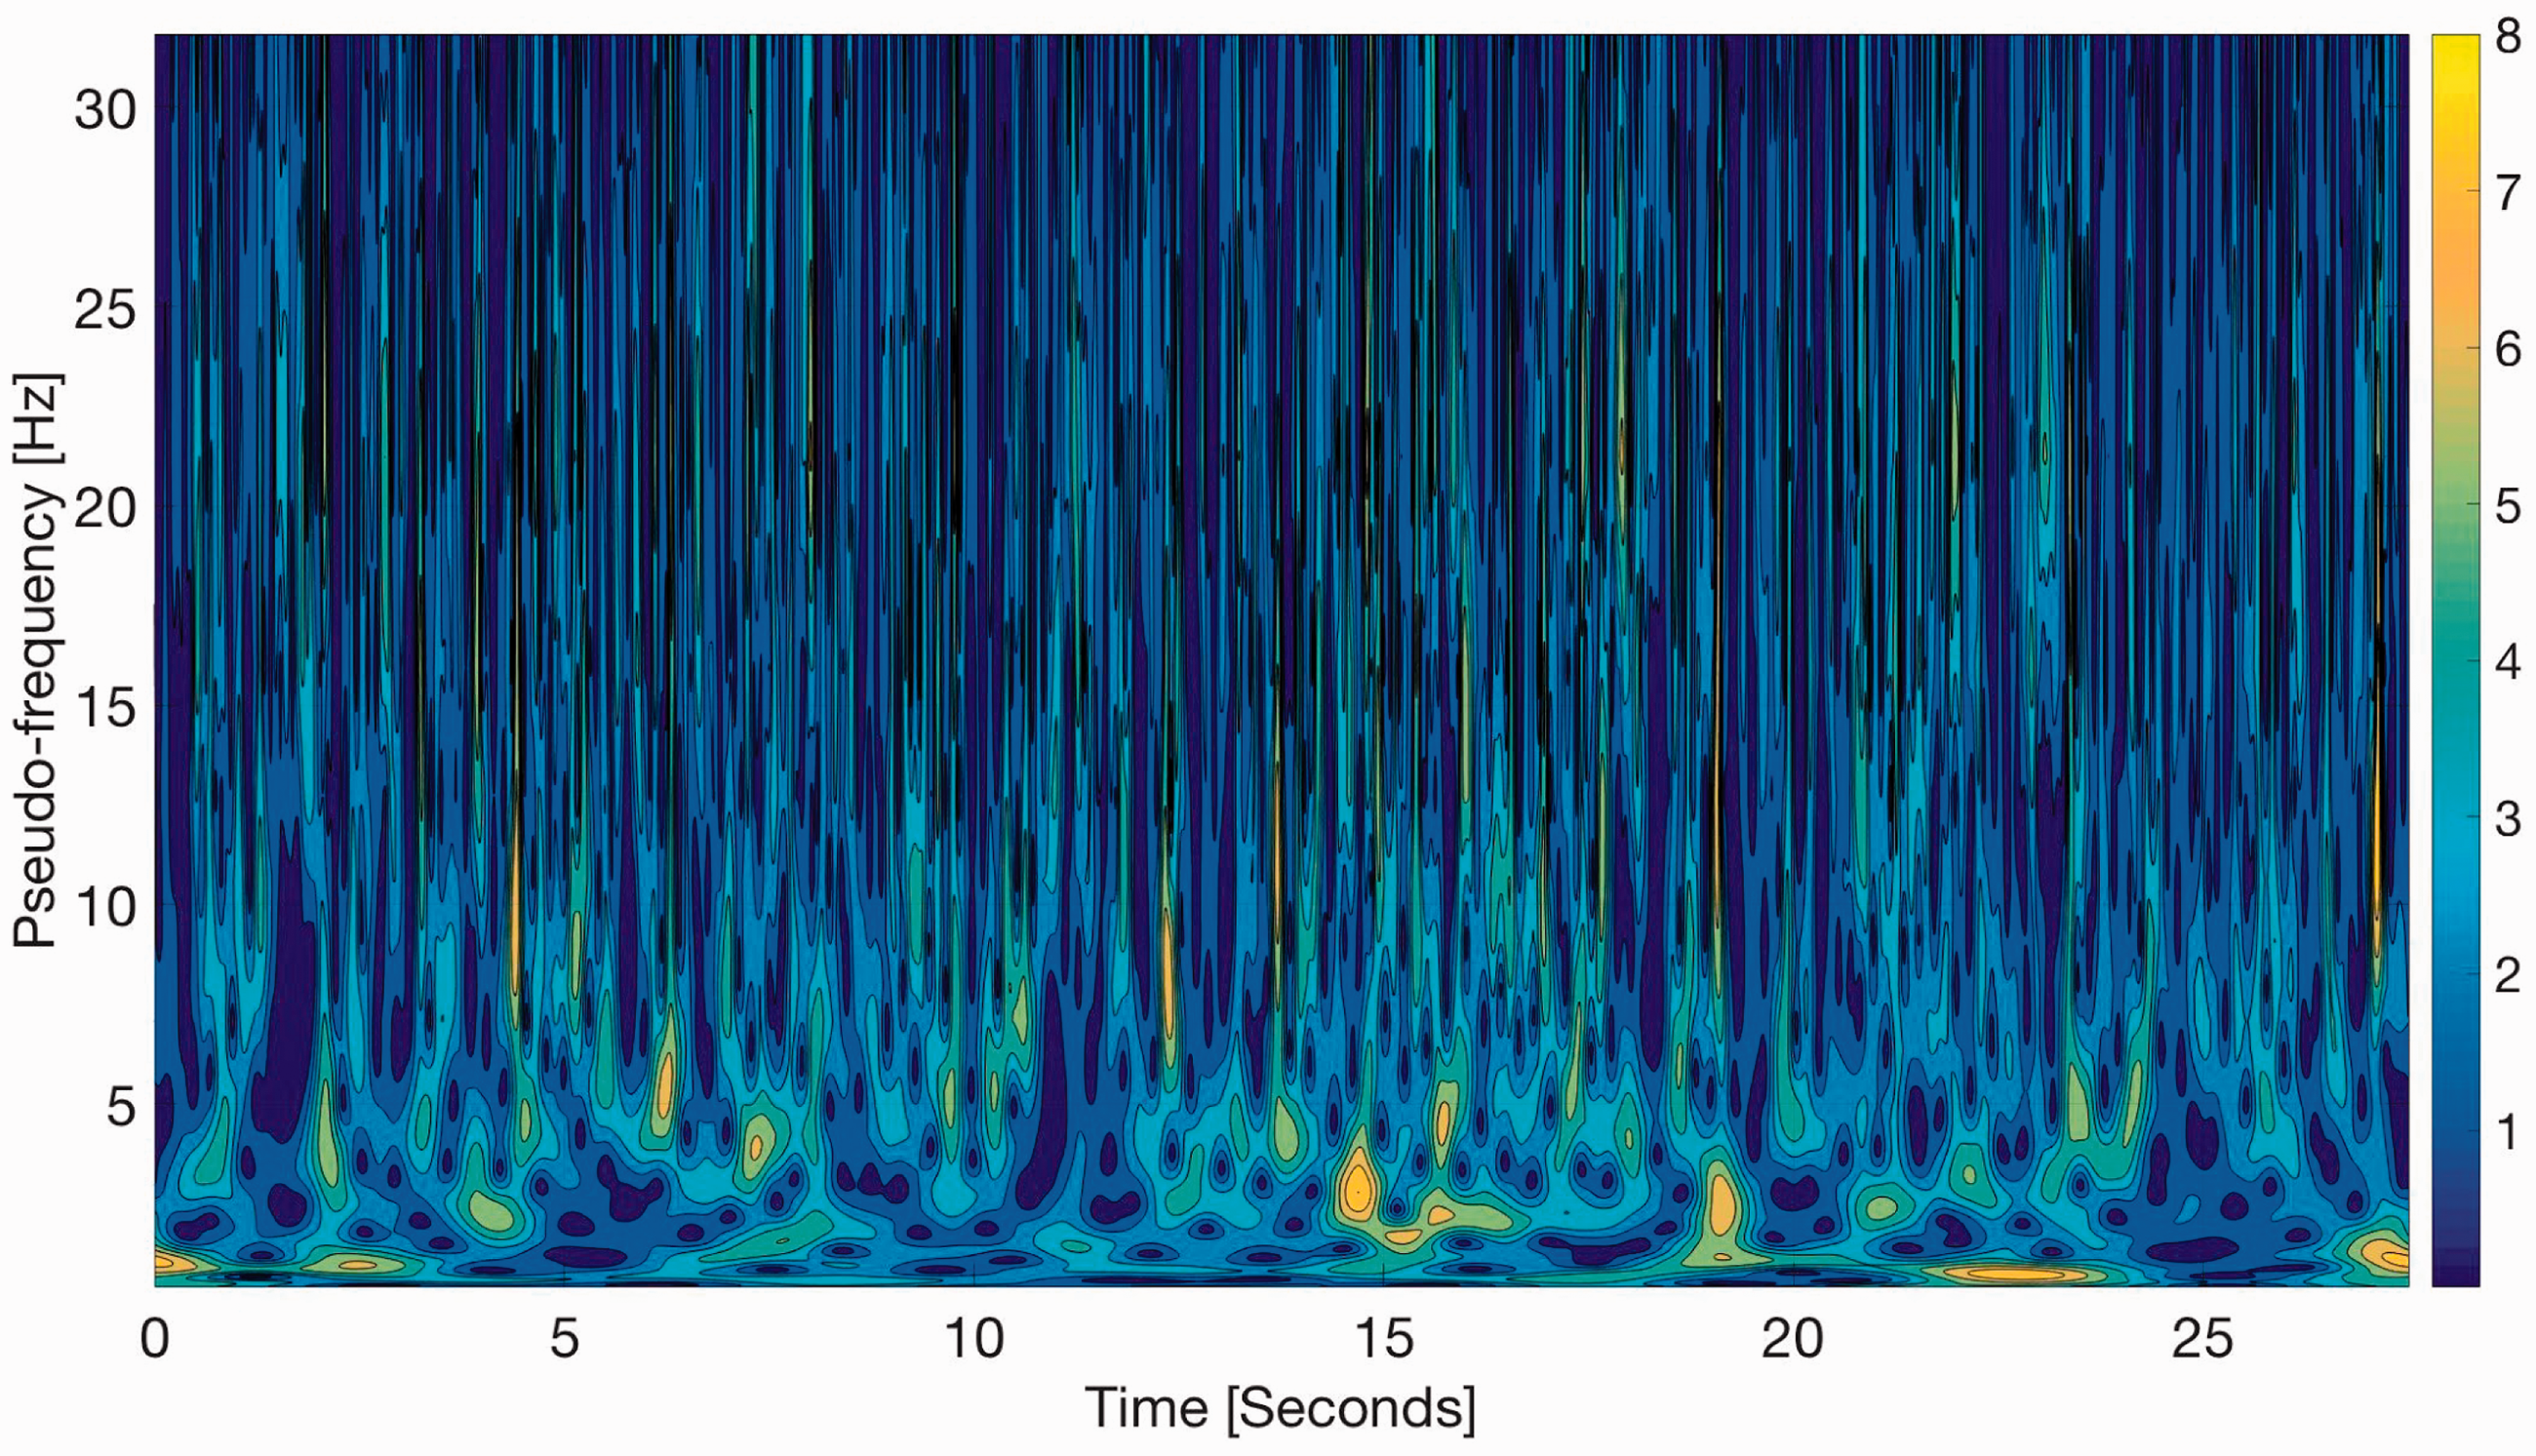
The input signal I(t) wavelets transform Sin(a, b) – sensor 1, obtained by using Morlet wavelet with parameter 4.
The wavelet transfer function stand base – seat system
Second transformation refers to the signal coming from sensor 2. It is the output signal O(t) on the seat. The result wavelet transform Sout(a, b) is shown in Figure 6. It should be noted that these vibrations directly act on human body parts, which have contact with a seat.
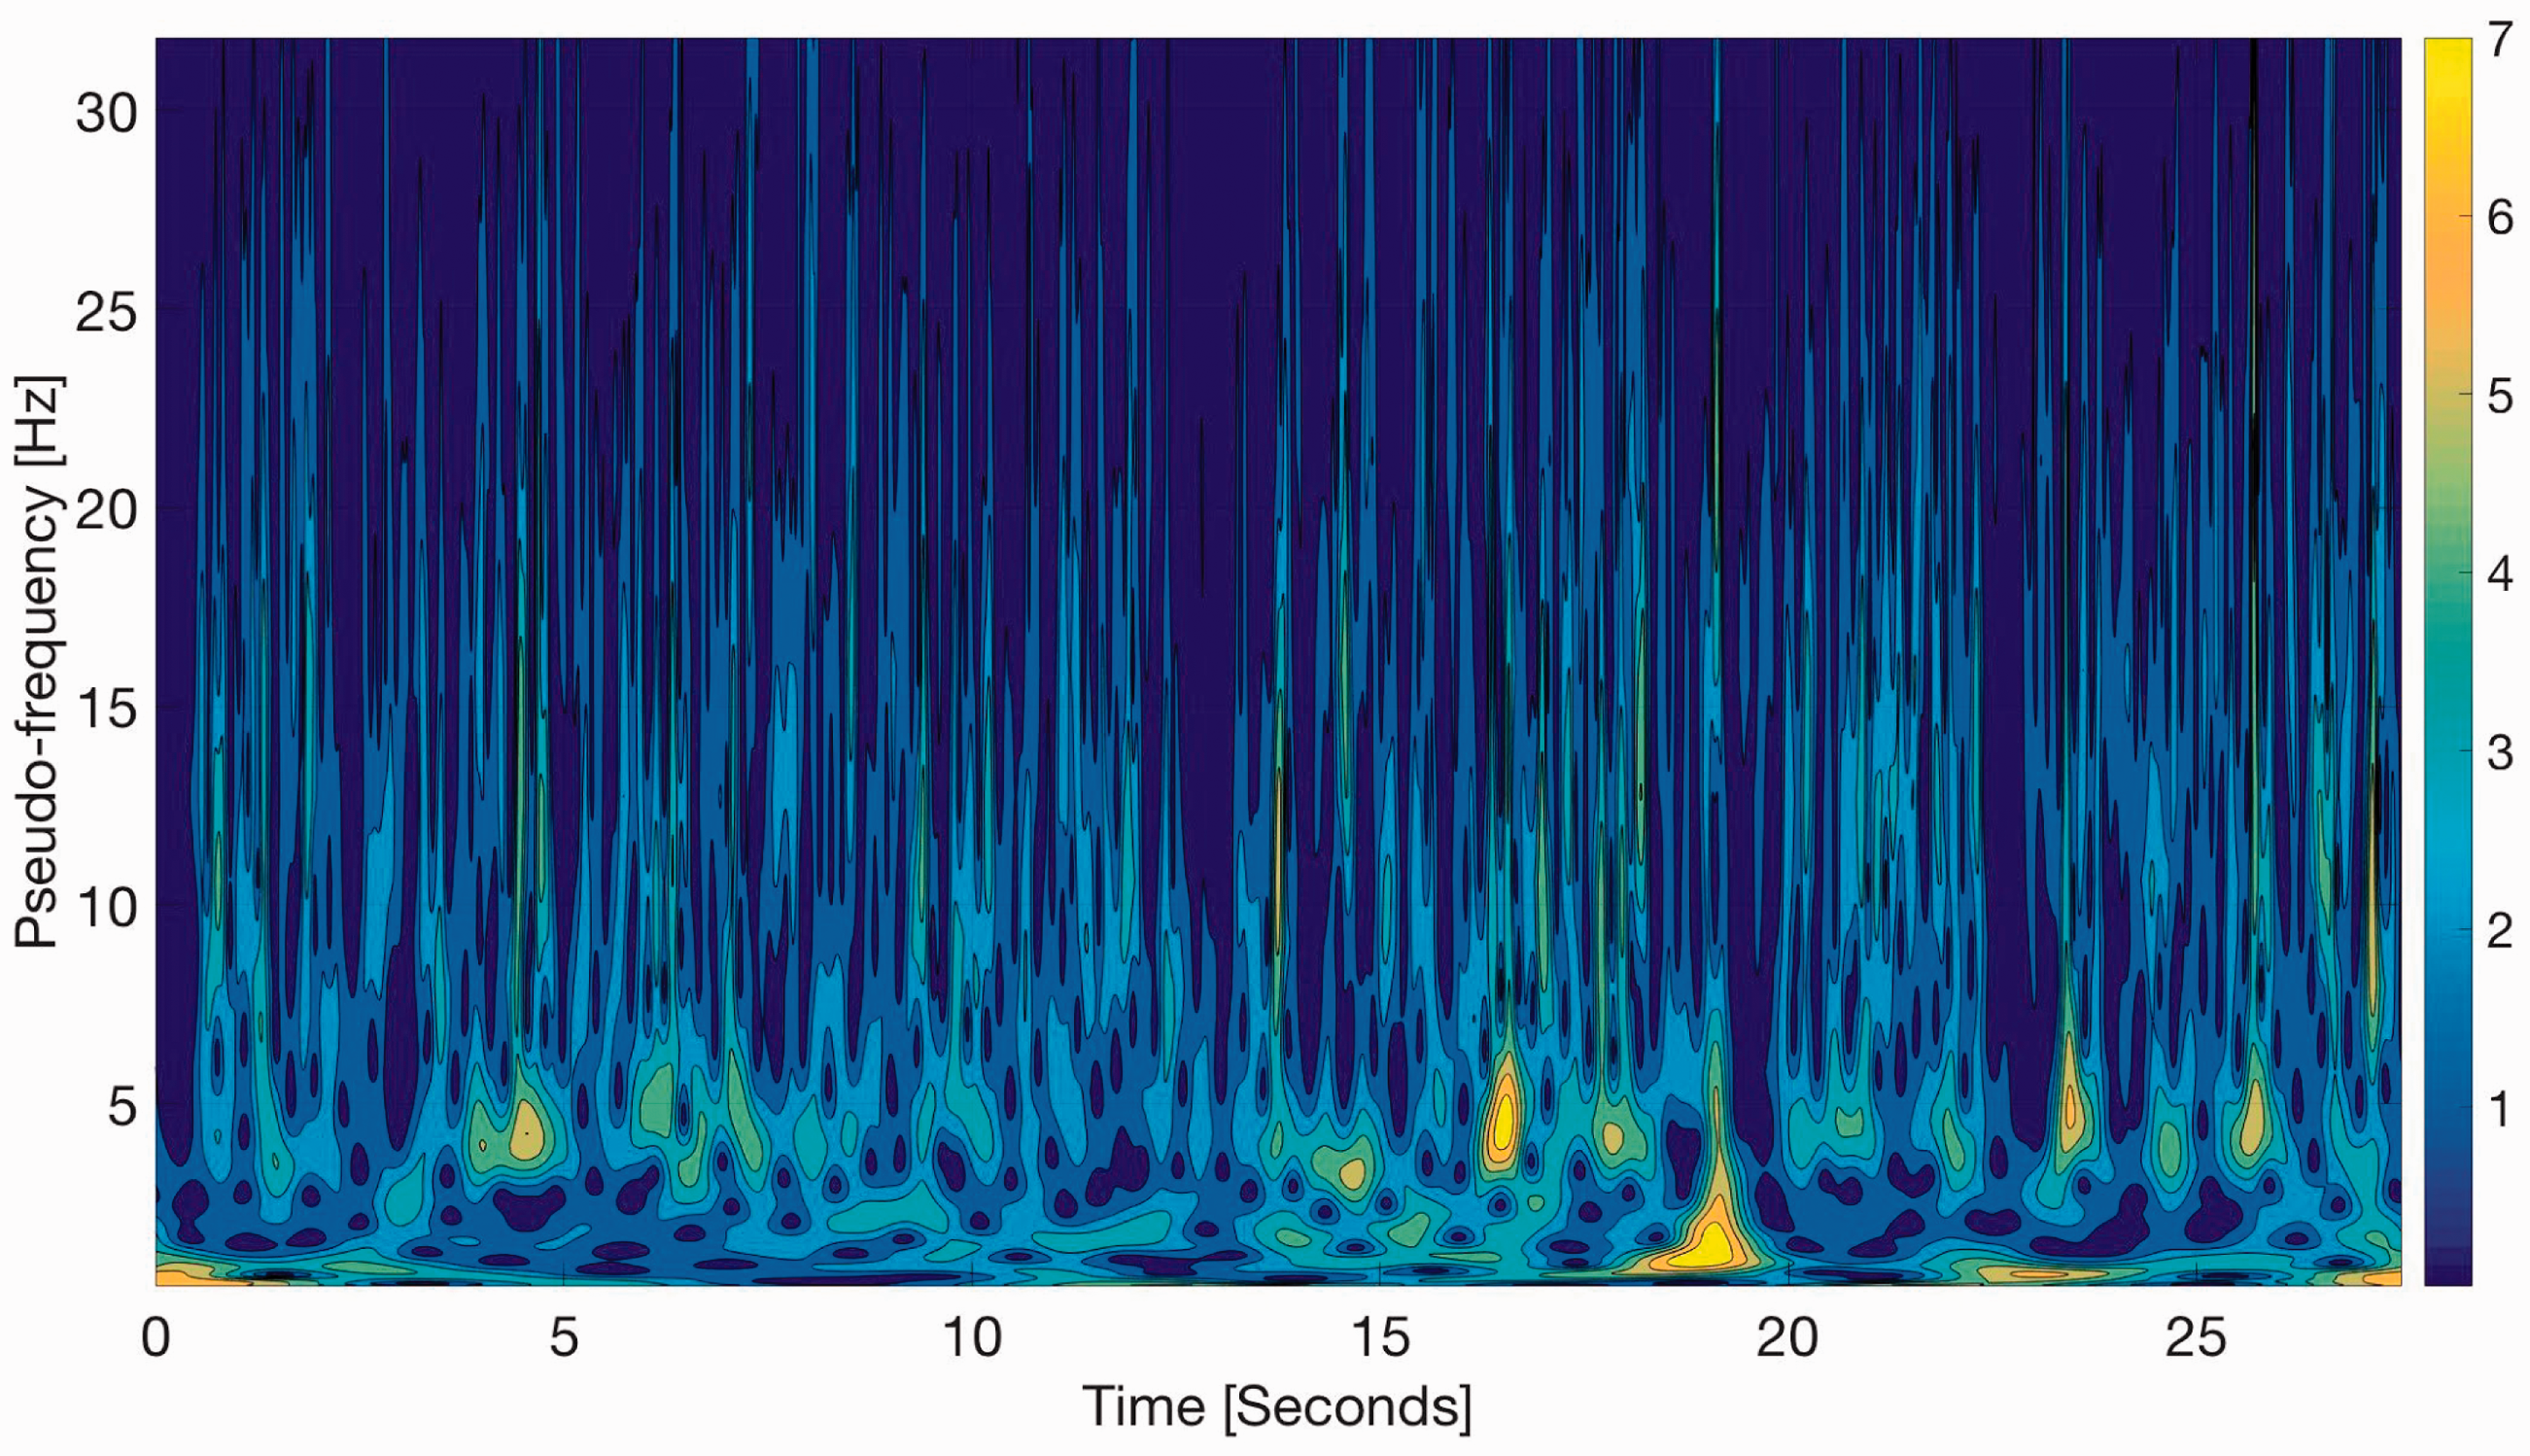
The output signal O(t) wavelets transform Sout(a, b) – sensor 4, obtained by using Morlet wavelet with parameter 4.
After getting both the transforms the modified WTF Wψ(a, b) is calculated

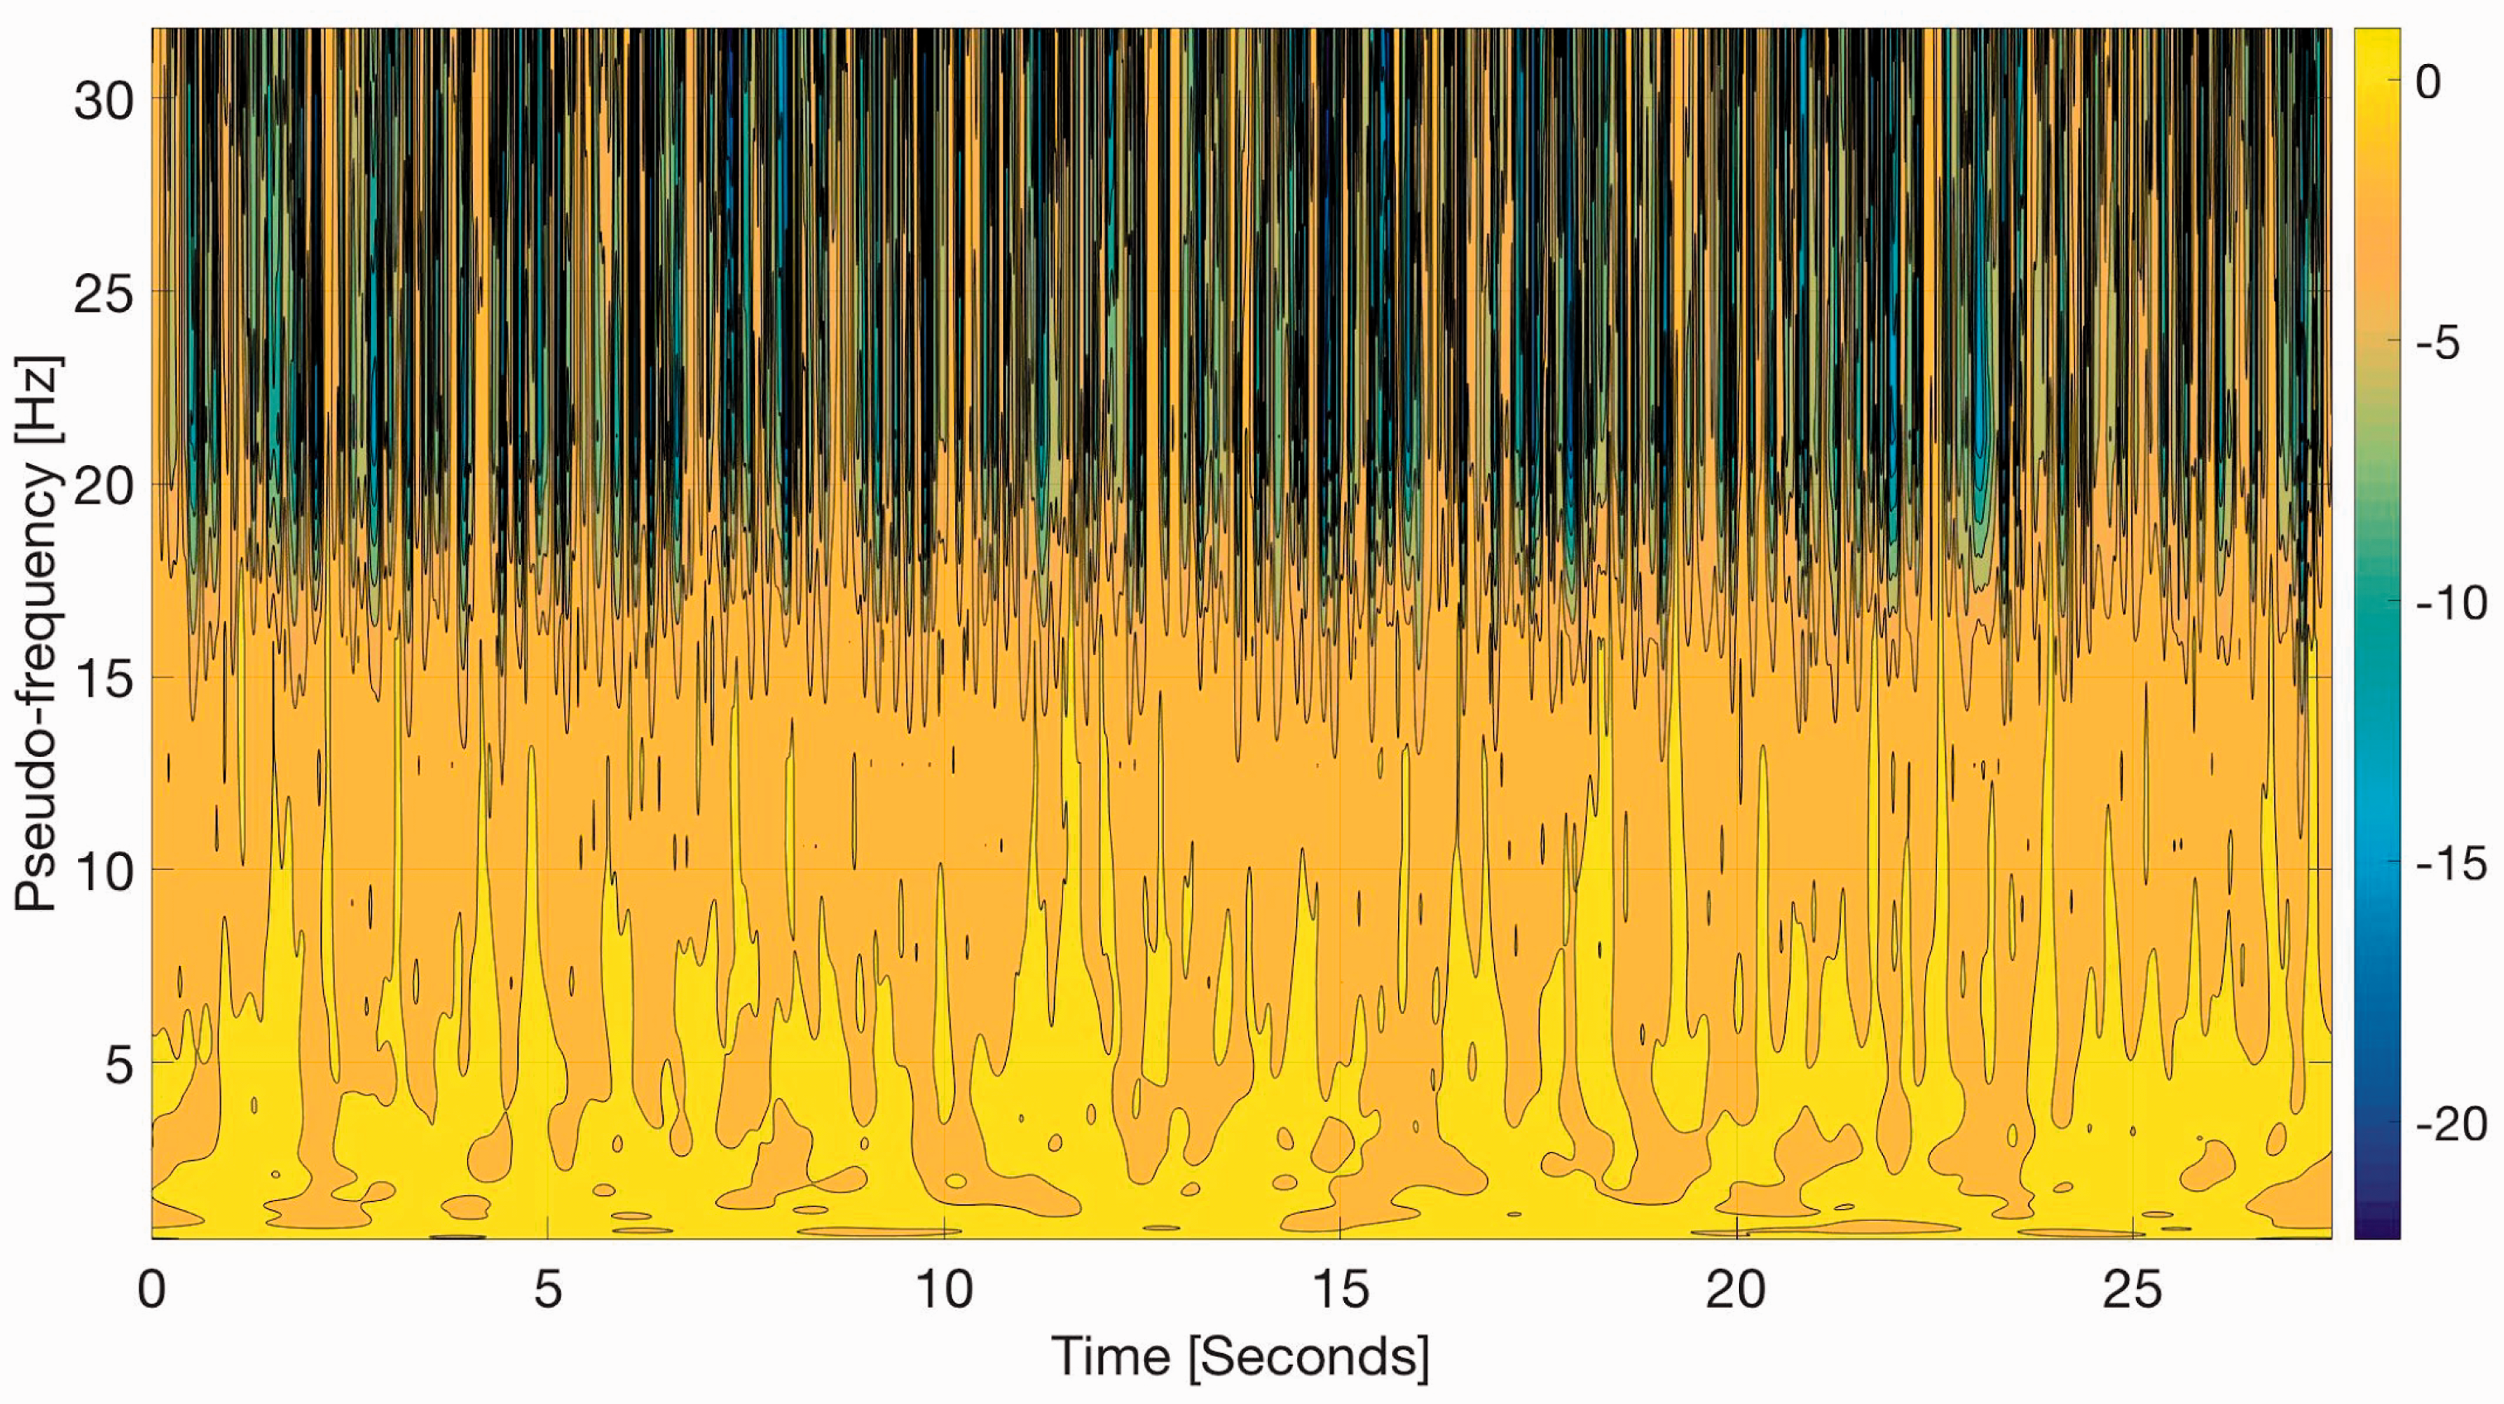
The WFT is presented in Figure 7. The legend on the right-hand side of the figure indicates values of wavelet transfer function Wψ(a, b). These values indicate the difference between the output and input signals, in relation to the maximal values of each scale (pseudo-frequency). Therefore, if Wψ(a, b)=0, there is no difference between signals in the frequency range. When 0 < Wψ(a, b) ≤ 1, the system is close to the resonance frequency. In case of Wψ(a, b) < 0, there is damping in the system. The transfer function value ranges from 0 to 1, as seen in Figure 7. It occurs frequently in the low-frequency range till 5 Hz. The seat suspension is the passive one, which exhibits this characteristic. On the other hand, it indicates damping features in a relatively higher frequency.
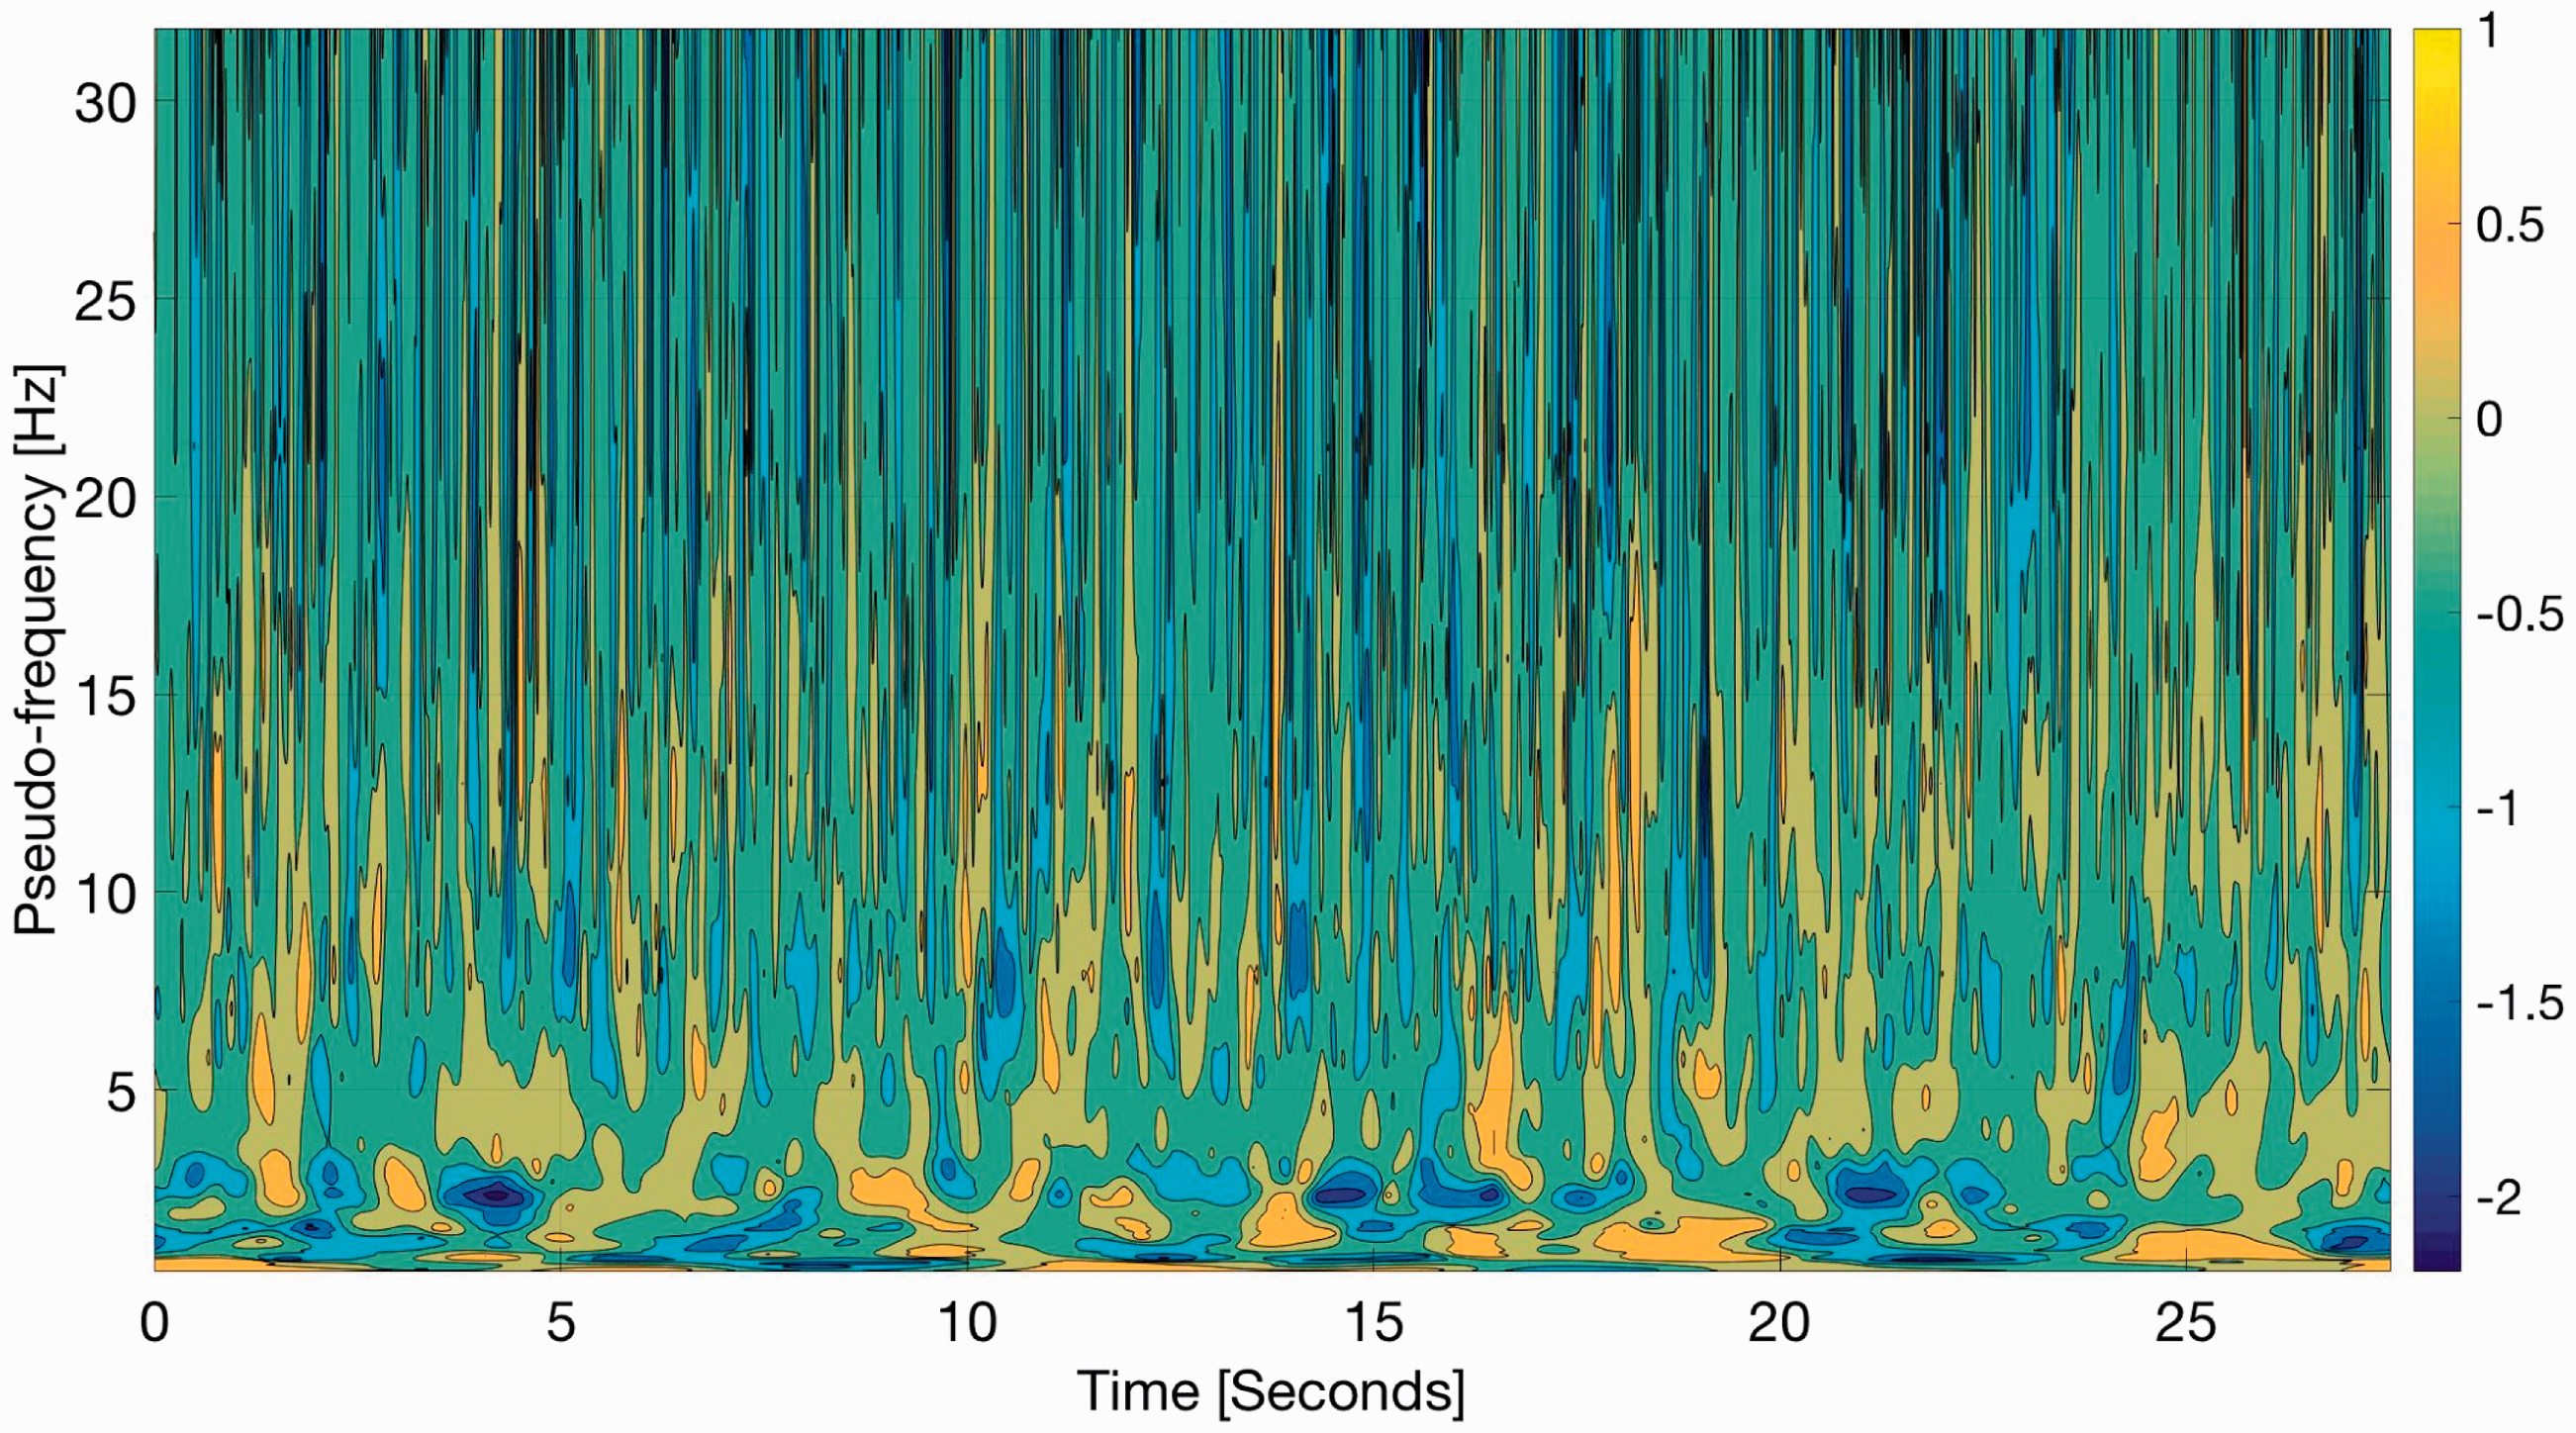
The wavelet transfer function Wψ(a, b) of the stand base-seat system.
The wavelet transfer function stand base – head system
In order to evaluate the vibration received by the man’s head, the wavelet analysis is conducted once more. The output signal is measured using sensor 6. The results are presented in Figure 8. In this case, it is shown that the human’s vibrations are limited to low-frequency range (up to 5 Hz). The maximum values of wavelet coefficients tend to 16. It is two times more than the values in the case of stand base and seat (Figures 5 and 6). The wavelet transfer function of this system i.e. stand base – human’s head shows its main feature. It describes the vibration propagation in the human body. In Figure 9 three ranges can be indicated:
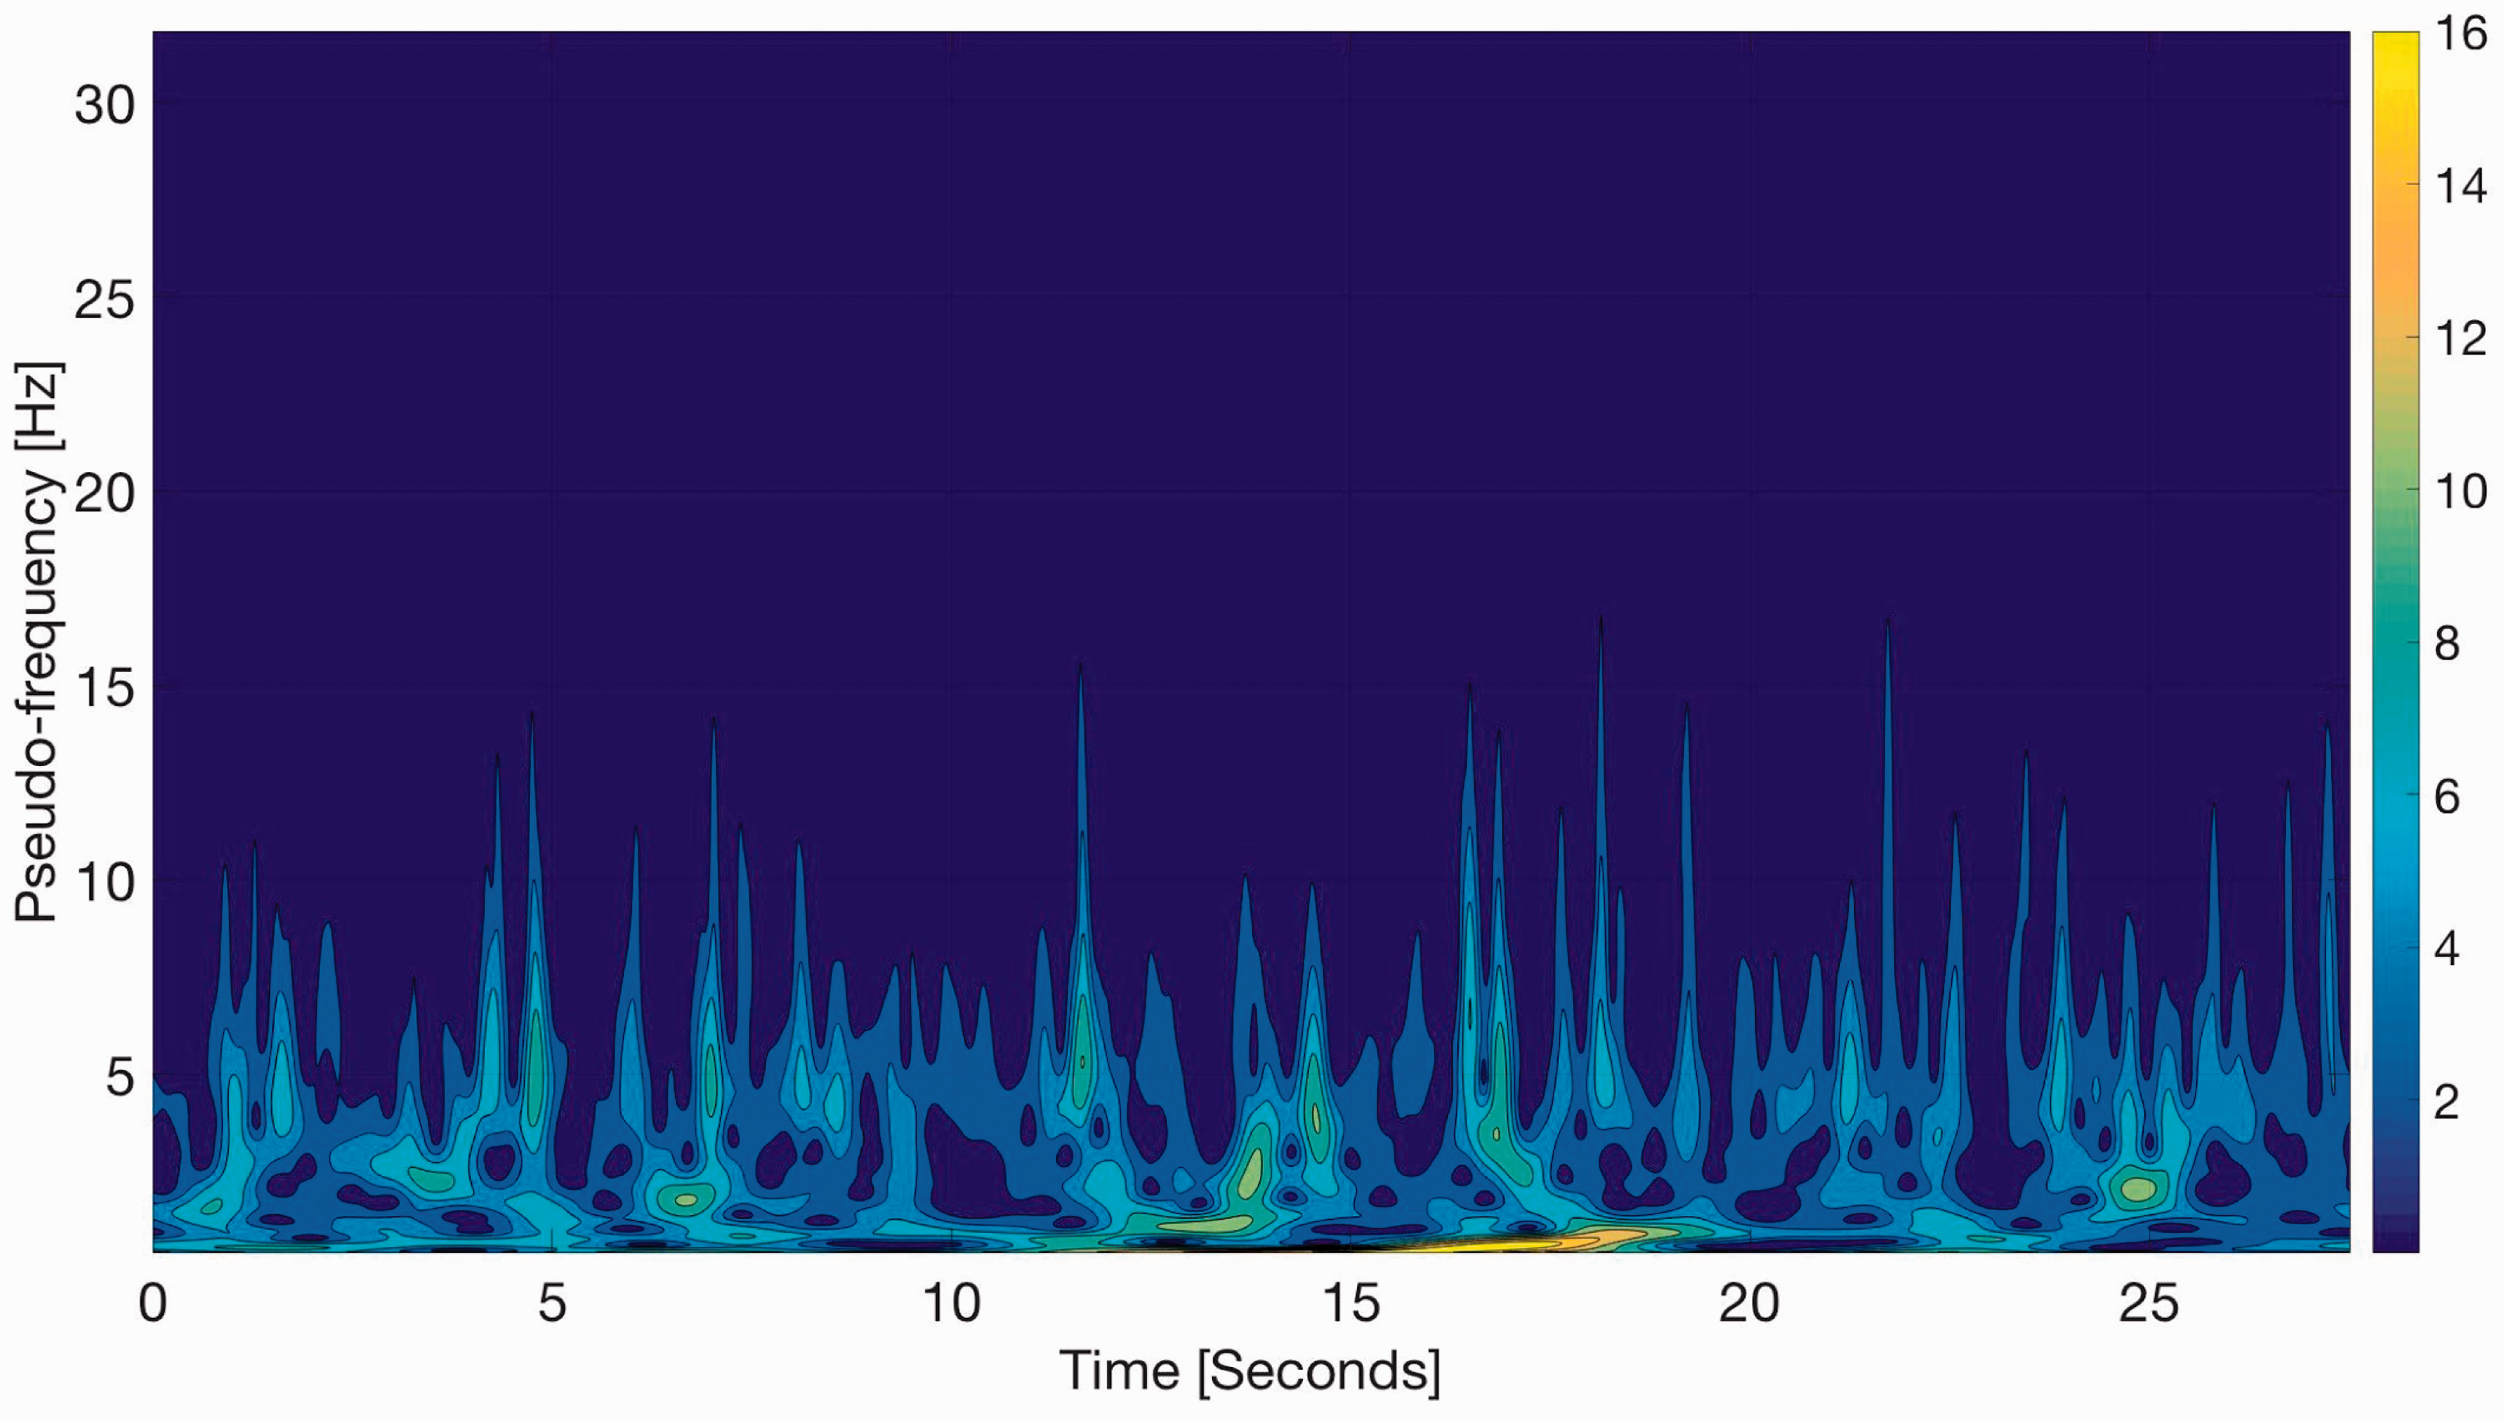
The output signal O(t) wavelets transform Sout(a, b) – sensor 6, obtained by using Morlet wavelet with parameter 4.
The wavelet transfer function Wψ(a, b) of the stand base-head system.
the possible resonance range as a yellow areas with limit up to 5–7 Hz,
the damping range from 10 Hz to 15 Hz,
the uncertain range above 15 Hz.
Discussion
The problem considered in this work follows from the research presented in Maciejewski et al. 3 The particular work dealt with the passive seat suspensions (called conventional passive seat suspensions). They were deeply tested numerically and experimentally. The system tested using wavelet transfer function, the amplification of vibration was observed in the 0–2 Hz frequency range. At higher frequencies, the desired behavior of the seat suspension was reached. The vibrations transmitted by the seat were reduced significantly. The former work 3 indicates the same feature where they introduced the power spectral density and transmissibility functions for evaluation in the form shown in Figure 10. This analysis shows the resonance range in the frequency domain. In comparison to the wavelet transfer function (Figure 7) it does not indicate the moment and time duration of this resonance. The WTF shows that the examined seat suspension system may amplify vibrations in wider frequency range. The WTF indicates exceeding resonance range for same moments in time signal history (yellow-brown strips go along to higher frequencies for exact moment).
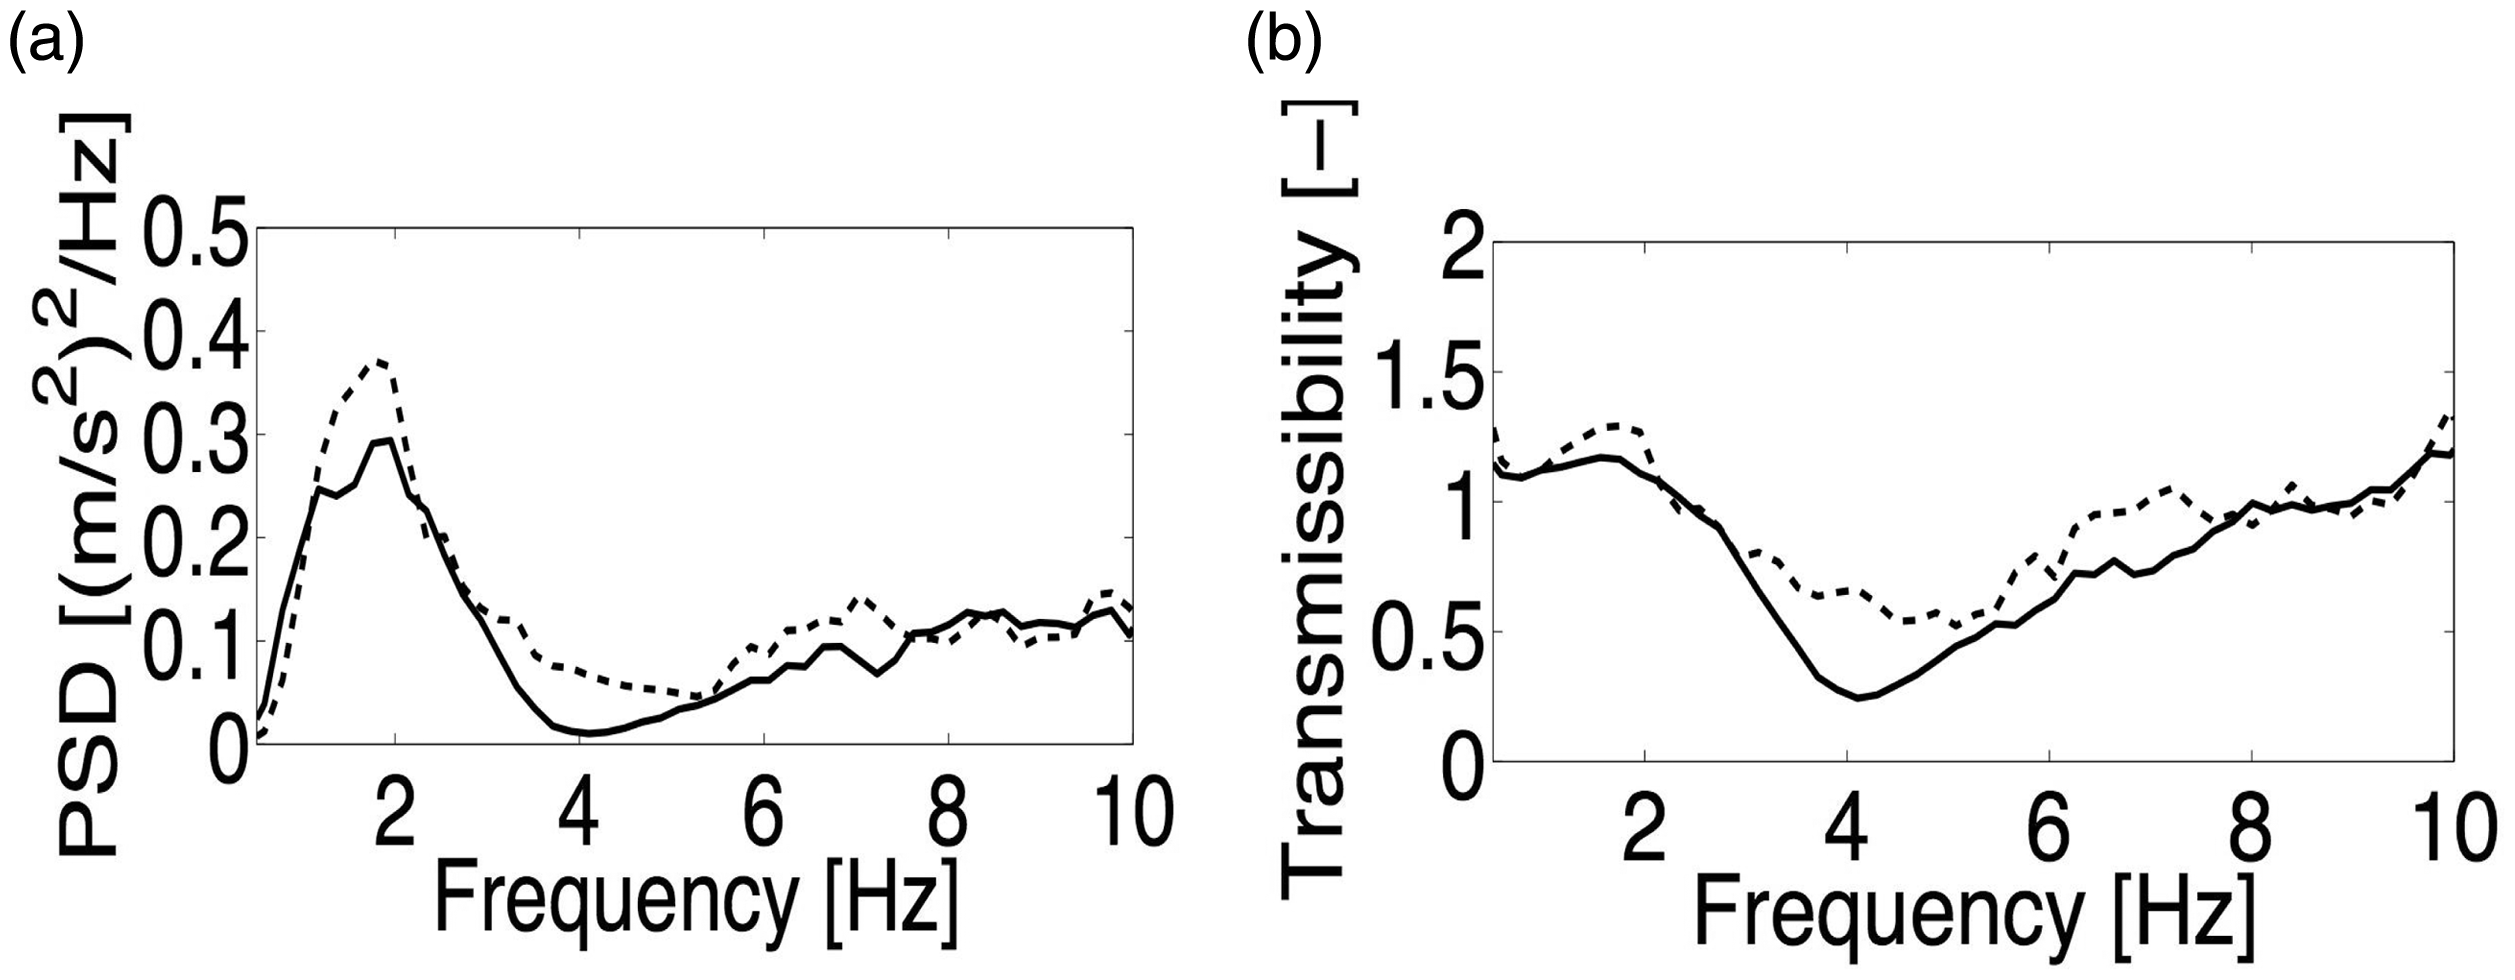
Measured (- - - - - -) and numerically simulated (____) power spectral density functions (a) and (b) transmissibility function for excitation by using white noise signal.
Conclusion
The special methodology of a human body–driver seat system examination is proposed. The dedicated stand is used, which allowed to examine the vehicle–driver interaction. The vibrations affecting a human driver are examined. Here, one special case is shown. The driver is subjected to random, low-frequency vibrations, coming from a road. The reaction of the driver head was considered especially. The results obtained (by using wavelet transfer function) showed the human body as a system possessing damping feature in considerably sharp frequency range of 10–15 Hz. On the other hand, it shows that low-frequency vibration can be amplified in human head. A worrying problem is that the amplification occurs periodically. It can generate impulse effect on human head. In the range below 10 Hz (Figure 9), the vibrations can be relatively bigger than excitation. Therefore, it is still important and a huge challenge to develop active seat suspension systems, despite their higher price. Active systems reduce vibration in low range frequencies, in contrast to passive system examined here. Further work is needed to improve the quantification of human-driver parameters from accelerometer data, in order to make the results reliable enough to be used for e.g. the health research. We want to encourage other researchers to explore and contribute to the ProMove mini package as a research tool.
Footnotes
Declaration of conflicting interests
The author(s) declared no potential conflicts of interest with respect to the research, authorship, and/or publication of this article.
Funding
The author(s) disclosed receipt of the following financial support for the research, authorship, and/or publication of this article: The paper is a part of the research project “Methods and procedures of selecting vibro-isolation properties of vibration reduction systems” founded by the National Science Center of Poland under the contract no. UMO-2013/11/B/ST8/03881.