
Abstract
To design a distributed fiber optic vibration sensor for urban natural gas pipeline leak detection, the light polarization fading transmission model based on Jones matrix is built in this mixed Sagnac/Mach-Zehnder interferometer configuration. The interference light intensity of pipeline with leakage and without leakage cases is compared through spectrum analyzer. When fiber length ranges from 1.5 to 9.5 km, the light power intensity (central wavelength 1550 nm) reduces to −56 dB. In experiment, the leaky spectrum null frequencies are captured and the average relative error of leakage point location varies from 2.3 to 5.3%. When the sensing length is expanded to 9.5 km, the vibration sensor system sensitivity is 0.57 Hz/m.
Introduction
Detection of urban natural gas pipeline leakage requires attention due to the remoteness of gas locations and the sensitivity of the complex environmental conditions. The high pressure gas pipeline leakage sources of crack or slit caused broadband acoustic vibration signals.1–3 Current monitoring methods include flow measurements at the beginning and end of the gas pipeline, offering an indication of the presence of a leak, but it is difficult to locate the leakage position. Recent developments of distributed optical fiber sensor promised to provide a cost-effective tool allowing monitoring long-distance pipeline. 4 An optical fiber sensor embedded in or attached to gas pipelines expanded or contracted by small amounts according to strains on the structure and temperature variations, even vibration signals.5,6 The distributed fiber optic sensing system integrated information collection and transmission in one optical fiber. Its advantages of high sensitivity, long-distance monitoring, and accurate location provided the availability of leakage location in the pipeline monitoring system. 7
Distributed fiber optic sensing systems based on Brillouin and Raman scattering are used to detect the localized strain and/or temperature, allowing the monitoring of hundreds of kilometers along a structure with a single instrument with an accuracy of several meters.8–10 The highly sensitive fiber optic liquid leak detection technique with an ultrasonic actuator and a fiber Bragg grating had been developed. 11 The backscattering fiber optic sensor can realize high positioning accuracy within several meters, but the system needs complex expensive apparatus and consuming much time for data processing. Therefore, interferometric systems owned high real-time performance and had been a well-known solution to fiber optic measurement configurations for pipeline leakages inspection.12,13 The Sagnac interferometer owns merits of high sensitivity, large monitoring range, and passive sensing. The different complicated Sagnac configurations were proposed for gas pipeline leak detection. The core component of pipeline leaky point localization method is to search the null frequencies of the frequency spectrum. Such as distributed fiber optic sensing system based on Sagnac and Mach-Zehnder interferometers architecture was designed to monitor gas pipeline leaks signals using single mode fiber. 13 A null frequency localization regression model based on 20 groups of leakage data was established through particle swarm optimization tuning of the support vector machine. 14
Actually, polarization fading of many optic devices in the total optical paths configuration, such as mixed Sagnac and Mach-Zehnder interferometers, is not considered. The null frequency points are very difficult to be accurately captured owing to low signal-to-noise ratio (SNR) of leaky spectrum. Using low-birefringent single mode optical fiber, the distributed fiber optic sensor was subject to construct polarization-induced phase shift and polarization-induced fading, which will deteriorate the positioning accuracy of the fiber optic sensor. 15 The unpredictable loss of interference efficiency arises because of random changes in the state of polarization of the two interfering beams caused by changes in the fiber birefringence. 16 Polarization fading problem is also obvious in Sagnac interferometer and deteriorates the positioning accuracy. The interferometer phase spectrum exists many peaks, and it is not easy to discriminate first null frequency point. To eliminate and quantitatively evaluate the polarization fading in interferometric fiber optic sensor for gas pipeline leakage detecting is a challenge. With the analytic model deduced from Jones matrix, Choi and Jo 17 had accurately evaluated the polarization characteristics in the integrated optic chip for interferometric fiber optic gyroscope. To find the null frequencies more accurately and efficiently, an improved algorithm twice fast Fourier transform (FFT) for multipoint intrusion location in distributed Sagnac sensing system was proposed. 18 Furthermore, the Faraday rotation mirror (FRM) and polarization diversity receivers were used to remove the linear birefringence and the orientation birefringence in Sagnac and Michelson interferometer. 19
In this paper, urban natural gas pipeline leak detection experiments are carried out based on distributed fiber optic vibration sensor. The birefringent path is represented as a general retarder and is characterized by Jones matrix in a birefringent interferometer. To evaluate the polarization fading in this mixed interferometer, the mathematical model deduced from Jones matrix is used to describe the optic devices polarization of the sensor system. Observing the light power spectrum of difference cases through high resolution spectrum analyzer, the influence of polarization fading on system localization performance was analyzed by experimental data. Finally, we discuss the positioning performance of different leakage points by distributed fiber optic vibration sensor.
Principle of operation
Measurement of gas pipeline leaky positions
Interferometric fiber optic acoustic sensors are based on measuring the phase change of light travelling in an optical fiber due to the strains, temperature, or vibration variations. Based on the basic optical paths structure proposed by Huang et al.,
13
the configuration of this distributed fiber optic vibration sensor for urban gas pipeline leakage detecting is presented in Figure 1. The gas leakage point of the sensing fiber optic can be localized by Sagnac interferometer, and interferometric lights caused by outside vibration are processed by Mach-Zehnder interferometer. The FRM, polarization controller, and phase modulator are used to eliminate polarization-induced fading in light path. The piezoelectric ceramic transducer (KG-PM LiNbO3 PZT) is applied as a phase modulator to generate a high frequency carrier. The distributed fiber optic sensor detects the vibration signal caused by natural gas pipeline leakage, and the details description is referred in Yue et al.
14
Schematic of fiber optic vibration sensor based on Sagnac and Mach-Zehnder interferometer.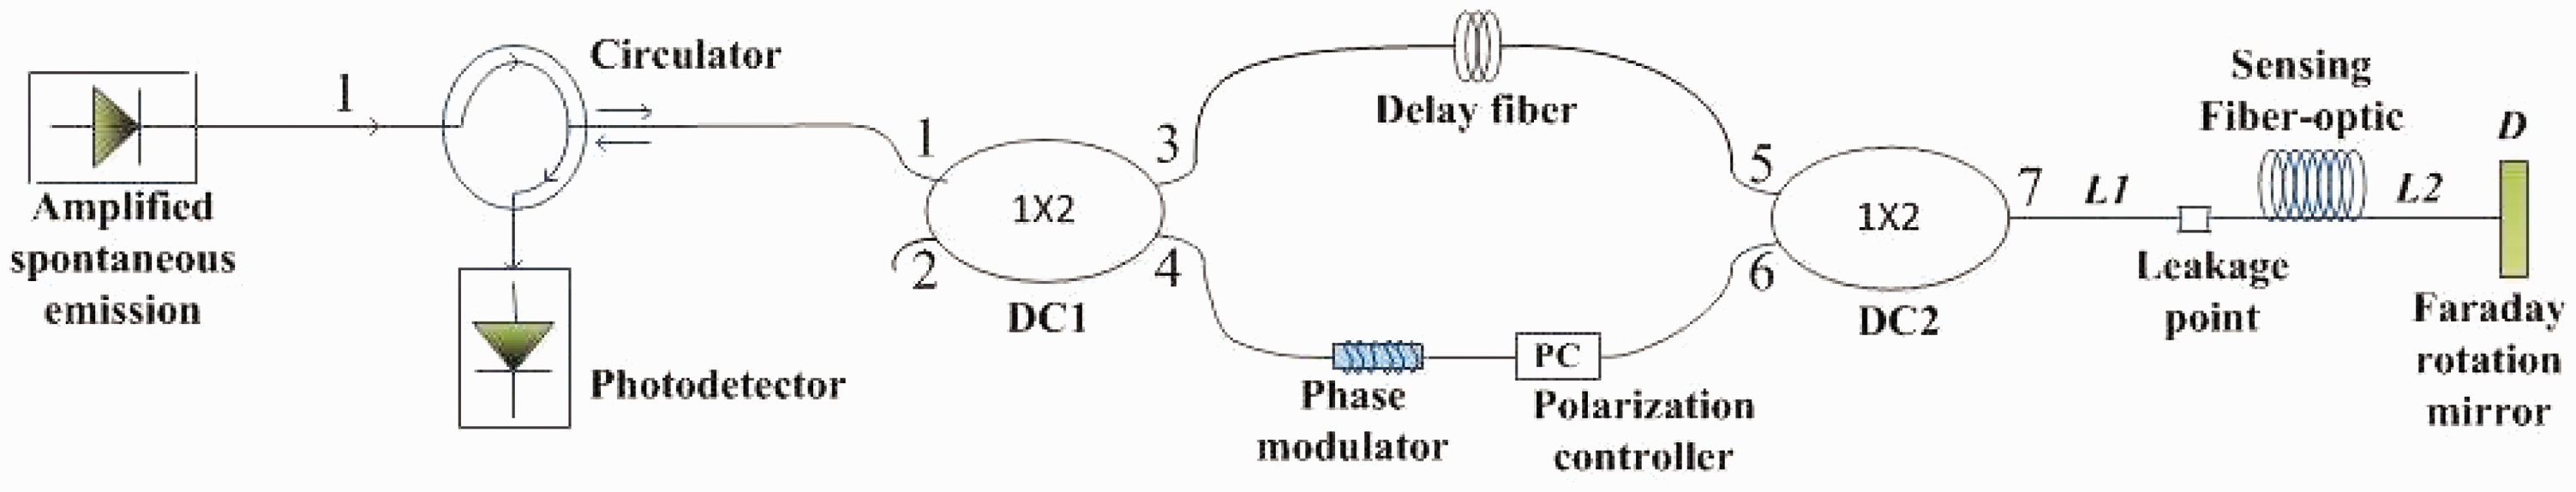
The amplified spontaneous emission (ASE) light source transmits light through optical circulator (CIR) to the 2*2 coupler (DC1) terminal 1. Then the light is divided into two paths (through terminal 3 and 4), one is through PZT modulator and polarization controller, the other passes the delay optic fiber A. The lights transmit into the second coupler 1*2 (DC2). Finally, two optical paths pass the coupler to the sensing optic fiber and reflected by the FRM. As shown in Figure 2, there are two optical paths (path 3 and path 4) not equal to other paths, therefore these two paths cannot generate interference signal. Only the other two optical paths (path 1 and path 2) have equal optical paths and meet the zero optical path difference need of Sagnac interferometer.
The optical path of the distributed fiber optic interferometer.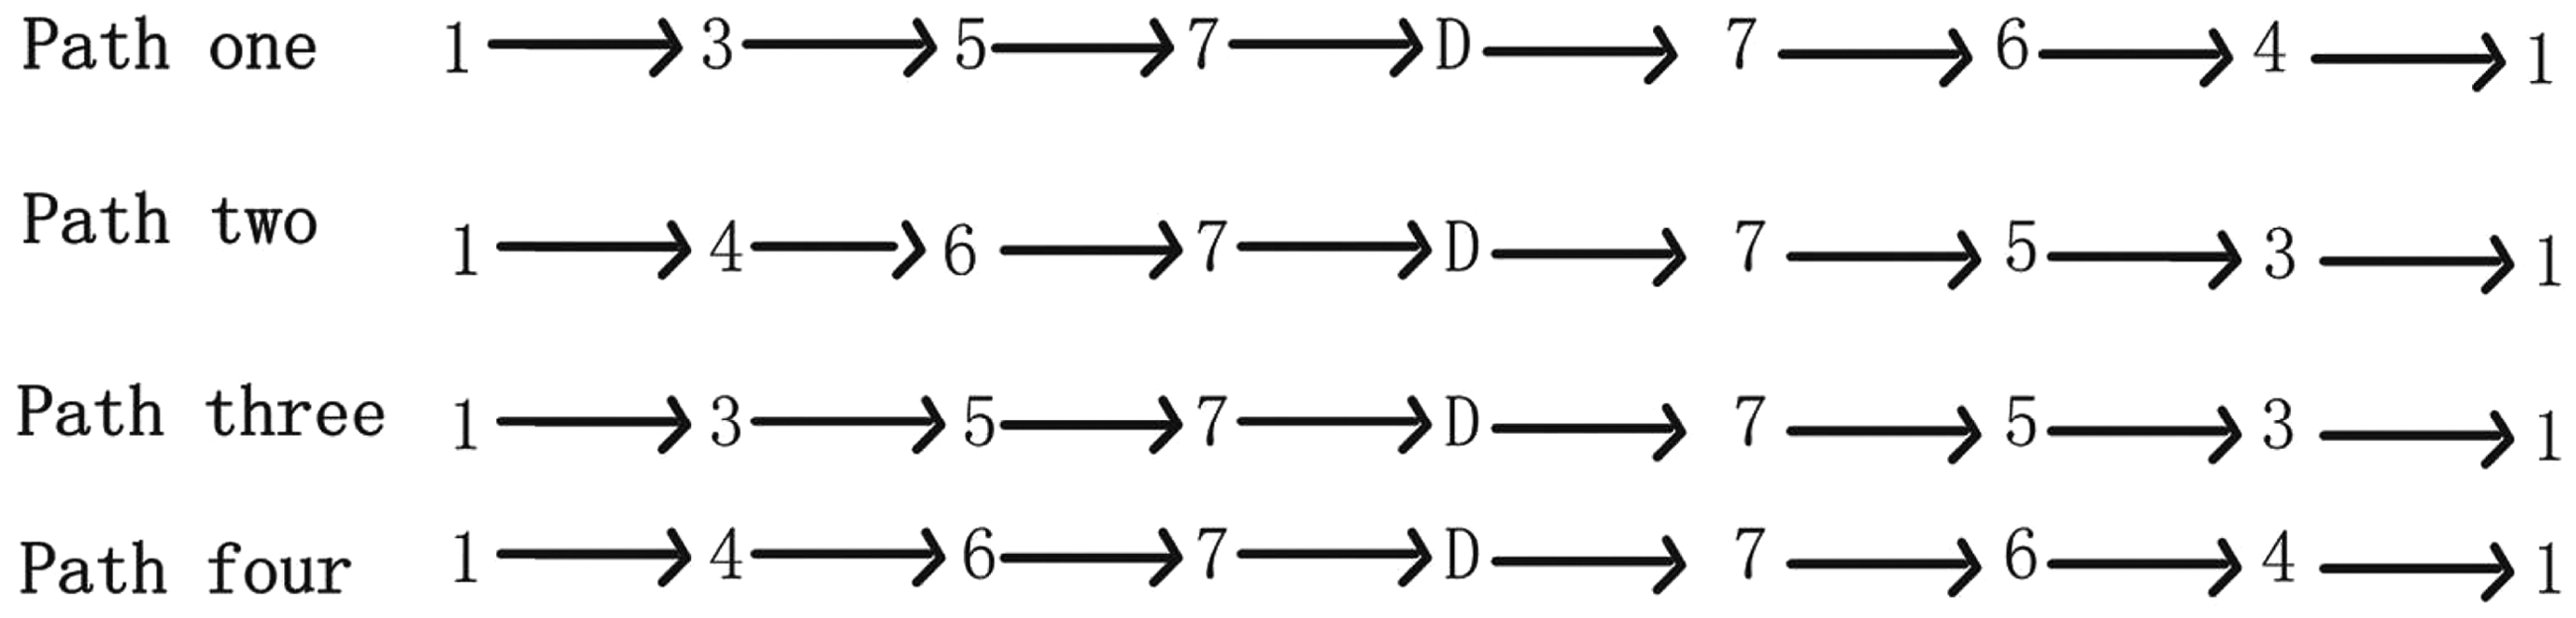
The natural gas pipeline crack or slit leakage consists of the transition of a pressurized gas from inside high pressure pipeline to the lower external pressure. The vibration signals are generated by high-speed jet flow.20–22 Therefore, this gas pipeline section leakage point generates the acoustic field with frequency

The light intensity I is demodulated by using phased generated carrier (PGC) technique to obtain the phase difference

In equation (2),

Polarization fading analysis for Jones matrix
The light wave at any point in the circuit is represented by its Jones vector

Here
In Figure 1, the distributed fiber optic vibration system of urban gas pipeline leakage includes many optical devices, such as single mode optic fiber, FRM reflection and couplers (DC1 and DC2), which contribute to polarization fading, interference noise, also reducing visibility of interference fringes in experiment. Jones matrix represents optical device polarization state by
The ASE light source transmits the light through optical circulator, and the light is split into two mutually orthogonal beams by
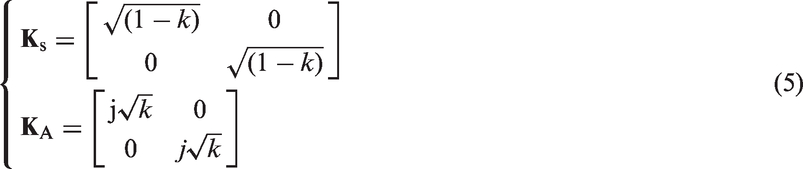
In equation (5),
The FRM is designed to rotate the polarization of the input light by 45°. The light wave is input into the FRM with 45° deflection angle. Finally, the light wave is reflected by the mirror and returned back in the input direction. So FRM Jones matrix is expressed as

According to Jones matrix equations (4) and (5), considering optical devices polarization variation, the electric fields of the lights passing through path 1 and path 2 are given by


Therefore, the total intensity of electric field of two paths can be expressed as

Considering the optic devices polarization variation, from equations (6) to (8), the actual interferometer output light intensity is acquired as

Comparing equation (10) with equation (1),
Experiments and data analysis
Measured interference light spectrum
In laboratory-scale experiment, the urban natural gas pipeline section leakage localization tests are conducted. The distributed fiber optic vibration sensor interferometric light spectrum under leaky case and no leaky case is compared by spectrum analyzer. The testing pipe section is a three-layer anticorrosion polyethylene (PE3) external coating metal pipe with 1.2 m length. The pipe inner diameter is 100 mm and thickness is 25 mm. In the experiment, the 2 mm diameter orifice in the pipeline section is used to simulate gas leakage. The pipe working pressure is 1.0 MPa. The sensing single model fiber is fixed on the outside surface of the pipe section, and its refractive index n is 1.458. The total distributed fiber optic vibration sensor system is shown in Figure 3. The ASE light source whose maximum output power is 15.8 dBm, the spectral range is 1528–1564 nm and wavelength λ 1250–1650 nm. The Yokogawa Corp AQ6370 spectrum analyzer was used to analyze the interferometer light spectrum. With the ability to provide high-speed accurate analysis of the short wavelength range between 600 and 1700 nm, this spectrum analyzer is well suited for a broad range of applications. In test, the selected wavelength resolution is 0.02 nm of spectrum analyzer.
PE3 pipe section leakage testing system diagram. PE3: three-layer anticorrosion polyethylene.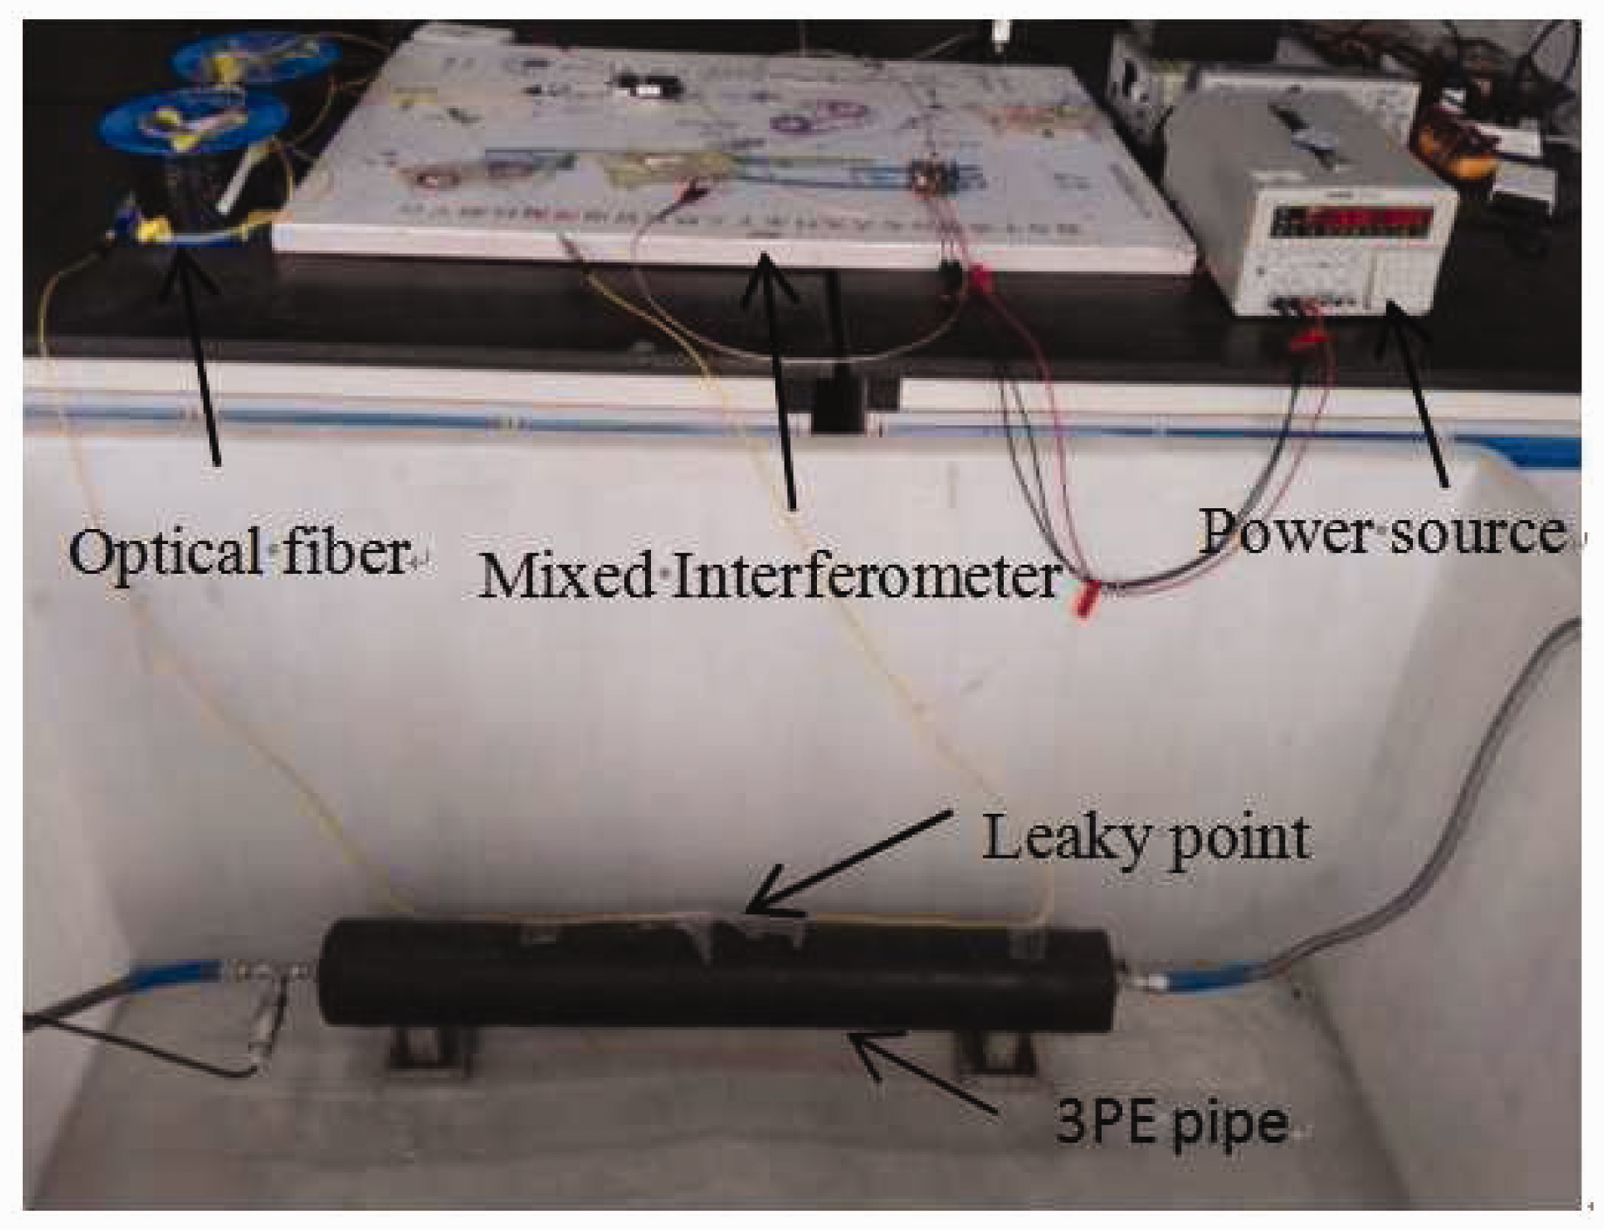
When a leakage occurs in pipe section, the leaking gas percolates down through the outside PE coating material of pipe. The range of the sensing fiber span ranges from 1.5 to 9.5 km. The intensities of interferometric light of distributed fiber optic sensing system before and after leakage are compared using spectrum analyzer directly. The selected sensing fibers lengths (L1+L2) are 1.5 and 3.5 km, each case includes leakage signal and no leakage signals. The measured interference signals are analyzed by AQ6370 spectrum analyzer. The interferometer light intensity around the center wavelength 1550 nm under different working conditions is intercepted and presented in Figure 4.
Interference light power spectrum. (a) Light power spectrum before leakage with 1.5 km optic fiber length, (b) light power spectrum after leakage with 1.5 km optic fiber length, (c) light power spectrum before leakage with 3.5 km optic fiber length, and (d) light power spectrum after leakage with 3.5 km optic fiber length.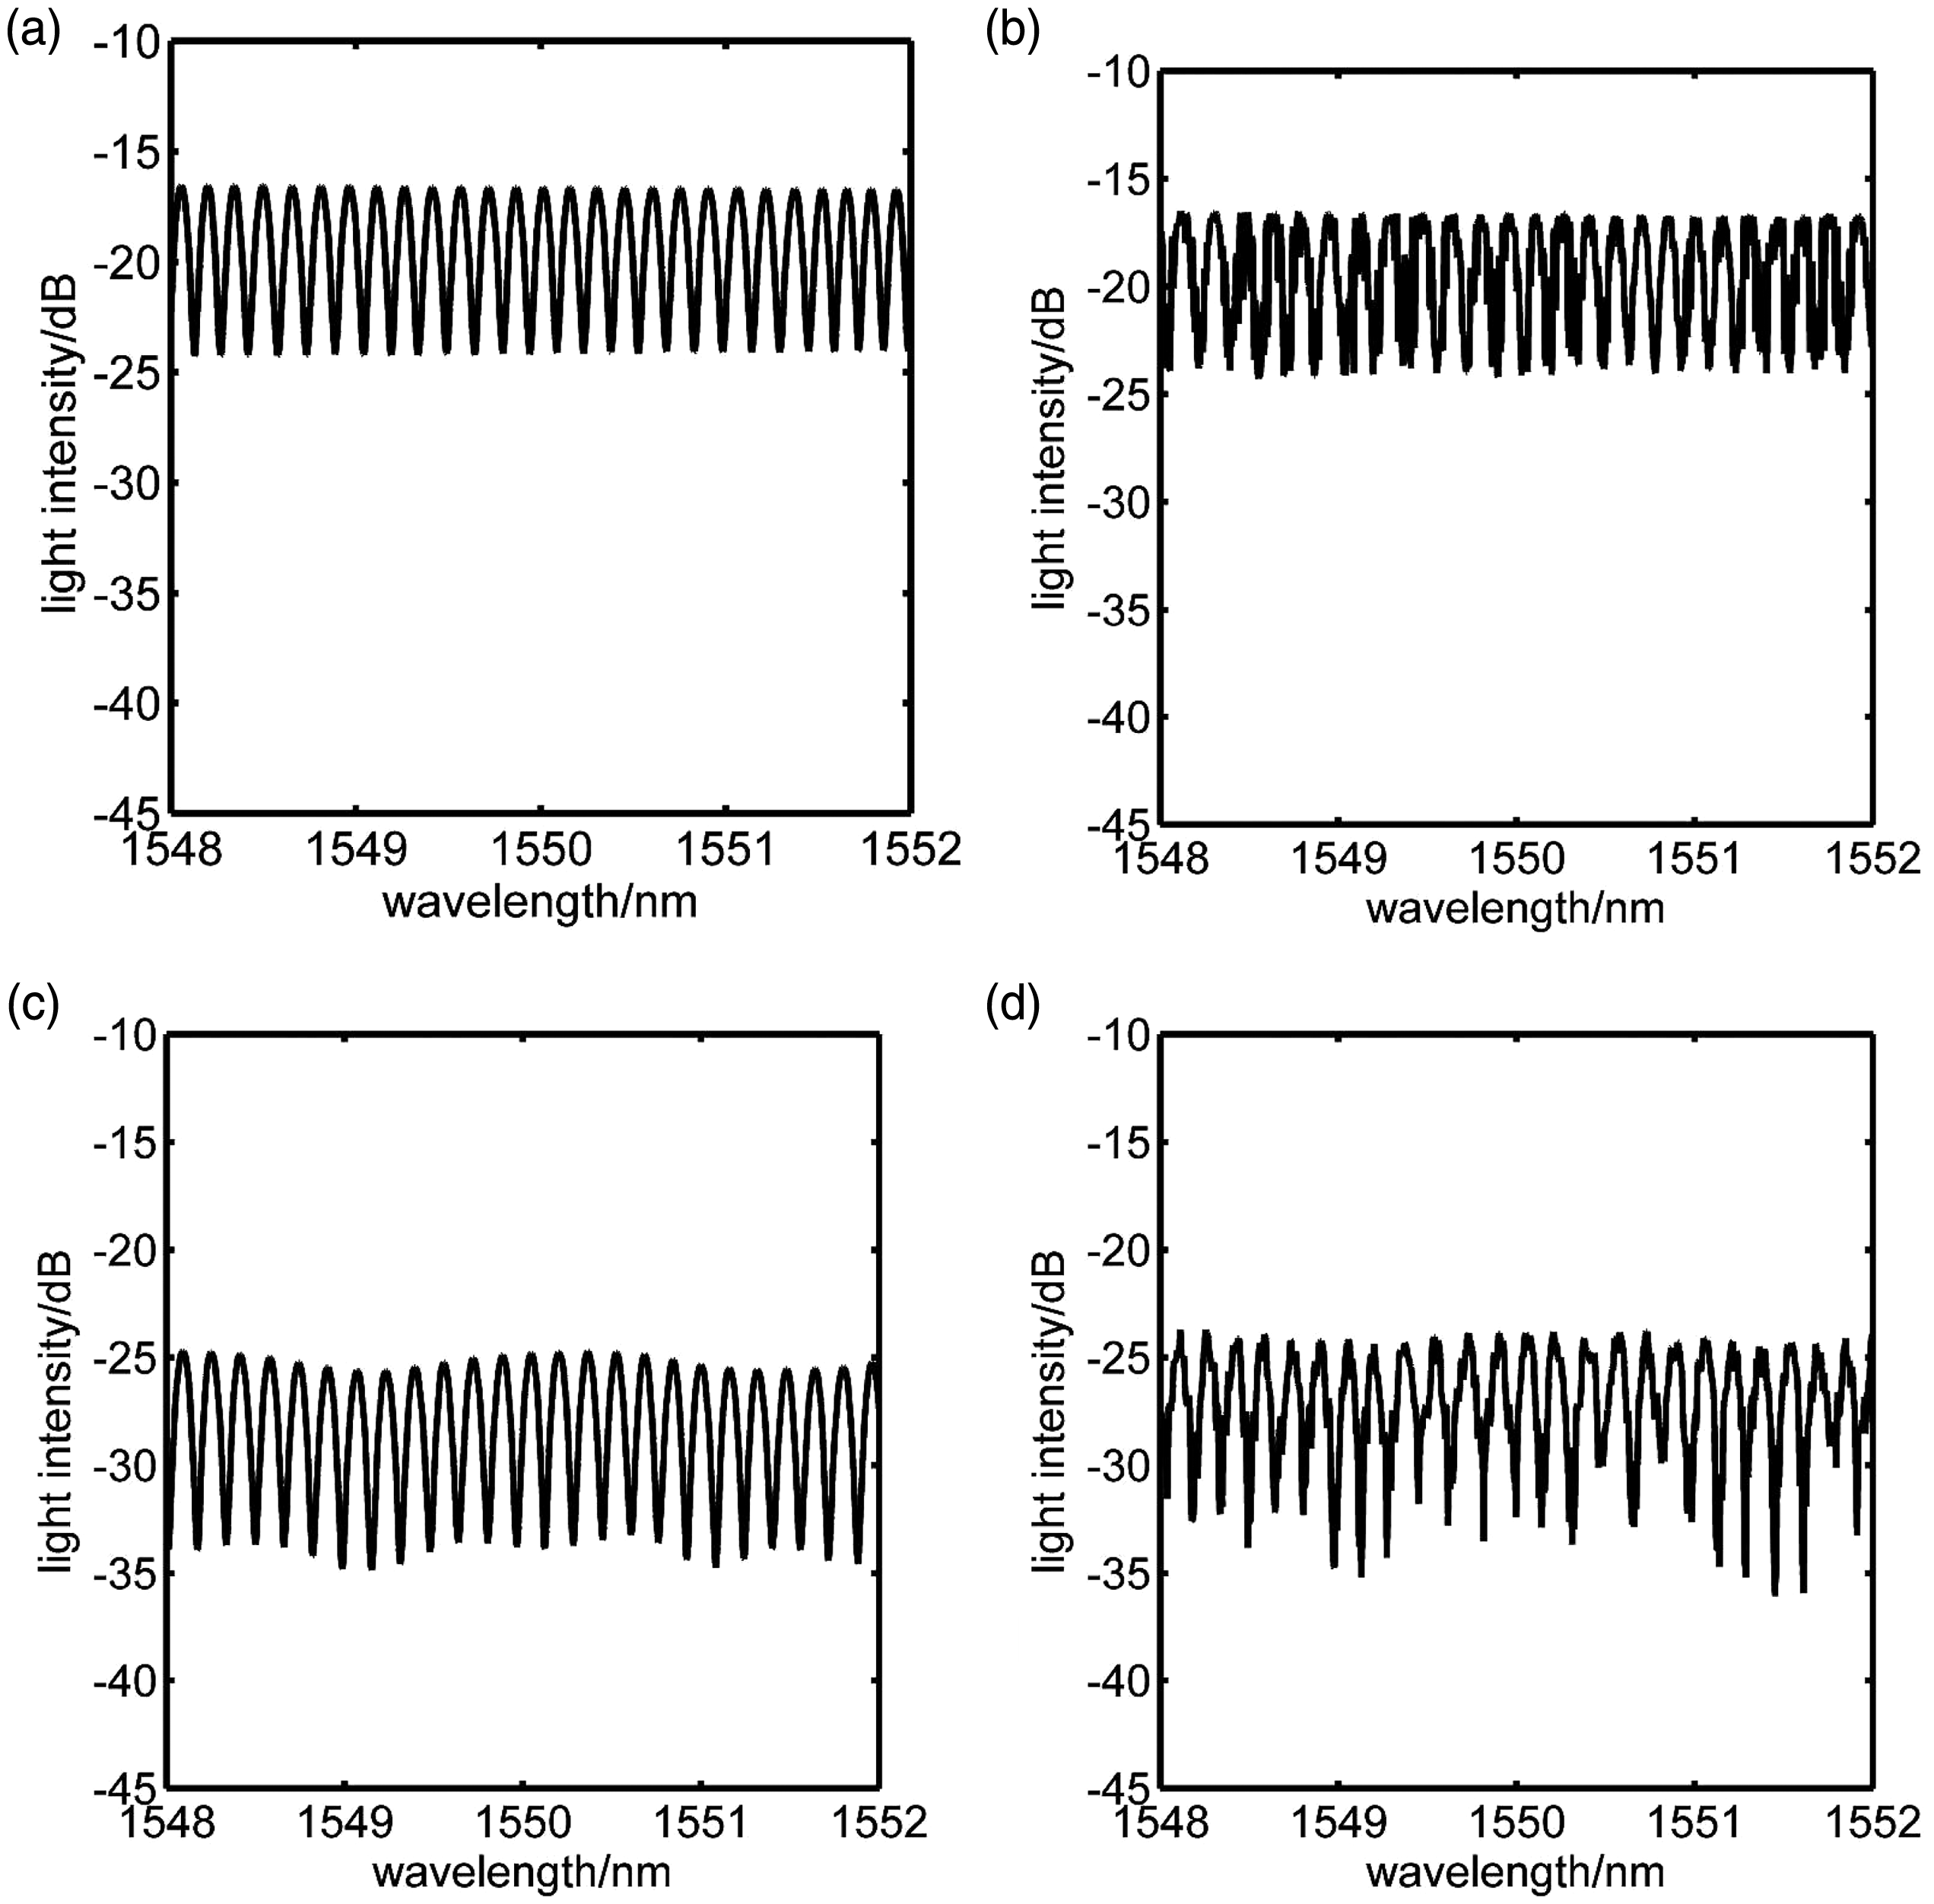
The interference signal optical power of pipeline without leakage is presented in Figure 4(a) and (c) when sensing fiber lengths are 1.5 and 3.5 km, respectively. In Figure 4(a), light intensity varies in the range from −16 to −25 dB with the sinusoidal wave shape. In Figure 4(c), interference light intensity ranges from −25 to −34 dB. When the sensing fiber length increases from 1.5 to 3.5 km, the light intensity attenuates about 9 dB. Comparing Figure 4(b) with (d), it is obvious that the leaky spectrum of different sensing fiber length owns different characteristics. In Figure 4(d), the attenuation of the light intensity varies in −25 to −37 dB with fluctuation sine waveform. It is clear that the wavelength of leaky signal spectrum is 1.2 times larger than original signal wavelength without leakage. Furthermore, interference light power spectrum crests and troughs exist many spiky noise. The period of the leaky signal spectrum curve is enlarged with the sensing fiber length increasing. So the light power spectrum variation is able to show whether the pipeline leakage accidents happened or not.
As illustrated in Figure 4, the light interference fringe state is stable and the light power spectrum sine wave shape is clear without leakage happened. The high pressure releasing gas causes friction with orifice and generates high frequency acoustic wave. The acoustic wave causes a distortion in the optical path length of the sensing section of the total optical fiber. Therefore, the distortion of optical paths will produce dynamic interference fringes. The spectrum has peak pulse interference around trough and crest. The period of the spectrum increases than before, and light power intensity degenerates obviously.
To validate this phenomenon, the optic fiber sensing length (L1+L2) is extended to 9500 m. In Figure 5, the light power intensity is reduced to −56 dB around center wavelength 1550 nm. The interference light intensity attenuates seriously, so leakage signal is not easy to be discriminated and covered by noise from outside in the measurement system.
Interference light power spectrum after leakage with 9.5 km optic fiber length.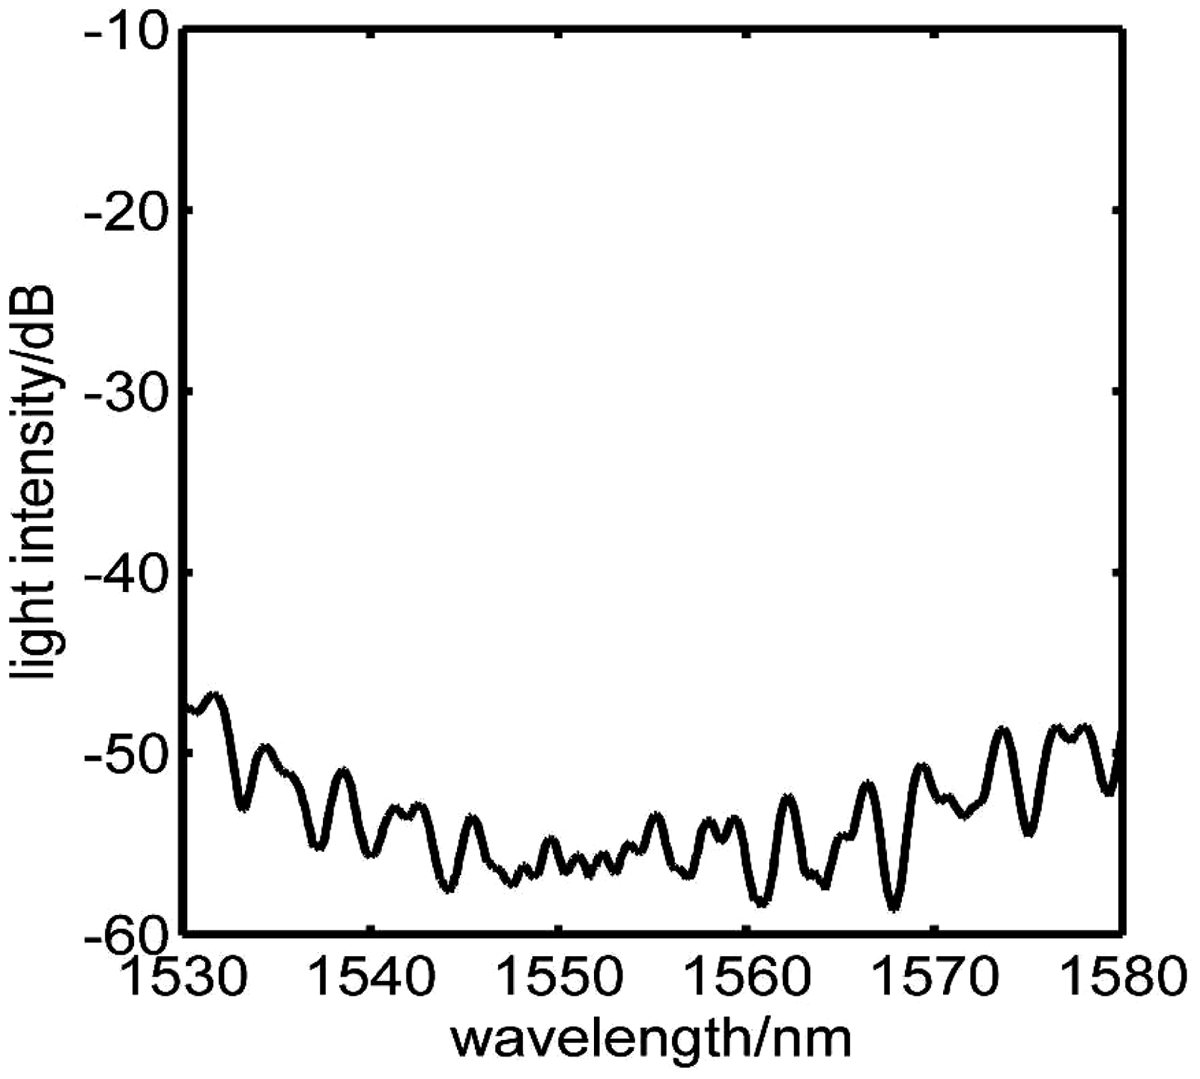
Leaky source localization
The interference light containing leaky point information will be converted into electricity through PD. Then the electricity signal is demodulated by PGC circuit (carrier frequency 300 kHz). Finally, the phase difference signal of leaky point was transformed into frequency domain and the first null frequency was captured. The leaky point position is able to be gained by equation (2). Figure 6(a) and (b) is the experimental localization results of null frequencies for various sensing fiber lengths (3500 and 9500 m, respectively) before denoising process. In the detection positioning spectrum diagram, although the downtrend is obvious, the null frequency points are covered by strong noises and the first null frequency point is obscure.
The spectrum of null frequencies with difference leaky points. (a) Leakage point 3.5 km before denoising, (b) leakage point 9.5 km before denoising, (c) leakage point distance 3.5 km after denoising, and (d) leakage point distance 9.5 km after denoising.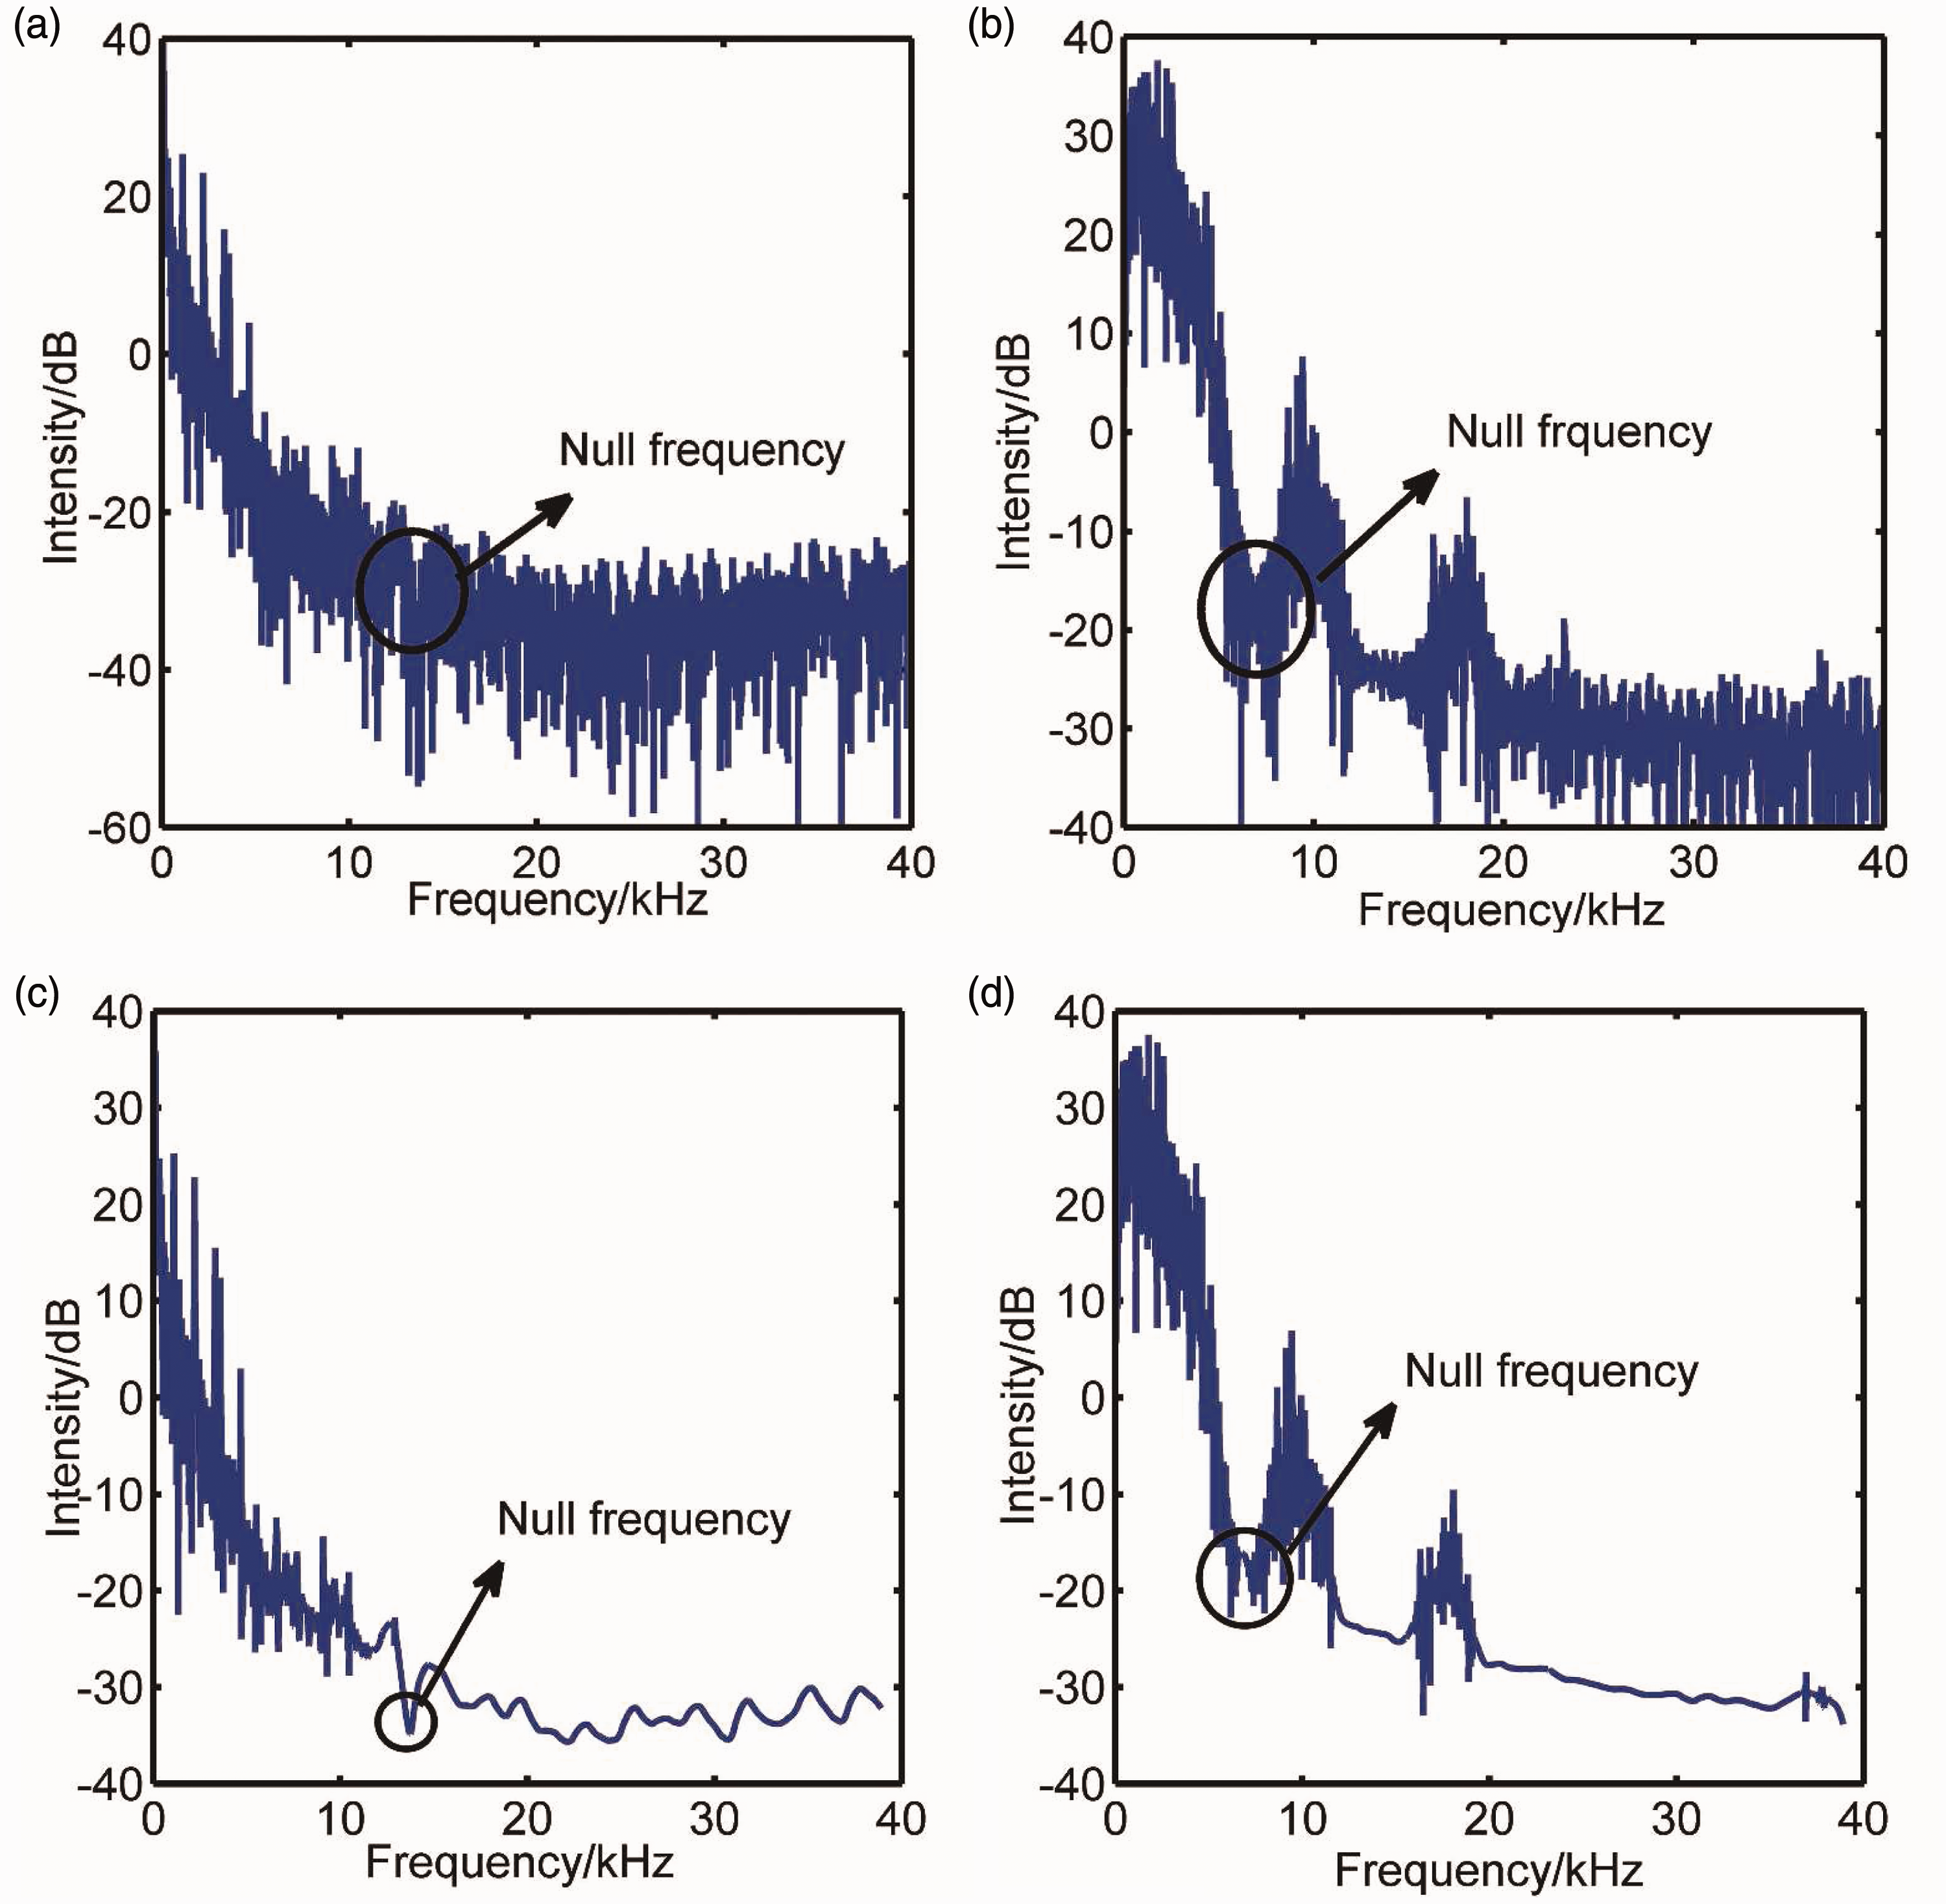
The optic fiber sensor system SNR strongly depends on the distributed fiber optic sensor topology. In principle the noise sources belong to the light source, optical fibers, detector, electronic circuits, and environment. To study interferometric noise, we need to focus on the topology. As shown in Figure 1, the lights of path 1 and path 2 are all reflected by FRM. If the distance L2 between leakage point and FRM is reduced, the interference signal intensity of interferometer will strengthen and SNR also be improved. Conversely, if the L2 increased, the SNR will be decreased. The null frequency point is indistinguishable from the signal to be detected. After three-level Daubechies wavelet decomposition soft threshold denoising,25–28 the SNR is obviously improved. The first null frequency is apparent and the identification of the null frequency was achieved in Figure 6(c) and (d). With the sensing fiber length increases from 3.5 to 9.5 km, the difference between the two null spectrum curves is obvious. It is clear that the polarization fading problem plays the negative effect on the positioning performance of distributed fiber optic vibration sensor.
In Figure 6(c), the first null frequency point is easy to be captured. While, in Figure 6(d), the null spectrum exhibits a large amount of noise and clutter when positioning, the null frequency curve is rough and irregular, and it is difficult to find the accurate null frequency point. Therefore, the positioning error of the system is unstable. In Figure 6(c), the first null frequency fs is 14.37 kHz, the leaky distance from FRM (L2 = c/(4nfs)) is 3579.7 m, the leakage positioning error is 79.7 m, and relative error is about 2.3%. In Figure 6(d), there exist many spiky interference points around null frequency trough (marked by circle). Although the null frequency spectrum downtrend is obvious, the identification of the first null frequency is not easy. The measured first null frequency point fs is 5.714 kHz, and the calculated leakage point L2 is 9007.2 m. The leakage positioning absolute error is 492.8 m and localization relative error is about 5.2%.
Detection system sensitivity
The detection system sensitivity describes the frequency variation with range increment using The relation between sensitivity and leakage location.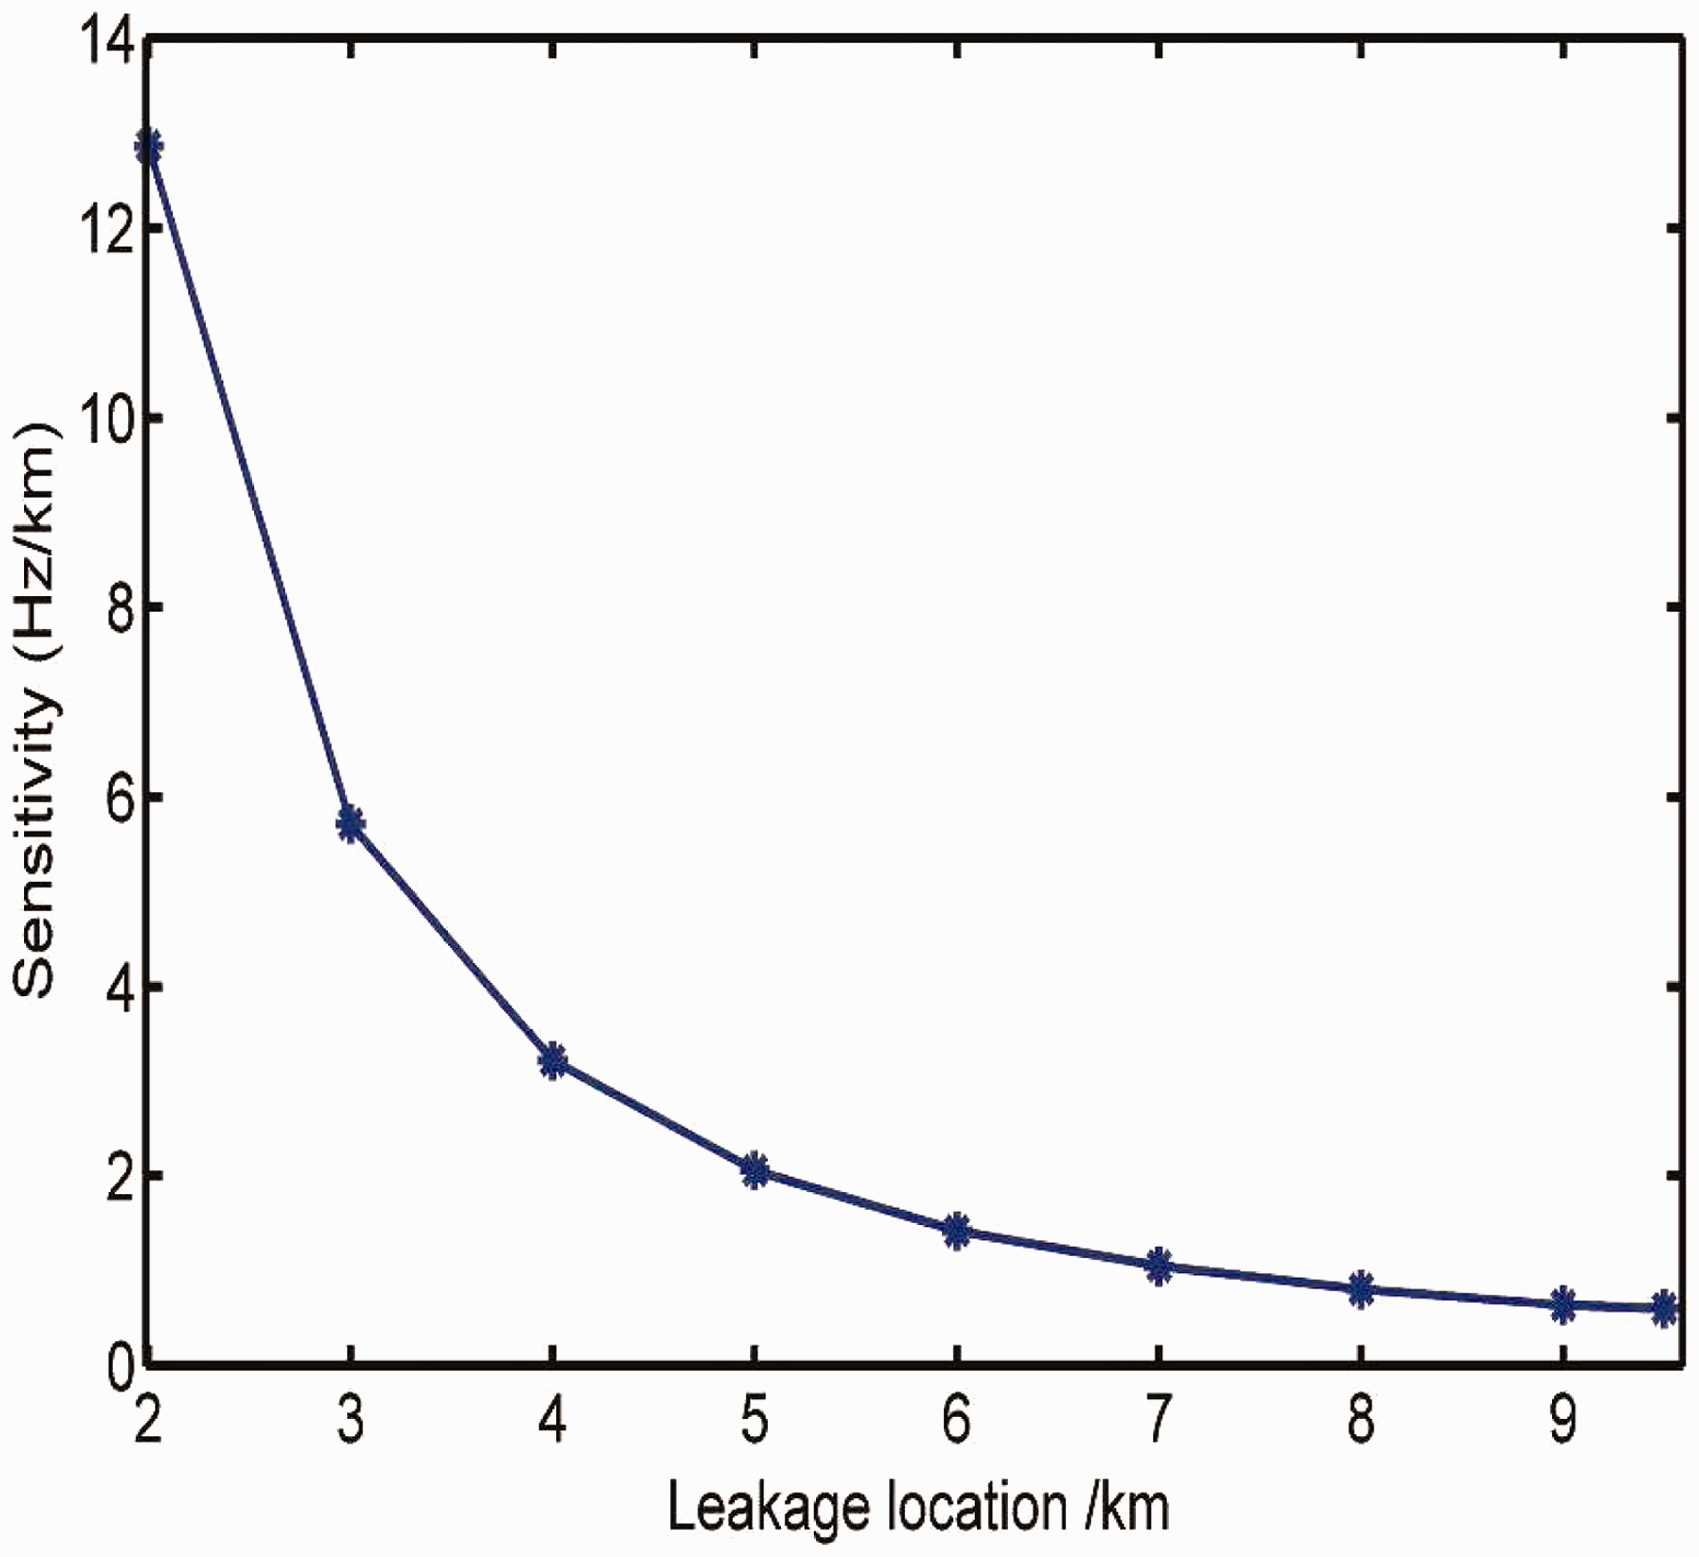
Conclusions
In conclusion, a sensitive fiber optic vibration sensor based on mixed interferometers for urban gas pipeline leak detection is discussed. Leakage detection experiments are performed to simulate actual urban gas pipeline leakage situation. To quantitatively analyze the polarization fading, the system polarization fading transmission model is built based on Jones matrix. Comparing the theoretical nonpolarization model with actual polarization model, we measure interference output intensity under pipeline with leakage case and without leakage case through high resolution spectrum analyzer.
The distributed fiber optic vibration sensor system allows a continuous monitoring and management of urban PE-3 coating pipeline leakage. But, in field work, the null frequency position location faces challenge with the optic fiber length increment. The interference light power spectrum is interfered by serious peak pulses around trough and crest in spectrum analyzer. When the span of fiber optic sensing length is from 1.5 to 9.5 km, the spectral intensity in 1500 nm center wavelength reduces from −16 to −56 dB. Furthermore, the average relative error of the experimental leakage point localization deteriorates from 2.3 to 5.3%.
Footnotes
Acknowledgments
Also I wish to thank Dr Thomas Schumacher for his valuable suggestions.
Declaration of conflicting interests
The author(s) declared no potential conflicts of interest with respect to the research, authorship, and/or publication of this article
Funding
The author(s) disclosed receipt of the following financial support for the research, authorship, and/or publication of this article: This work was supported by National Natural Science Foundation of China under grant 51374188 and Zhejiang Provincial Natural Science Foundation of China under grant LR13E040001.