
Abstract
Introduction
As the number of people aging increases, 1 so does the importance of early and accurate identification of age-related comorbidities such as osteoporosis and fragility fractures. A key limitation for studying fragility fractures is their very low incidence. Our prior research suggests an annual rate of occurrence of any osteoporotic fracture (wrist, hip, vertebral, upper arm) of approximately 1%. 2 Large electronic health record (EHR)-based cohorts, such as the Veterans Aging Cohort Study-HIV (VACS-HIV), 3 and the VACS-National Cohort, are useful when exploring these outcomes as they provide adequate power in the context of a longitudinal study. Nonetheless, most EHR-based cohorts are unable to exploit bone mineral density (BMD) as a predictor for fragility fractures as it is typically absent from structured data fields. Studies have dealt with the challenge of identifying BMD in different ways. Previous approaches have included use of administrative data (e.g., presence of diagnostic codes for osteoporosis or osteopenia), personal interviews or questionnaires, manual chart review, and prospective recruitment.4–9 As might be expected, these labor-intensive approaches have been restricted to small studies. A more efficient approach that lends itself to application of large samples was presented by LaFleur and colleagues10,11 who developed a natural language processing (NLP) pipeline to extract measures of BMD from radiology reports and clinical notes. The accuracy of their algorithm for identifying standardized measures of BMD (T-scores) was 82.8%.
Objective
We proposed to develop “BoneScore,” an NLP tool to extract femoral neck T-scores of patients who undergo dual-energy X-ray absorptiometry (DXA), that we expect to demonstrate better performance than the algorithm developed by LaFleur and colleagues.10,11 The femoral neck is the narrow section of the femur that connects the femoral shaft with the femoral head. Because femoral neck BMD is highly predictive of hip fractures, it represents a specific area of clinical interest. We will limit our analysis to T-scores, which are standardized measures of femoral neck BMD that can be directly entered in the Fracture Risk Assessment Tool (FRAX) to identify individuals at risk for fragility fractures.12,13 T-scores are a comparison of the patient’s bone density with that of healthy, young individuals of the same sex. A T-score of between −1 and −2.5 is diagnostic of osteopenia (reduced bone mass); a T-score of −2.5 or lower is diagnostic of osteoporosis (severely reduced bone mass). In addition to validating the accuracy of our tool, as an illustration of its utility, we will also characterize the distribution of T-scores extracted from a separate, temporally distinct sample of Veterans living with HIV who are clinically at risk for low BMD. Lastly, we will demonstrate that the T-scores extracted from this sample display associations that reflect those of well-established risk factors including age, history of fragility fracture, body mass index (BMI), female sex, and non-white race.
Materials and methods
Amongst the VACS-National Cohort of 13 million Veterans (917,596 women) followed from 2000 to 2020, 695,645 Veterans (including 159,454 women) had DXA imaging, comprising a total of 1,387,479 DXA reports. To ensure that we covered a large variety of the linguistic expressions and patterns documented by radiologists across the VA, we randomly selected 1000 DXA scan reports spanning the years 2015 to 2020. DXA reports typically include extensive text, most of which is unrelated to T-scores. Accordingly, we focused on snippets of text centered around a key term, which may present multiple times in a report. This means that multiple snippets may be extracted from a single DXA report. We selected all snippets from the 1000 DXA scan reports, resulting in 1089 snippets that were partitioned into training and test samples. The training sample contained 889 snippets and the testing sample consisted of the remaining 200 snippets (Figure 1). Development of training and test sets for BoneScan.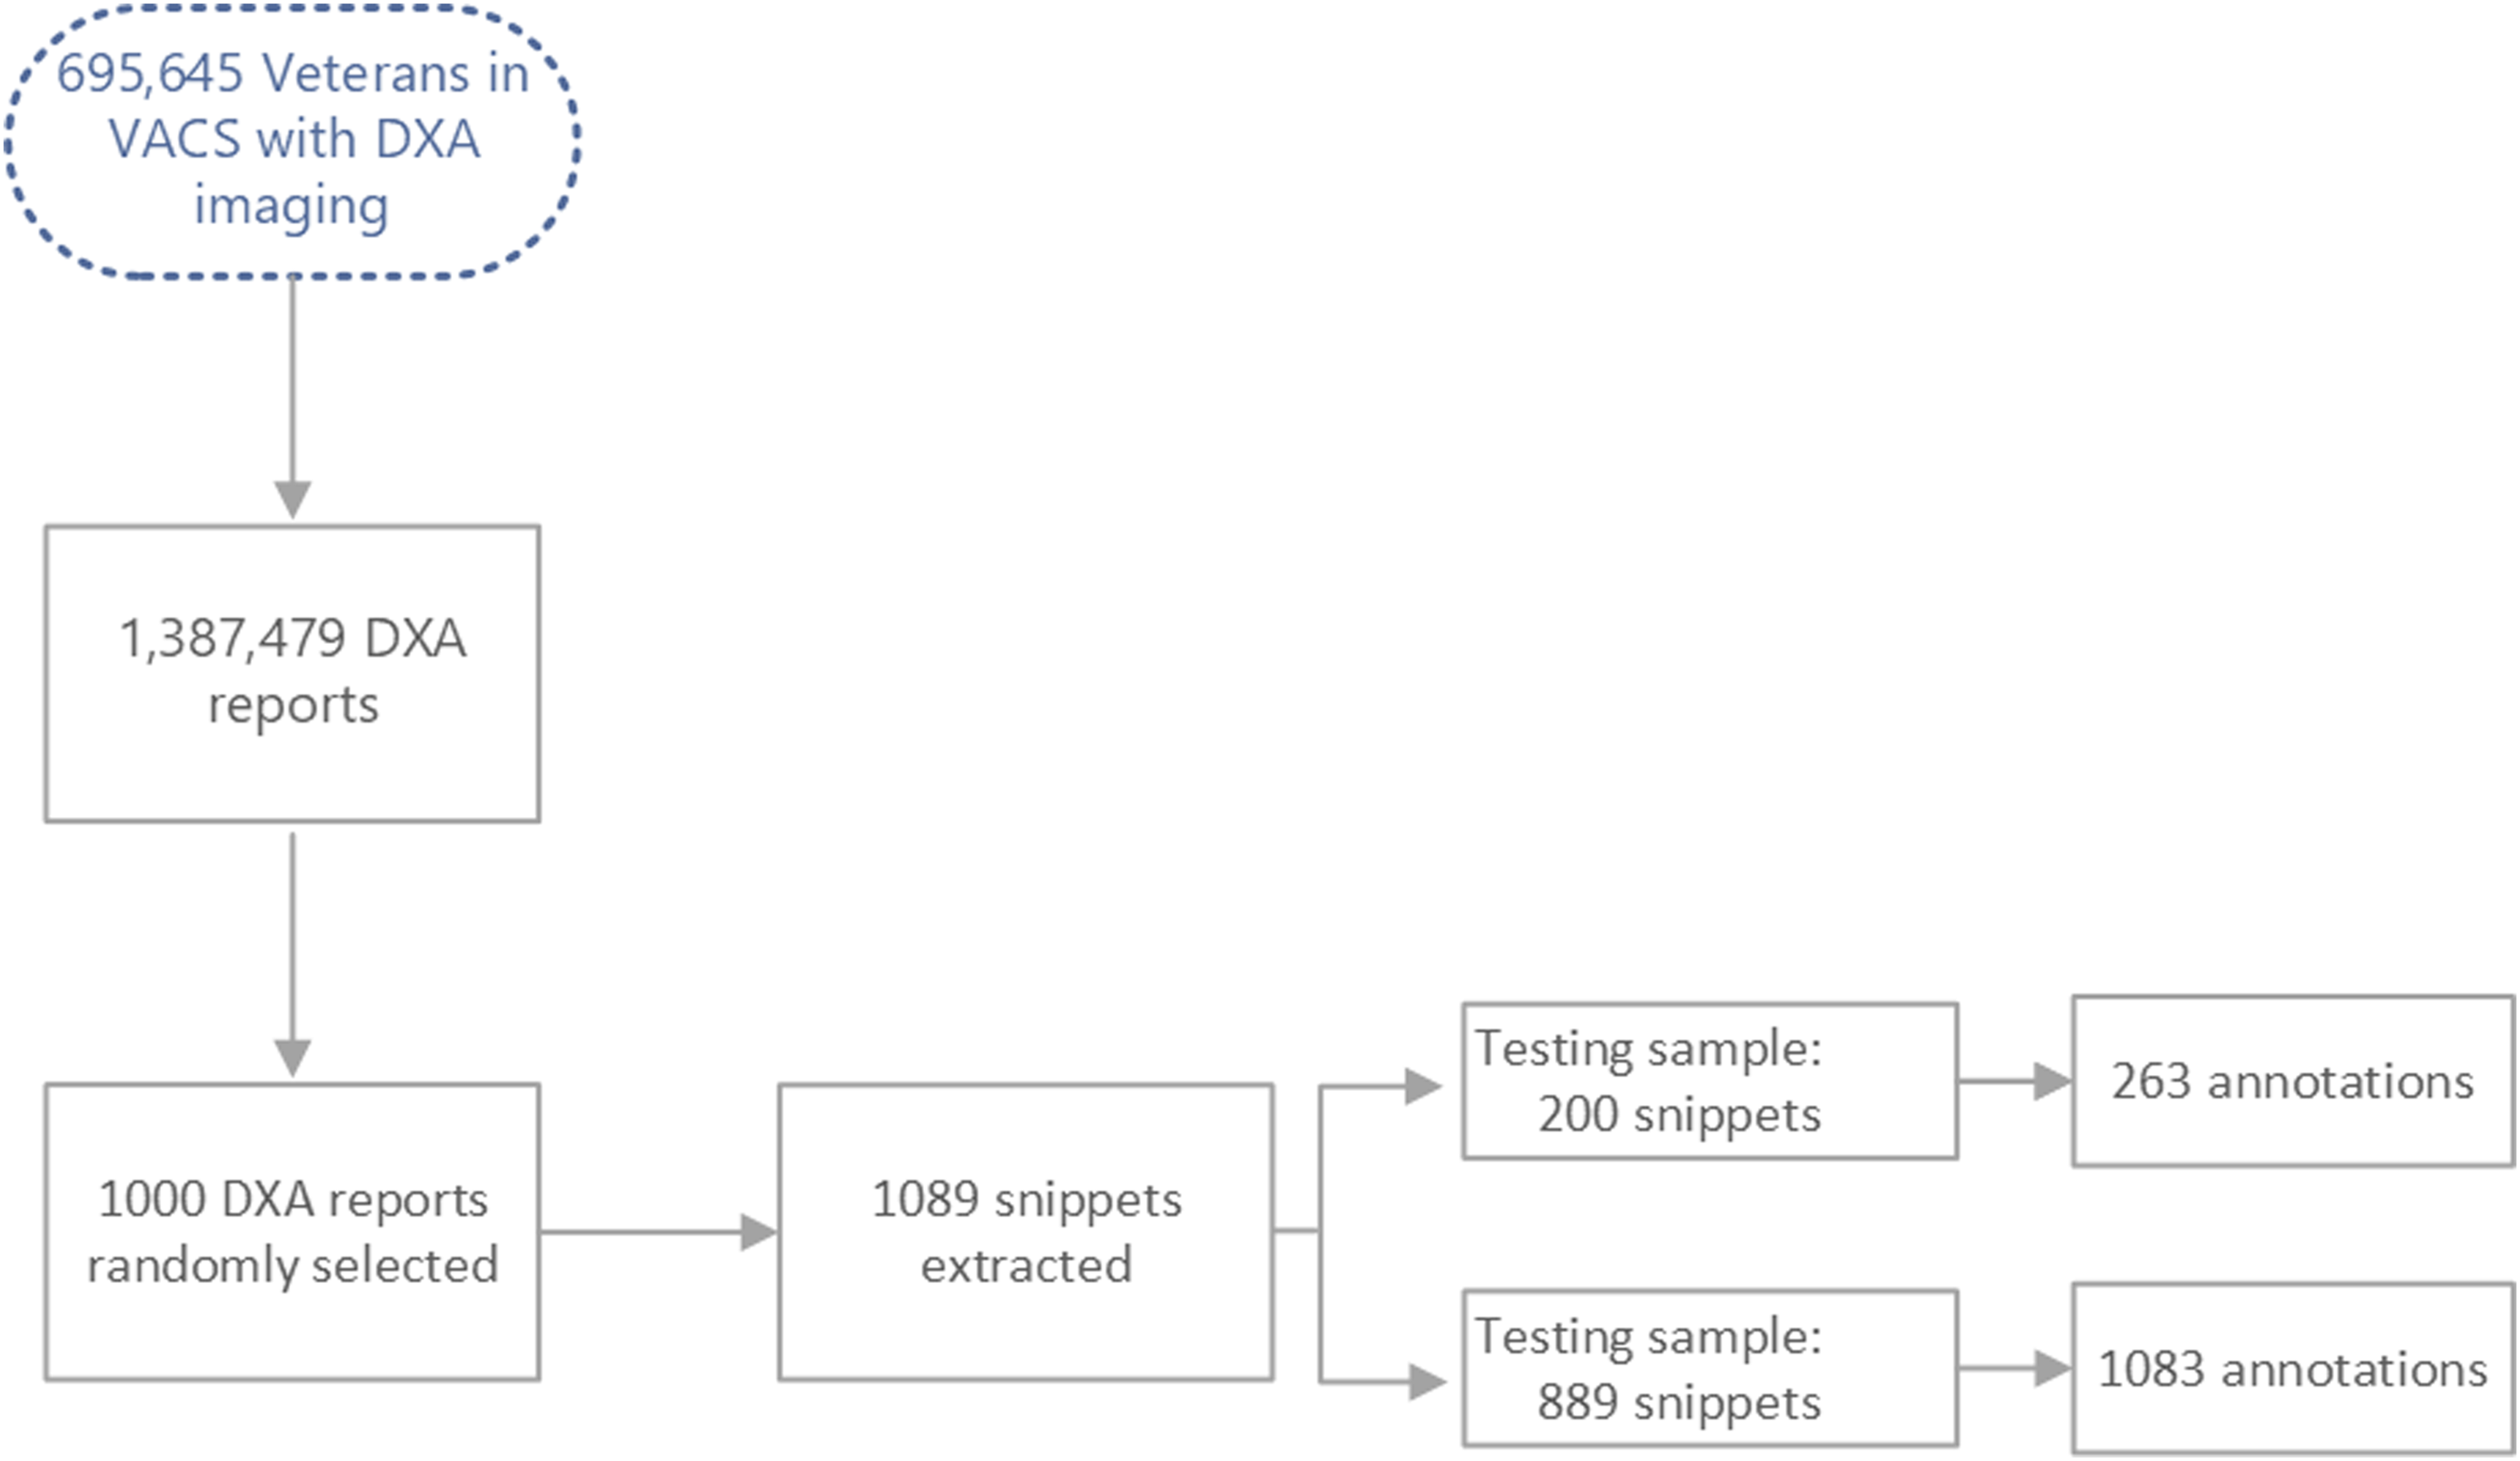
Extraction of snippets
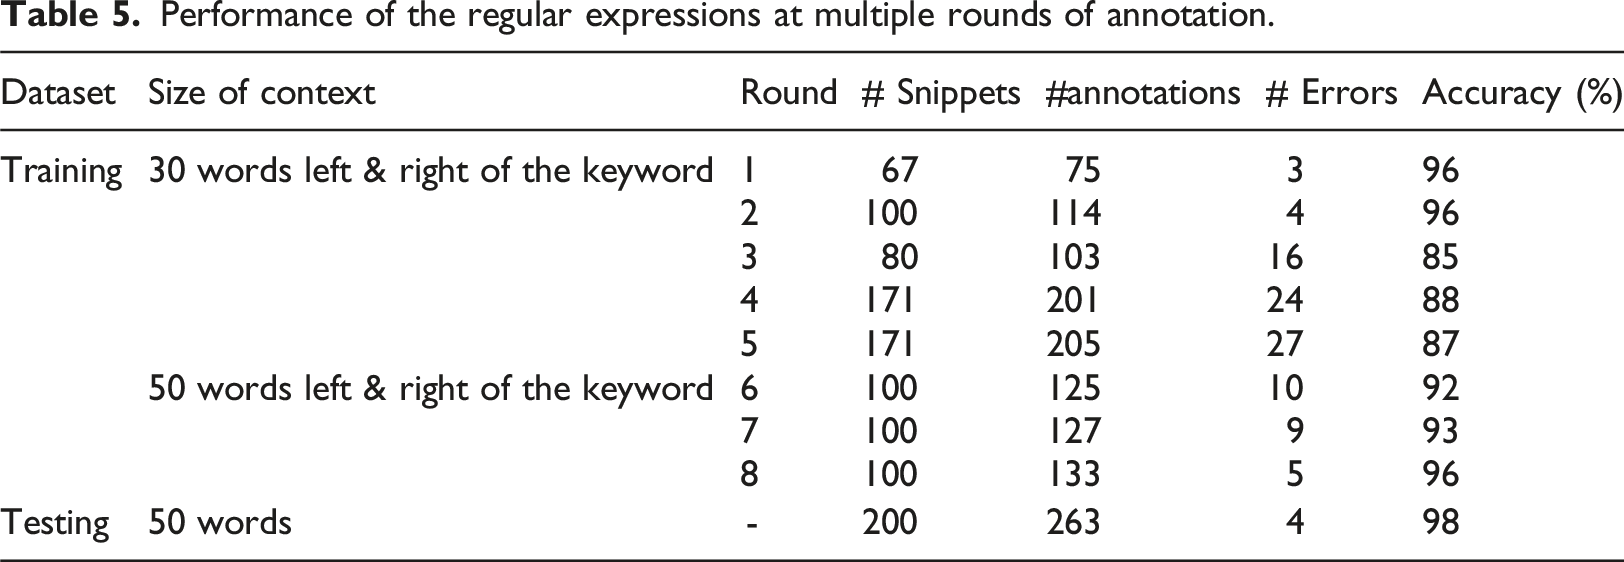
A DXA report can have multiple snippets corresponding to T-score values taken from measurements of BMD from both the “Left” and the “Right” femoral necks or from the mean of the two. For this reason, multiple snippets were extracted from each patient’s DXA report. The T-score value usually appears in the context of the term “femoral neck,” so we used the word “femoral” as the search keyword. This approach examined the context of an initial window size of 30 words on each side of the keyword “femoral.” We then expanded the window size to 50 words on each side and achieved more accurate results.
Manual annotation
Examples of how T-scores appeared in the snippets.
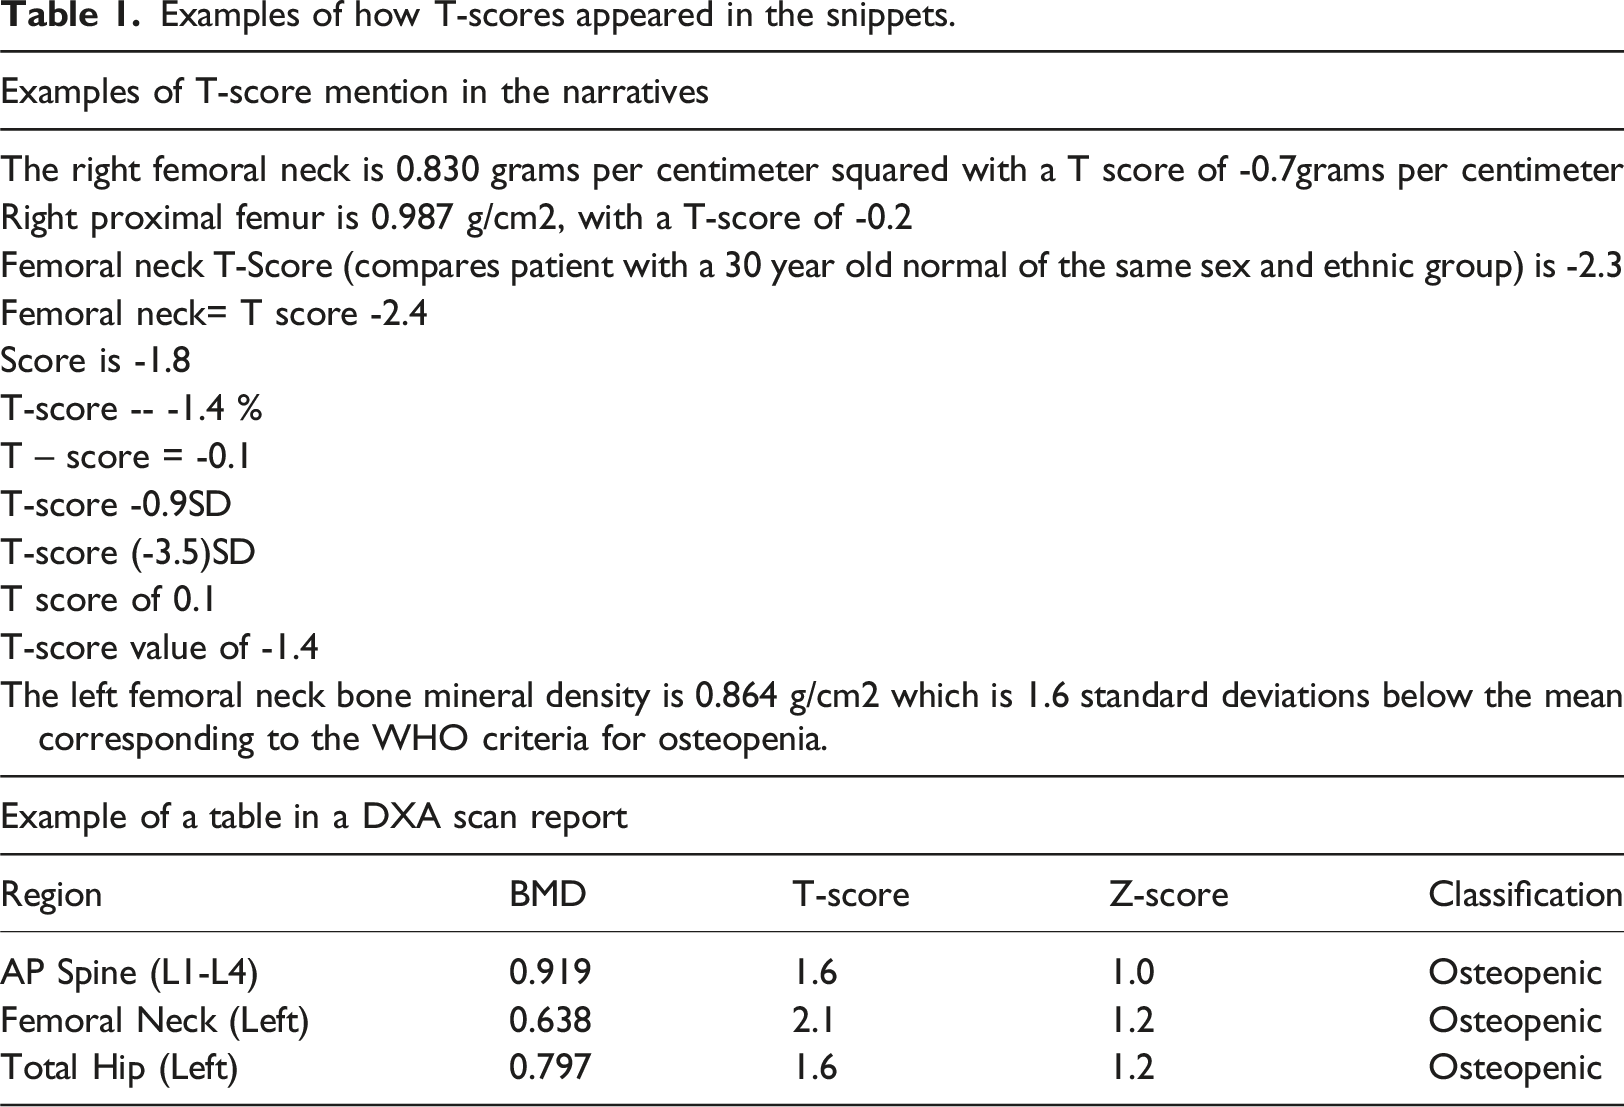
To be as thorough as possible in the development of our NLP approach, our clinical expert performed multiple rounds of manual annotation to ensure a high degree of confidence that we considered all possible patterns of T-score information as they manifested within the snippets. The DXA reports were written by radiologists from across the VA, resulting in significant variations in the way BMD information was presented including differences in formatting, details, and metrics included. We therefore selected multiple samples from the training data to capture the full variation of documentation included in the reports.
BoneScore: A rule-based NLP algorithm
As discussed previously, the T-score values from DXA scans were reported in two possible formats: text or data table. In both formats, the text around the T-score values demonstrated heterogenous linguistic patterns. To extract T-scores from the snippets of text in an efficient and effective manner, we developed a rule-based algorithm and applied it to the reports. We annotated 1089 snippets with T-scores (total of 1346 annotations) and developed two sets of regular expressions to extract them from the particular formats in which they occurred. Specifically, we developed one set of regular expressions that targeted the relevant patterns within snippets of text and a second set of expressions that retrieved the T-score values from within data tables.
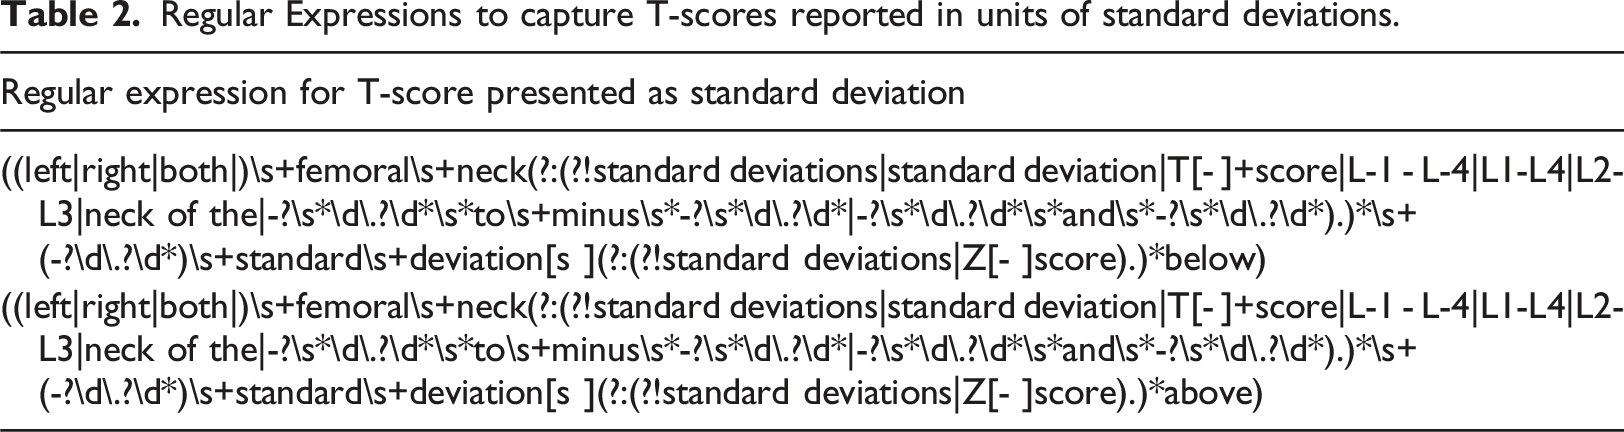
Set of text regular expressions
Regular Expressions to capture T-scores reported in units of standard deviations.
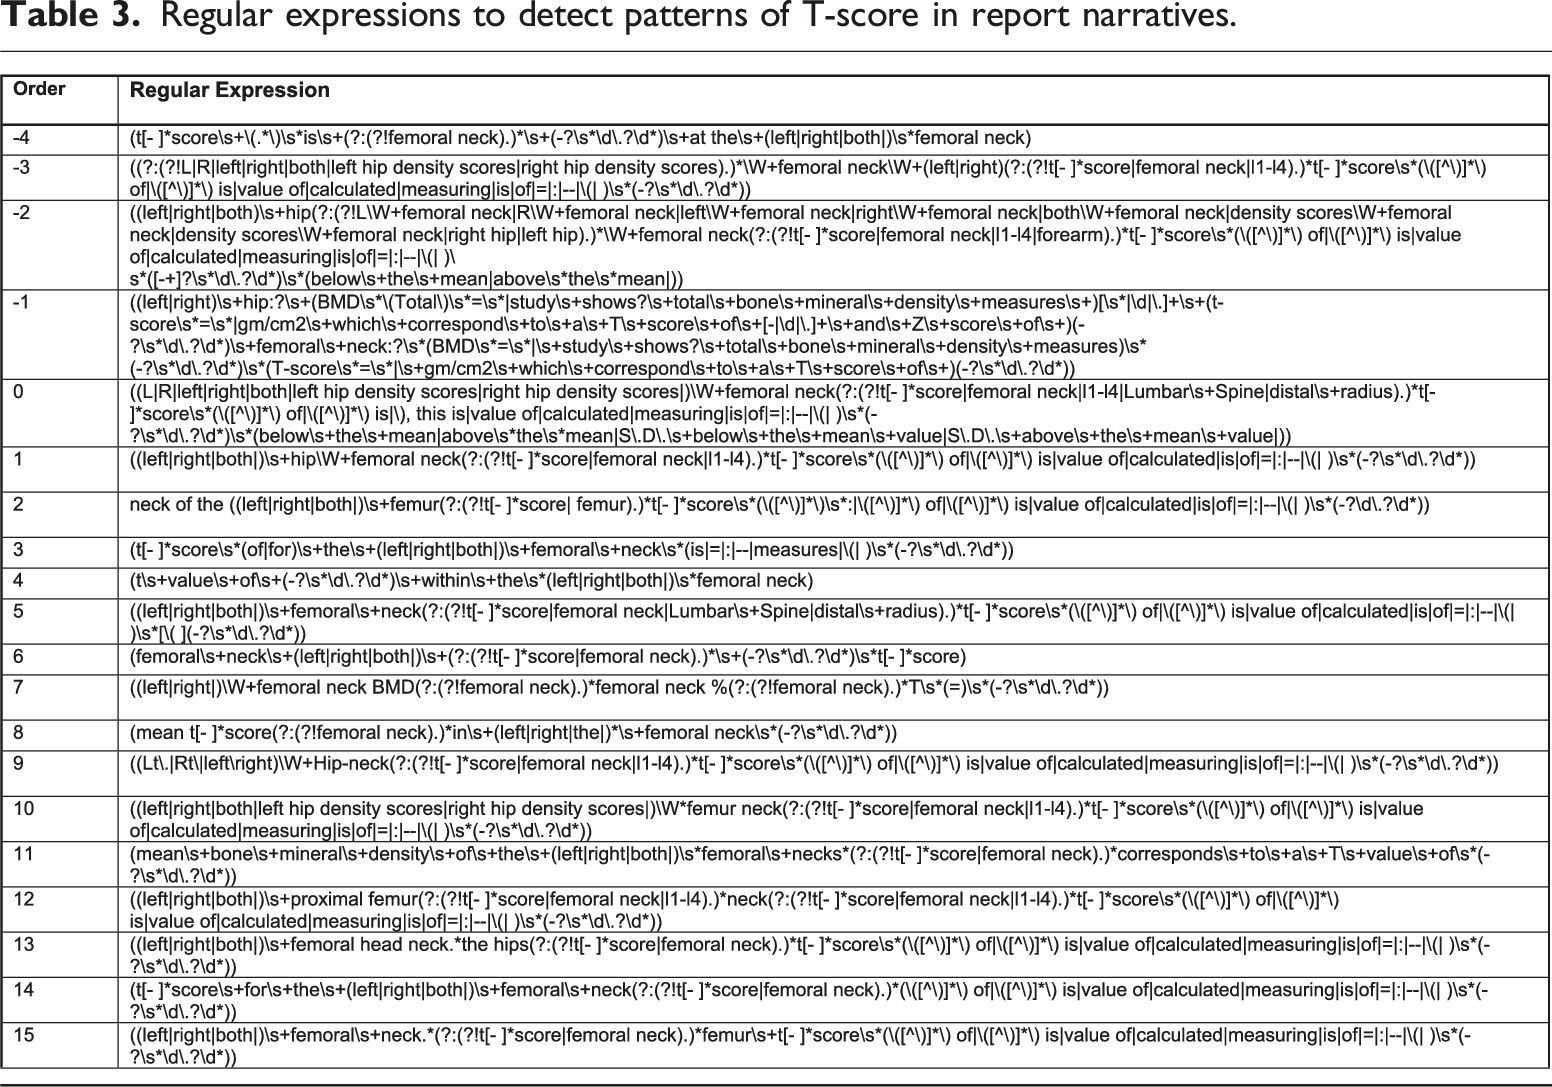
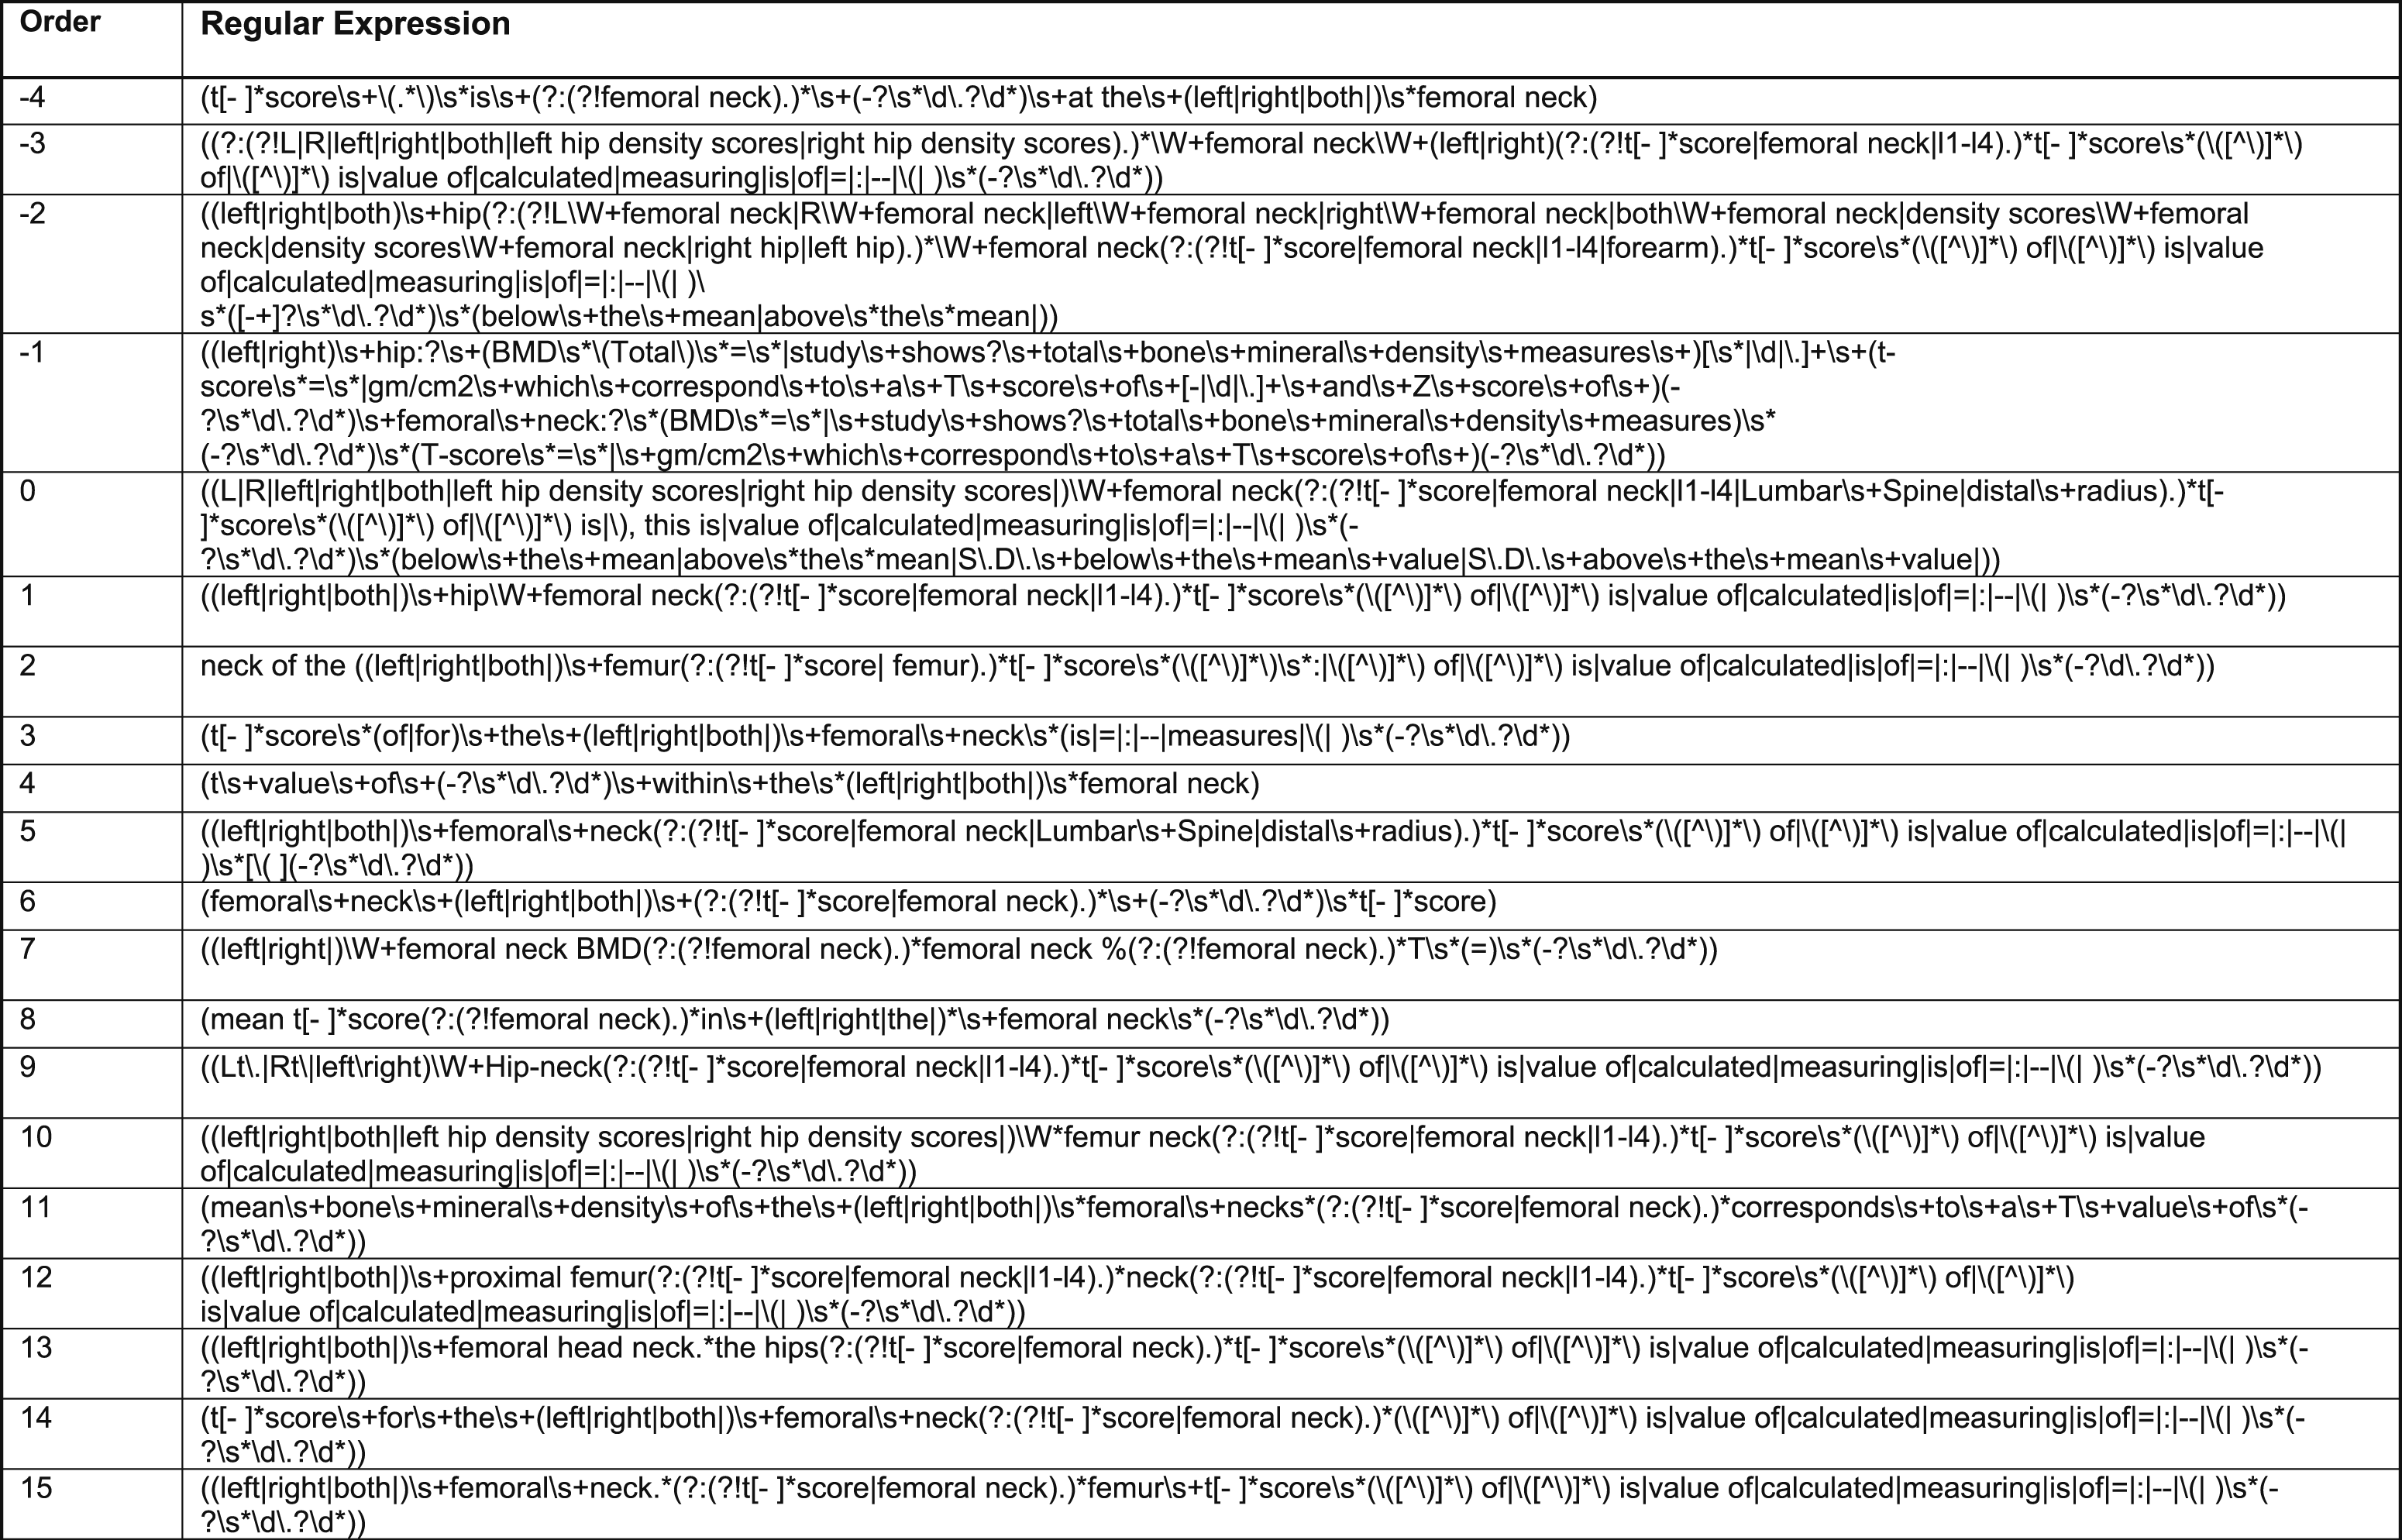
Regular expressions to detect patterns of T-score in report narratives.
Set of table regular expressions
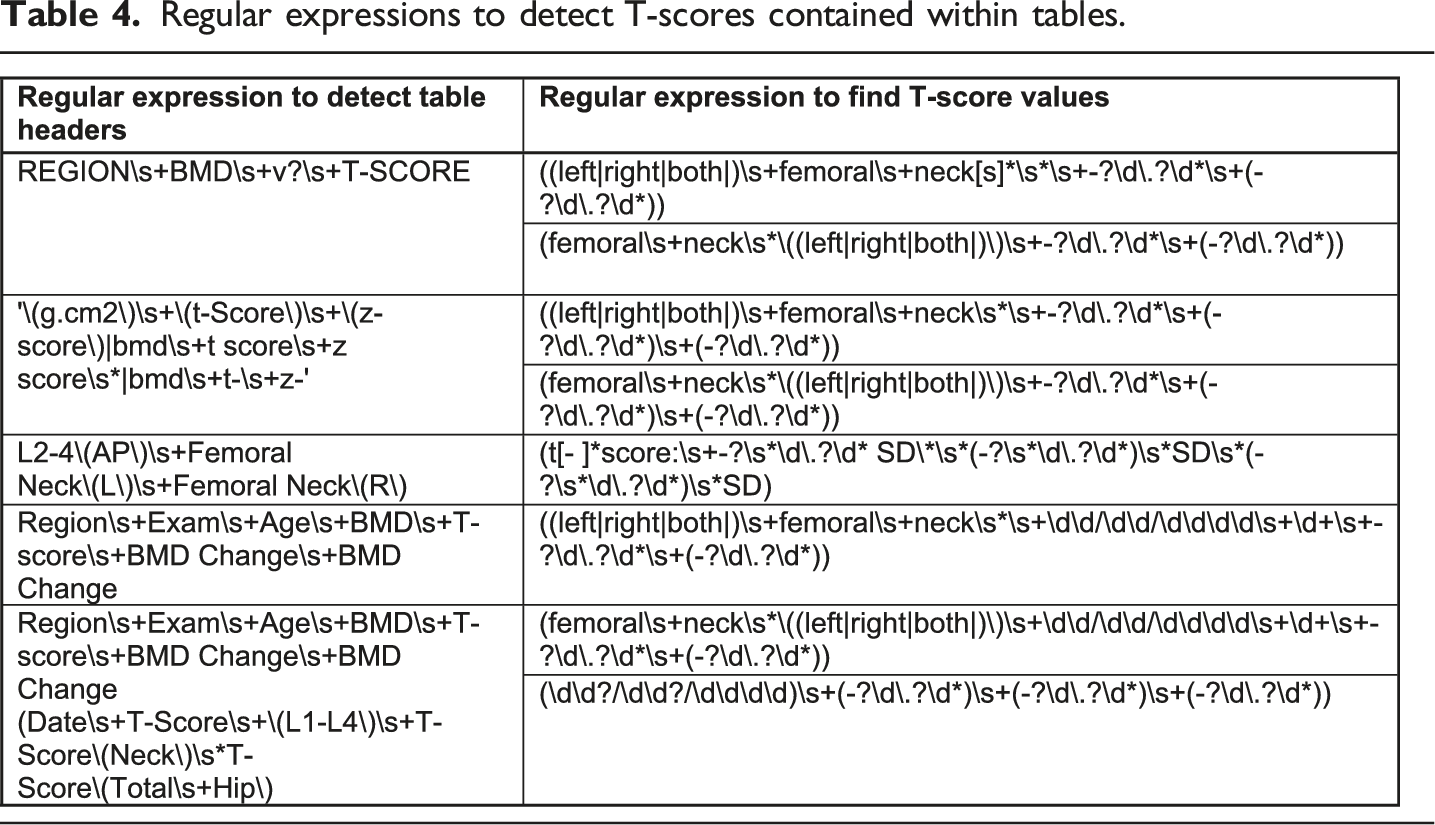
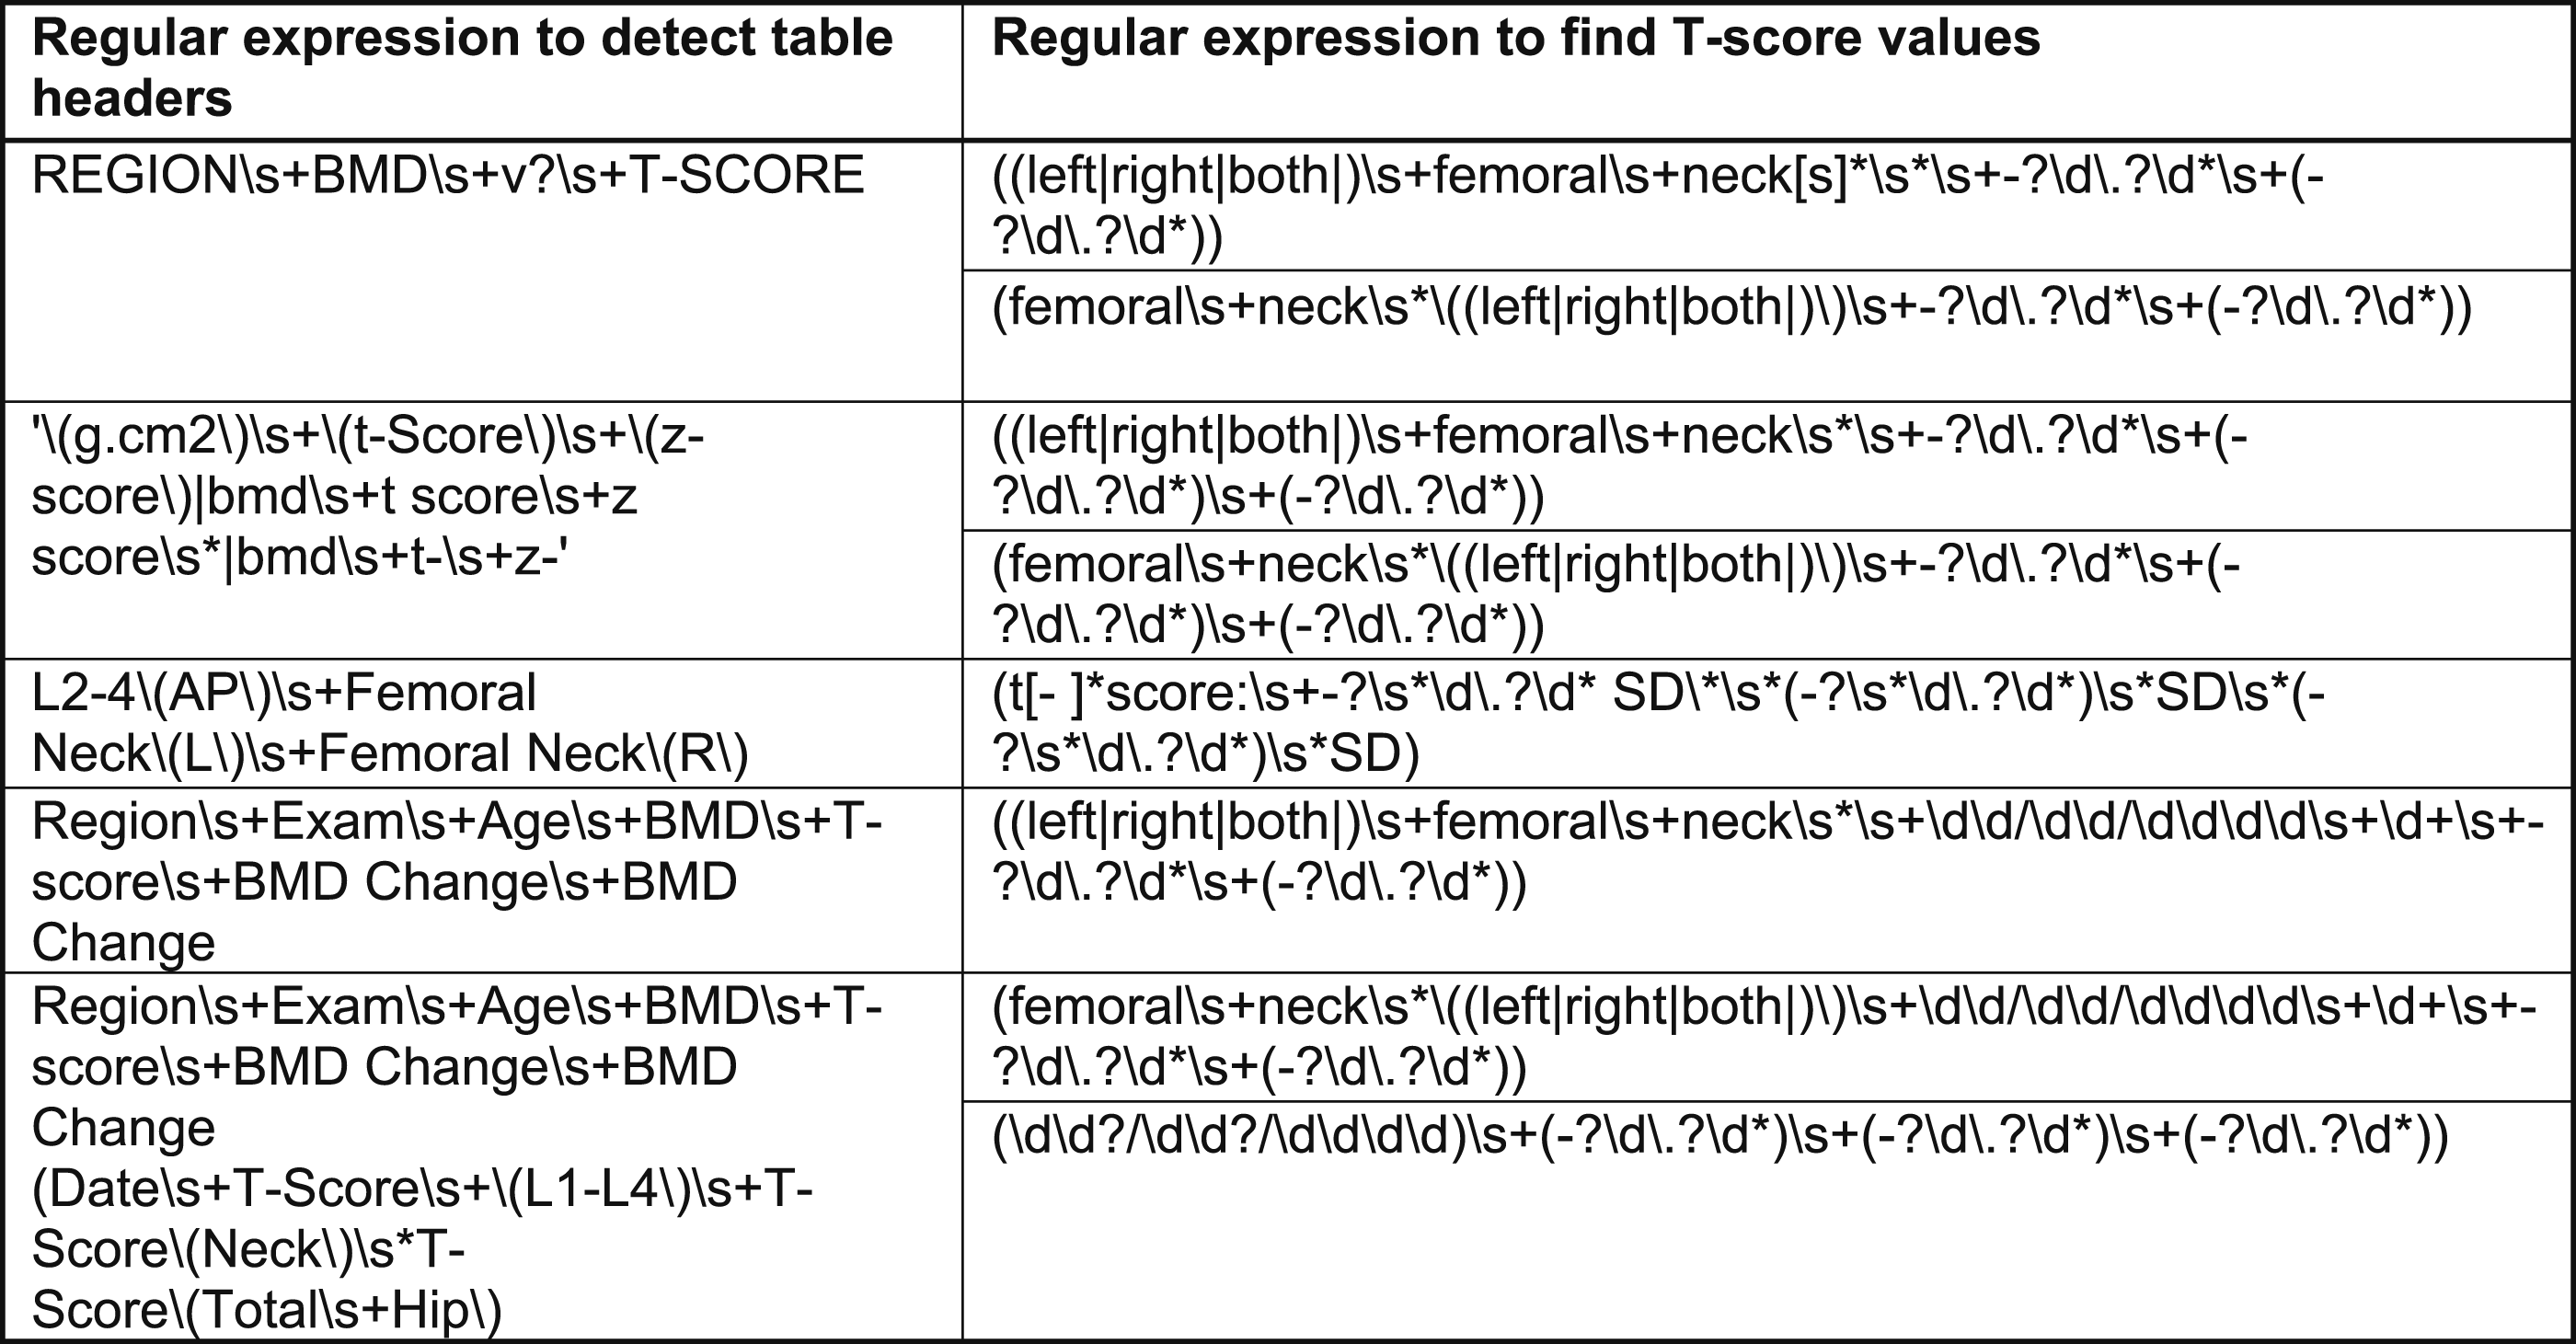
Regular expressions to detect T-scores contained within tables.
While experimenting, we first applied the table regular expressions followed by the text regular expressions. We used this approach because the text regular expressions were more complex than the table regular expressions, and therefore we were more likely to encounter mismatches. By applying the table regular expressions first, we were able to reduce the number of mismatches. We found that after each round, we had to re-apply the updated regular expression list to the snippets of text to ensure that we captured all new patterns.
Evaluation
We used the snippets in the training set to develop the NLP method and to generate the lists of regular expressions for both text and tables. Once satisfied with the overall performance, we tested the NLP approach by comparing the T-scores identified by our method against instances that were manually identified. To evaluate these comparisons, we computed the following measures:
Accuracy: The proportion of instances wherein the BoneScan approach correctly identified T-scores out of the total of all annotations that had been manually confirmed as containing T-score information.
To check our progress, we computed accuracy during all rounds of annotation and would subsequently decide whether more patterns needed to be identified and whether the NLP rules needed to be adjusted. Once satisfied with the performance, we applied our method to the test data and reported the results.
Validating BoneScore on a second cohort
To demonstrate whether the T-scores obtained by BoneScore displayed clinical face validity, we further analyzed them in a second cohort. This cohort consisted of Veterans with HIV who were 50 years of age or older who were at elevated risk of having decreased BMD. We took those who had undergone a DXA scan in either 2008 or 2009 which resulted in a sample of 372 persons. As this was a sample where many were younger (mean age 62 years) than the age at which routine screening would be expected (65 years for women and 70 years for men 14 ), we assumed that these were patients who had risk factors for low BMD and therefore had a positive likelihood of experiencing a fracture or of having low BMD. We applied BoneScore to this cohort and extracted the T-scores for each person. We subsequently used multivariable linear regression to model the T-scores.
Results
Performance of the regular expressions at multiple rounds of annotation.
Demonstration of clinical validity of BoneScore
We first plotted a histogram of the T-scores that were extracted from the second cohort. The histogram demonstrated a symmetrically unimodal distribution that comprised strong evidence for an assumption of normality (Figure 2), with the mean of −1.5 falling squarely within the range of T-scores for persons with osteopenia.
15
Distribution of femoral neck T-scores.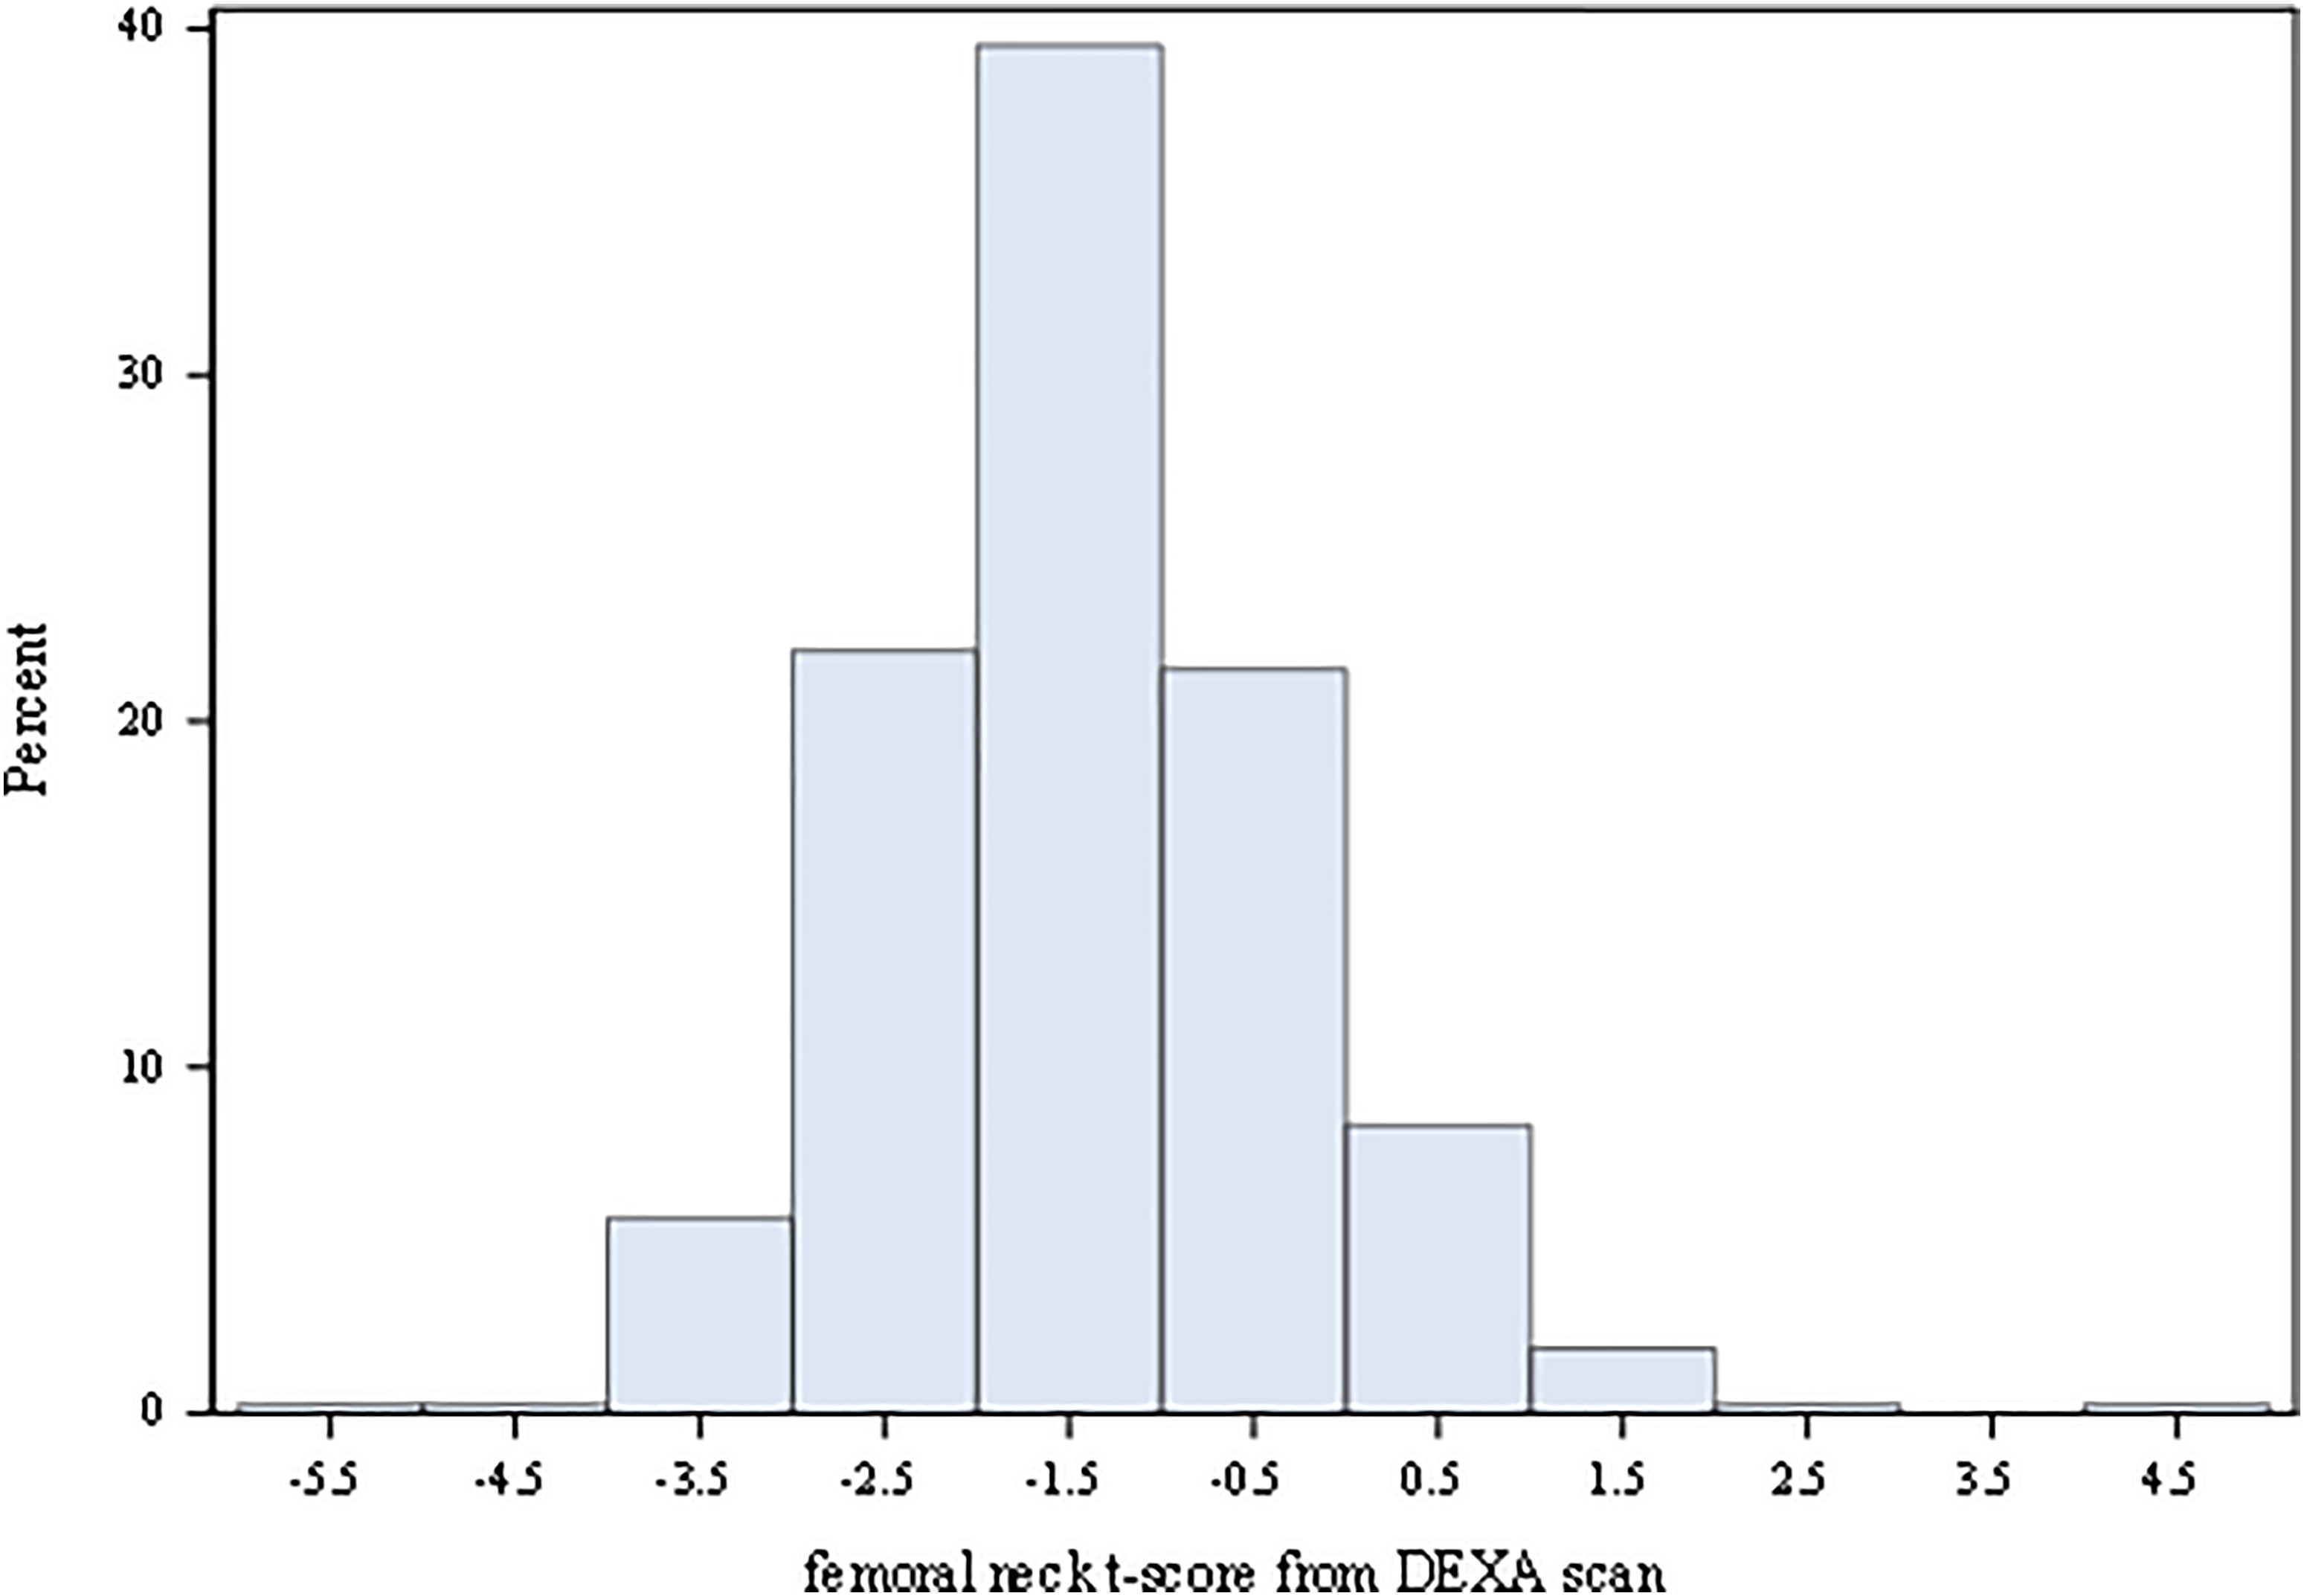
Explanatory factors of variability in T-scores.
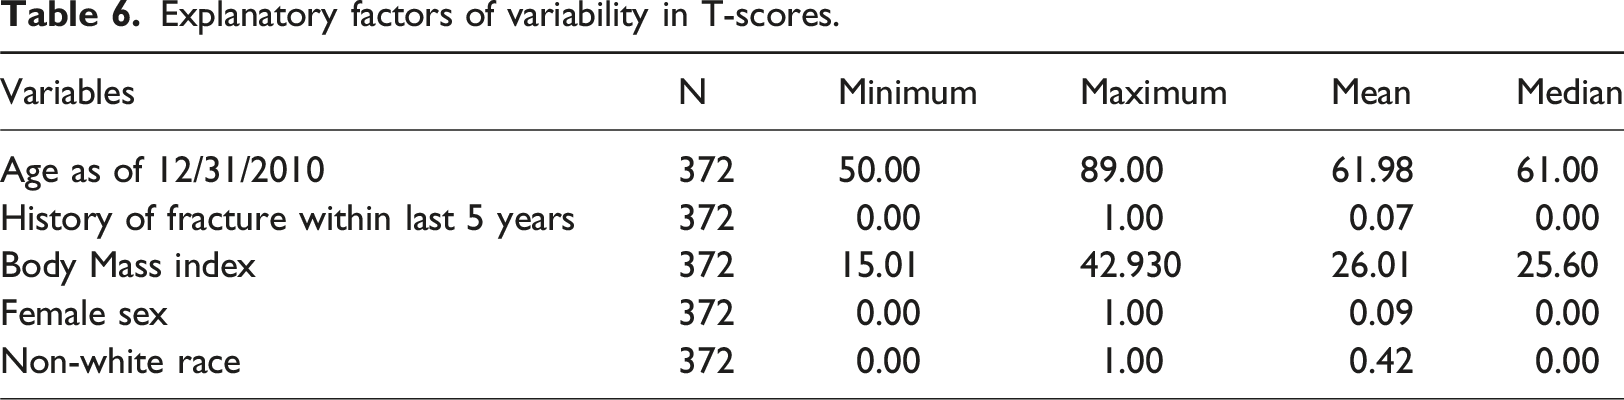
These values attested to the relative youth of this cohort (mean age of 62 years), which was made up almost entirely of men (9% females), was slightly overweight (mean BMI of 26), and demonstrated a good balance of white and non-white races (42% non-white). The non-white group included participants who self-reported their race as one of the following: American Indian, Asian, Black, mixed race, other, or Pacific Islander. We note that because fragility fractures are a low incidence outcome, the proportion with history of fragility fracture in the prior 5 years was commensurately low (7%). Using multivariable linear regression, we modeled the T-scores on the five aforementioned factors (Figure 3). Age, history of prior fracture, BMI, and nonwhite race each exhibited significant associations with magnitudes and directions supported by the literature. Whereas female sex, owing to its wide confidence interval, was not significant, its negative point estimate was also corroborated by the literature. Age exhibited a small magnitude association of −0.02, meaning that for each successive year, the T-score decreased by a little more than two percent. Forest Plot of multivariable associations with T-scores.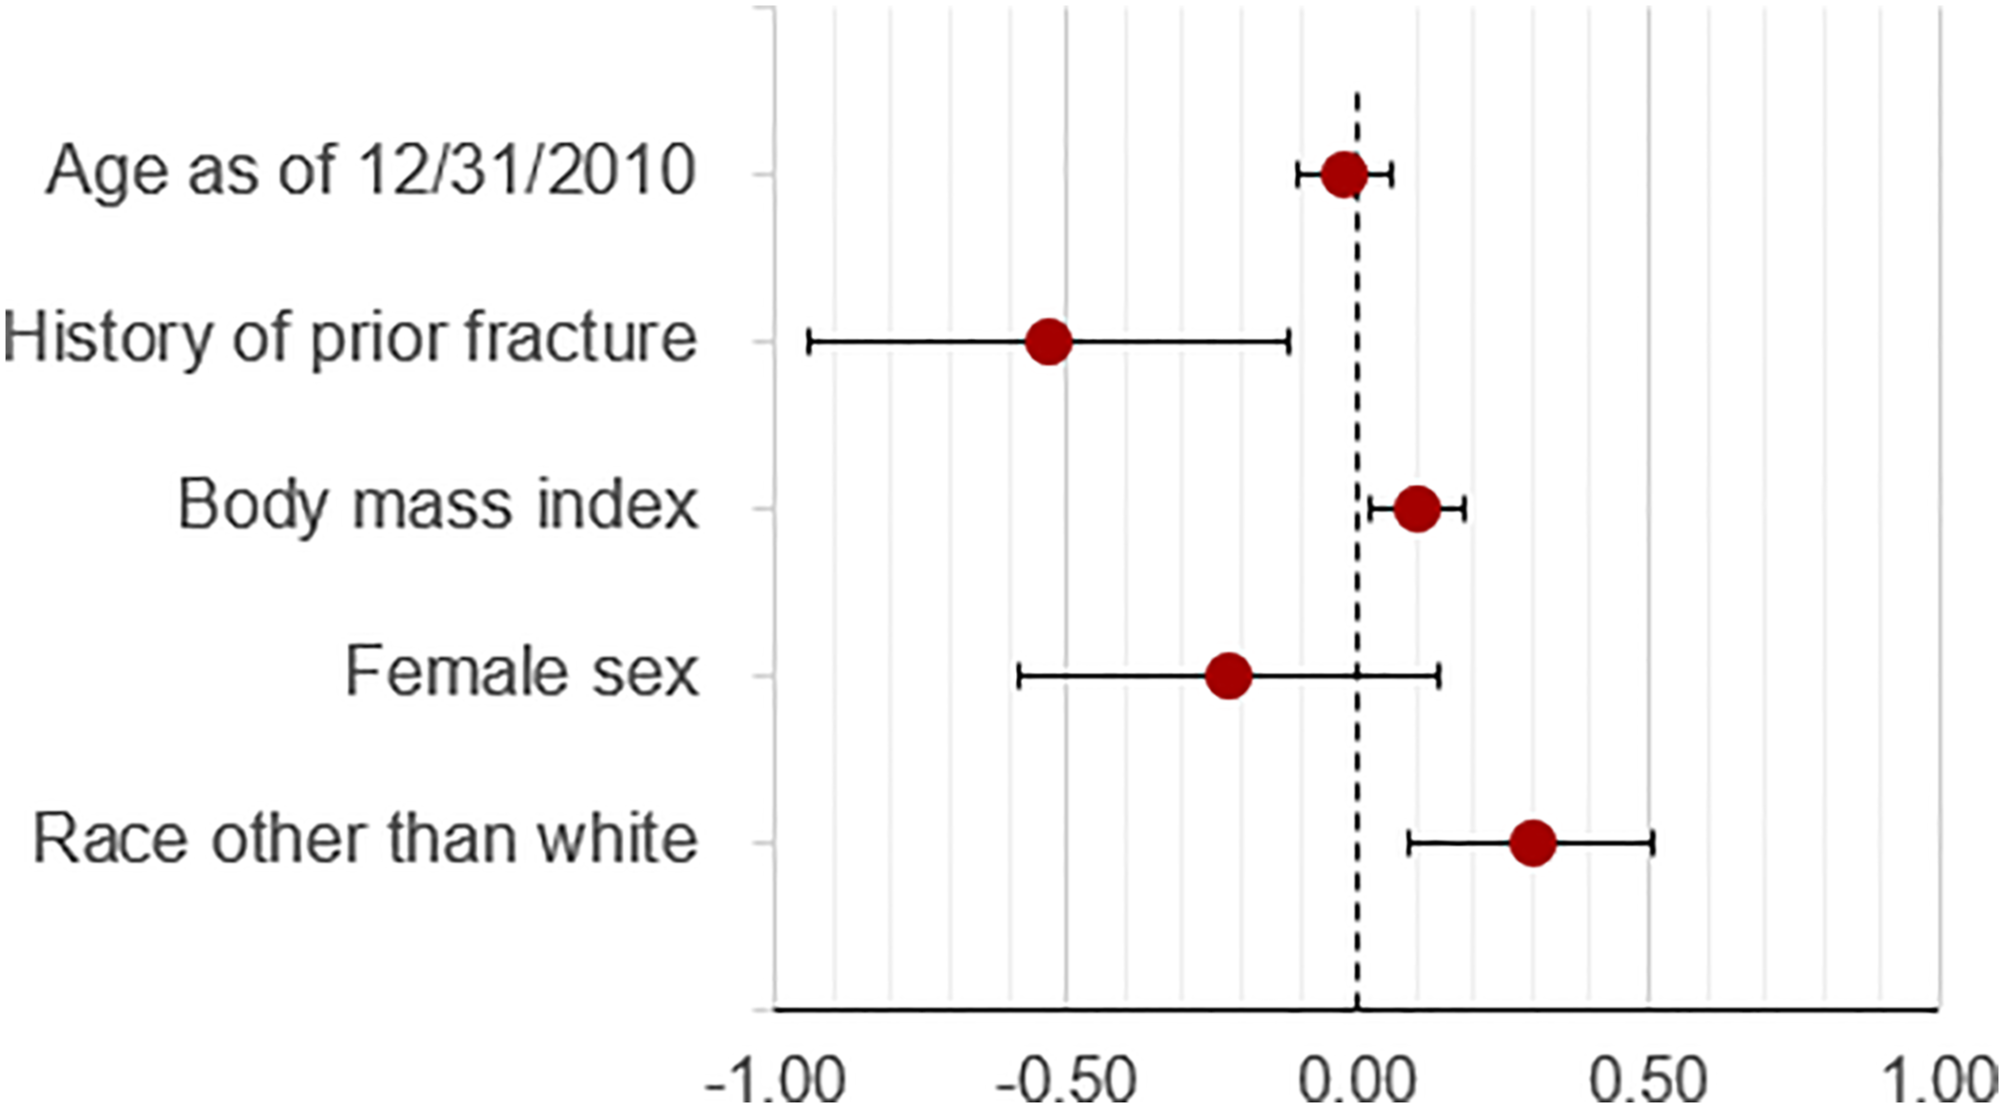
This is in accordance with the literature which has clearly established that aging is often associated with a slow, progressive decrease in BMD. 17 In contrast, BMI exhibits a larger point estimate of 0.10 that is positive, meaning that incremental gain in BMI is associated with higher BMD. This is also supported by the literature as heavier persons require greater bone mass to sustain their weight. 18 History of fragility fracture exhibits a large negative association of −0.53, which is also supported by the literature. 19 Lastly, the positive association of non-white race is also well supported in prior studies. 20 Although female sex did not achieve statistical significance, its demonstration of a negative point estimate (−0.22) is also consistent with prior literature. 21 It is likely that the very small proportion of women explains the lack of significance. In summary, while this illustration does not add new insight regarding the performance of BoneScan, the overall distribution of the extracted T-scores, in concert with their exhibition of well-established associations with five important factors, represent strong clinical validity of the T-scores extracted by BoneScore.
Discussion
We have developed BoneScore using regular expressions that identify femoral neck T-scores from DXA scan reports with high accuracy. LaFleur and colleagues developed an algorithm that had an accuracy of 82.8%, while the accuracy of BoneScore was 98%. Furthermore, we have demonstrated that the T-scores extracted from this sample align with values reported in the literature and display associations that reflect those of well-established risk factors for decreased bone mineral density and fragility fractures including age, history of fragility fracture, BMI, female sex, and non-white race.16,22 However, in EHR-based studies that are large enough to explore fragility fractures, identifying T-scores has been problematic as they are not included as structured data fields. Using BoneScore, we will be able to include femoral neck T-scores in our predictive models for fragility fracture.
In our analysis, we found that the width of the window around the snippet was an important factor in matching T-score patterns. Narrower snippet windows missed important word combinations that resulted in a failure to extract certain T-score values. Whereas wider snippet windows may be desirable, overly wide snippets can introduce noise and thereby generate false positives, especially when historical T-score values were reported in the snippet. Our first window width of 30 words on each side of the keyword femoral was insufficient and resulted in the omission of many T-scores and/ or truncation of their values. The results improved when we extended the width of the window to 40 words on each side of the keyword. The rationale for this change was that the T-score was expected to follow the mention of the word “femoral”. Nonetheless, because we noticed that 40-word widths on each side of the keyword were insufficient, we increased the widths to 50 words on each side of the keyword. This change yielded the best performance for our NLP tool.
This study has several important strengths and limitations. The strengths include a large sample size and annotation performed by clinical experts. The sample from our second cohort had a mean femoral neck T-score of −1.5, well within the range of osteopenia. This reflects that our sample of persons, who were younger than the commonly used screening ages of ≥65 and 70 for women and men, respectively, included a higher proportion of low T-scores than would be expected in the general population of older adults. Our choice of regular expressions as the base approach for building BoneScore was driven by the limited and well-defined vocabulary typically used to describe T-scores in DXA scan reports. However, despite our efforts to select a representative sample of DXA scan reports, it is possible that we incorrectly identified some T-scores or missed them altogether because of our tool not leveraging new or different linguistic expressions that were not encountered during the training of our algorithm. To its advantage, BoneScore can be easily scaled to accommodate large volumes of data which will facilitate future research and clinical studies.
Conclusion
In conclusion, we have developed a very accurate NLP tool-- BoneScore -- that can extract femoral neck T-scores from DXA scan reports. Our tool demonstrates significant improvement in accuracy relative to existing methods. BoneScore can be easily scaled to accommodate large volumes of data. The data produced by this tool will be useful in developing predictive models for fractures among PWH and other persons at risk for fragility fractures.
Footnotes
Acknowledgements
The authors would like to acknowledge all Veterans who contributed data to this analysis.
Author contributions
Samah Fodeh: Conceptualization, Methodology, Software, Writing - original draft, Investigation, Methodology, Writing - review & editing, Rixin Wang: Conceptualization, Formal analysis, Methodology, Writing - review & editing, Software, Resources. Terrence E. Murphy: Writing - original draft, Writing - review & editing, Visualization, Validation, Methodology. Farah Kidwai-Khan: Methodology, Writing - review & editing, Data curation. Linda Leo-Summers: Data curation, Graphics, Writing - review & editing. Baylah Tessier-Sherman: Data curation, Graphics, Writing - review & editing. Evelyn Hsieh: Funding acquisition, Conceptualization, Methodology, Software, Writing - original draft, Investigation, Methodology, Writing - review & editing, Julie A. Womack: Funding acquisition, Conceptualization, Methodology, Software, Writing - original draft, Investigation, Methodology, Writing - review & editing, Supervision.
Declaration of conflicting interests
The author(s) declared no potential conflicts of interest with respect to the research, authorship, and/or publication of this article.
Funding
The author(s) disclosed receipt of the following financial support for the research, authorship, and/or publication of this article: This work was supported by the This work was supported by the National Institute of Arthritis and Musculoskeletal and Skin Diseases (R01 AR078715), the Yale Claude D. Pepper Older Americans Independence Center (P30AG021342) and the National Center for Advancing Translational Sciences at the National Institutes of Health (UL1 TR002014).
Disclaimer
The views expressed in this article are those of the authors and do not necessarily reflect the position or policy of the Department of Veterans Affairs or the United States government.