
Abstract
A vast number of neurodegenerative disorders arise from neurotoxicity. In neurotoxicity, more than 250 RNA molecules are up and downregulated. The manuscript investigates the exposure of chlorpyrifos organophosphate pesticide (COP) effect on total RNA in murine brain tissue in 4 genotypes for in silico neurodegeneration development. The GSE58103 dataset from the Gene Expression Omnibus (GEO) database applies for data preprocessing, normalization, and quality control. Differential expression analysis (DEG) uses the limma package in R. Study compared expression profiles from murine fetal brain tissues across four genotypes: PON-1 knockout (KO), tgHuPON1Q192 (Q-tg), tgHuPON1R192 (R-tg), and wild-type (WT). We analyze 60 samples, 15 samples per genotype, to identify DEGs. The significance criteria are adjusted p-value <.05 and a |log2 fold change| > 1. The study identifies microRNA485 as the potential biomarker of COP toxicity using the GSE58103 dataset. Significant differences exist for microRNA485 between KO and WT groups by differential expression analysis. Moreover, graphical analysis shows sample relationships among genotype groups. MicroRNA485 represents a promising biomarker for developmental COP neurotoxicity by utilizing in silico analysis in scientific practice.
Keywords
Introduction
A potential biomarker of developmental neurotoxicity is total RNA (Ribonucleic Acid) consisting of varieties of RNA molecules ranging from messenger RNA (mRNA), ribosomal RNA (rRNA), transport RNA (tRNA), microRNA (miRNA), long noncoding RNA (lncRNA), and many others with diverse roles in the cell.1,2 Knowledge about total RNA influence in cell response unravels disease mechanisms and biomarker discovery by understanding the genes and pathways involved in initiation, progression, and therapy. 3 Total RNA is extracted from the cell samples by different methodologies like RNA extraction, reverse transcription, spectrophotometry, electrophoresis, PCR (Polymerase Chain Reaction), Sequencing, and gene expression analysis.4,5
Total RNA molecule population-based epidemiological cohort correlates outcome exposure in a large dataset with a genetic background. 6 The current manuscript integrated high-throughput RNA sequencing (RNA-Seq) and transcriptomic data to provide insight into potential disease mechanisms, identifying specific RNA. Study example aspects are enormous. This type of study includes large-scale data collection, diverse population samples, longitudinal data, integration of multi-omics, and lifestyle. Thousands of participants enable study statistics with health outcomes 7 . Information demographics, age, gender, ethnicity, and socioeconomic status leads to an appropriate understanding of data information and conclusions.8,9 Observing changes in RNA expression over time in participant follow-up studies enables correlating information to disease development, treatment, and changes in environmental exposure effect.8,9 Biological processes integrate omic data for better understanding.8,9 Patients’ lifestyles and exposure history enable an understanding of how diverse factors contribute to RNA expression levels and how disease risk incidence increases. 10 The Framingham Heart Study (FHS), the UK (United Kingdom) Biobank, The Rotterdam Study, and all US (United States) research programs present example study types.11–13 FHS has been active since 1948 and expanded in multi-omic data investigating cardiovascular disease. 11 The ongoing UK Biobank study involves more than 500.000 participants with genomic, proteomic, and clinical RNA Seq data enabling the discovery of conditions. 12 Transcriptomic RNA analysis from diverse tissues during aging and related disease enables gaining information on molecular mechanisms outlining cardiovascular, Alzheimer and Parkinson’s disease.13,14 United States study from one million participants includes RNA-seq data to understand biological, environmental, and behavioral factors affecting health as a part of the precision medicine initiative, apply to biomarker discovery, environment interaction, understanding disease mechanisms, and personalized medicine.13,14 RNA-seq biomarkers serve for prognosis. Disease mechanisms compare RNA sequencing profiles between healthy control and disease to identify dysregulated pathways and potential therapeutic targets associated with the immune system.15,16 Personalized medicine approaches can arise from individual expression profiles and therapy responses.17,18 Challenges and limitations represent data complexity, standardization, and ethical privacy concerns.17,18 There is a need for advanced bioinformatic tools for data analysis and interpretation, ensuring precise data collection and protecting participant privacy and ethical use of biological data, especially in studies with sensitive health data.17,18
Population-based cohort studies increase the significance of public health by utilizing longitudinal, multi-omic data and personalized medicine in health by total RNA biomarkers affected by environmental gene interaction in specific phenotypes. 10
Expression profiling studies of total RNA molecules reveal the regulation of genes in different conditions and time points of human samples. Some of the examples include TCGA (The Cancer Genome Atlas), FHS, Genotype Tissue Expression (GTEx), Encyclopedia of DNA elements (ENCODE), and the human cell atlas. 19 Molecular disease basics in various tumor tissue samples in thousands of patients undergo RNA-seq and differential analysis presented upregulated and downregulated genes, in comparison to healthy tissues and signatures, biomarkers diagnosis, prognosis, and treatment provide cancer intervention.20,21 Examples of the study include comprehensive distinctive molecular interaction in human breast cancer. 22 FHS study identified gene expression signatures and risk factors such as hypertension, cholesterol level, and obesity by discovering RNA markers where transcriptomic findings correlate to hypertension in the FHS involved in the immune response and inflammation in individuals with hypertension. 23 GTEx project understood the influence of tissues enabling risk. 24 ENCODE project mapped complex network enhancers, promoters, and unannotated transcription of comprehensive gene regulatory elements and their association profiles. 25 The Human cell atlas enabled comprehensive reference to all human cells based on their expression profile. An example is a single-cell transcriptomic study that enables mapping during human development.26,27
Functional research looked into how diseases operate, how cells respond to their surroundings, and how total RNA molecules contribute to cells.28–31 Research categorizes according to the kind of RNA present in the total RNA pool, such as snRNA, miRNA, and circRNA gene expression analyses.28–31 Using a knockdown MYC model system, the role of mRNA as the proto-oncogene MYC in various cancer and tumorogenesis tissues is under investigation for cell division and death.28,29 Reduced MYC mRNA also increased apoptosis and decreased cell proliferation, suggesting that MYC may be a promising therapeutic target for cancer treatment.28,29 Diamond Blackfan anemia (DBA) disease is correlated with defective rRNA processing and ribosome assembly, suggesting a possible target for therapy. 30 A particular tRNA influences the efficiency of protein translation in Parkinson’s disease. snRNA plays a role in spinal muscular atrophy (SMA). 31 miRNA molecules are present in neurotoxic condition pathogenesis by regulating gene expression and responding to environmental toxins. miRNA affects neuronal survival and apoptosis, where exposure to neurotoxins (heavy metals, pesticides) affects neuronal health and alters expression profiles.32–34 Brain, miR 155 mediates, and miR-34, miR-34a, miR-132, and miR-124 regulate stress responses and have a role in synaptic plasticity, while miR-21 has a protective effect in injury and stress, miR-34a influences cell cycle.35–38 Therapy with miRNA includes miRNA mimicking and inhibitors (antagomirs).35–38 Increased expression of HER/neu (ERBB2,Human Epidermal Growth Factor Receptor (2) mRNA correlates with aggressiveness of breast cancer, where trastuzumab can serve as target therapy. 39 Moreover, NPPA (atrial natriuretic peptide) mRNA level correlates to the severity of heart failure. 40 Overexpression of miR-21 leads to lung, breast, and colorectal cancer cell proliferation and survival, while miR-133a correlates to the severity of myocardial infarction.41,42 Poor prognosis and increased gastric cancer metastasis correlate to high expression of HOTAIR (HOX Transcript Antisense RNA) lnc RNA, while dysregulation of MALAT1 (Metastasis-Associated Lung Adenocarcinoma Transcript (1) correlates to Alzheimer’s disease severity.43–46 In glioma and other cancers, circRNA CDR1 (Cerebellar Degeneration-Related Protein (1) regulates miR-7 and serves as a biomarker for the diagnosis and prognosis of the disease.47,48 Changes in splicing oncogenes like U2 snRNA (U2 Small Nuclear RNA) serve as a potential biomarker for cancer disease detection, whereas tRNA fragments as an early biomarker correlate to insulin resistance and glucose metabolism in patients with diabetes 2.47,48 Utility and clinical implications of total RNA biomarkers for early diagnosis, prognosis and monitoring, treatment guidance, and testing exist in the literature.47,48 Effective treatment and a better outcome are guided by the detection of early progression (miR-21), prognosis (HOTAAIR), and therapy efficacy (trastuzumab), enabling noninvasive testing of total RNA molecules in samples like urine, blood, body fluids (miR-133a).41,49,50 Comprehensive, detailed, and functional analysis arise from high throughput sequencing undergoing validation studies in a larger independent cohort and integration into proteomic, genomic, and metabolomic studies to understand and improve biomarker accuracy in clinical settings. 51
Defectiveness caused by a toxic developing brain causing DNT (developmental neurotoxicity) leads to structural, functional, and behavioral non-homeostasis changes. 52 Total RNA molecules serve as a crucial biomarker for early detection and prevention. DNT causes alteration in gene expression of noncoding RNA. RNA-Seq, qPCR, and Microarray analysis confirm the negative effect of neurotoxic substances on miRNA, mRNA, and lnc RNA molecules in studies leading to neurodevelopmental diseases.53,54 AChE (Acetylcholinesterase), dopamine, glutamate pathways, epigenetic changes, and ACh receptors are affected after exposure to CPF, leading to neurodevelopmental diseases.55,56 Studies investigated the DNT on CPF. Animal studies investigated behavioral deficit, neuroanatomical, and molecular changes, whereas epidemiological and neuroimaging research exist in human studies. 57 Impaired memory-altering hippocampus and cortex in the postnatal period affect synaptic neuronal differentiation and neuroinflammation, influencing BDNF (Brain-Derived Neurotrophic Factor), GRIN2B (Glutamate Ionotropic Receptor NMDA Type Subunit 2B), mir-134, and miR-124.57,58 Regulatory agencies protect sensitive populations from CPF (Chlorpyrifos) in the US and Europe.59,60
In silico analysis has many advantages in biomarker studies (cost-effectiveness, data integration, prediction and prioritize, test hypothesis, accessibility, reproducibility, speed and efficiency, reducing ethical concerns, and integration enabling optimization iteration).61,62 Traditional laboratory experiments with expensive reagents and equipment are reduced by in silico analysis.61,62 Simultaneous dataset analysis enables potential biomarker screening across multiple samples and conditions by in silico methodology.61,62 Diverse datasets on genomic, transcriptomic, and proteomic data facilitate analysis.61,62 Prioritization of potential biomarkers is based on relevance to pathology, generating hypotheses about the molecular mechanism underlying disease pathogenesis, increasing data accessibility and reproducibility, and enhancing transparency and robustness of studies.61,62 The animal and human experiments minimize in silico methodology, reducing ethical compliance, predictive diagnosis, prognosis, and treatment by iterative analysis and optimization in biomedical studies.61,62 Significance and application rely on understanding the mechanism of neurodevelopmental toxicity, biomarker identification, risk assessment, and regulatory decision with an understanding of pathway insights, gene regulation, early detection, testing, toxicity prediction, and public health policies.63,64 Intoxicant exposure disrupts pathways and biological processes by toxic exposure to remodeling affection CPF on neurons.63,64 Unrevealing RNA biomarker’s biological material enables neurodevelopmental toxicity effect before the symptoms appear as a noninvasive biomarker testing.63,64 Examples of the study include CPF-induced neurodevelopmental neurotoxicity by identifying key TNA biomarkers from mice fetal brain tissue during gestation, where preprocessing identified DEG in the CPF exposure group in comparing control, network, prediction modeling where findings revealed changes in synaptic development, neurogenesis, and inflammation, with affected axon guidance, synaptic signaling, and neuroinflammation revealing a panel of miRNA and mRNA potential biomarkers.63,64 In silico enables comprehensive potential biological biomarkers for early neurodevelopmental disease monitoring, unrevealing complex interaction, and regulatory networks affected by intoxicants like CPF.63,64
Biosensors enable remote monitoring of the changes in organ systems continuously, enabling fast and reliable data collection, analysis, and interpretation.65–68 Real-time status uses home-based sensor systems that observe and record their behavior and interactions in children with autism spectrum disorder (ASD) or other neurodevelopmental conditions and critical symptom progression and therapeutics. Status tracks the frequent hospital visits, allowing timely information.65–68 Managing the effect of toxic exposure is enabled by the powerful tool of mobile health applications (mHealth apps), which facilitate daily symptom tracking, medication adherence, cognitive and behavioral assessment, and environmental exposure, enabling caregivers to log observations communicating collection and adherence to proposed treatment plans, gaining invaluable insight into daily behavior routines.69–71 eHealth app includes case studies to monitor neurodevelopmental progression, neurotoxicity exposure, outcome, and cognitive and behavioral therapy. 72 mHealth apps monitor behavioral patterns and physiological responses in a case study involving children with ASD. 72 Critical insights into the variability of symptoms and the impact of environmental factors enable long-term outcomes. 72 More personalized and effective interventions arise by combining data with clinical assessments. 72 A pilot project employs wearable sensors to measure pesticide levels in the environment, and physiological responses in children in agricultural communities exposed to organophosphate pesticides. 72 Reducing the incidence of acute neurotoxic symptoms is enabled by the preventive measures gained by the real-time collection facilitations and early diagnosis with immediate action of the neurotoxin effect. 72 The chronic impacts on neurodevelopment. is understood by long-term tracking with the health app. 72 Cognitive-behavioral therapy (CBT) sessions at homes delivered by remote monitoring systems and mHealth app in children with ADHD (Attention Deficit Hyperactivity Disorder) enable adherence to therapy protocol and feedback, improving access to therapy by continuous assessment and adjustment of therapy plans based on the provided real-time data information. 73 In patients with diabetes, glucose level management was successful with personalized feedback, reminders, and lessening admission to the hospital. 74 Moreover, during the COVID-19 pandemic, telehealth platforms enabled communication with healthcare institutions. 75 In the case of cardiovascular diseases, ECG (Electrocardiogram) monitoring enabled the detection of arrhythmias, and in breast cancer patients, there was a successful follow-up of the disease outcome. 76
Combining the internet, AI (Artificial Intelligence), and blockchain, it is possible to analyze data sets from biosensor applications.77,78 Predictive analytics analyzes environmental exposure where blockchain provides a decentralized ledger with data integrity and confidentiality.77,78 The internet enables the exchange of data connecting medical devices, sensors, and systems coordinating patient care where AI identifies patterns in data sets while predicting outcomes.77,78 Practice enhances policy implications in neurodevelopmental diseases and conditions caused by neurotoxicity.77,78 Health metrics in children exposed to neurotoxic agents and those with neurodevelopmental disorders are leveraging wearable devices, reducing severe complications and improving long-term outcomes in patients.79,80 Personalization tailored to needs is developed by integrating mHealth apps made by clinicians to reduce hospital readmissions.79,80 Neurodevelopmental disorders can be designed based on detailed behavioral and developmental data.81,82 Resources can be allocated more effectively by digital health data insights for public health interventions by policymakers, which is significant for the impact of organophosphate pesticide sensitivity.81,82 Reducing exposure and preventing neurodevelopmental harm is enabled by regulatory measures and supporting community-based initiatives by driven policies where the overall system is especially significant in organophosphate exposure in vulnerable populations.81,82
There is limited knowledge regarding total RNA biomarkers of neurotoxicity, which represents a good background for future research in silico. The current study supports the hypothesis that the total molecule level correlates to molecule-biological characteristics of healthy and diseased people dependent on mutual interactions. The focus is on total molecules and their interaction effect on the development of neurobiological disorders. This scientific paper aimed to investigate the interaction of total RNA molecule expression profile and pathological implications.
Material and methods
Total RNA molecules in silico studies apply to analyze RNA data and identify toxic effects on nervous tissue development by workflow consisting of data collection, processing, analysis, integration with other omic data, predictive modeling, and biomarker discovery.
Study design, location, and nature
The public GEO (Gene Expression Omnibus) database was applied remotely from Belgrade, Serbia, in this retrospective study, where in silico analysis was applied on expression data and not experiments. The study analysis started in September 2022.
Data collection
GSE58103 data sets. Repeated gestational exposure of mice to chlorpyrifos oxon is a ssociated with paraoxonase 1 (PON1) modulated effects in maternal and fetal tissues. Complete the GSE58103 data set in a shorter version.
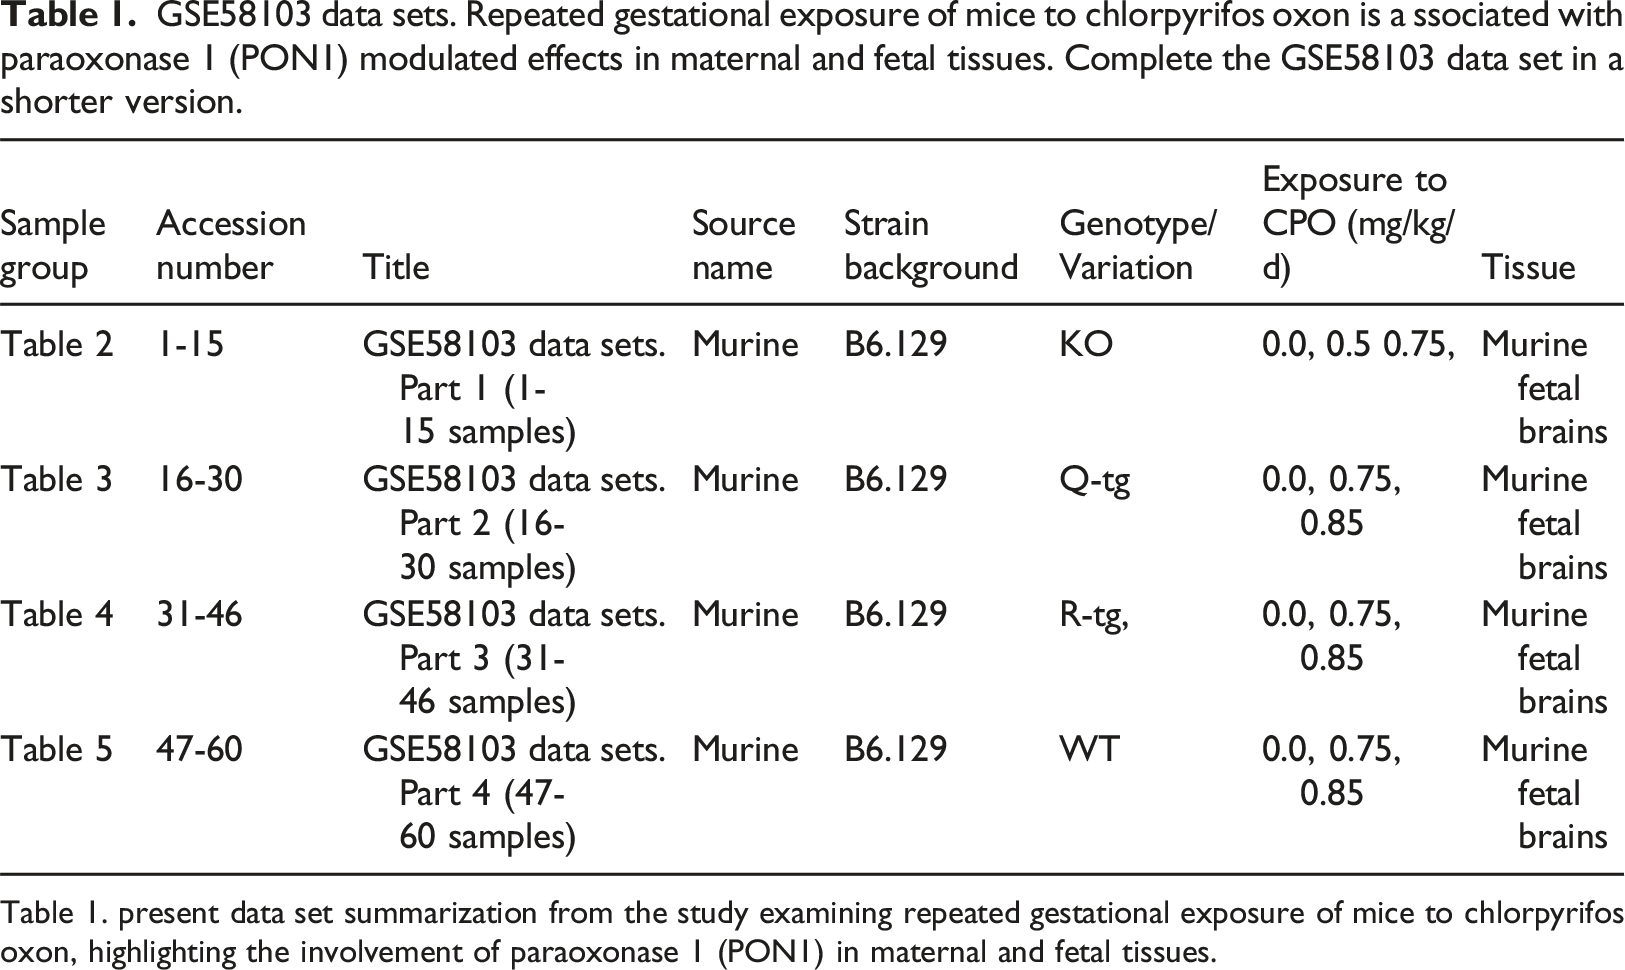
Table 1. present data set summarization from the study examining repeated gestational exposure of mice to chlorpyrifos oxon, highlighting the involvement of paraoxonase 1 (PON1) in maternal and fetal tissues.
GSE58103 data sets. Part 1 (1-15 samples).
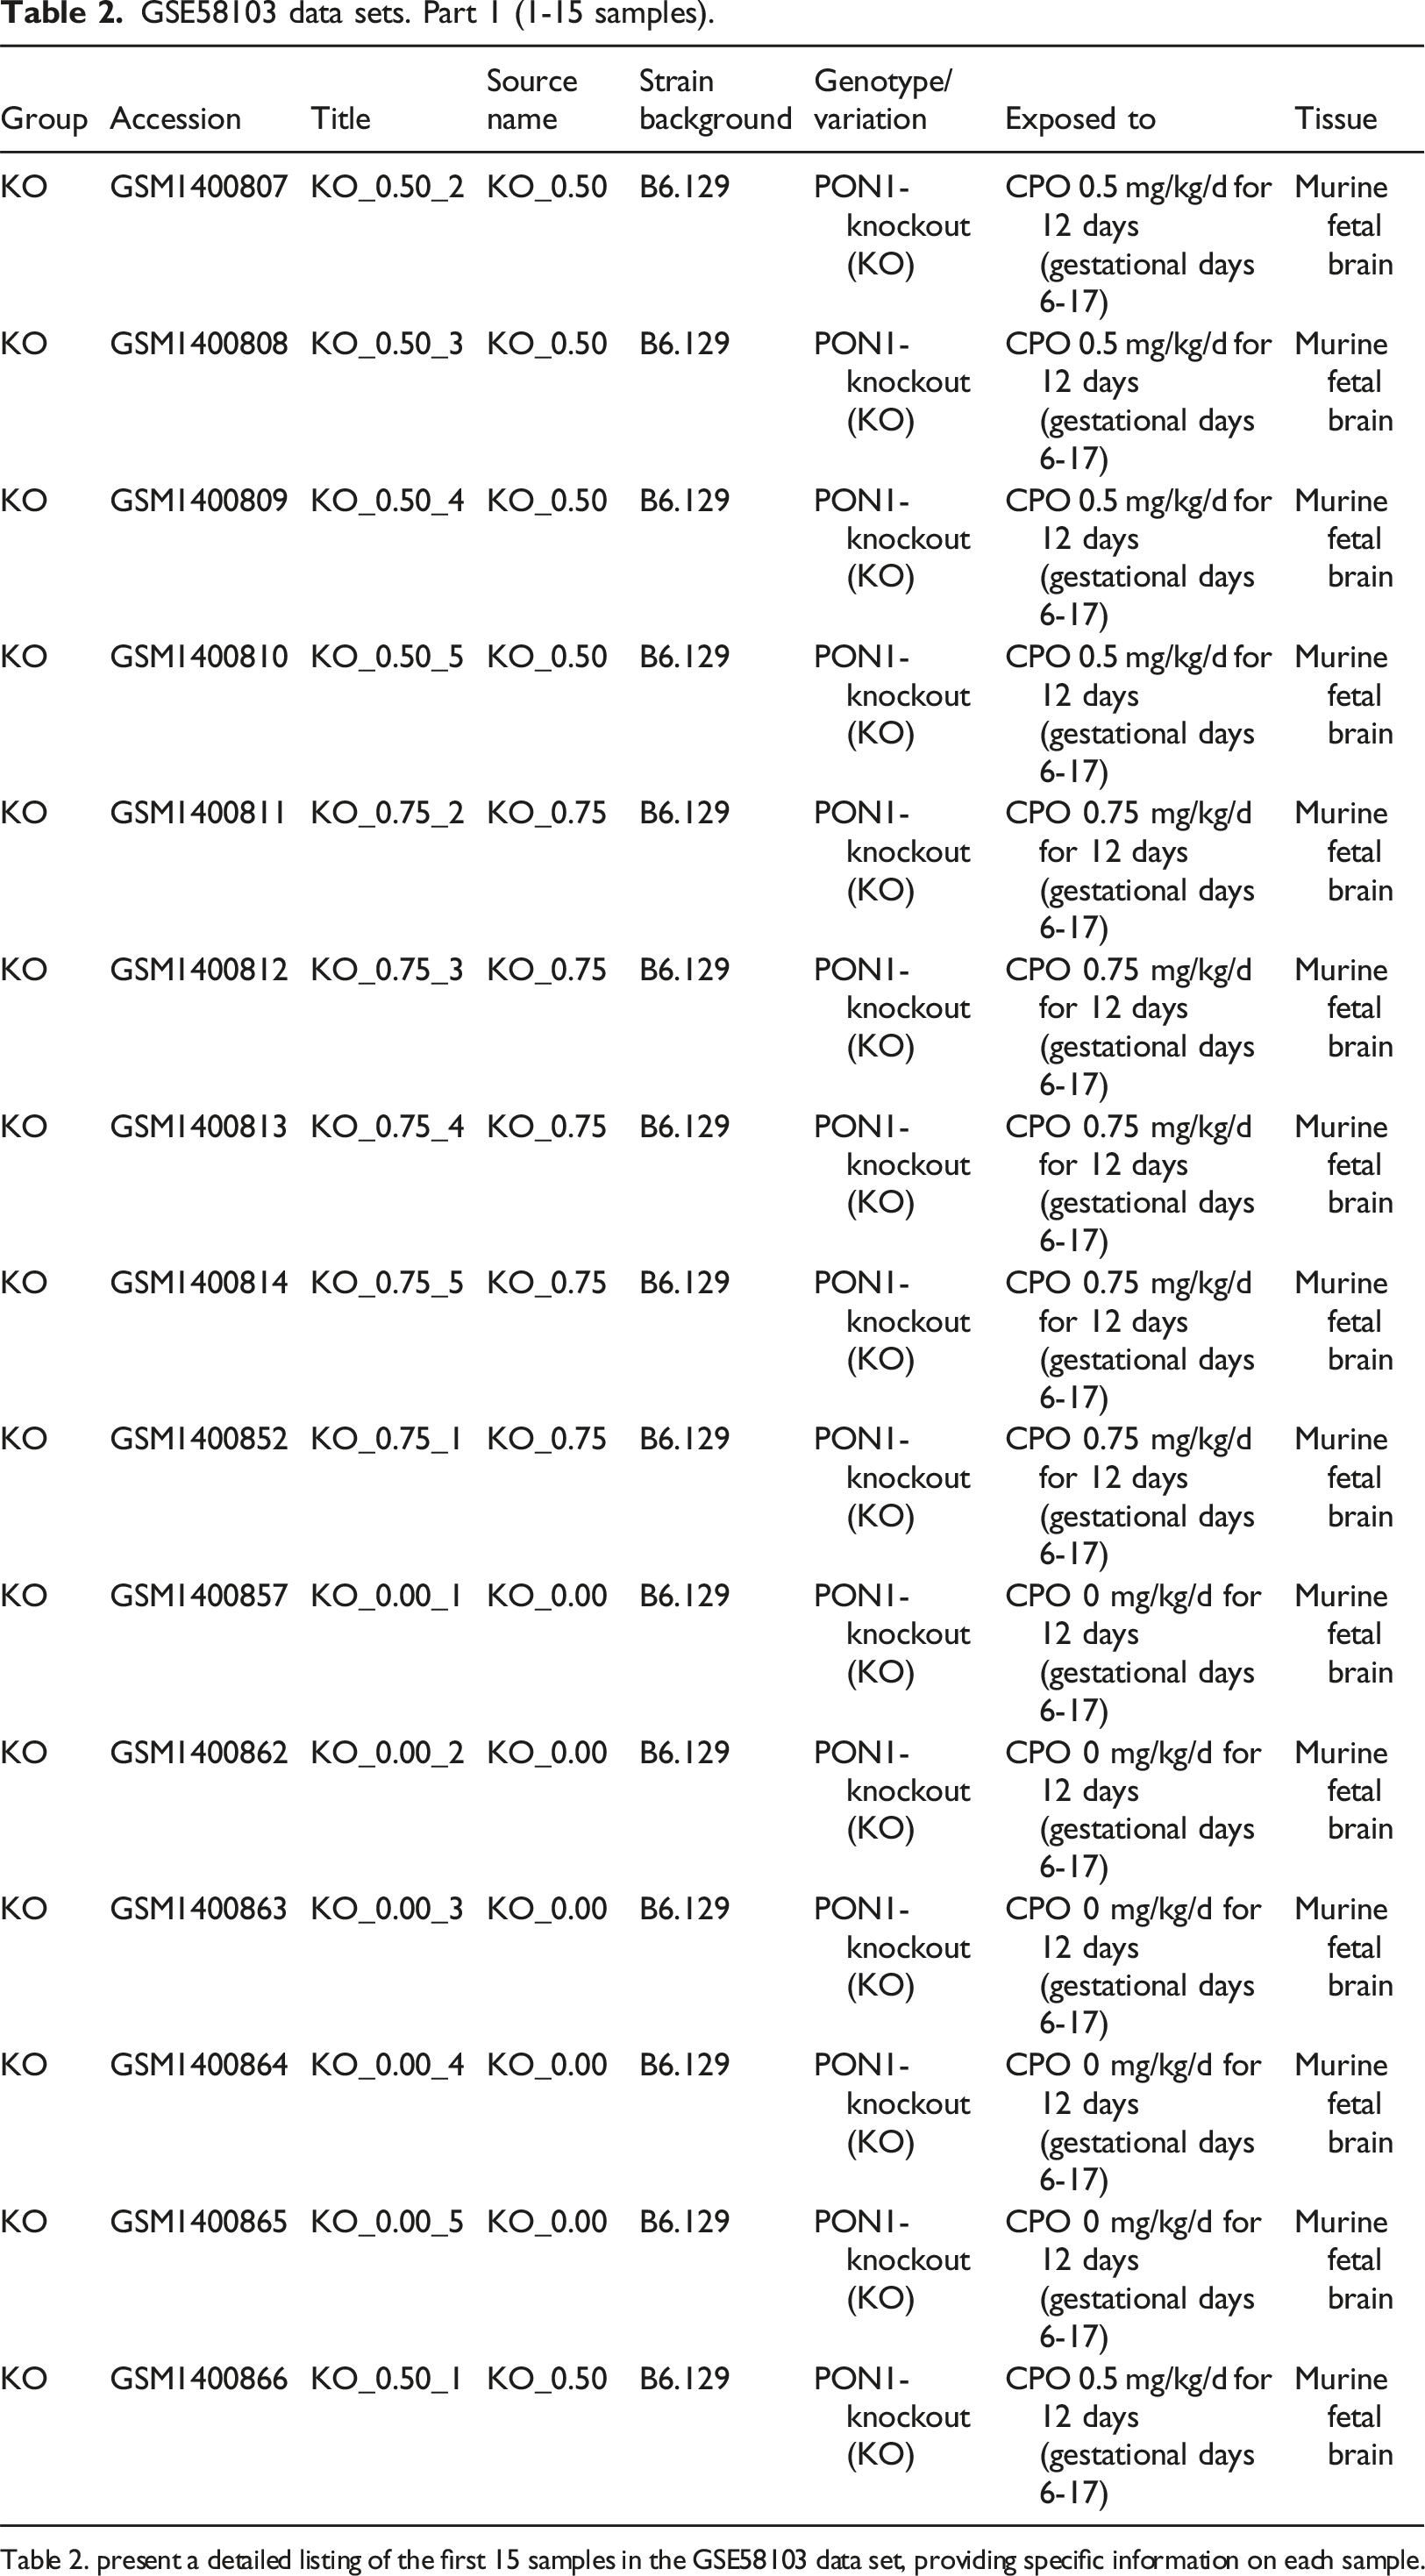
Table 2. present a detailed listing of the first 15 samples in the GSE58103 data set, providing specific information on each sample.
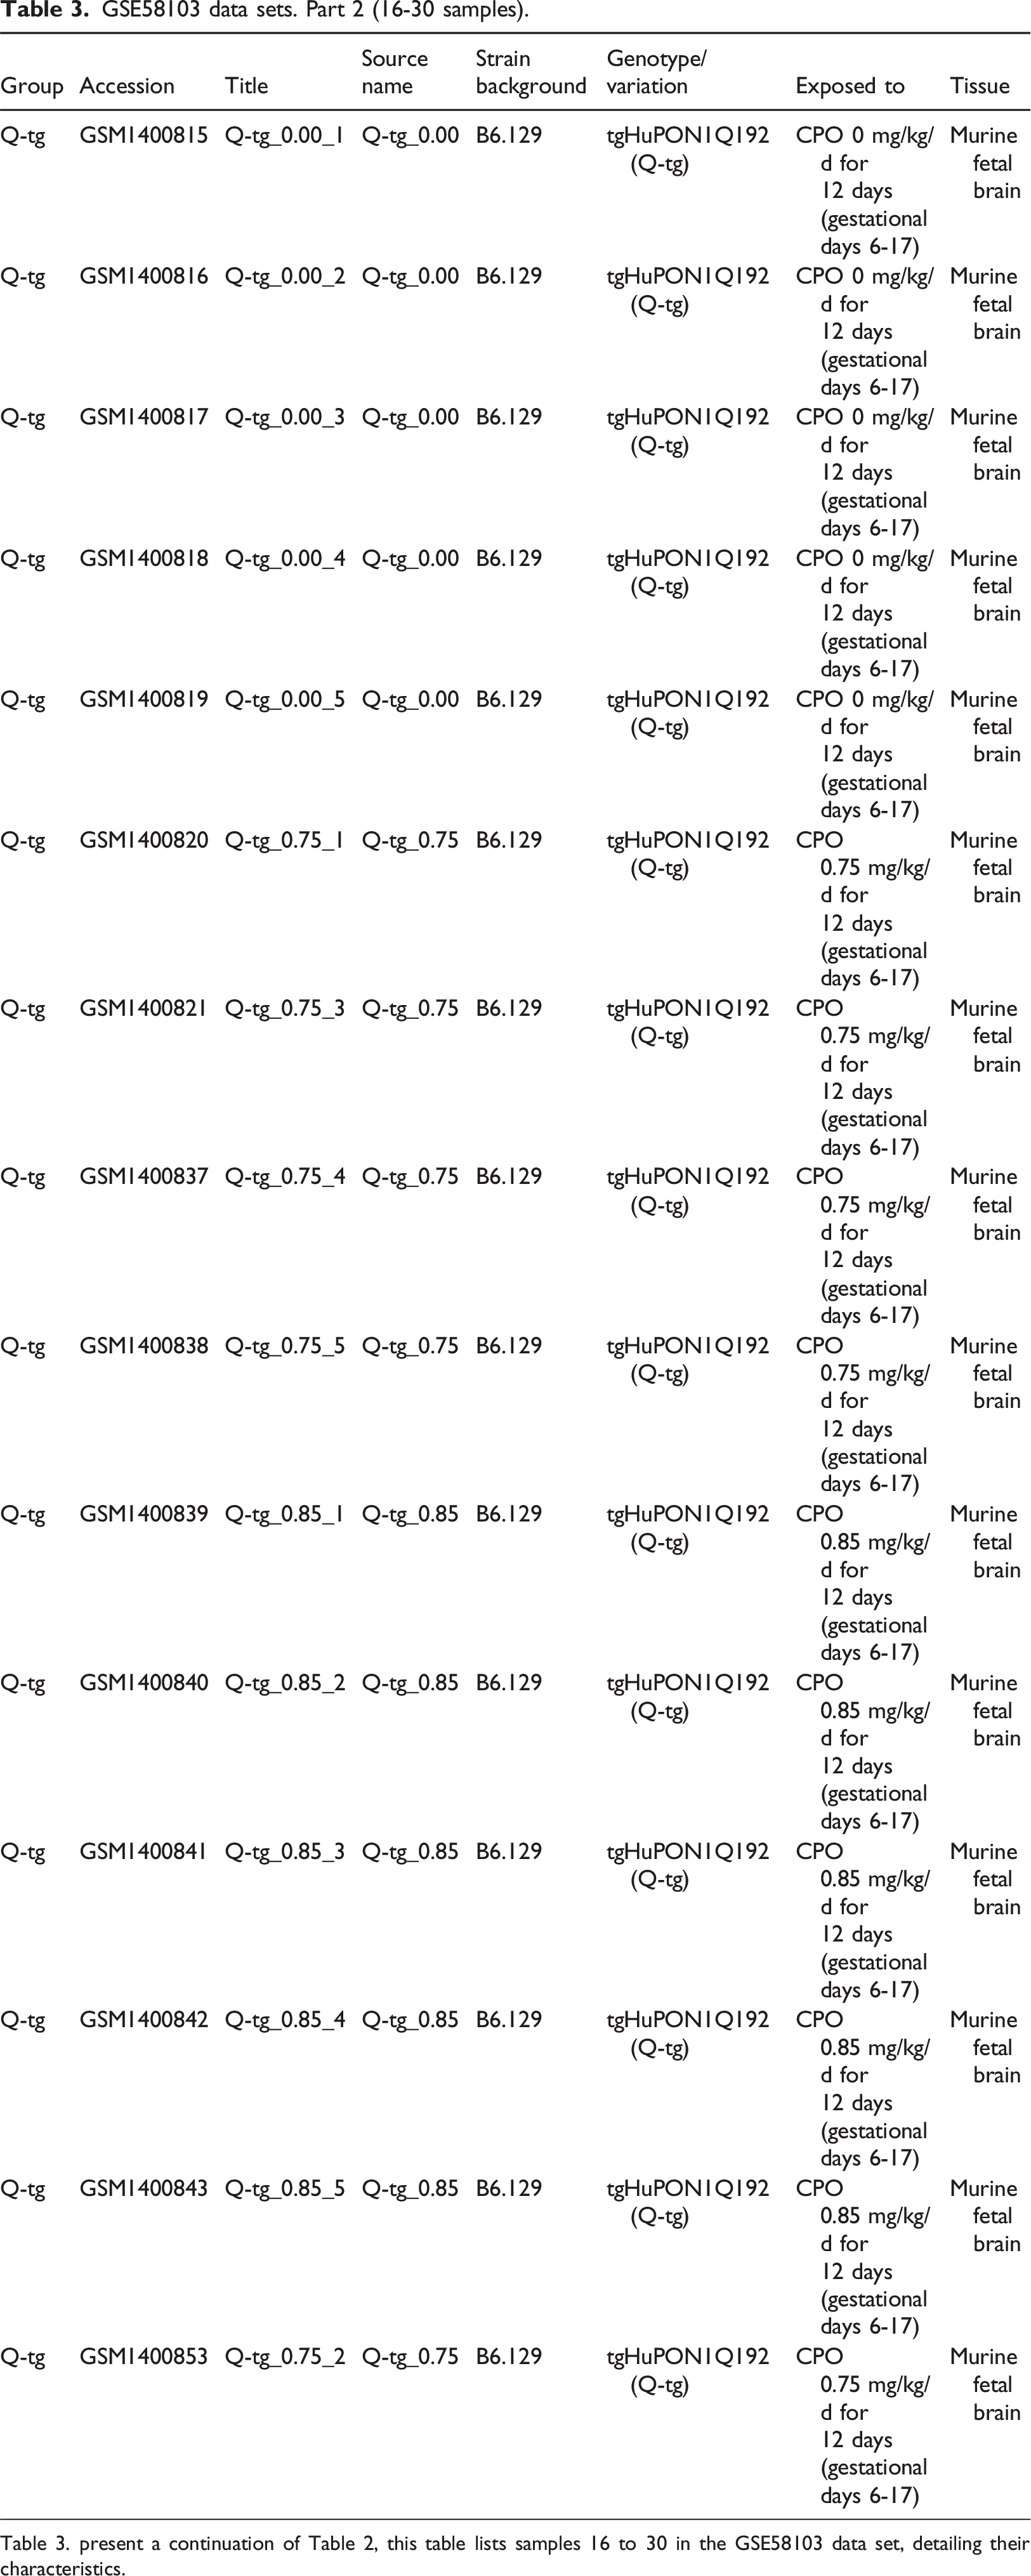
GSE58103 data sets. Part 2 (16-30 samples).
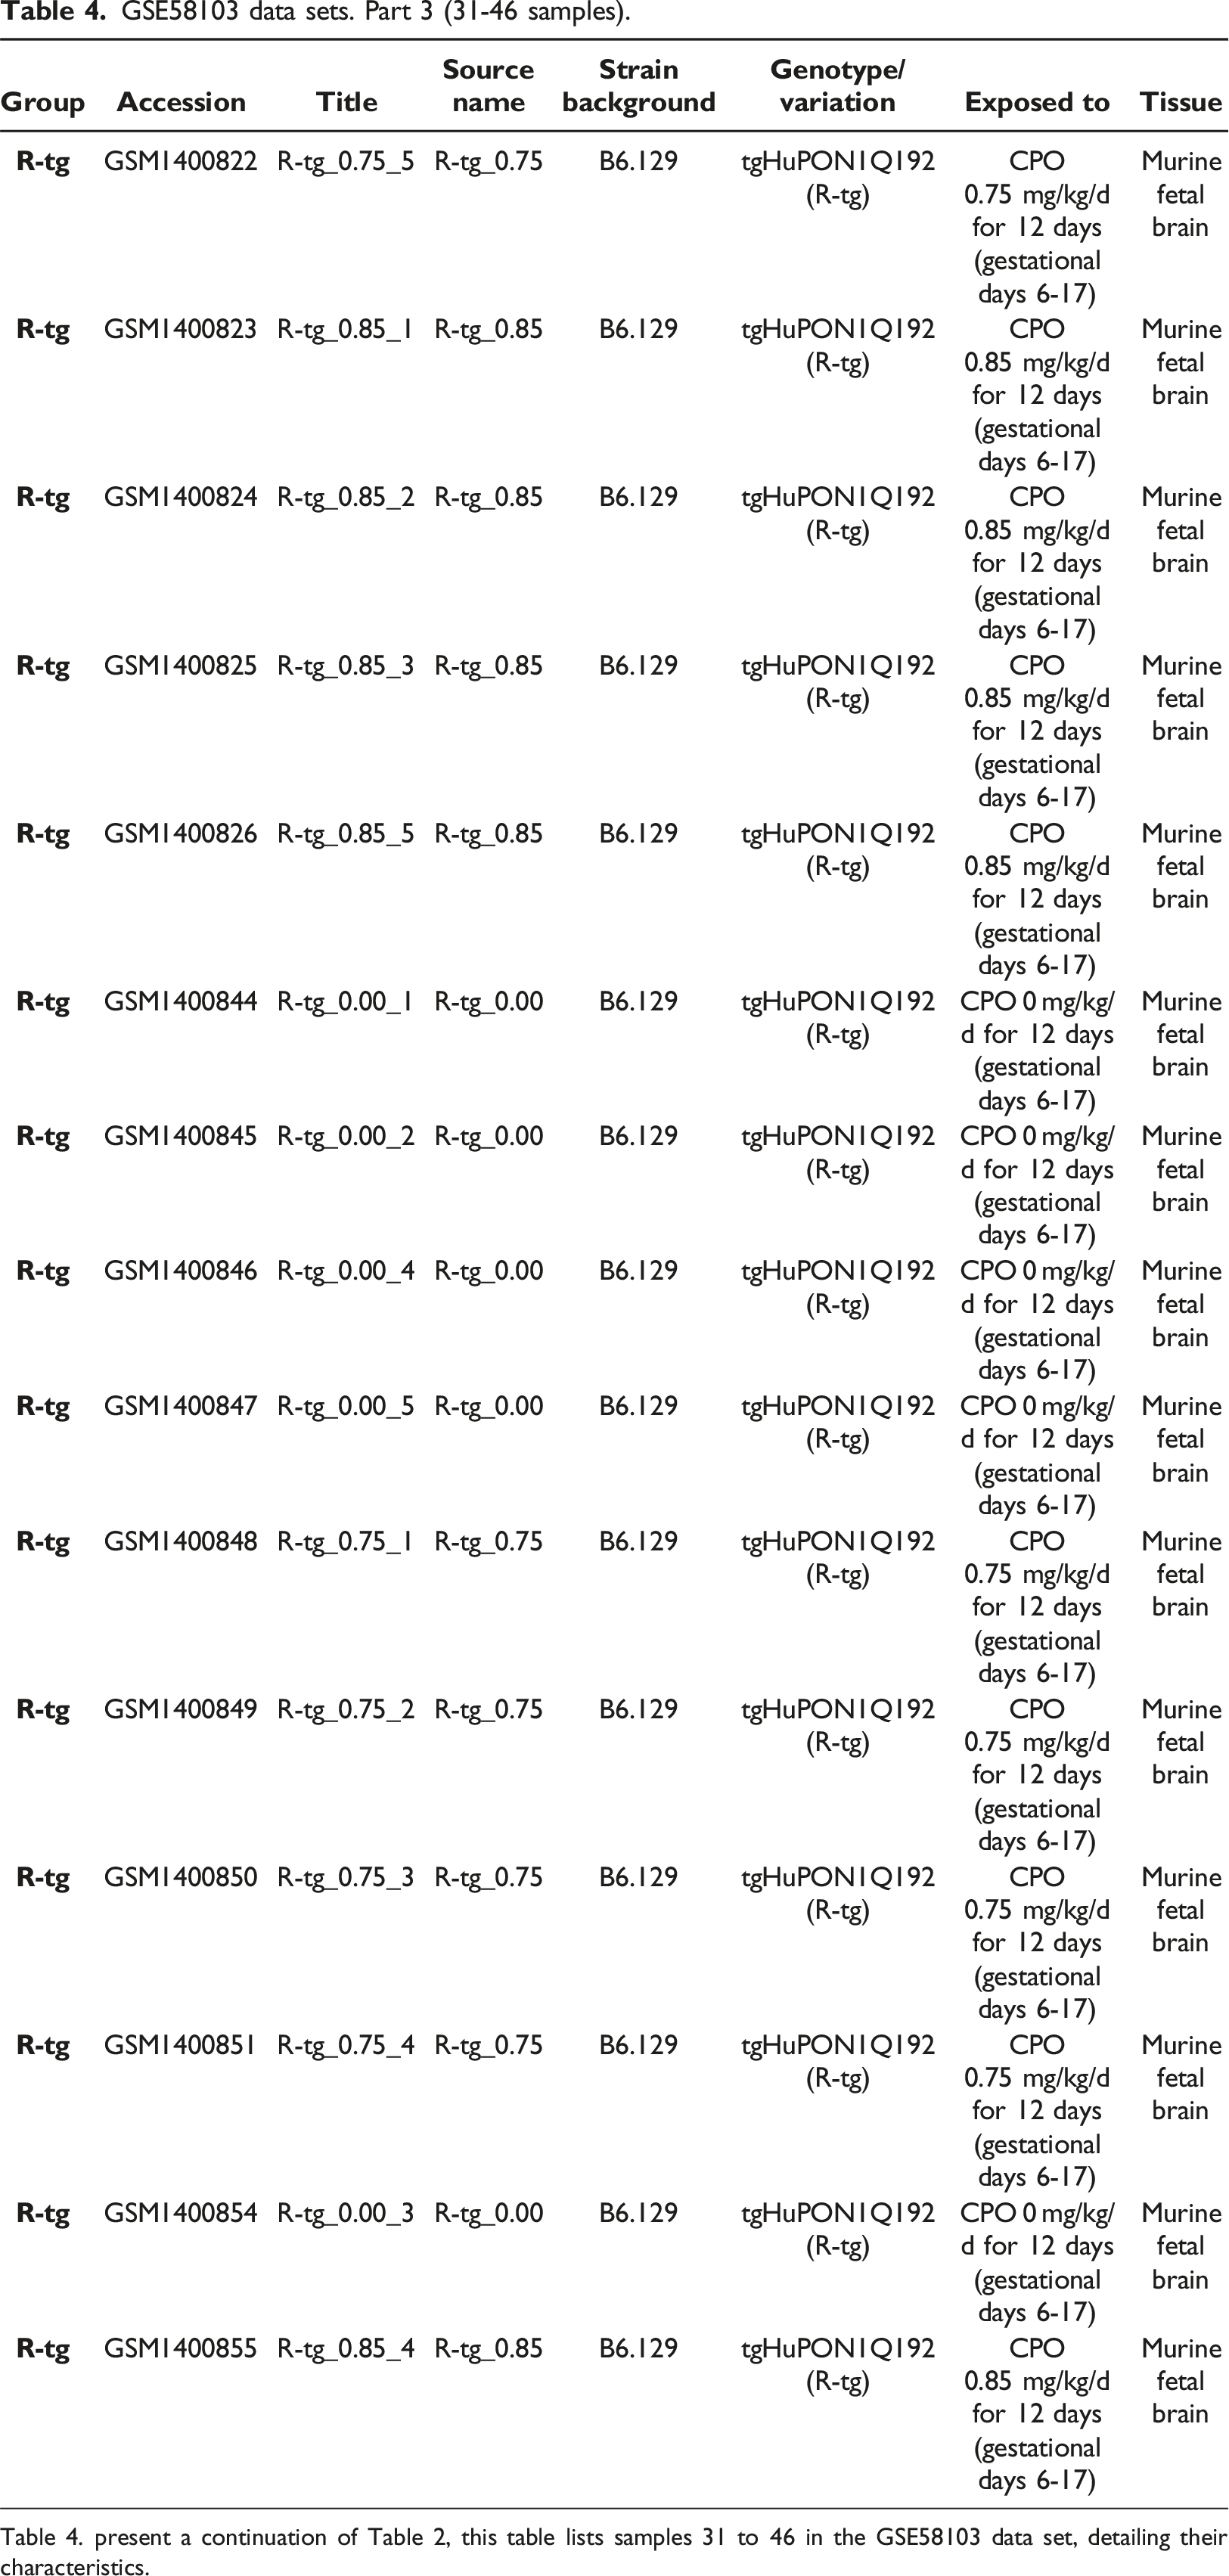
GSE58103 data sets. Part 3 (31-46 samples).
GSE58103 data sets. Part 4 (47-60 samples).
Data quality control
RNA and hybridization array was performed, along with initial exploratory data analysis by identifying potential outliers.
Data preprocessing
Downloaded CEL files from GSE58103 underwent quality control check with tolls Affymetrix Expression Console and oligo package in R.
Code
[
library(oligo)
rawData <- read. celfiles(list.celfiles())
qc <- qc(rawData)
plot(qc)
]
Using RMA (Robust Multi-array Average) normalization methodology, data across all samples contain background correction and summarization, ensuring a comparable expression data level.
Code
[
normData <- rma(rawData)
]
Data filtering
Samples undergoing exclusion criteria are excluded for further analysis, ensuring high-quality data for downstream analysis.
Data analysis
Plan for scientific study analysis includes prediction and validation tools, interaction network construction, functional enrichment analysis, protein-protein network analysis, experimental validation data interpretation and validation.
Differential expression analysis
Initial screening of total RNA for differential expression RNA between groups was done with software DESeq2 (Differential Expression Analysis for Sequence Count Data), using limma (Linear Models for Microarray Data) package, based on |log2 fold change|> 1 and an adjusted p value <.05 criteria. Data retrieval from the GEO database was on September 2022 (Dataset ID: GSE58103; Platform: GPL6246 [MoGene-1_0-st] Affymetrix Mouse Gene 1.0 ST Array [transcript gene version];).
We first define experimental groups for four genotypes: KO, Q-tg, R-tg, and WT,
Code
[
pData(normData)$group <- factor(c(rep(“WT”, 3), rep(“KO”, 3), rep(“Q-tg”, 3), rep(“R-tg”, 3)))
]
and then we did differential expression analysis using the limma package in R.
Code
[
library(limma)
design <- model. matrix(∼0 + group, data = pData(normData))
fit <- lmFit(normData, design)
contrast.matrix <- makeContrasts(KO-WT, Q-tg-WT, R-tg-WT, levels = design)
fit2 <- contrasts. fit(fit, contrast. matrix)
fit2 <- eBayes(fit2)
topTable(fit2, adjust = “fdr”, number = Inf)
]
Functional enrichment analysis
Molecular function, cell components, and biological processes undergo gene ontology (GO) and pathway analysis with tools like KEGG (Kyoto Encyclopedia of Genes and Genomes) to map genes to known signaling and metabolic pathways identifying synaptic signaling, neurogenesis, and axon guidance activating during exposure. Gene set enrichment analysis (GSEA) with a cluster profile package performs.
Code
[
Library(clusterProfiler)
gseaRes <- gseGO(geneList = topTable(fit2)$logFC, OrgDb = org.Mm.eg.db, keyType = “ENSEMBL”, nPerm = 1000)
]
We apply the ReactomePA package for pathway enrichment analysis.
Code
[
library(ReactomePA)
reactomeRes <- enrichPathway(gene = rownames(topTable(fit2)[topTable(fit2)$adj.P.Val <0.05, ]), organism = “mouse”)
]
Network analysis
Gene coexpression analysis and protein-protein network apply. WGCNA (Weighted Gene coexpression network analysis) identifies coexpression gene molecules and regulators, while STRING (Search Tool for the Retrieval of Interacting Genes/Proteins) and Cytoscape analyze and visualize interactions among proteins coded by diverse genes.
Protein-protein interaction (PPI) network analysis
includes retrieved interaction data and construction of PPI network. String database applies to get PPI with STRINGdb package to construct and visualize the PPI network.
Code
[
library(STRINGdb)
string_db <- STRINGdb$new(version = “11.0”, species = 10090, score_threshold = 400)
pp_interactions <- string_db$get_interactions(rownames(topTable(fit2)[topTable(fit2)$adj.P.Val <0.05, ]))
]
Experimental validation data interpretation
includes key findings and cross-validation which are done by comparing DEG and enriched pathways with previously published data in experimental settings to validate the findings by diverse data subsets, enabling the robustness of the results.
Reporting and publication
is done by visualization and manuscript preparation using ggplot2, ComplexHeatmap, and Cytoscape and summarizing the methodology, results, and interpretation in a structured format, following journal guidelines.
Code
[
library(ggplot2)
ggplot(topTable(fit2), aes(x = logFC, y = -log10(adj.P.Val))) + geom_point() + theme_minimal()
]
Integration with other omic data
Integration with other omic data includes epigenomic and proteomic, miRNA, and lncRNA analysis, while predictive modeling and biomarker discovery include machine learning.
A comprehensive view of regulatory changes depends on the integration of RNA data with DNA methylation, histone modification, and proteomic data to register regulatory changes as well as to investigate the role of miRNA, lncRNA, and circRNA in regulating gene expression and their response to toxicant by miRBase for miRNA target prediction and lncbase for lncRNA analysis in the analysis. Post-transcriptional regulation depends on the interaction study of non-coding RNA. Predictive machine-learning algorithms apply in neurodevelopmental neurotoxicity studies. In this step, data is collected and preprocessed multi-omic data from proteomics, metabolomics, and epigenomics for the same samples if available, and each dataset is normalized and independently quality controlled using standard methods for each omic type. Multi-omic data are combined by concatenation, dimensional reduction, and network-based approach if they are comparable scales with methods like PCA (Principal Component Analysis) and UMAP (Uniform Manifold Approximation and Projection) to reduce dimensionality and integrate data while constructing a multi-omic network to capture interactions between different omic layers with code n R
Code
[
# Example of combining transcriptomics and proteomics data using PCA#
library(ggplot2)
combined_data <- cbind(transcriptomics_data, proteomics_data)
pca_res <- prcomp(combined_data, scale. = TRUE)
ggplot(as.data.frame(pca_res$x), aes(x = PC1, y = PC2, color = genotype)) + geom_point()
]
Random forest, vector machines and neural network techniques
Random forest, Vector machines and neural network technique build a predictive model with learning algorithm and RNA biomarker discovery in neurotoxicity with BioMart biomarker.
Predictive modeling
includes data preparation through feature and splitting of the relevant finding of the study (gene, protein, metabolite) based on DEG and correlation analysis, where data is split into training and test sets.
Code
[
set.seed(123)
train_indices <- sample(1:nrow(combined_data), size = 0.7*nrow(combined_data))
train_data <- combined_data[train_indices, ]
test_data <- combined_data[-train_indices, ]
]
Model building
by machine learning includes algorithms like Random Forest, Support Vector Machine (SVM), Neural Network, and cross-validation to tune hyperparameters and avoid data overfitting.
Code
[
library(randomForest)
rf_model <- randomForest(genotype ∼., data = train_data, importance = TRUE)
]
Evaluation of model
By accuracy, precision, recall, F1-score, and ROC-AUC (Receiver Operating Characteristic - Area Under the Curve) performance metrics.
Code
[
library(caret)
predictions <- predict(rf_model, test_data)
confusionMatrix(predictions, test_data$genotype)
]
Biomarker discovery
Biomarker discovery includes identifying key features from the machine learning model to identify potential biomarkers.
Code
[
importance(rf_model)
]
Experimental validation or independent datasets validate the predictive power using independent datasets with functional enrichment and network analysis to understand the biological significance.
Code
[
library(clusterProfiler)
biomarkers <- rownames(importance(rf_model))
enrichment_results <- enrichGO(gene = biomarkers, OrgDb = org. Mm.eg.db, keyType = “SYMBOL”, pAdjustMethod = “BH”)
]
or to construct and analyze PPI networks involving the biomarkers.
Code
[
library(STRINGdb)
string_db <- STRINGdb$new(version = “11.0”, species = 10090, score_threshold = 400)
pp_interactions <- string_db$get_interactions(biomarkers)
]
ggplot2, ComplexHeatmap (An R package for complex heatmap visualizations) and Cytoscape apply for reporting and visualization for the integrated data, predictive model performance, and biomarker validation.
Code
[
library(ggplot2)
ggplot(importance(rf_model), aes(x = reorder(Feature, -Importance), y = Importance)) + geom_bar(stat = “identity”)
]
To be more concise, robust, and transparent regarding methodology workflow, GEO GSE58103 database, Bioconductor (Open source software for bioinformatics) packages (oligo, limma, cluster profile, ReactomePA, STRINGdb) and visualization tools (ggplot2, ComplexHeatmap, Cytoscape) apply in this study for interpretation of high-throughput expression data from murine fetal brain tissue of 4 diverse genotypes providing biological implication of PON-1 gene variation.
library(oligo)
library(limma)
library(clusterProfiler)
library(randomForest)
library(caret)
library(STRINGdb)
library(ggplot2)
rawData <- read. celfiles(list.celfiles())
normData <- rma(rawData)
pData(normData)$group <- factor(c(rep(“WT”, 3), rep(“KO”, 3), rep(“Q-tg”, 3), rep(“R-tg”, 3)))
design <- model. matrix(∼0 + group, data = pData(normData))
fit <- lmFit(normData, design)
contrast.matrix <- makeContrasts(KO-WT, Q-tg-WT, R-tg-WT, levels = design)
fit2 <- contrasts. fit(fit, contrast. matrix)
fit2 <- eBayes(fit2)
de_genes <- topTable(fit2, adjust = “fdr”, number = Inf)
combined_data <- cbind(transcriptomics_data, proteomics_data)
train_indices <- sample(1:nrow(combined_data), size = 0.7*nrow(combined_data))
train_data <- combined_data[train_indices, ]
test_data <- combined_data[-train_indices, ]
rf_model <- randomForest(genotype ∼., data = train_data, importance = TRUE)
predictions <- predict(rf_model, test_data)
confusionMatrix(predictions, test_data$genotype)
importance_scores <- importance(rf_model)
biomarkers <- rownames(importance_scores[order(importance_scores[, “MeanDecreaseGini”], decreasing = TRUE), ][1:20, ])
enrichment_results <- enrichGO(gene = biomarkers, OrgDb = org.Mm.eg.db, keyType = “SYMBOL”, pAdjustMethod = “BH”)
string_db <- STRINGdb$new(version = “11.0”, species = 10090, score_threshold = 400)
pp_interactions <- string_db$get_interactions(biomarkers)
This study do not require ethical approval and biological material. Personal data is private and anonymized respecting original data sources. The researcher acknowledges the ethical usage of public data with sources referencing as secondary content, respecting original data collection sources and data transparency. These manuscripts follow the guidance of the publicly available data.
Results
Results of the study enable information regarding the effect of repeated gestational exposure to CPO on maternal and fetal tissues in mice modulated by PON1.
The data set
The data set includes an overview of expression profiles from murine fetal brain tissue for genotypes KO, Q-tg, R-tg, and WT with total 60 samples/15 samples each. The complete GSE58103 dataset in a shorter version is present in Table 1, while Tables 2-5 divides 60 samples into four parts, 15 samples per table. Murine fetal brain exposed to CPF (Chlorpyrifos) ranges (0.0, 0.75, 0.85 mg/kg/d) for 12 days, whereas Table 1 contains detailed information regarding genotype variations differences, strain background, sample group, accession number, and source name. Murine strain B6.129 (C57BL/6J-129) save research time by minimizing the genetic susceptibility variation enabling understanding of disease mechanism. This will provide insights into complex interactions and pathways, maximize statistical strength, and minimize confounding effects by eradicating potential errors in biological processes and potential therapeutics. B6.129 the murine model enhances understanding of complex biological systems to predict the outcome of experiments and increases scientific discoveries in diverse areas like genetics, physiology, pharmacology, and modeling disease by in silico methodologies.
Sample summary table.
Table 6. present detailed information regarding accession number, title, source name, strain background, exposure to CPO, dosing regime and tissue type.
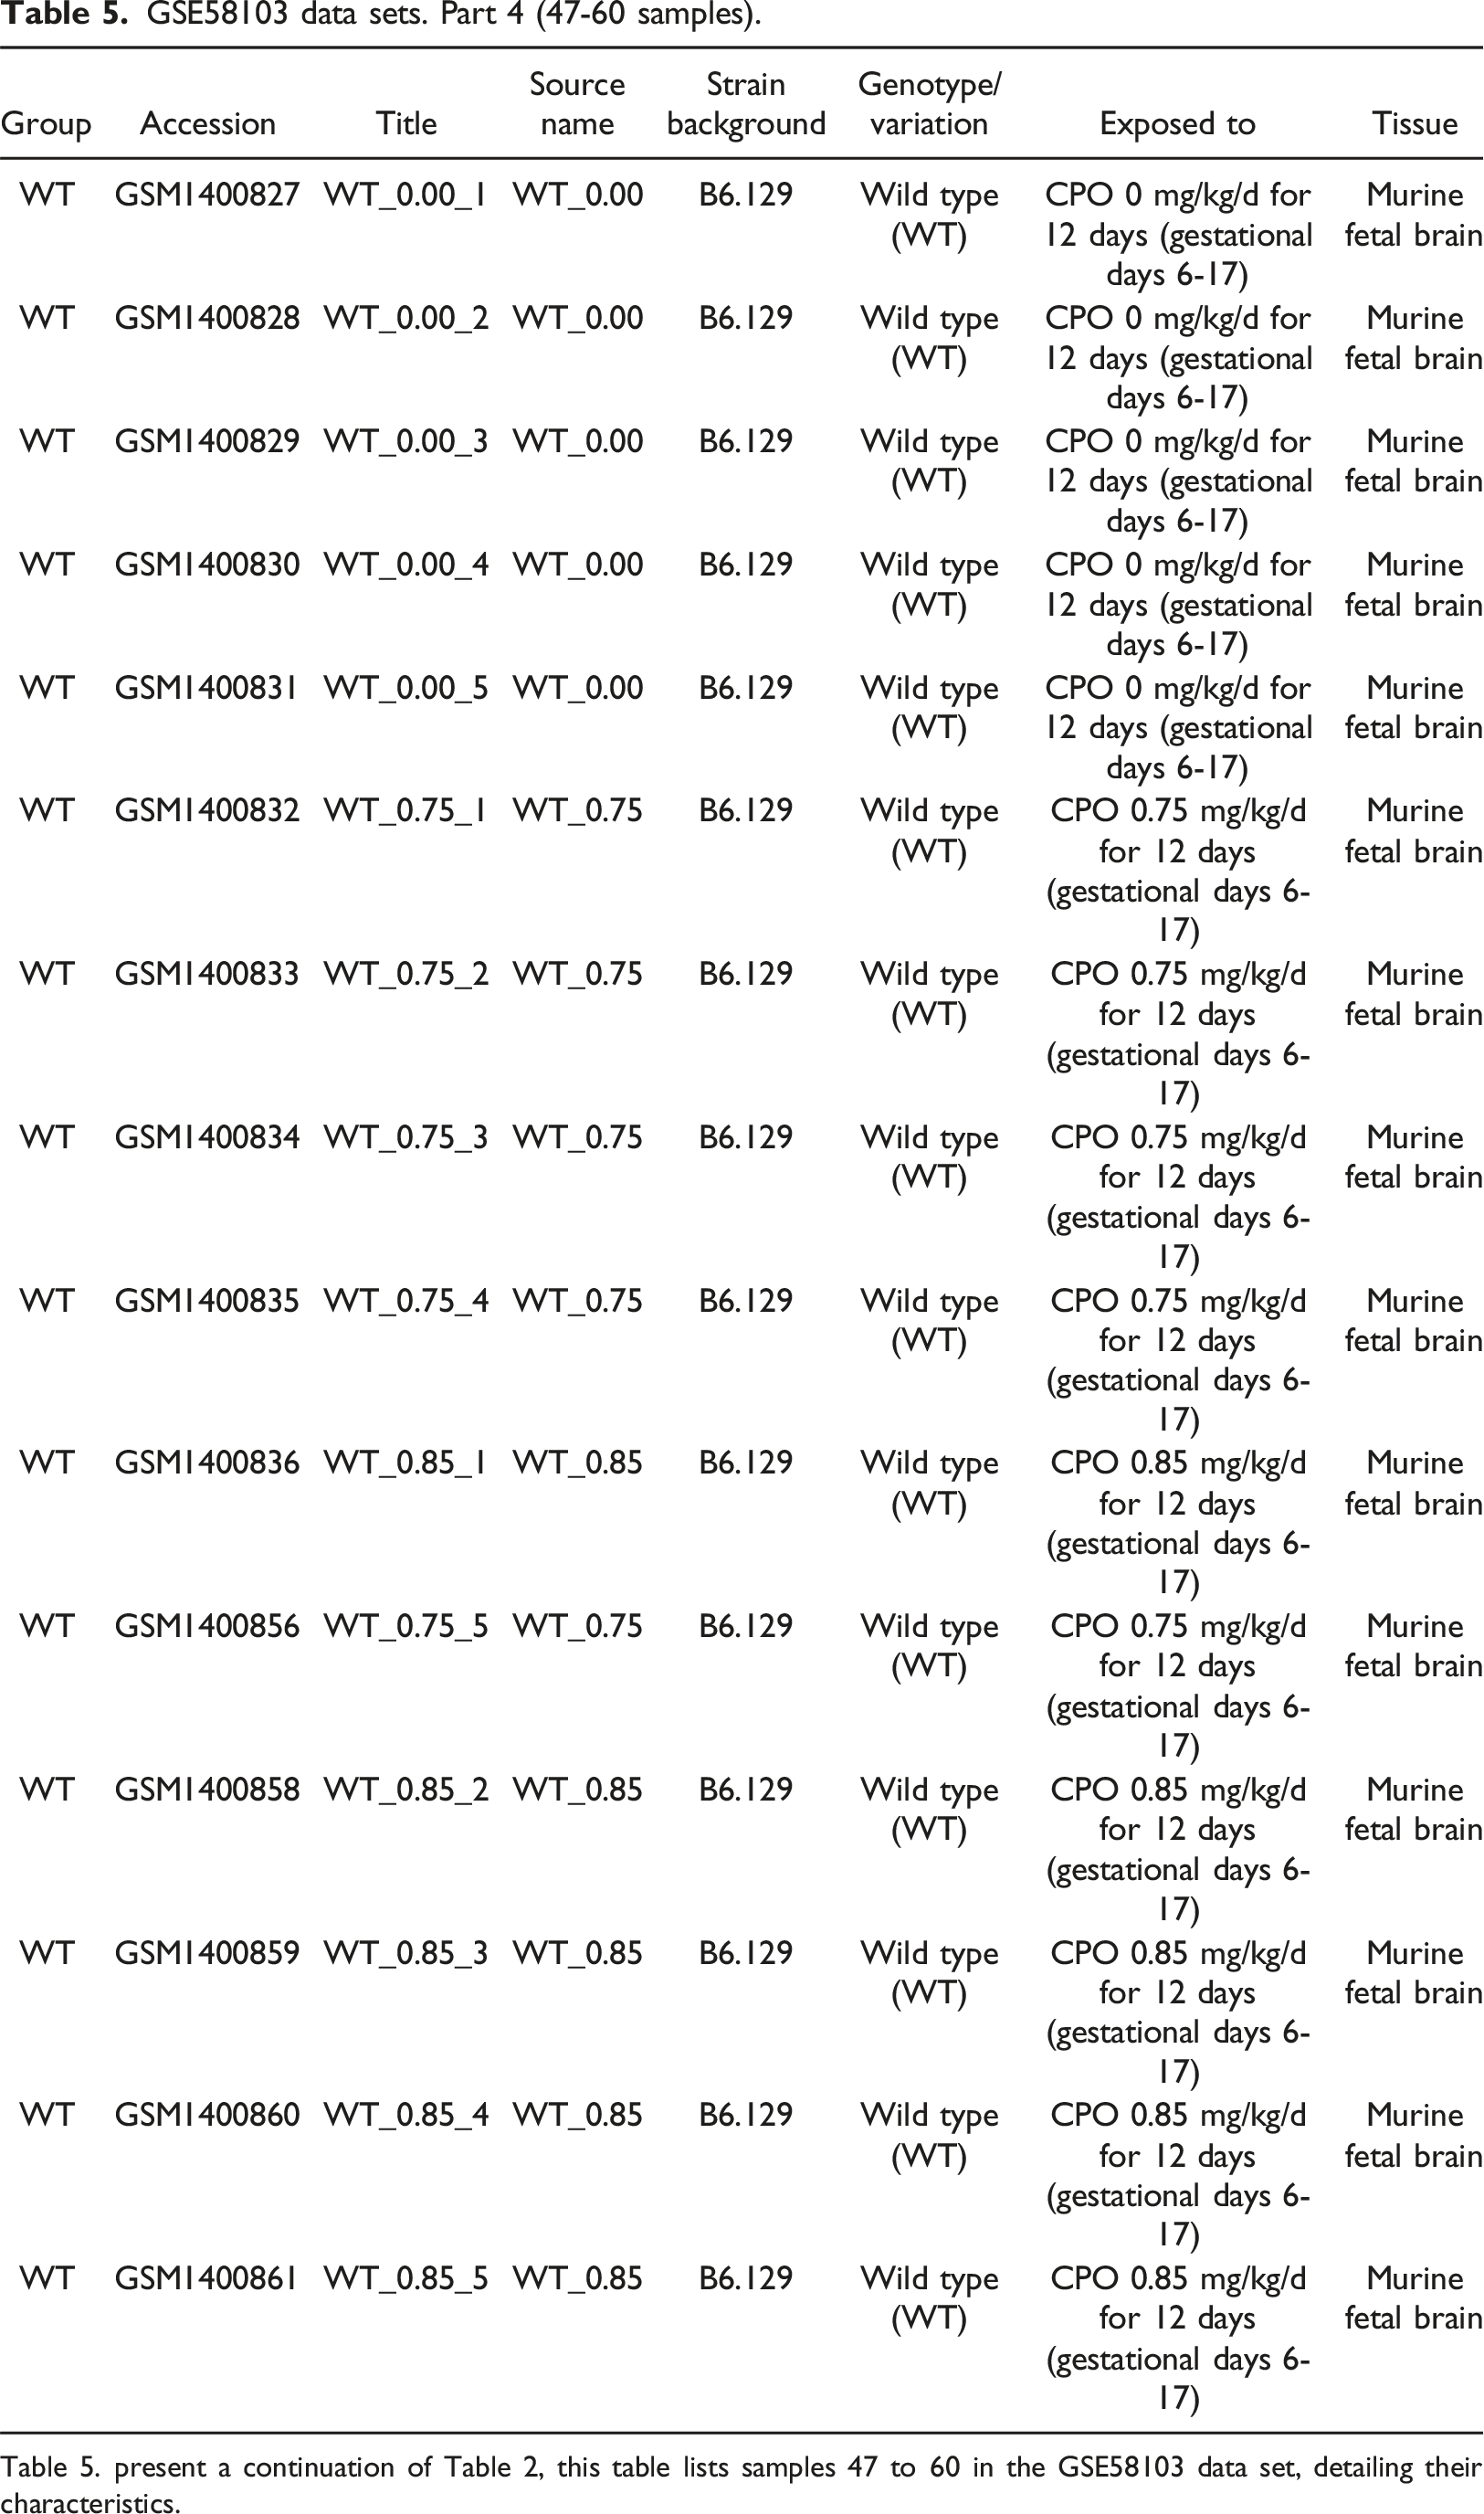
List of significant RNA molecules when comparing WT and KO group of samples with limma package and volcano plot.
Table 7. present identification of significantly different RNA molecules between WT and KO groups with limma package and volcano plot.
Volcano plot of WT and KO group of samples. (ID: 10398426; Gene symbol: miRNA-485;Gene title: miRNA 485; log2 (fold change):-0.211; -log10(p-value):5.803). Figure 1 show statistical significant differences for differential expression genes between WT and KO groups exist for mir485 with a log2 fold change of −0.211 and a -log10(p-value) of 5.803, as shown with the volcano plot.
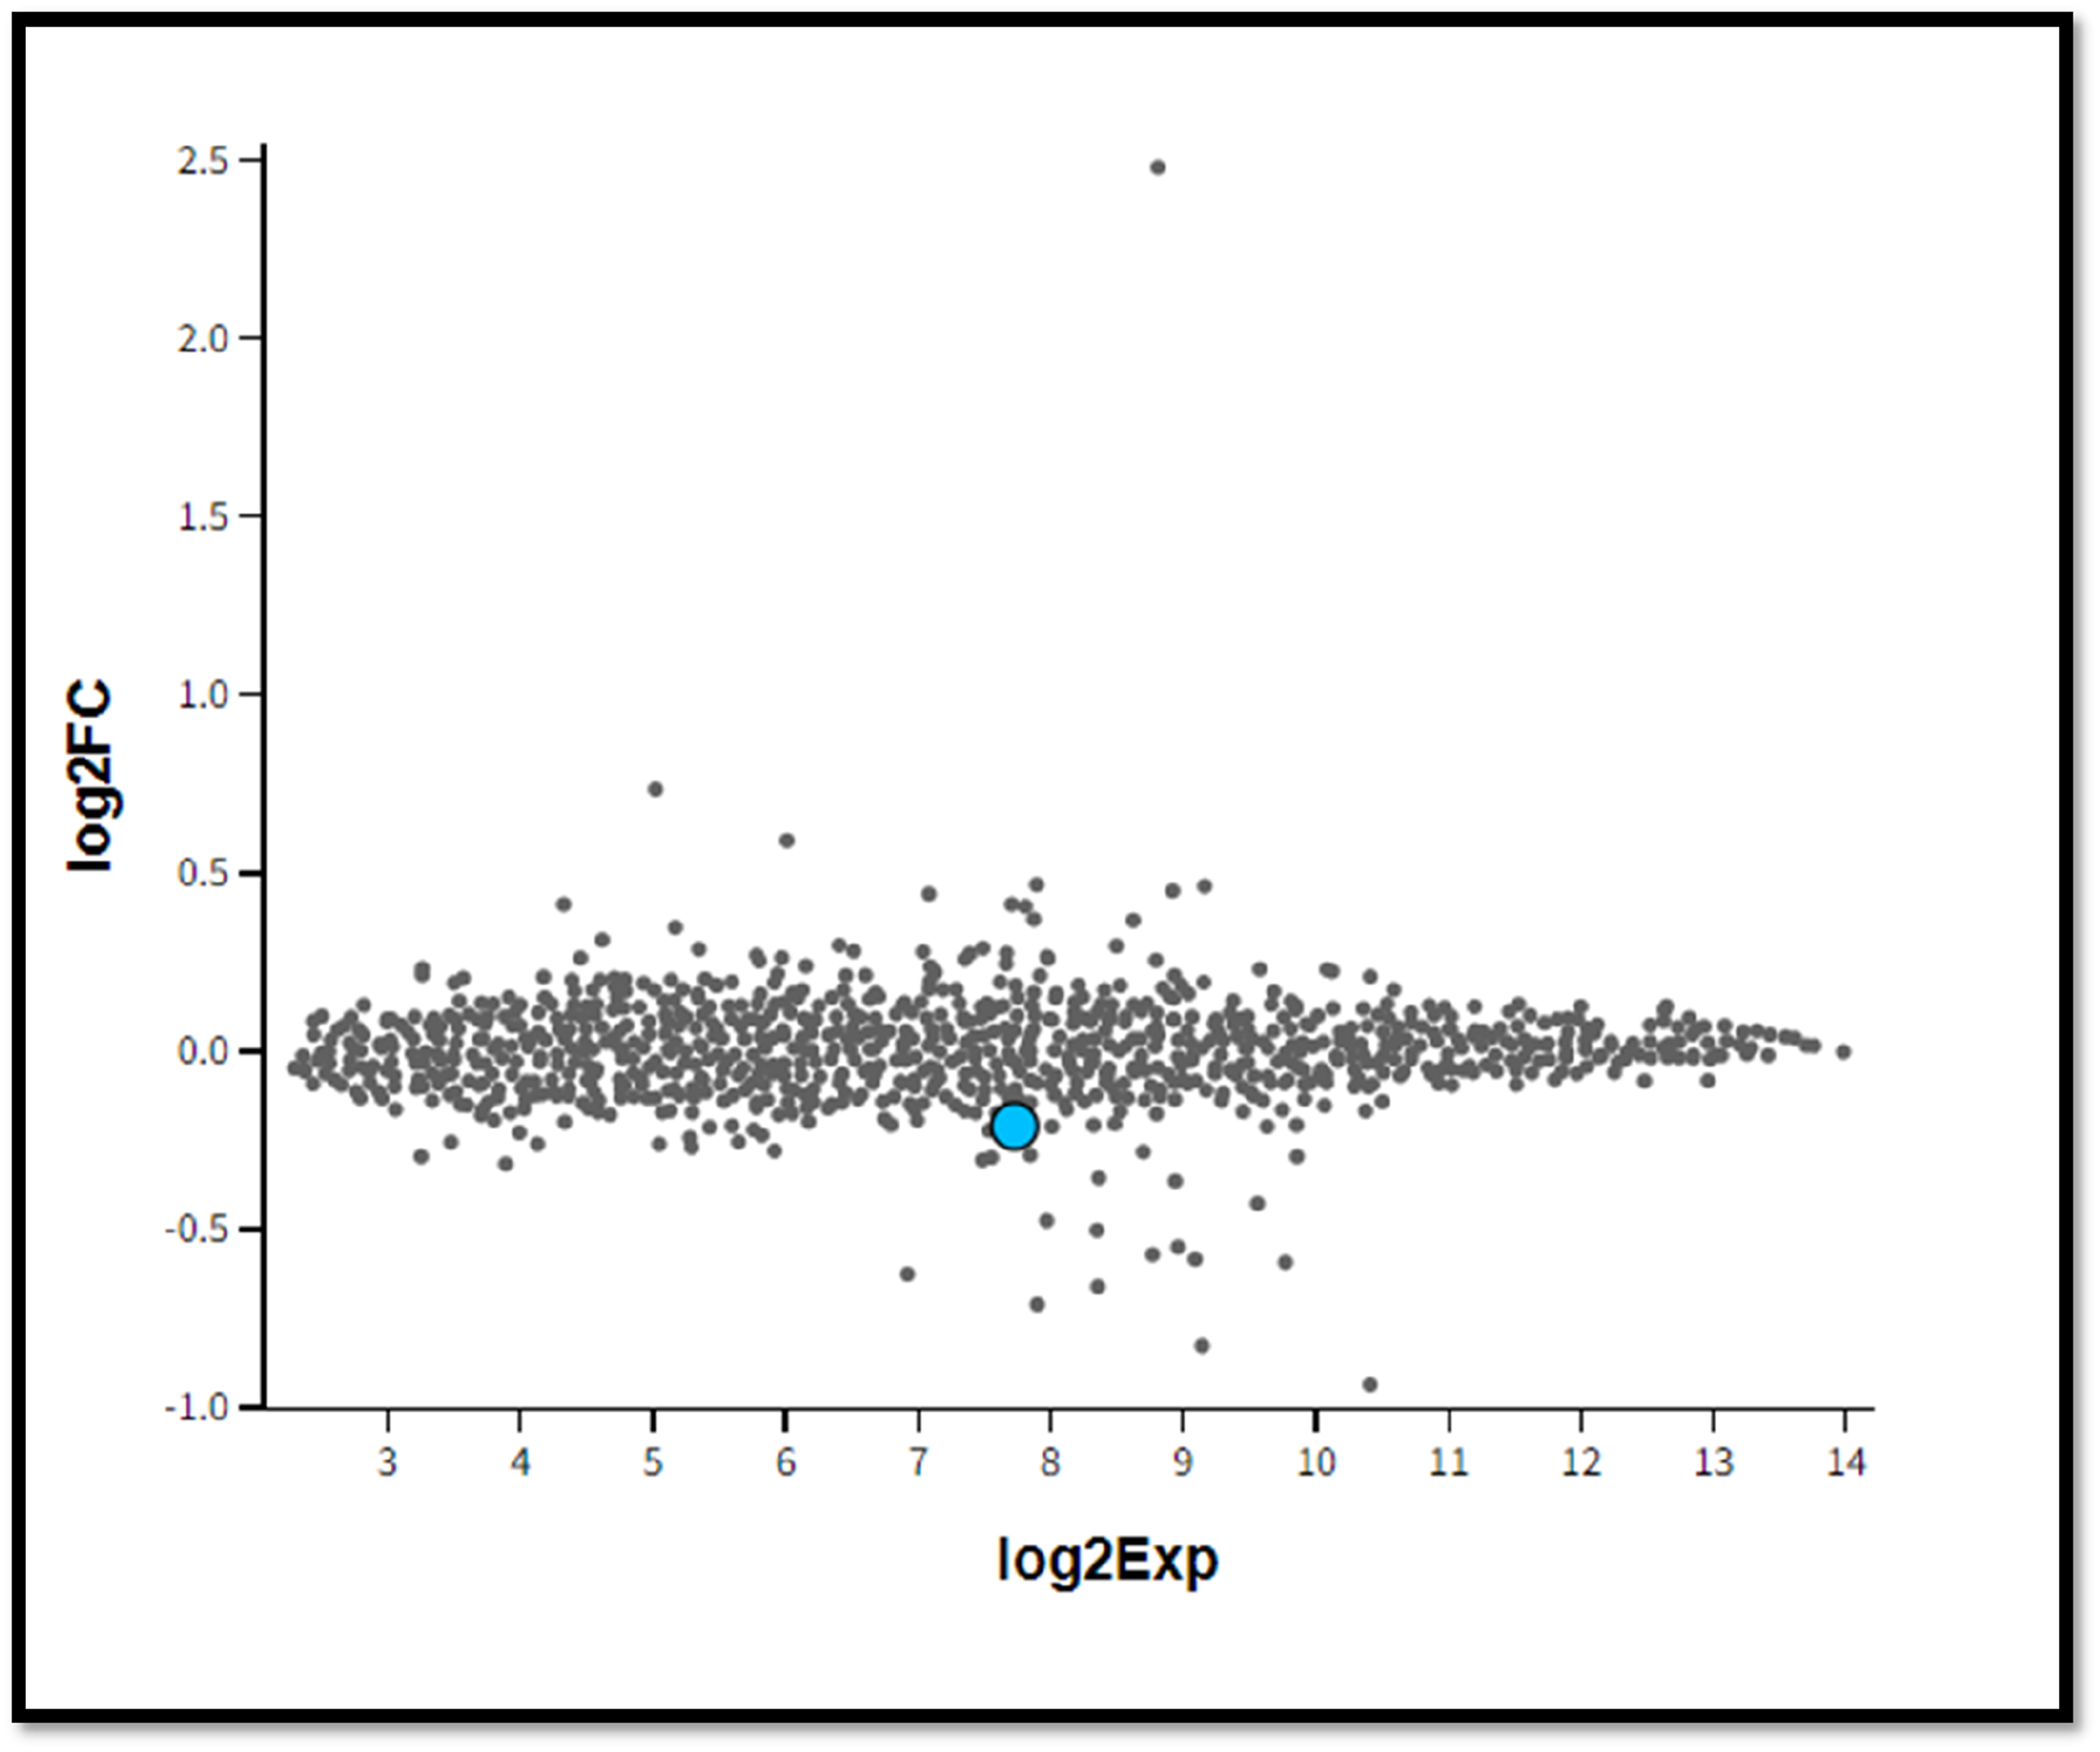
Mean difference plot of WT and KO group of samples. (ID: 10398426; Gene symbol: miRNA-485;Gene title: miRNA-485; log2Exp:7.727; log2FC:-0.211). Fgure 2. show expression levels of miRNA-485 in WT and KO groups exist with a log2 expression of 7.727 and a log2 fold change of −0.211 as shown with a mean difference plot.
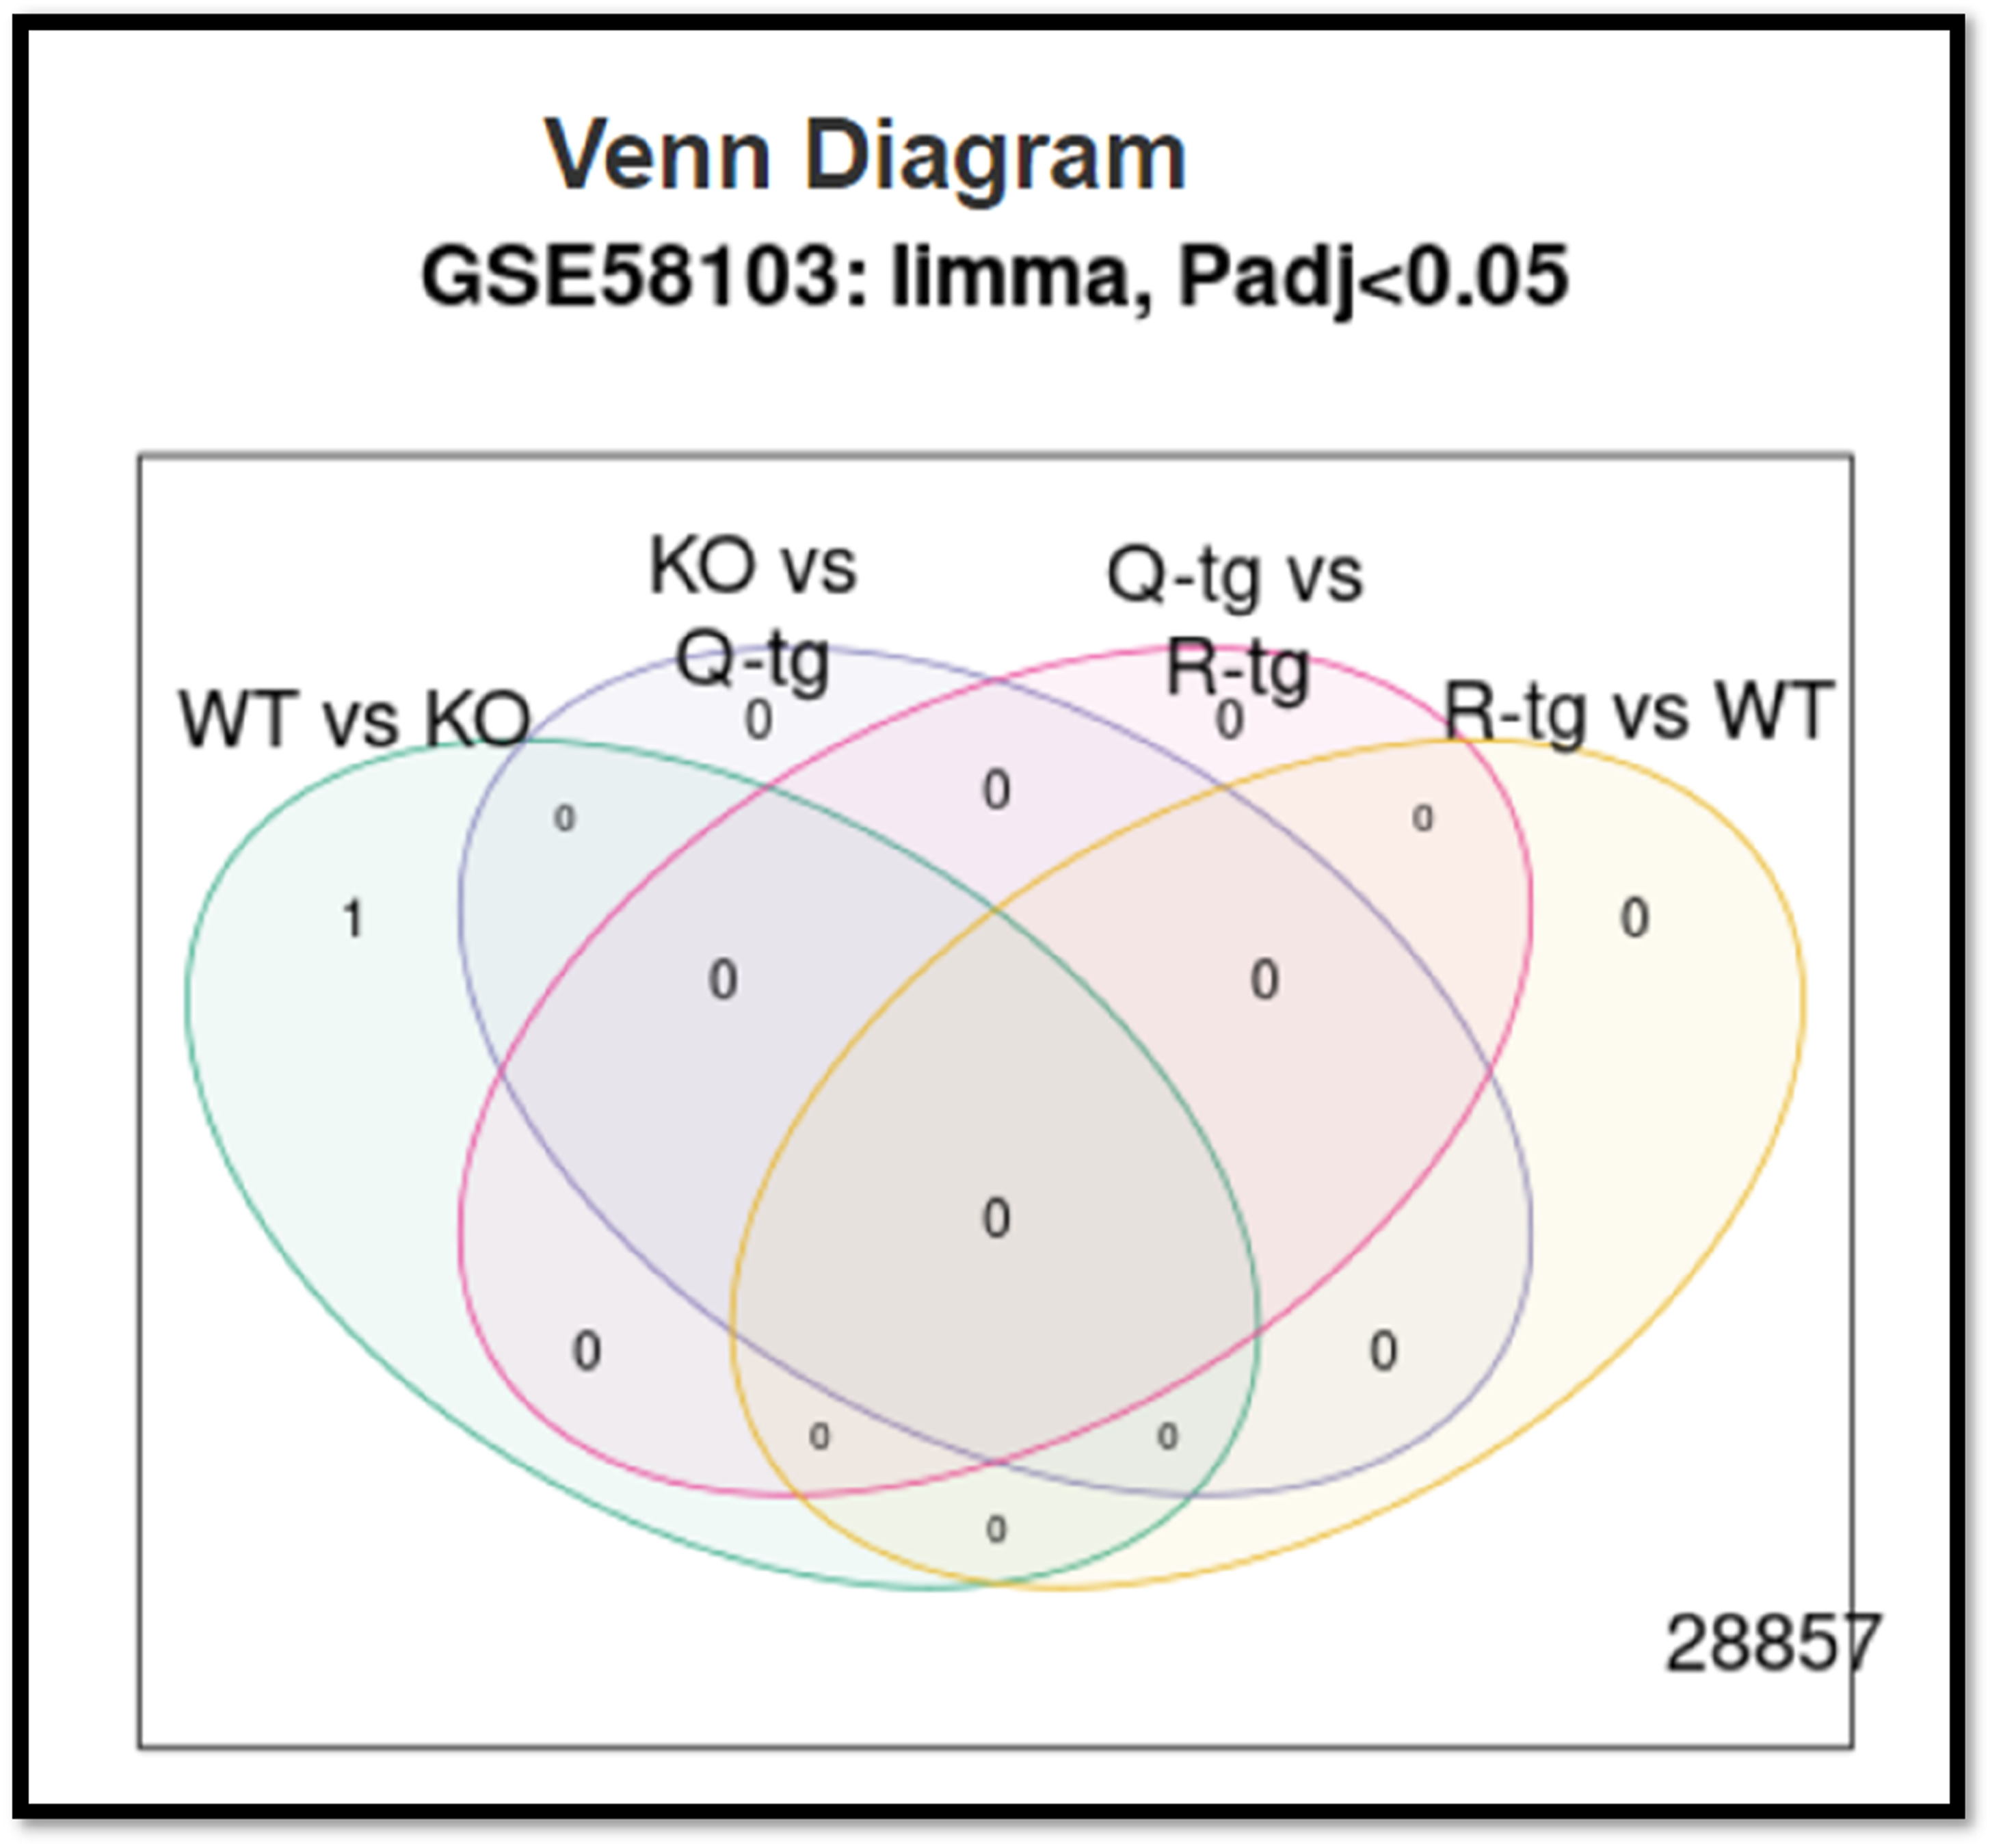
Venn Diagram with a given region, relevant contrast and several significant genes in each comparison group. Figure 3 show shared and distinct RNA molecules are present depending on the Venn diagram.
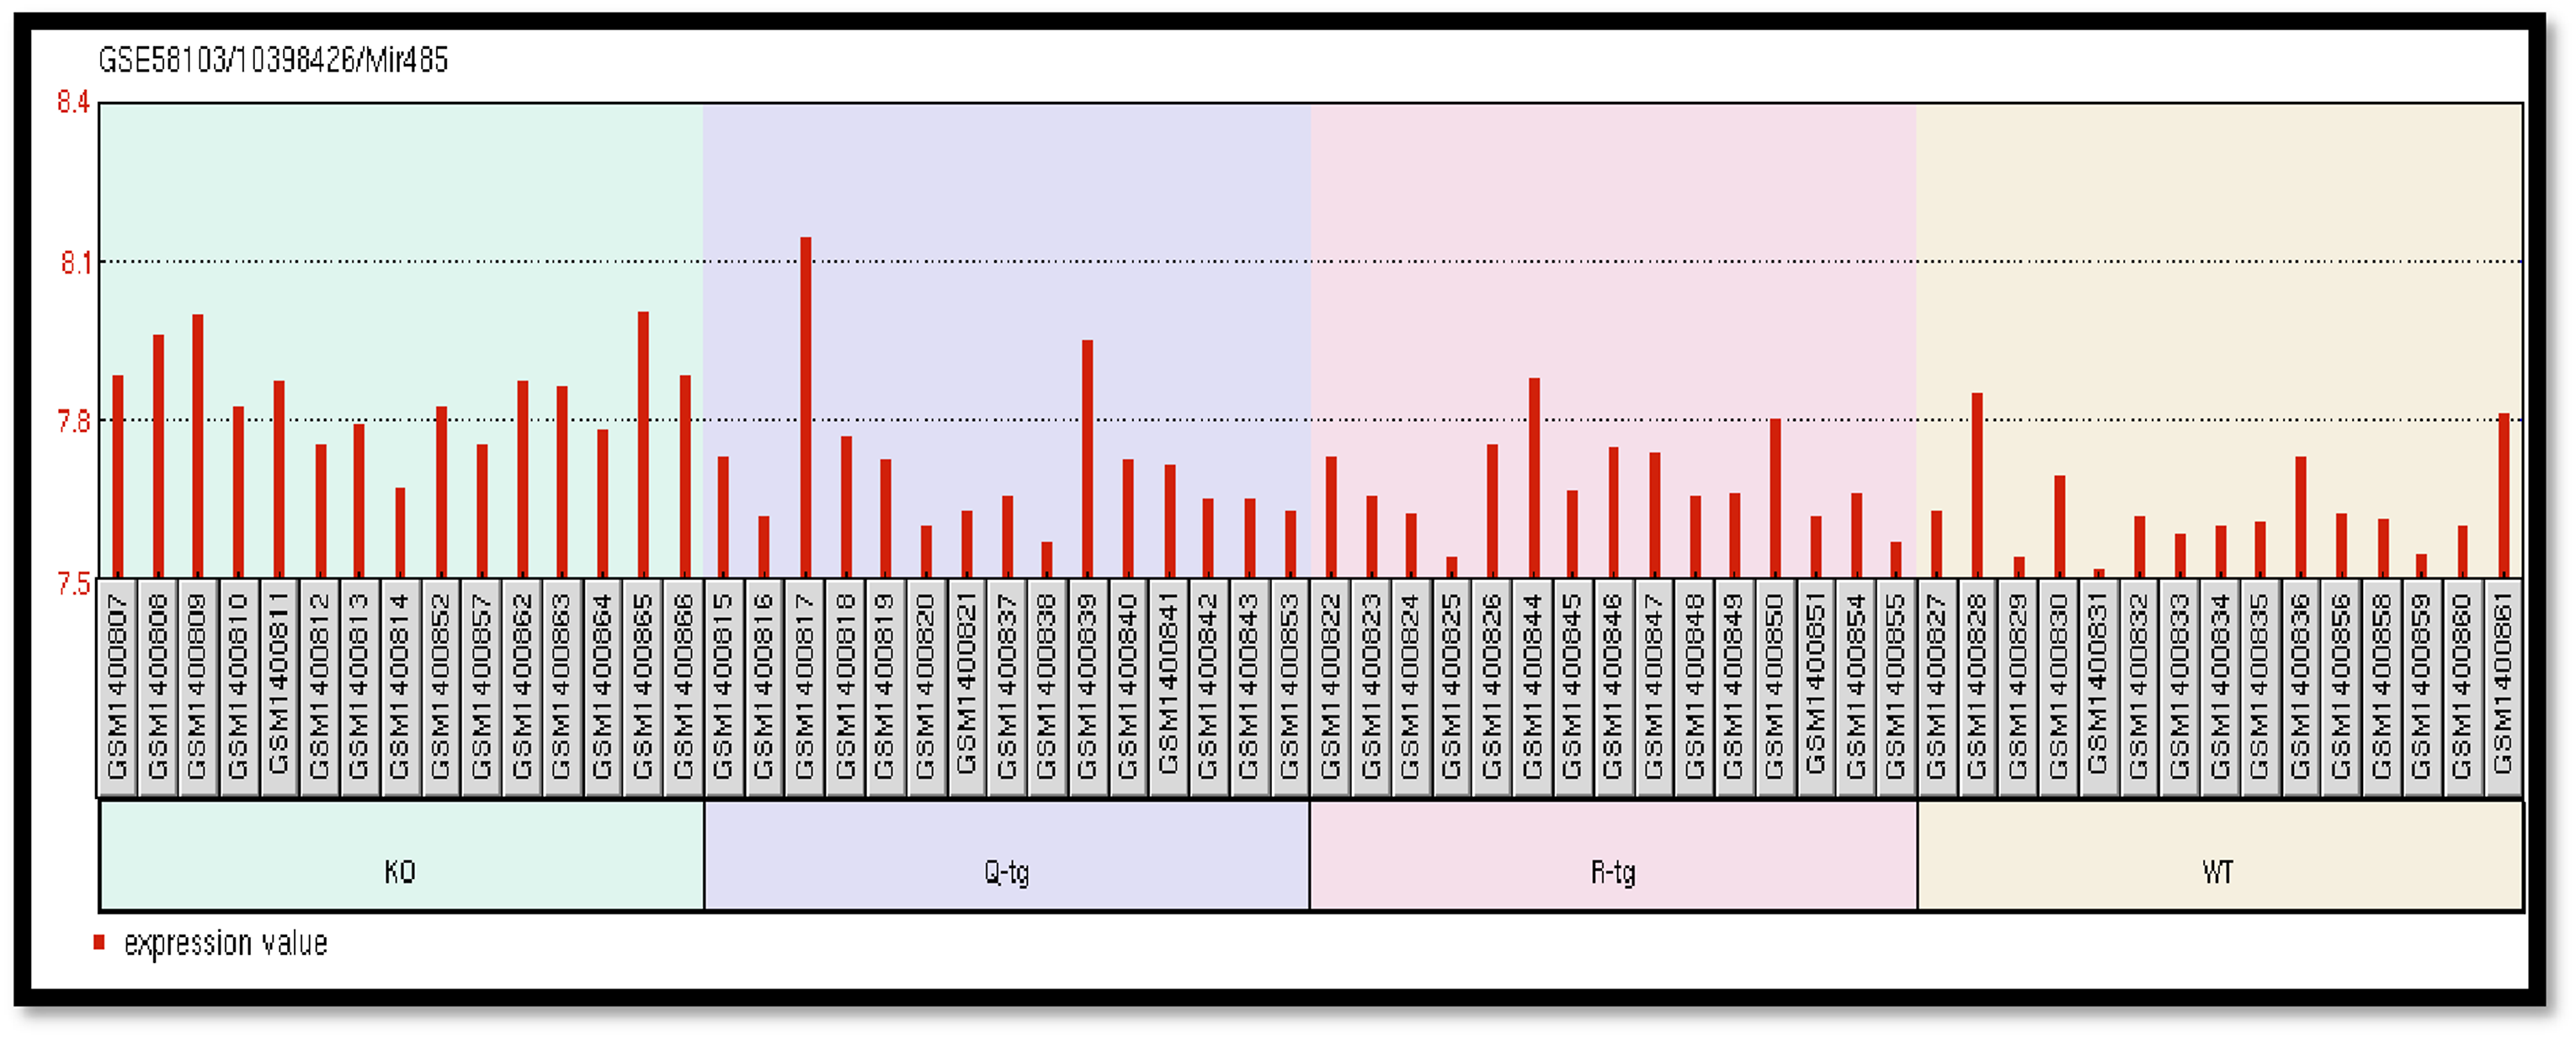
Difference between the expression level of specific gene 10398426 in KO, Q-tg, R-tg and WT group samples. Figure 4. show differential expression levels of the gene 10398426 in KO, Q-tg, R-tg, and WT groups are present in Figure 4.
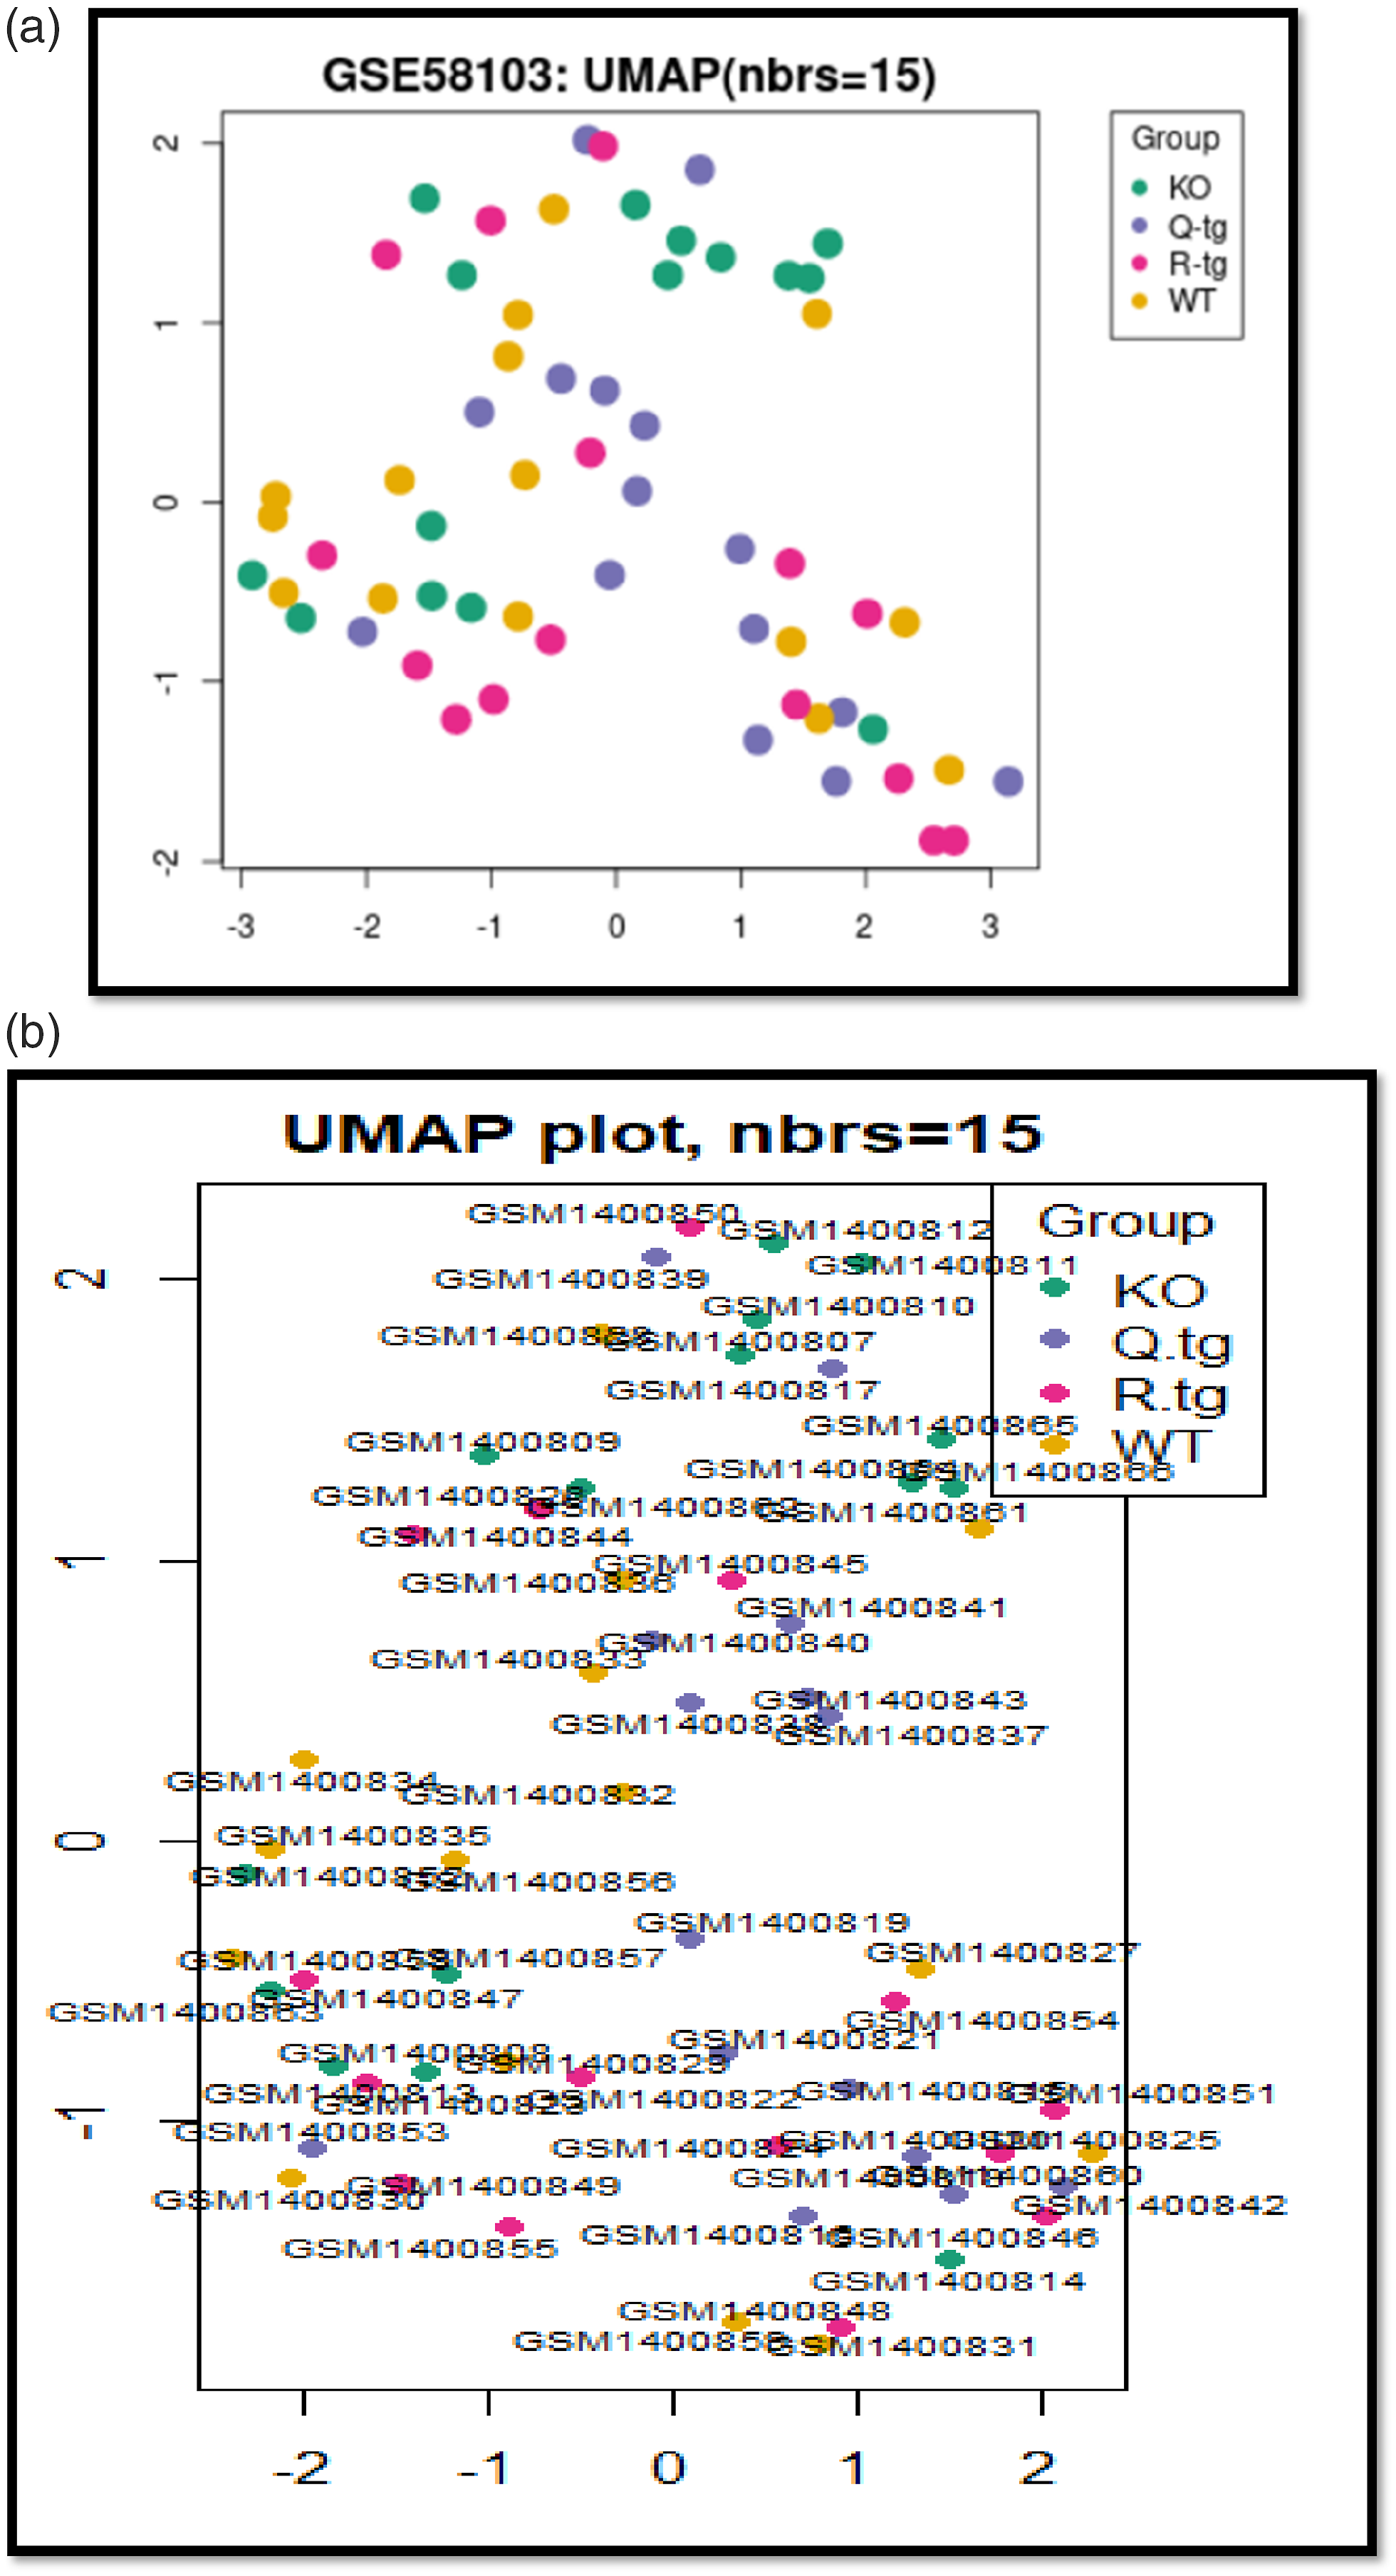
Dependency of KO, Q-tg, R-tg and WT group samples with and withouth detailed information regarding sample numbers via UMAP plot. (a) Dependency of KO, Q-tg, R-tg and WT group samples without detailed information regarding sample numbers via UMAP plot. Figure 5(a) Show clustering and separation of different groups based on their expression profile without detailed sample numbers are present on the UMAP plot. (b) Dependency of KO, Q-tg, R-tg and WT group samples with detailed information regarding sample numbers via UMAP plot. Figure 5. Show Relationships and dependencies on the UMAP plot are present for 10398426 in KO, Q-tg, R-tg, and WT group samples with and without detailed information. Figure 5(b) show granulation and visualization of sample dependencies among KO, Q-tg, R-tg, and WT groups with detailed UMAP plots are present on the UMAP plot.
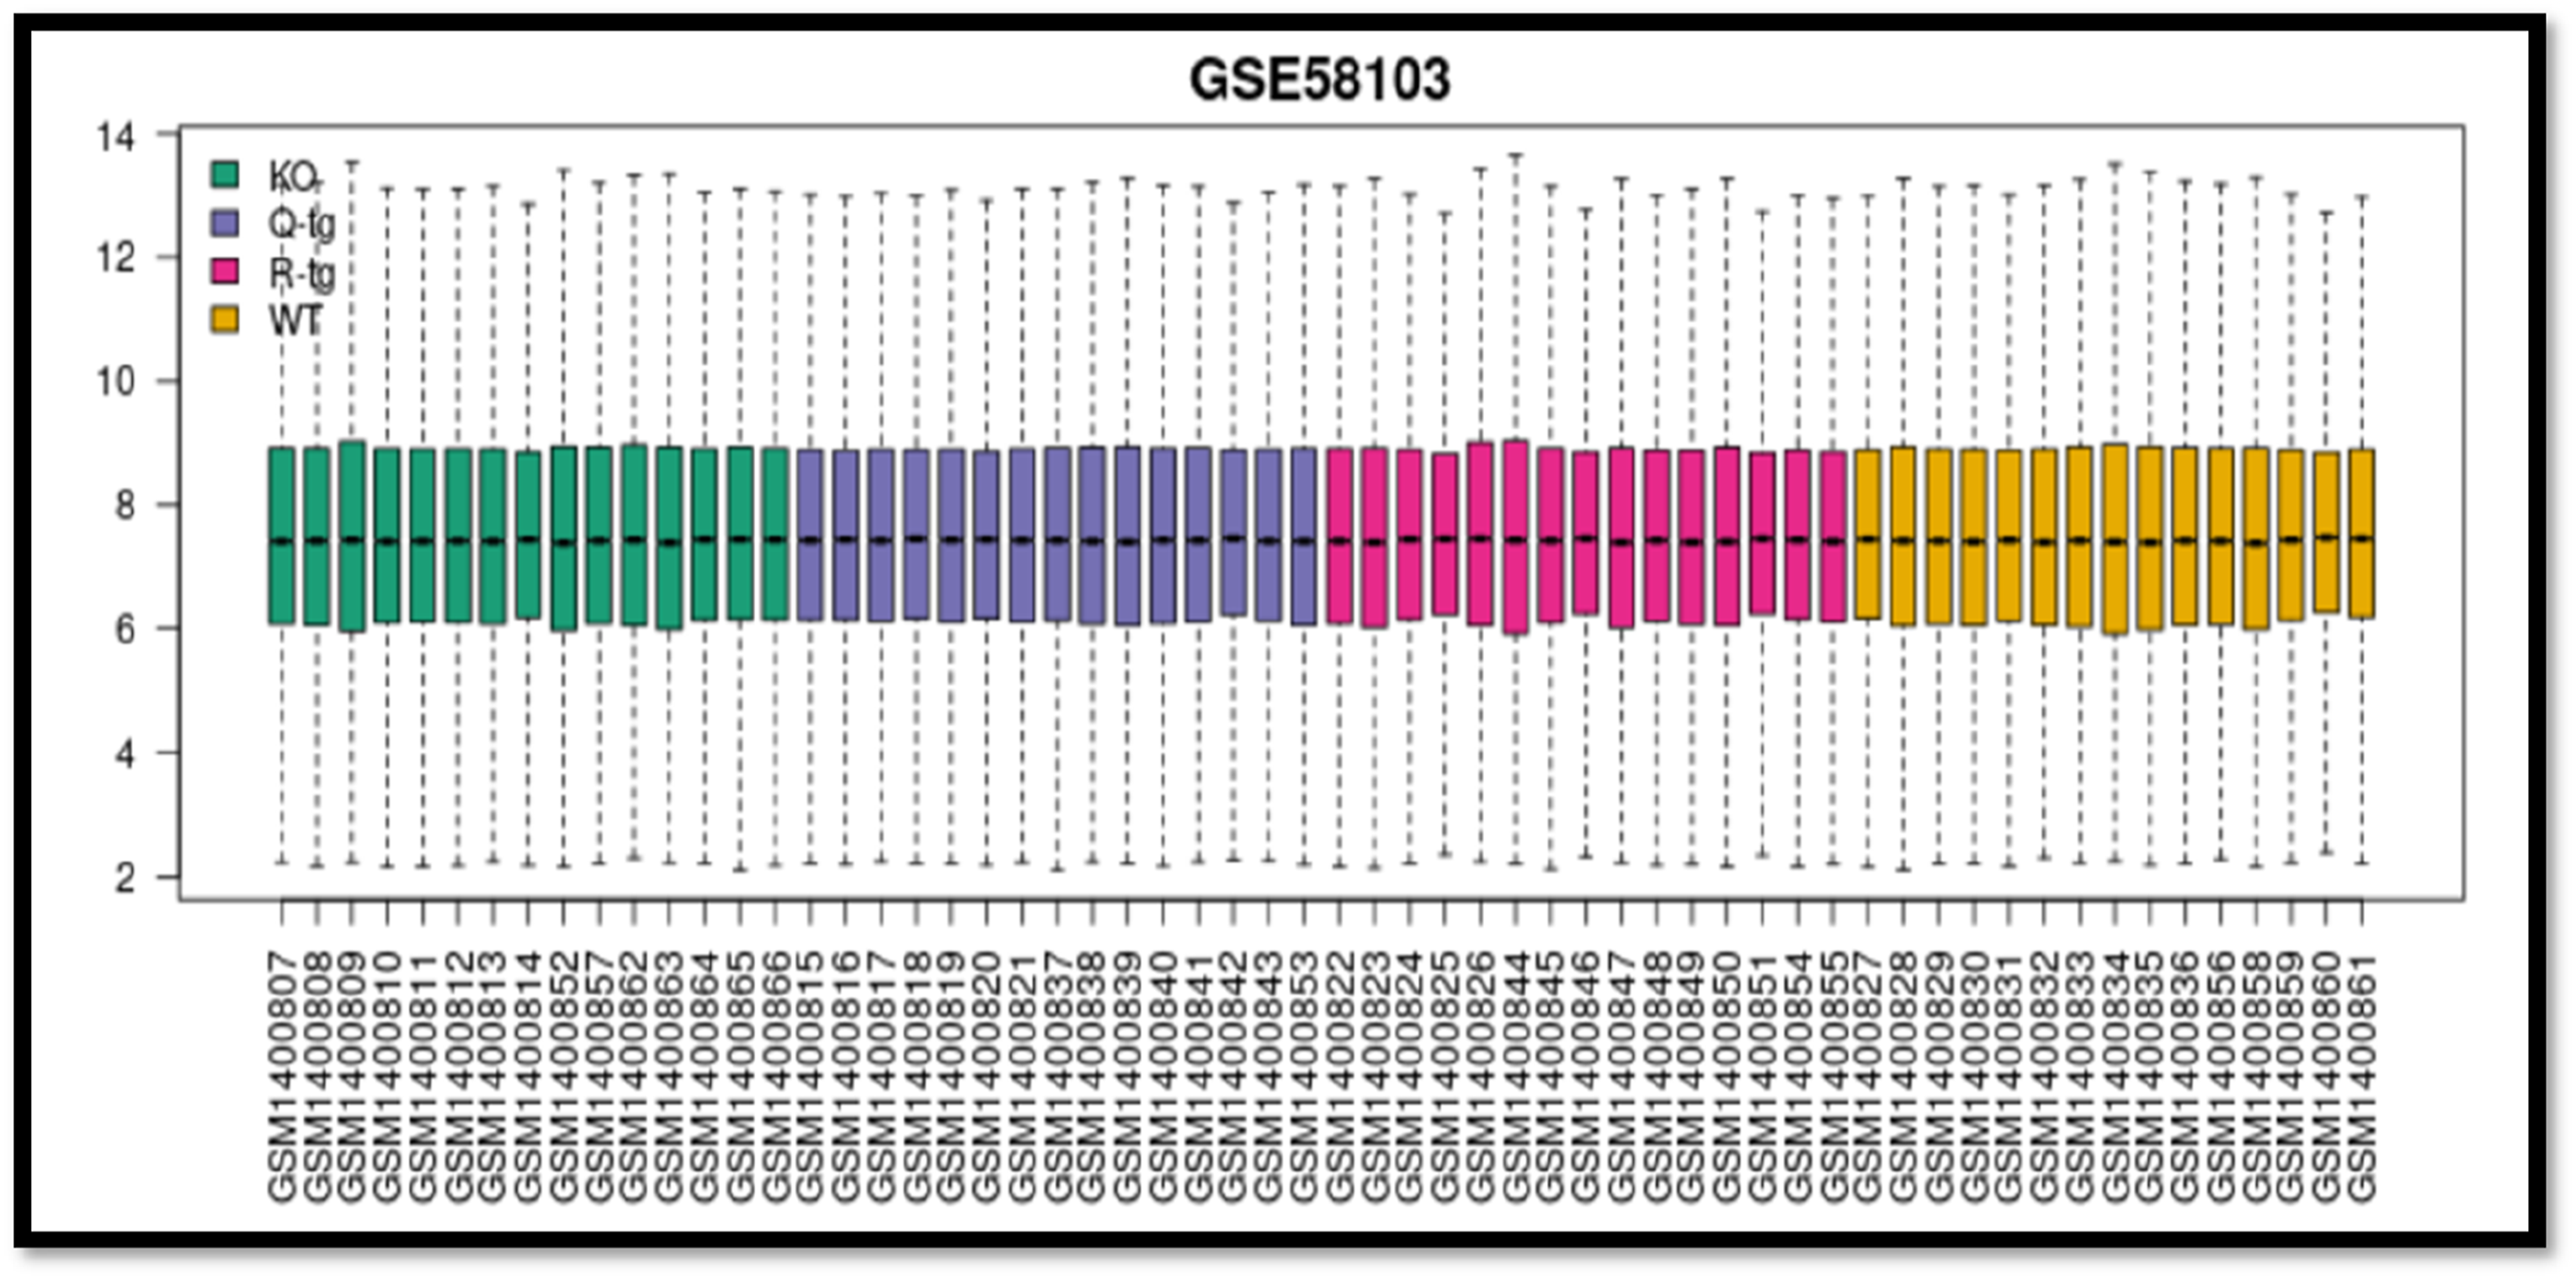
Boxplot graph comparing basic statistics for all RNA molecules depending on the murine group samples, KO, Q-tg, R-tg and WT. Figure 6. show basic statistical measures (e.g., median, quartiles) of RNA molecules of the different murine sample groups (KO, Q-tg, R-tg, WT). Are present in a boxplot comparing basic statistical measures.
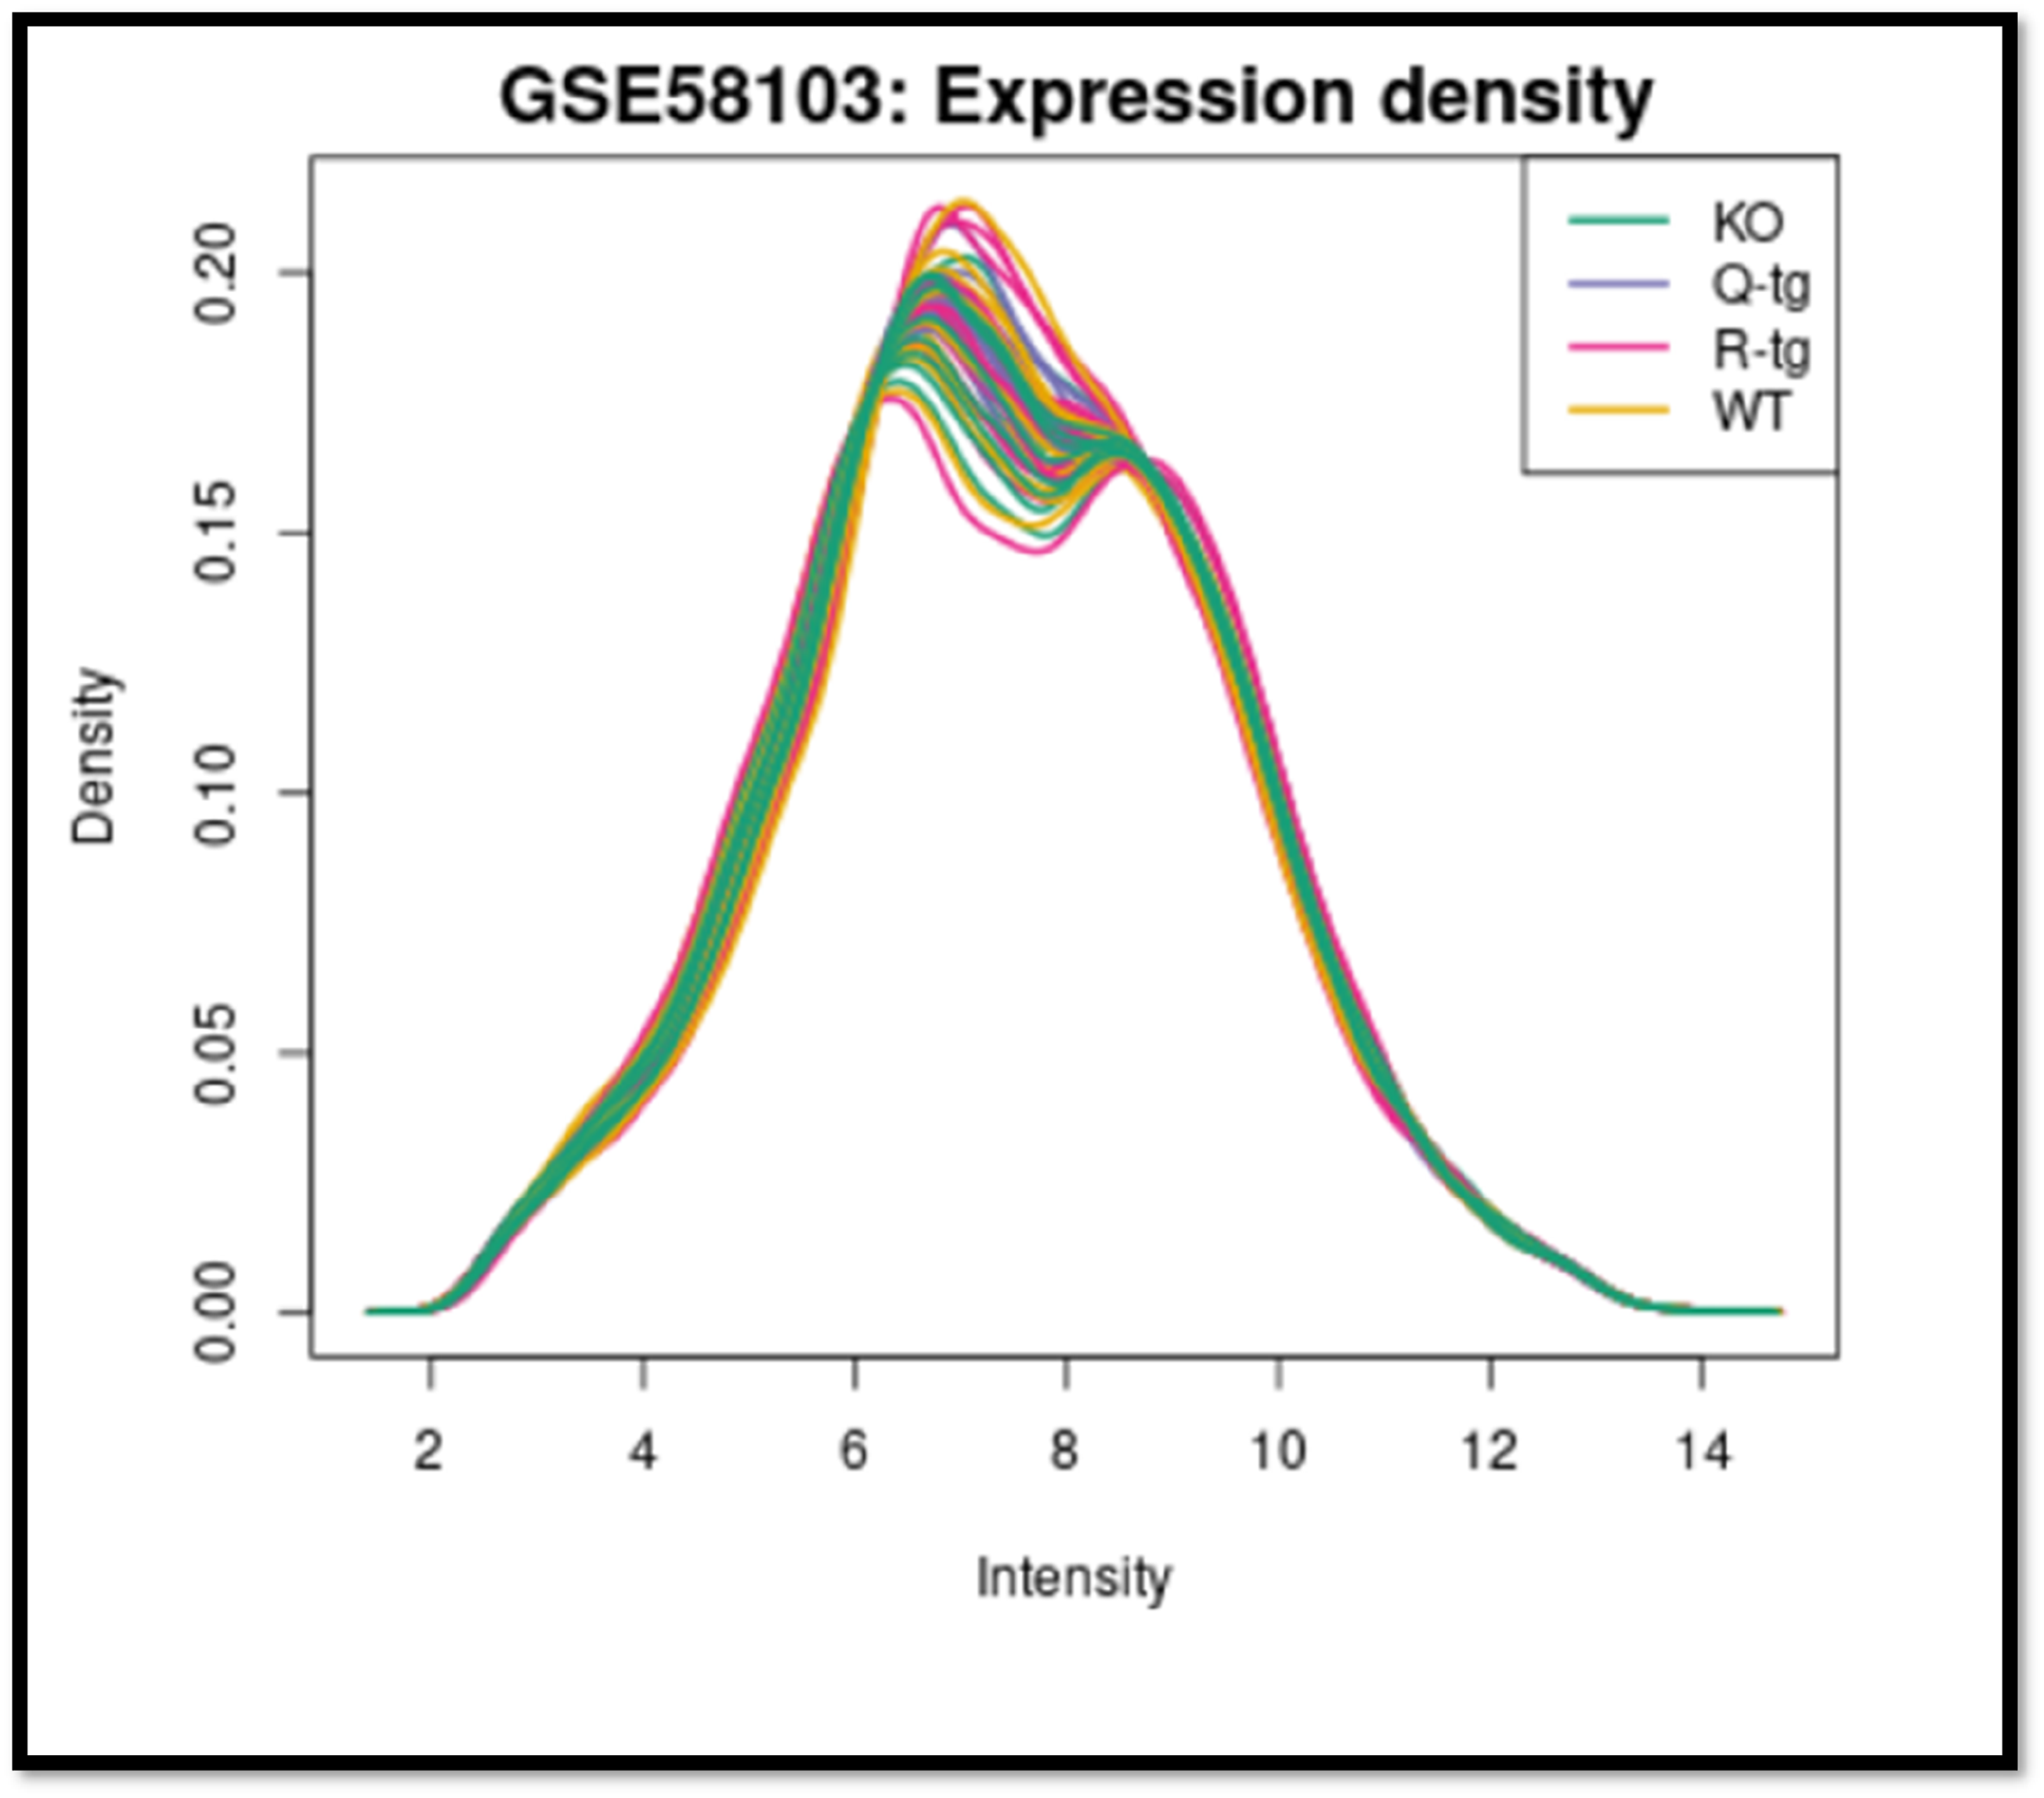
Expression density plot of total RNA molecules in KO, Q-tg, R-tg and WT groups comparing the intensity and density of 60 samples. Figure 7. show the intensity and distribution of RNA molecule expression in KO, Q-tg, R-tg, and WT groups across 60 samples are compared in the density plot.
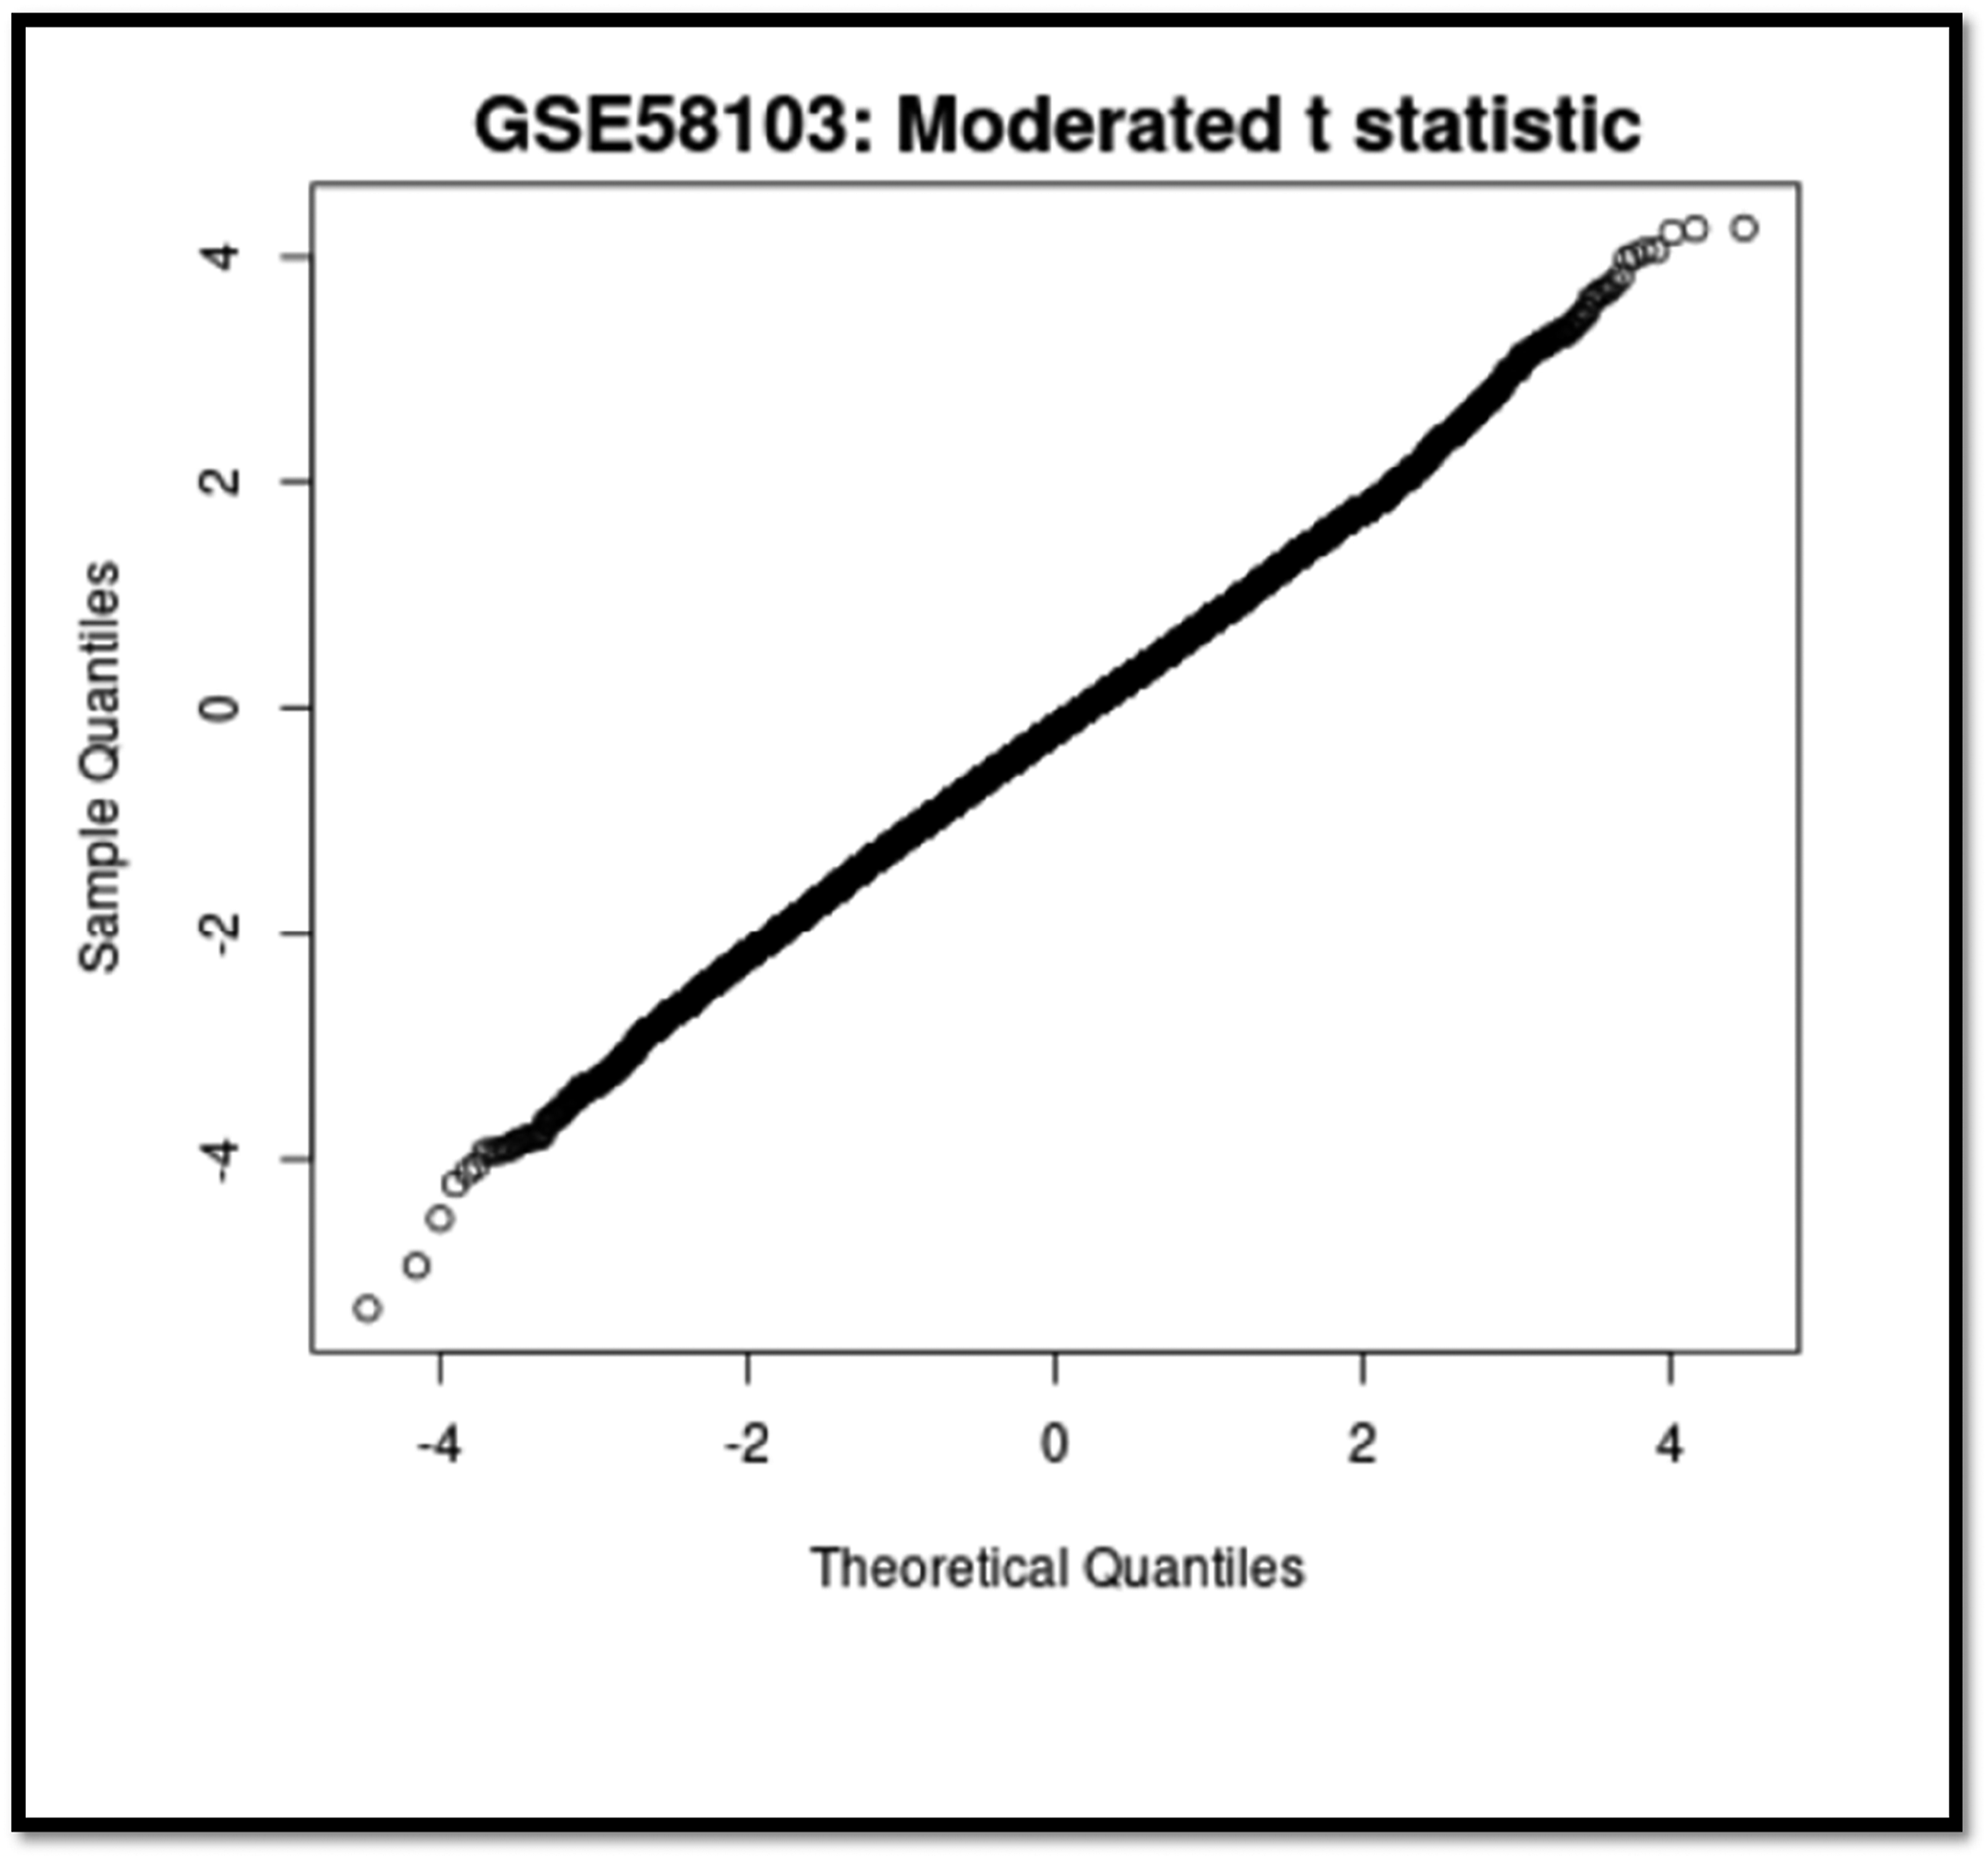
Q-Q plot of all four sample groups in a murine model system. Figure 8. show RNA expression data from all four sample groups assesses the normality and distributional differences among the groups by comparing quantiles on a Q-Q plot.
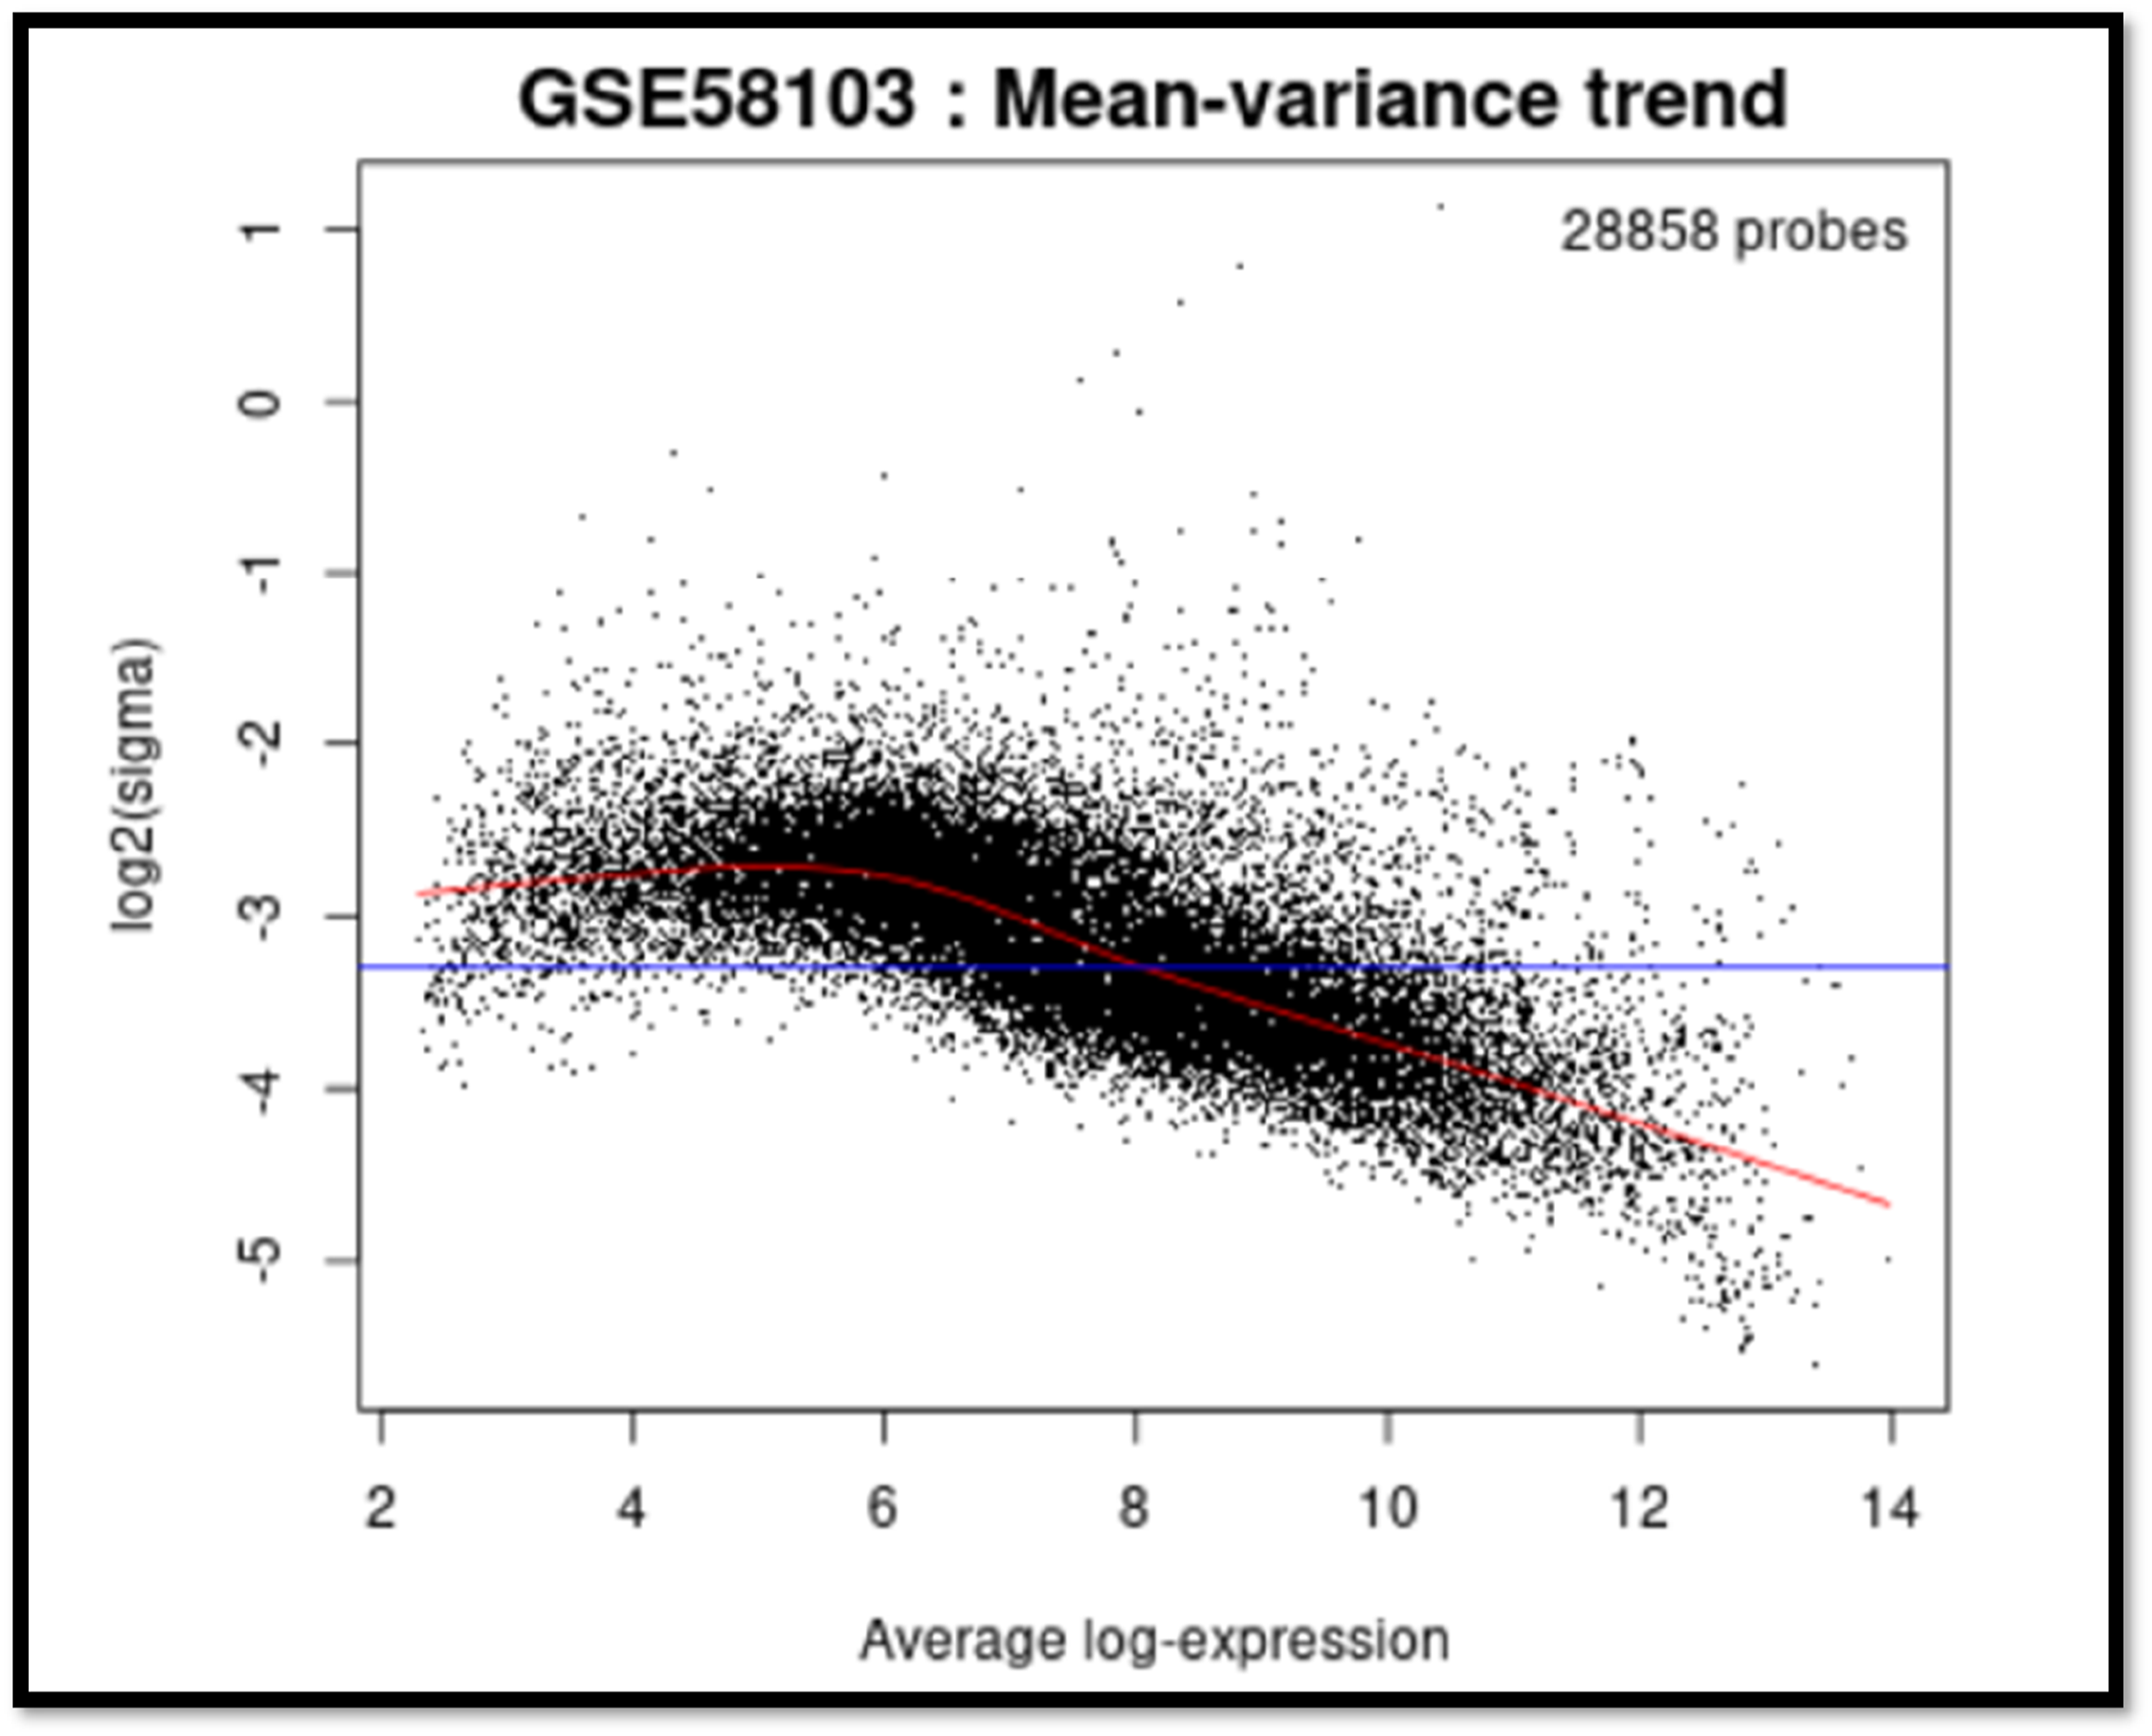
Mean-variance trend plot of murine samples. Figure 9. show the relationship between the mean expression levels and the variance in the data for the murine samples provides insights into the consistency and variability of gene expression across all groups on the mean-variance trend plot.
Values of 10398426 RNA in all four sample group types.
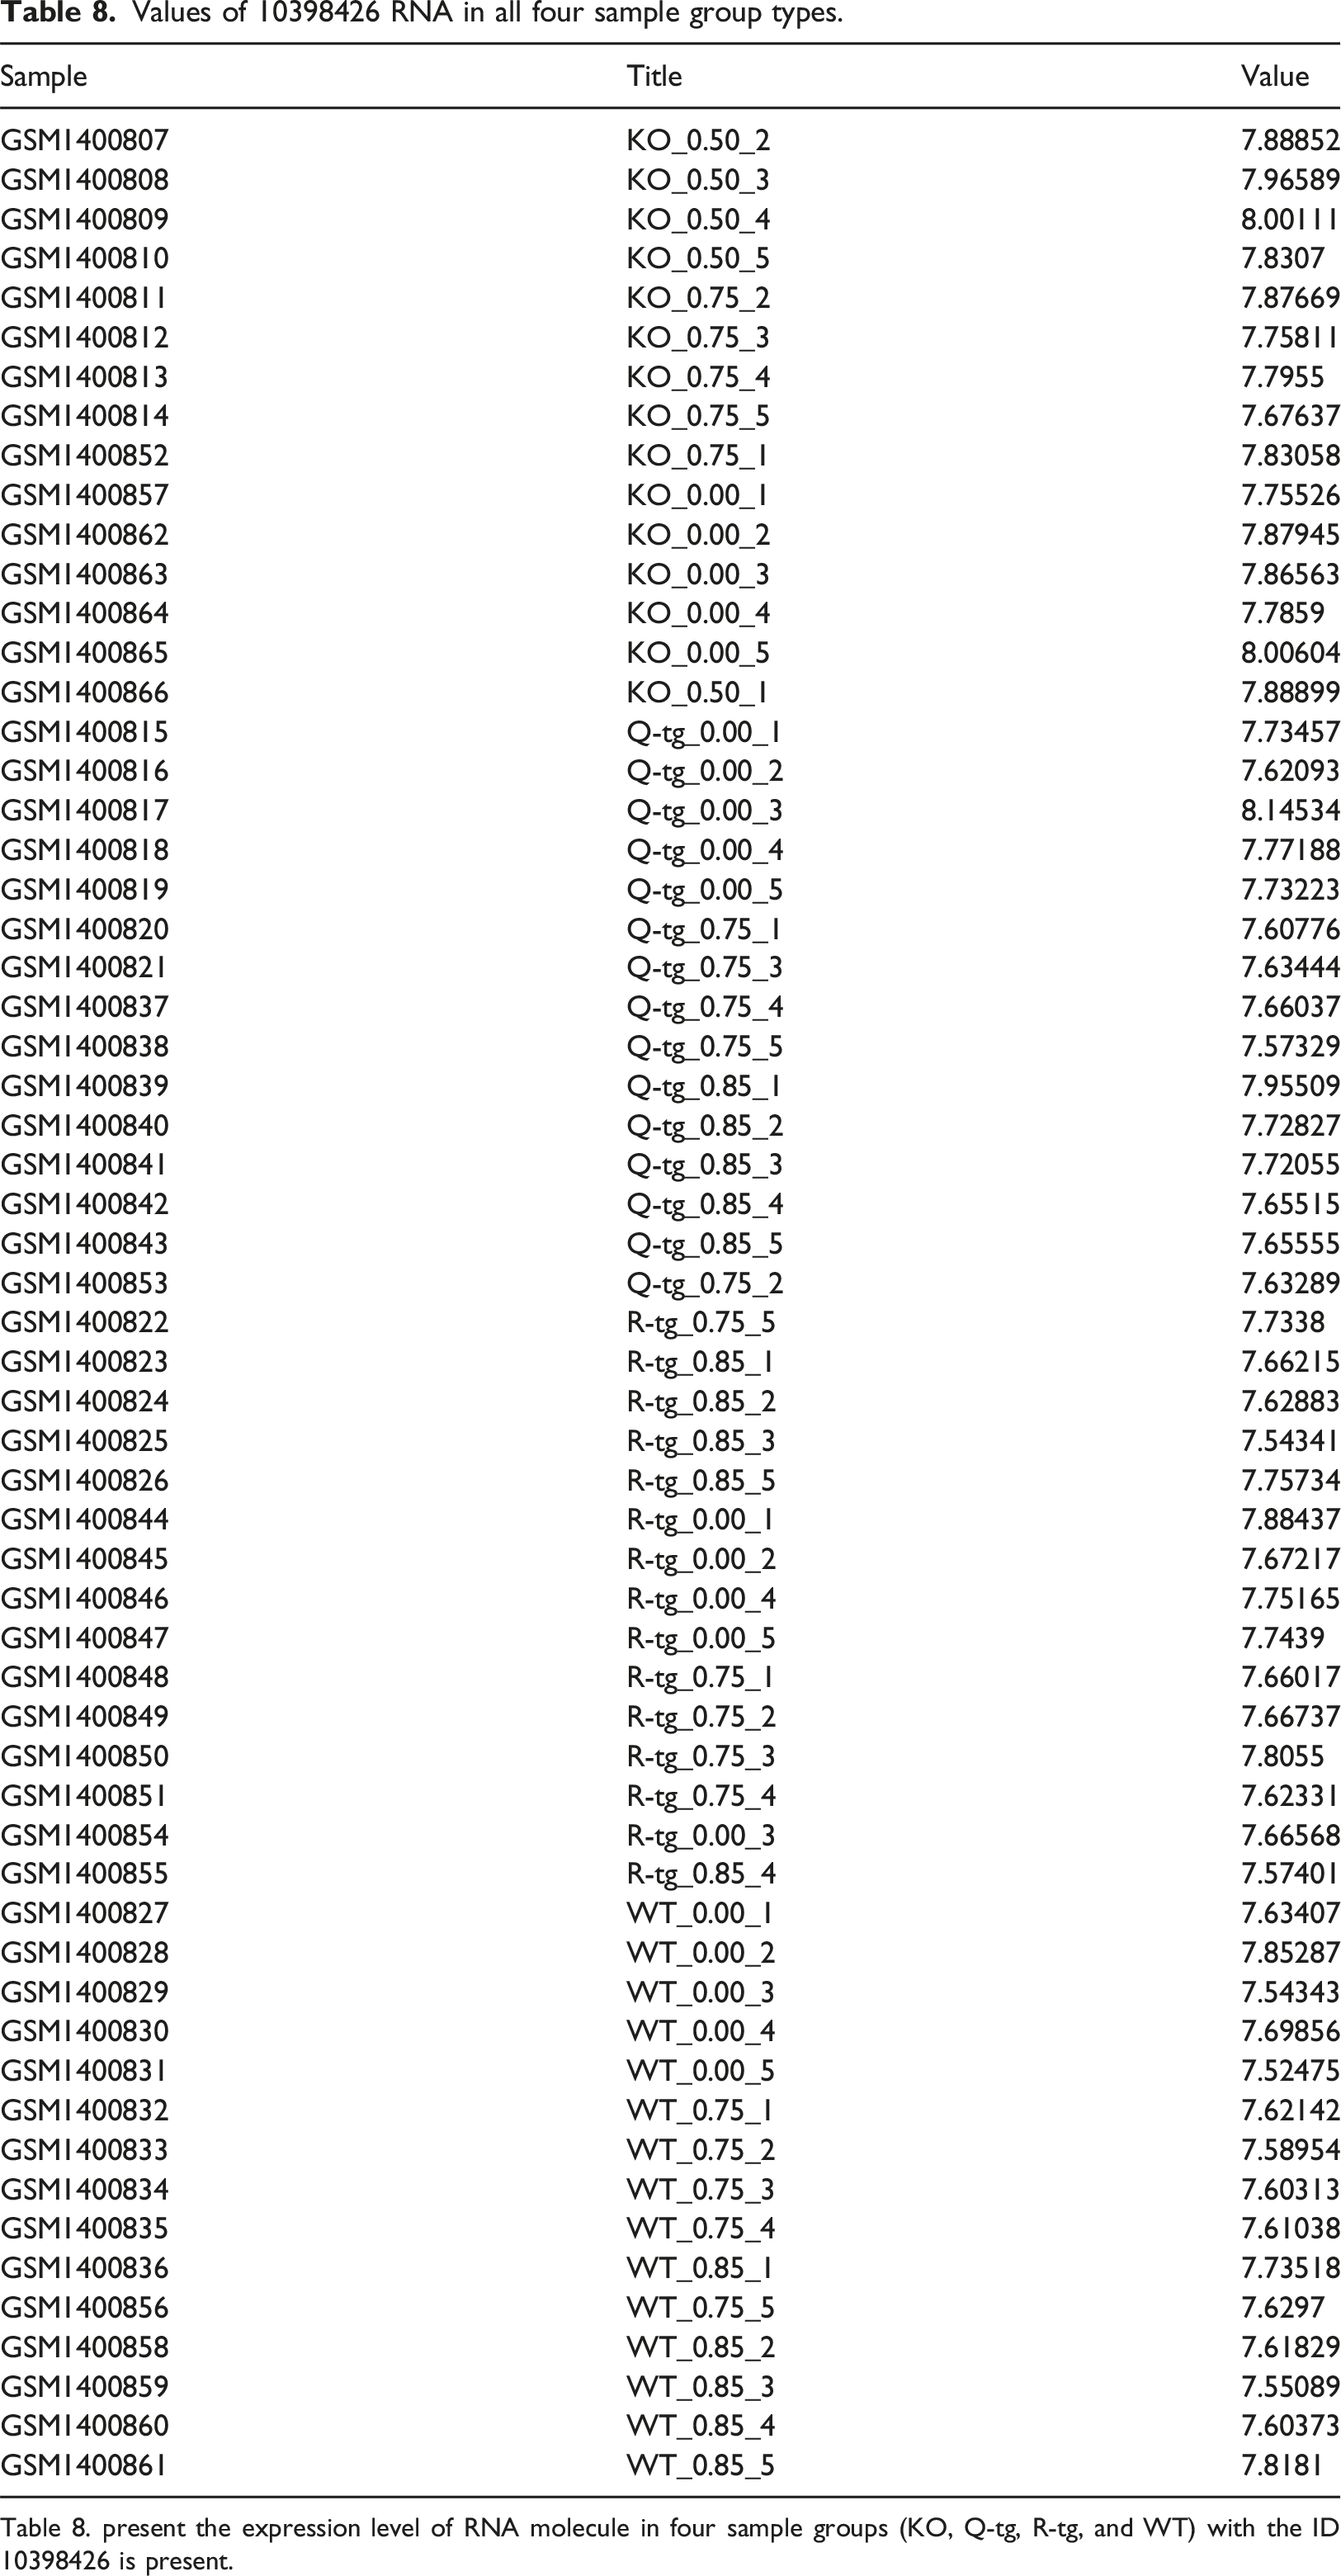
Table 8. present the expression level of RNA molecule in four sample groups (KO, Q-tg, R-tg, and WT) with the ID 10398426 is present.
Quality control check
During quality control check boxplot, histogram, and MA plot illustrate the distribution of expression before and after normalization, where data preprocessing normalized data matrix and probe filtering. Figure 10 shows an example of an MA plot with differential expression before and after normalization. Table listing DEG with associated p values, fold changes, and P adj values are present along with volcano plot and heat map, showing significance and magnitude of upregulated microRNA485 in PON-1 KO compared to WT. Significantly downregulated genes don’t exist, and when comparing other groups, no significant difference is present, but other top DEG are present in Supplemental Material File 1. In the literature, in the case of the PON-1 gene, there are associated upregulated genes such as Gpx1 (Glutathione Peroxidase 1), SOx2 (SRY (Sex-Determining Region Y)-Box 2), and Neurod1 (Neuronal Differentiation 1) and downregulated genes like Apparat (Peroxisome Proliferator-Activated Receptor Gamma), Nrxn1 (Neurexin 1), and Syn1 (Synapsin 1). Quality control check. MA plot with differential expression before and after normalization. Figure 10 assess data quality normalization at the beginning of the study.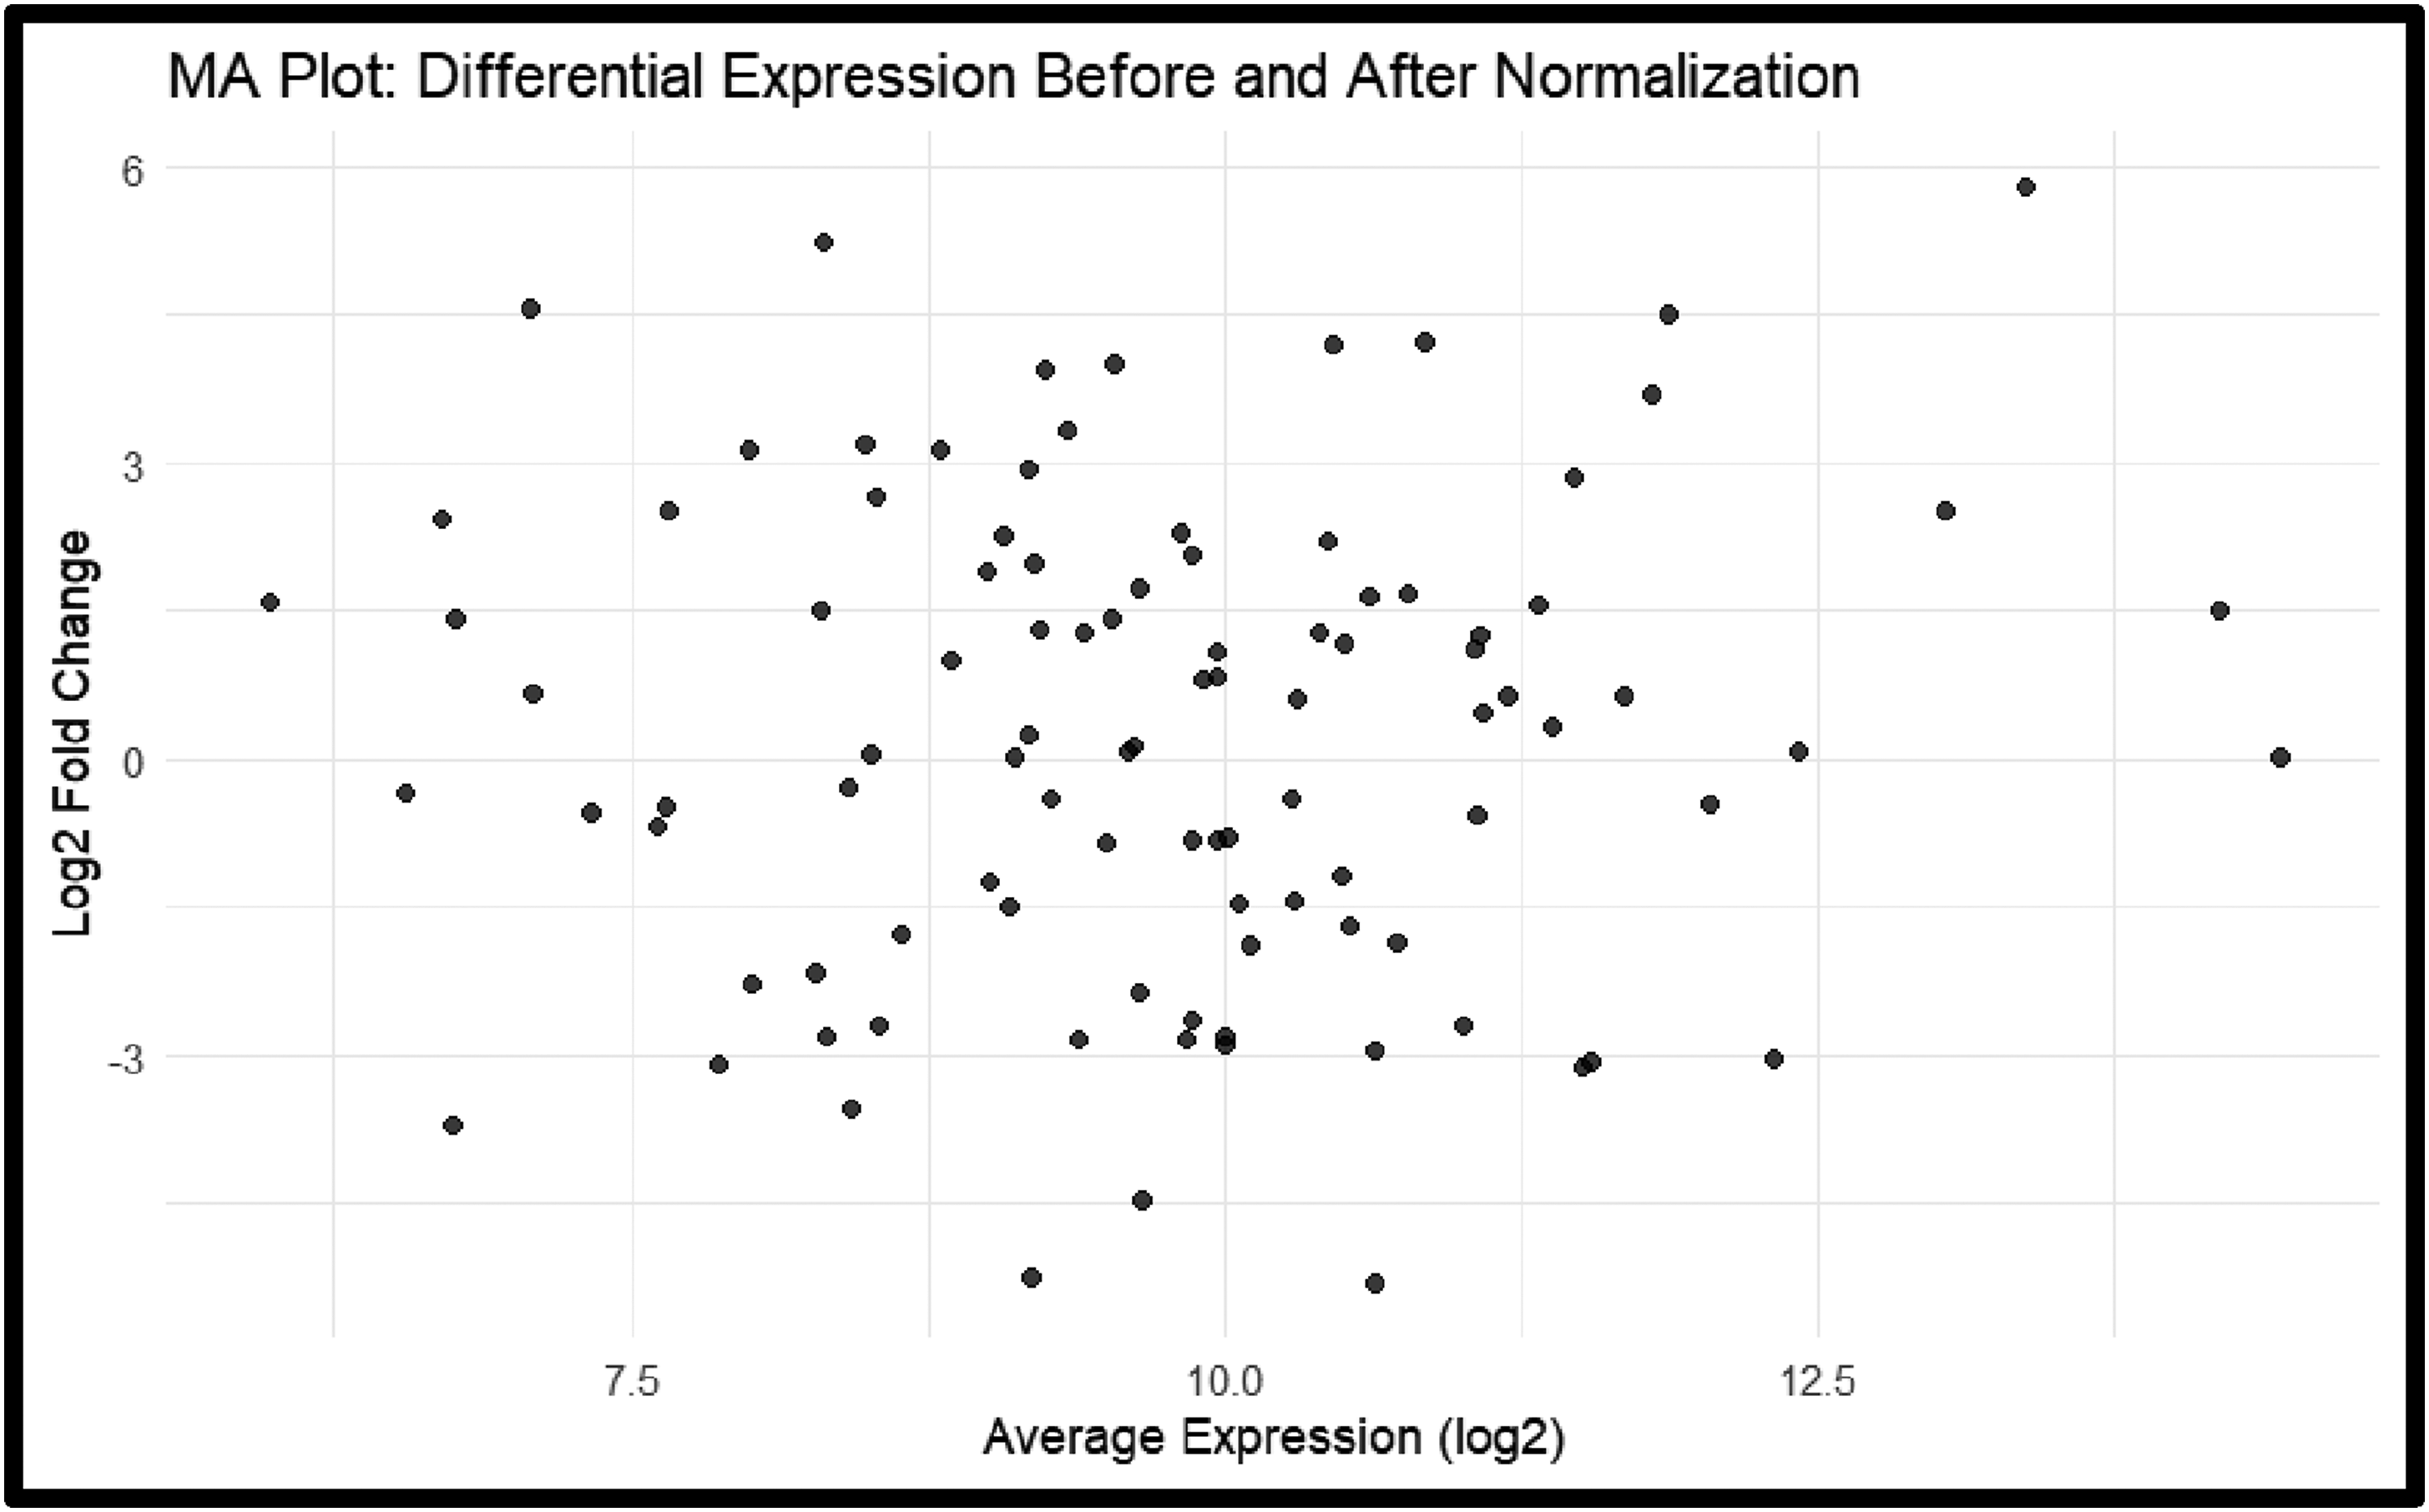
Functional enrichment analysis
Functional enrichment analysis provides significantly enriched KEGG pathway and a visualized presentation. The biological processes in the functional enrichment analysis study include the involvement of microRNA485 in the KO group in the cellular response to stress, neurodevelopmental processes, antioxidant activity, signal transduction with key pathways like PI3K/AKT, MAP/ERK (Mitogen-Activated Protein/Extracellular Signal-Regulated Kinase pathway), Wnt/β-Catenin Pathway (Wnt signaling pathway involving β-Catenin), TGF-β/Smad Pathway (Transforming Growth Factor Beta/Smad signaling pathway), and NF-κB (Nuclear Factor Kappa-Light-Chain-Enhancer of Activated B cells) Pathway. miR-485 plays a significant role in post-transcriptional regulation of gene expression in various stresses (oxidative, Endoplasmatic reticulum (ER), DNA) influencing generation of ROS (Reactive Oxygen Species), protein folding, singlaing, cell cycle and apoptosis. Neurodevelopmental processes are confirmed in the case of miR-485 molecules since they target a large group of genes involved in neuronal differentiation, neurite outgrowth, and synaptogenesis. These genes include cell cycle regulation, neuronal transcription factors, cell adhesion, cytoskeletal dynamics and signaling pathways, oxidative stress, apoptosis, and cell survival influencing neuronal differentiation. miR-485 has anti-inflammatory effects and antioxidative activity by targeting components of the Nrf2 (Nuclear factor erythroid 2–related factor 2) signaling pathway, reducing the accumulation of ROS by enhancing antioxidative capacity, and regulating gene expression of antioxidative enzymes like SOD (Superoxide Dismutase), GPx, and HO-1 (Heme Oxygenase 1). miR-485 makes feedback loops by interacting with receptors (tyrosine kinase, cytokine), regulatory proteins, kinases, transcription factors, and genes from signaling networks and pathways (PI3K/AKT, MAPK/ERK, Wnt/β-catenin, or NF-κB) affecting inhibition or amplification of signaling cascades. Moreover, miRNA-485 plays a significant role in neuronal migration, neurogenesis, and neuroprotection, influencing genes involved in cell proliferation, differentiation, survival, metabolism, embryonic development, tissue homeostasis inflammation, and immune response, making it a potential therapeutic for neurodevelopmental and neurodegenerative studies. Studies should explore the molecular mechanism and signaling pathway interaction of miR-485 in stress responses.
Network analysis
Network analysis reveals the interaction between proteins encoded by DEG and genes with the highest connectivity with the network and modules of highly interconnected genes. In this study, network analysis revealed 10. significant genes. For example, one gene is involved in neurodevelopment, interacting with various downstream effectors (BDNF), and another in antioxidative defense, interacting with detoxification, cell homeostasis, and scavenging ROS (Nrf2, SOD1). Genes like MAPT (Microtubule-Associated Protein Tau) and CREB1 (cAMP Response Element-Binding Protein 1) are involved in cytoskeletal dynamic, axon, and synaptic function targeting cAMP (Cyclic Adenosine Monophosphate) response elements modulating transcription. Genes like BCL2 (B-Cell Lymphoma 2), NFKB1 (Nuclear Factor Kappa B Subunit 1), PTEN (Phosphatase and Tensin Homolog), TNF (Tumor Necrosis Factor), and AKT1 (Protein Kinase B pathway), are involved in pathway regulation (cell growth, proliferation, survival, inflammation, PI3K/AKT (Phosphoinositide 3-Kinase/Protein Kinase B pathway) interacting with proteins (pro-apoptotic, anti-apoptotic, mitochondrial), signaling molecules, immune activation and cytokine production, glucose metabolism, and apoptosis.
PPI network
PPI network highlights the interaction of oxidative stress genes and neurodevelopment and crosstalk between signaling pathways, mitochondria, and epigenetic regulation. Antioxidant enzymes (SOD1, catalase, Gpx) modulate the activity of neurodevelopmental proteins, affecting the maintenance of redox balance and protecting against oxidative stress damage during neurodevelopment. Antioxidative gene Nrf2 affects proteins involved in the neurodevelopmental signaling cascade (growth factors, neurotrophic factors, or synaptic proteins), affecting the regulation of oxidative stress responses signaling pathways. Inflammatory signaling (NF-κB, TNF) and neurodevelopmental protein pathways crosstalk exist, influencing cell survival, proliferation, migration, and synaptic plasticity. Mitochondrial Function and Neurodevelopment are under the control of mitochondrial function and energy metabolism (e.g., mitochondrial electron transport chain components, mitochondrial dynamics regulators) interaction with neurodevelopmental proteins affecting neuronal growth, differentiation, and function. Epigenetic regulation and neurotrophic factors like BDNF and NGF (Nerve Growth Factor) influence oxidative stress and neurodevelopment with histone modification and DNA methyltransferase. PPI study highlights oxidative stress and neurodevelopment crosstalk between significant molecules, genes, and pathways, enabling the identification of potential therapeutic targets for disease treatment.
Predictive machine learning models
Predictive machine learning models contain accurate ROC curves where the list of potential biomarker candidates has valid metrics confirming the findings indicating increased upregulation of miR-485 in neuronal tissue exposed to CPF with target interaction genes revealed from network analysis (BDNF. Nrf2, SOD1, MAPT, BCL2, NFKB1, PTEN, AKT1, CREB1, TNF). Potential interaction genes with miR-485 are included in antioxidative defense (catalase, glutathione peroxidase), oxidative stress pathways (Nrf2), synaptic plasticity (e.g., Synapsin, PSD-95), neurogenesis (e.g., Nestin, Doublecortin) and neuronal survival (e.g., Survivin, Bcl-xL). Predictive analysis revealed interaction of miR-485 with pro-inflamatory cytokines like TNF-alpha, (Inter Leukin-IL) IL-1β, IL-6, (Chemokine-CXCL) CXCL10, CCL2 (Monocyte Chemoattractant Protein-1, MCP-1), CCL5 (RANTES, Regulated on Activation, Normal T Cell Expressed and Secreted), (Cluster of Differentiation-CD) CD68, CD3, CD11b influencing cholinergic, dopaminergic and glutamatergic system. The predictive machine learning model revealed potential biomarker validity for further experimental interaction validation in CPF poisoning.
Model performance
Model performance enables expression differentiation of WT and KO based on oxidative stress genes. The confusion matrix in R evaluates the prediction model performance between WT and KO based on sample expression information. The assumption is that we have the true labels (actual genotype) and predicted labels (predicted genotype) stored in vectors. The code creates a confusion matrix by calculating the accuracy. The labels are adjusted with appropriate data, providing a breakdown of the number of samples classified correctly (diagonal elements) and misclassified (off-diagonal elements) for each genotype class where the accuracy of a predictive model indicates a proportion of correct classified samples.
Code
[
conf_matrix <- table(Actual = true_labels, Predicted = predicted_labels)
print(conf_matrix)
accuracy <- sum(diag(conf_matrix))/sum(conf_matrix)
print(paste(“Accuracy”, accuracy))
]
The model accuracy is 1 (100%), meaning correct prediction for all samples in the data set, classifying it based on expression level into specific categories (WT, PON-1 KO). It is a perfect classification performance without false positive and negative results in prediction with effective capture of patterns and relationships in the data for genotype classification. We have a genotype prediction model regulated by miR-485 in sample groups, reliable classification, clinical utility, research insights, and validation confidence. To prevent sample overfitting, it is crucial to validate the performance of independent datasets for dependability and reliability in real-time data, highlighting the discriminatory power of selected molecules and target genes.
Classification of patients with WT and KO is easily distinguishable. Personalized risk assessment and stratification enable efficient identification of individuals with PON-1 deficiency, highlighting the significance of miR-485 in modulating antioxidative defense mechanisms and stress responses and highlighting translational potential.
ROC curves
ROC curves contain AUC values with strong predictive power between different genotypes of WT and KO based on expression profile, making a reliable distinction, where the model is not influenced by the training data generalizing good unseen data as presented in Figure 11. We can conclude that the AUC value and ROC curve have high robust discriminatory power between genotypes, supporting the clinical utility of the model in assessing PON-1 deficiency and related stress responses involving miR-485. ROC curve distinguishing WT and PON-1 KO mice based on the expression profile of oxidative stress gene. Figure 11 show ROC curve plotted for WT and PON-1 KO mice genotype. Comparison between true (sensitivity) and false (1-specificity) positive rates. The area under the ROC Curve (AUC value) is calculated for each curve with value 1, indicating better discriminatory power. The model can effectively distinguish two genotypes. x-axis- false positive rate (specificity); y-axis- true positive rate (sensitivity); point of the curve represents a different threshold for WT and PON-1 KO; the diagonal dash is the line of no discrimination as random classifier; curve bending towards the left corner indicate discrimination between genotypes; AUC value 1 is excellent discriminatory power showing the effectiveness of the predictive model based on the expression profiles of oxidative genes with high confidence.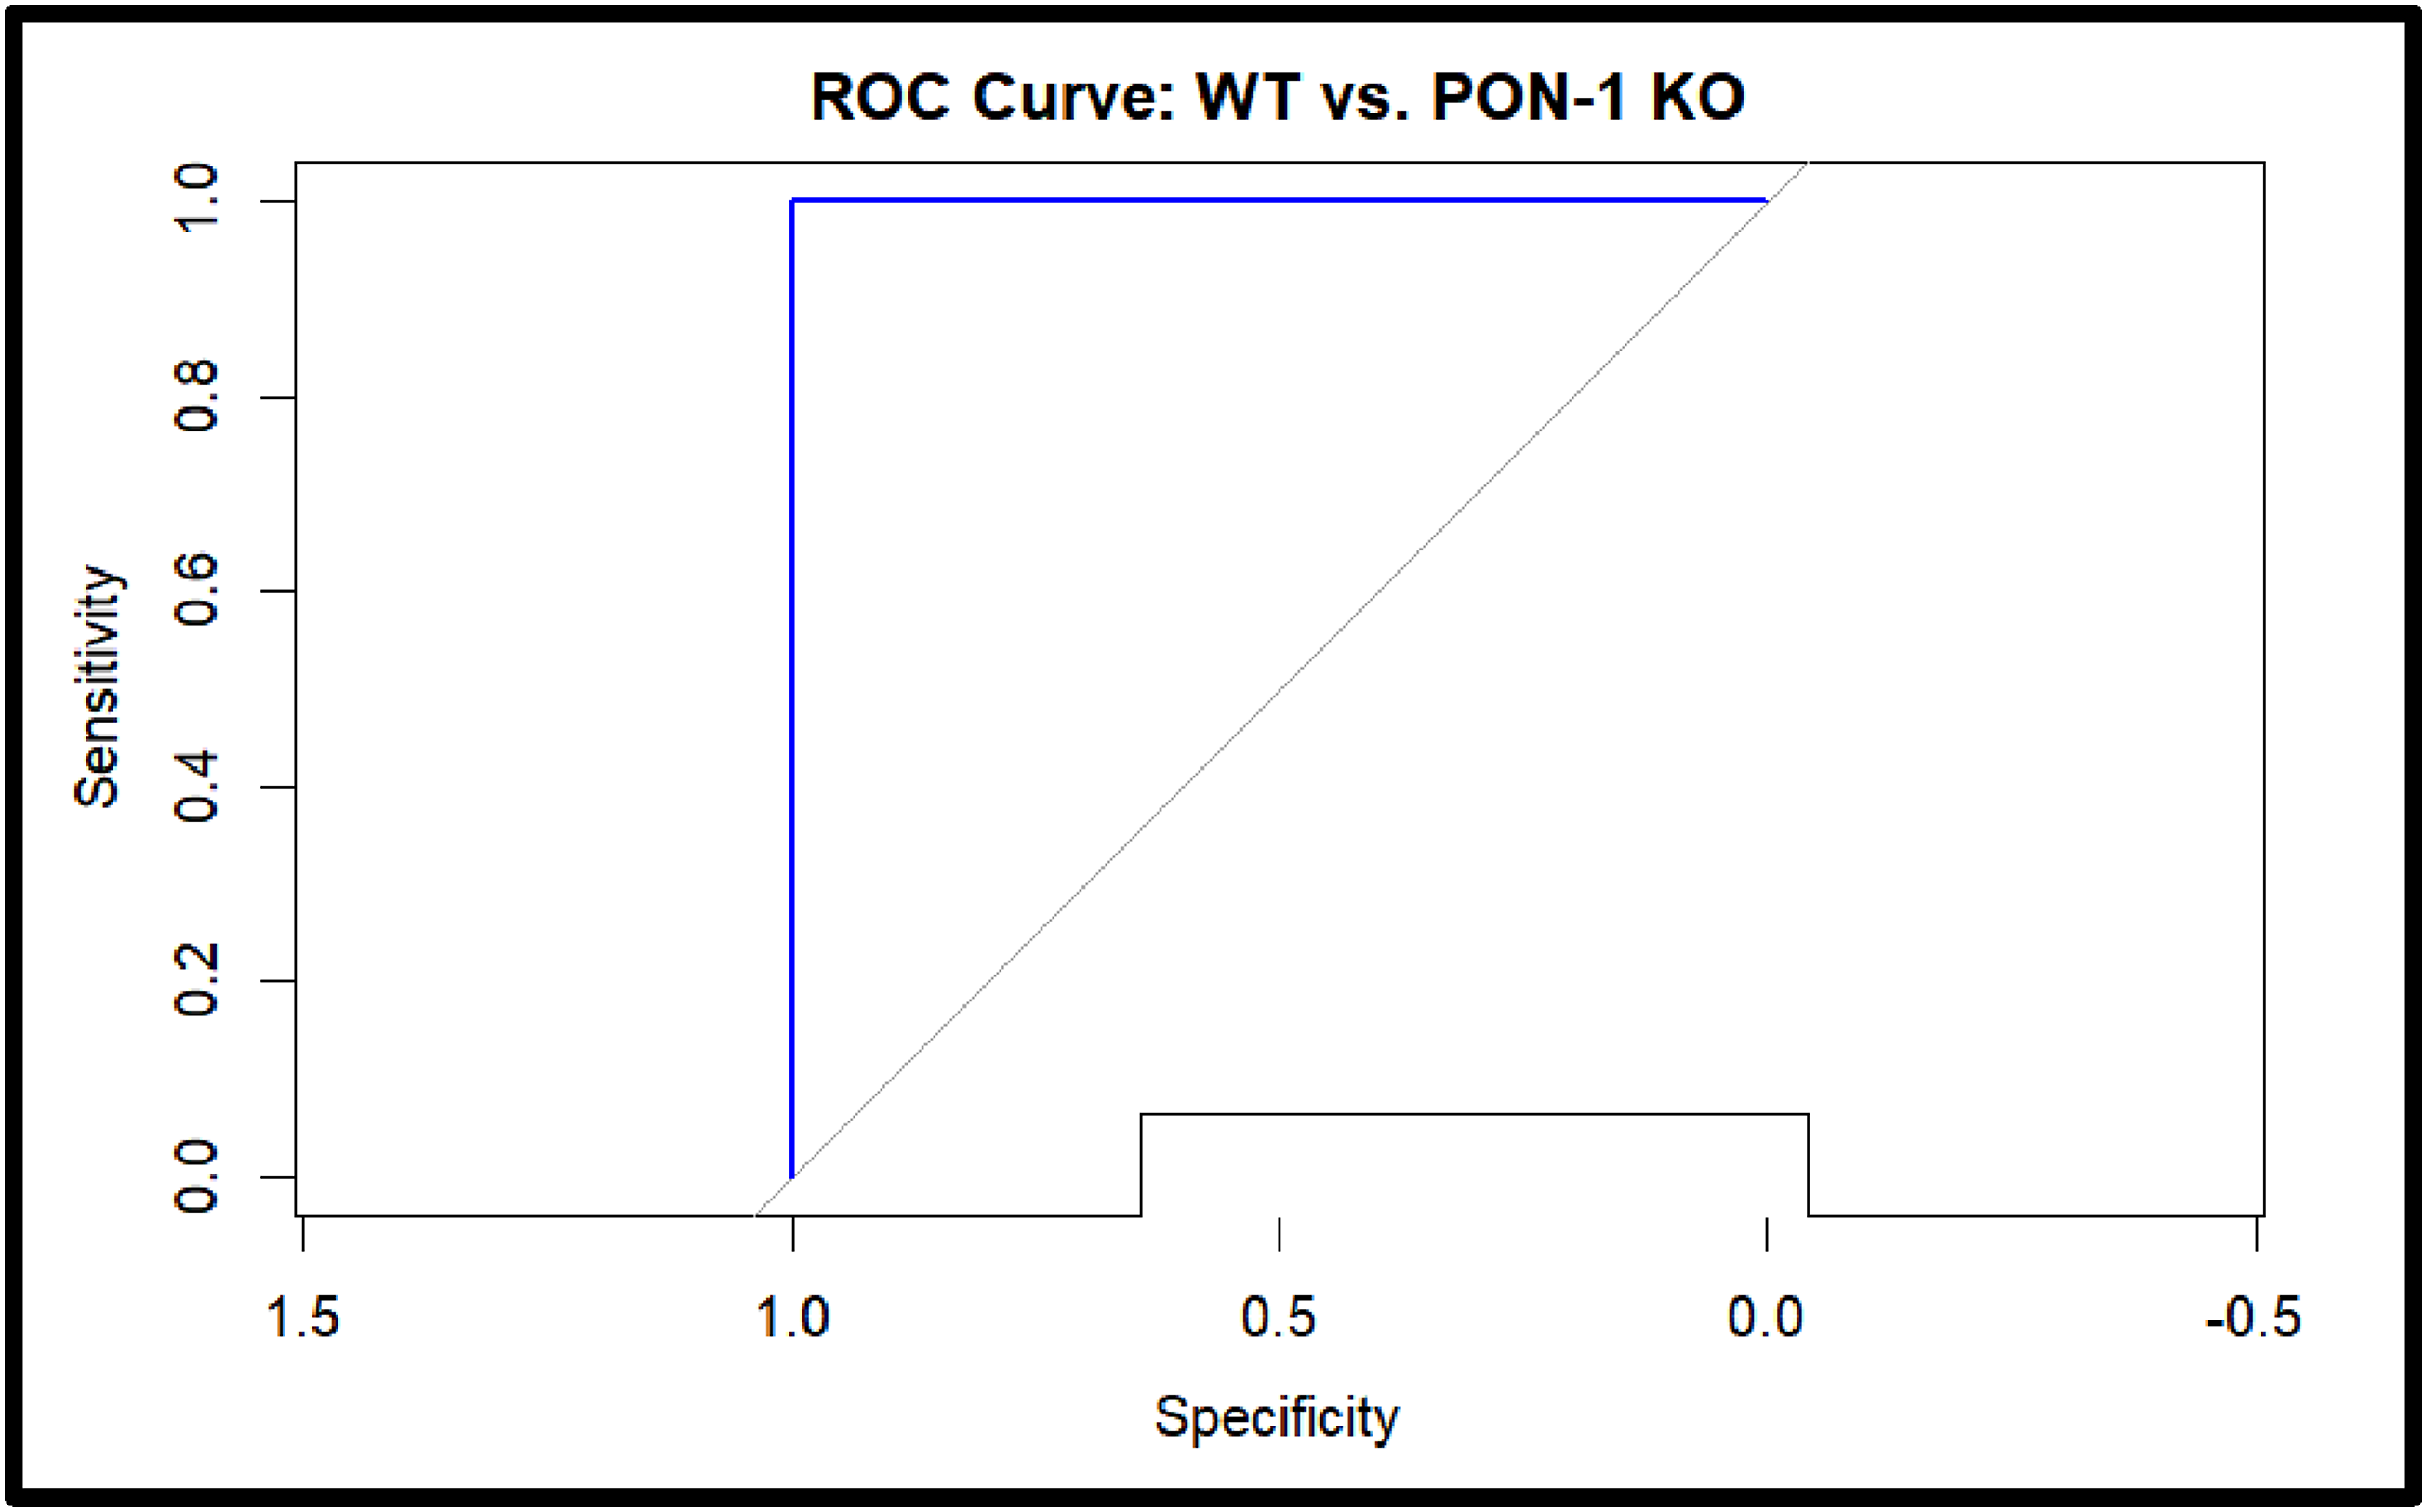
Based on the provided results in the Tables and Graphs, comprehensive insight into the genetic and biochemical impact of CPO exposure in mouse fetal brain focusing on PON1 is present. Changes in implications within diverse samples are present through detailed presentation across the whole manuscript. These manuscripts show an understanding of how exposure to chemicals significantly changes gene expression and leads to potential adverse effects in appropriate model organisms, making it reciprocal to humans.
Discussion
The background rationale of the study with methodology and findings present the influence of CPF on neurodevelopmental processes during the gestation period, influencing AChE inhibition, and synaptic ACh termination. OP exposure leads to the impairment of memory and learning, damaging cell components, activating microglia, and releasing proinflammatory cytokines.86–88 Mitochondria deficit, along with energy production, leads to Parkinson’s and Alzheimer’s disease accumulating misfolded proteins.89–91 ADHD (Attention Deficit Hyperactivity Disorder) and autism arise as a consequence of OP exposure. Information like this indicates the significance of public health in increasing knowledge and regulating OP exposure in the population. 92 Public health regulations should standardize laboratory protocols, regulatory approvals, and ethics to ensure data analysis and interpretation uniformity while guiding public regulations, enabling reproducibility, reliability, and data privacy in healthcare.93,94 This paper unravels significant information on DEG, pathways, networks, and potential biomarkers in murine fetal brain tissue exposed to CPF, suggesting further experimental validation. In this is silico study, the potential biomarker of neurotoxicity leading to neurodevelopmental disease and therapeutic is microRNA485. miRNA plays a significant role in neurodegeneration, making it an ideal tool for biomarker discovery and therapeutics. 95 A possible mechanism is that microRNA485 probably modulates (decreases) the level of PON-1 by binding to the 3′UTR (Untranslated region), influencing oxidative stress and inflammation. 96 miR-485 affects gene degradation or inhibition. 97 There is no direct confirmation that miR-485 influences PON-1 expression, where increasing PON-1 expression reduces the toxic CPF effect, indicating his role. 98 miRNA-485 decreases the PON1 expression level, causing neurodegeneration.99,100 With the PON1 level decrease, the antioxidant defense weakened, causing oxidative damage to neurons, activating inflammatory pathways, and releasing proinflammatory cytokines, whereas inhibition of AChE leads to neuronal cell death and neurodegenerative changes.99,100 The PON1 activity restores to a functional level by modulating the miR-485 level. 101
Literature with experimental validation confirms the expression level of selected DEG, protein expression levels, and assays confirming qPCR (Quantitative Polymerase Chain Reaction), Western blot, and functional assay.102–107 Experimental techniques to analyze interactions between genes identified in network analysis interfering with miR-485 are validated in scientific practice with qPCR, Western blot, and functional assay.102–107 Research studies in the future could combine methodologies like qPCR with RNA-Seq, CRISPR/Cas9 (Clustered Regularly Interspaced Short Palindromic Repeats/CRISPR-associated protein 9), assays based on cell, reporter, and biochemistry to confirm treatment responses, molecule quantification, splicing events, biological processes, functional significance, strengthening the evidence in health and disease.108–111 Findings with the existing literatureinterpreted the role of DEG and pathways. 112 Multi-omic profiles showed a relationship between transcriptomics, proteomics, and metabolomics with correlation plots. 113 The finding of this study aligns with the current understanding of molecular biology and neurobiology since miR-485 plays a significant role in oxidative stress and neurodevelopmental processes with the PON-1 gene.
The development of modern technologies decreases disease progression through real-time data collection, analysis, and interpretation fast and efficiently.114,115 In this sense, a comprehensive overview by applying digital health innovations aligns the manuscript with the interest of the journal audience.114,115 Innovative digital methods enable diverse AI and machine-learning platform incorporation.114,115 Wearable sensors, mobile health (mHealth) apps, and remote monitoring systems enable digital collection, measuring biomarkers in a non-invasive way, continuously, dependently on the environmental exposure, integrating analysis with other platforms of large-scale genomic data collection and storage, enabling researchers to efficiently conduct in silico comprehensive analysis.116,117 Future research studies should focus on data collection, predictive data analysis, AI algorithms, and multidisciplinary scientific collaboration to reveal novel efficacy biomarkers and innovative solutions quickly and efficiently. In this sense, the author demonstrated the significance of digital health concepts and their potential application in specific diseases, demonstrating a multidisciplinary approach significant to a broader reader audience.
Since significant insights influence of CPF is presented in the paper on neurodegenerative processes along with the potential role of microRNA-485 as a biomarker of neurotoxicity, the discussion section acknowledges several limitations regarding in silico nature of the study, generalizability of the results, technology, and methodology constraints, biological complexity, data integration and multi-omic approaches, ethical, legal and regulatory concerns, experimental and biological variability, public health and regulatory considerations, technological revolution and accessibility, interdisciplinary collaboration, impact of environmental and life cycle factors.
In silico methodology requests experimental validation in vitro and in vivo studies and diverse model systems to confirm the findings of the present studies. In silico models do not capture the complexity of the biological system, including the interplay between cell and molecular components. Species differences limit the findings to human health and developmental stage where sequencing depth can cause variations in DEG and miRNA detection. Variations in libraries can affect reproducibility and reliability, along with different interpretations of the same datasets with diverse statistical and software tools. Cell type-specific expression and pathway interaction are biologically complex, where a bulk of RNA seq data from whole brain tissue can mask cell type-specific expression, limiting the ability for specific cell response to CPF exposure. The study can overlook other pathways and genes involved in DNT, where experimental design without control and experimental replicate comparisons limit the distinction between natural and CPR-induced variations, decreasing finding robustness and reproducibility. Potential limitations of the material and method study section could be data collection and sources, data processing and analysis, biological and experimental design, statistics, and reporting, ethic and data privacy. A few potential limitations in the results section exist regarding experimental design, biological and technical considerations, data analysis and interpretation, functional validation and biological relevance, ethical and practical considerations, and technological and methodological limitations
CEL File dependencies, normalization techniques, and data filtering criteria represent data preprocessing and analysis limitations. For example, the study uses available CEL files, where variations in how these files were generated or processed in the original experiments are not available from the original public resources, which can be a potential inconsistency that can affect the results. This study applies RMA normalization, which is widely used but may not address all biases in the present data arising from batch effect or platform-specific artifacts. Exclusion criteria based on data quality and consistency may potentially lead to the removal of potential significant outliers or rare variants that could be relevant. Although normalization is present, batch effects and technical variations between experiments can still affect the data quality and interpretation. With a relatively small number of samples, the study may lack the statistical power to detect subtle but biologically significant differences in gene expression. Potential methodological and technical limitations regarding tool and package, experimental validation, and platform-specific biases are present. For example, the analysis relies on specific software tools and R packages (e.g., DESeq2, limma, cluster profile, STRINGdb), where each tool has its limitations, such as algorithmic biases, version-specific bugs, in handling certain types of data, where in silico methodology lack experimental validation, limiting the biological relevance and results applicability. Probe-specific effect and hybridization information from the Affymetrix Mouse Gene 1.0 ST Array platform may not be present in other platforms. In this study, functional validation of the miR-485 biomolecule and its translational applicability to human health remains uncertain since epigenetic changes could mask the effect of gene knockout or transgenic modification, along with the limitation of species-species differences. Gestation exposure time and tissue-specific analysis include limited results due to varying susceptibility and fetal brain tissue analysis indicating potential diverse tissue responses due to neurotoxicity where uncontrolled environmental variables lead to confounding effects along with multiple CPF doses (0.0, 0.75, 0.85 mg/kg/d) impacting the study design and scope where higher and lower doses could provide more precise information regarding the dose-dependent relationship. Environmental factor during original experiments may not be accounted in primary available data sources affecting the expression and confounding. Detected miRNA-485 could have more complex biological interpretation with DNT and PON-1 gene expression since miRNA can have multiple targets and regulatory effects complicating interaction of functional significance. Moreover, multiple testing correction, predictive model limitation and multi-omic data integration present potential statistical and computational limitation. Although this study applies FDR correction for multiple testing, there is a risk of error when dealing with high-dimensional data and hypotheses. Random forest model and SVM, as powerful machine learning models, may overfit the data with a small sample size, where the results depend on the quality and diversity of training data.
Complex transcriptomic and multi-omic data integration and ethical and privacy considerations can potentially cause errors. The study findings are the correlation of quality and completeness of data reporting in the primary data source from the original article. Potential not-considered biases in the original articles cause differences in conclusion. Reproducibility is limited based on the original dataset and applied tools for data analysis and interpretation. Differences in chemical exposure regulations can impact the results. Translational challenges in the study present future rigor experimental validation before introduction into clinical practice. Moreover, technical artifacts, incomplete data annotations, and limited sample size represent possible technical artifacts from the microarray technology used (cross-hybridization, non-specific binding) influencing the accuracy of the gene expression measurement where incomplete data annotation could lead to misunderstanding of the gene expression results. Functional enrichment and pathway analysis depend on the accuracy and completeness of reference databases (KEGG, Reactome, and Gene ontology) while the Limma method assumes a variable linear relationship that may not capture complex and non-linear interactions in biological systems. The analysis is limited to a single time point that can potentially affect the dynamic changes in the gene expression over time. Additional data batch effects after normalization can be differences in processing time, reagents, or equipment impacting the data quality. Microarray technology has lower sensitivity compared to RNA-Seq, resulting in the absence of low abundance transcript while wrongly quantifying the amount of highly expressed genes. Technical and computational challenges in RNA analysis depend on the quality of the RNA sequenced data, leading to potential sequencing errors or misalignment and algorithm artifacts influencing the interpretation of RNA expression. For example, digital technology integration enhances data collection and analysis due to differences in data interoperability, system compatibility, security, and user-needed training where it is significant to protect healthcare data from unauthorized access. Methodological limitations represent dependencies on in silico models to predict biomarkers and molecular mechanisms, overlooking nuances capturing empirical research based on the existing data and assumptions that may not fully represent biological complexity. Moreover, there are assumptions and limitations of the UMAP plot, although it provides insight into sample relationships based on dimensional reduction, which can make an interpretation of biological complexity and may not capture the underlying variations. Technical variability represents instrumental sensitivity and library preparation bias, which limit the diverse calibration and sensitivity of sequencing instruments, affecting the consistency and accuracy of the results and preferential amplification of the sequence. Statistical and computational considerations regarding potential computation model limitations and machine learning approaches identify potential biomarkers that cause overfitting in the case of small sample sizes. Data interpretation and analysis limitations include potential false positives and negatives, where reliance on statistical significance can lead to the inclusion of false results. Future research should focus more on unifying external laboratory datasets, making them more applicable in clinical practice. Environmental and experimental variables, including potential factors like housing conditions, diet, temperature, humidity, and handling, affect the generalizability of the results and the variability of the mother and fetus, influence gene expression changes. Experimental and biological limitations represent pleiotropy (gene interaction), epistasis (multiple traits), and temporal variation (single time point), where the interpretation of the results is affected by the dynamics of developmental processes.
In this study, the effect of CPF on gene expression in brain Murine fetal samples is examined in the context of PON-1 gene modulation. Future directions include the need for longitudinal studies and expansion to other biomarkers to track the effectiveness of miRNA-485 as a biomarker over time across diverse developmental stages, investigating other biomarkers while integrating them with miRNA-485 to develop a more comprehensive approach to neurotoxicity.
Conclusion
miRNA-485 represents a promising biomarker for developmental neurotoxicity targeting PON-1 gene expression, whereas in silico analysis represents a valuable tool for RNA signature identification, enabling understanding of the molecular mechanism of neurodegenerative disorders and developing preventive strategies by incorporating digital health technologies to enhance data collection, analysis, and application making the findings to be significant and impactful for healthcare practice. Differential expression analysis reveals a significant difference in RNA expression for microRNA485 between KO and WT groups. Sample relationships present UMAP plots and other graphical analyses with insight into dependencies and variations among diverse genotypic groups. Integrating digital and innovative methods has implications for public health because the study provides a comprehensive approach to investigating neurotoxicity.
By incorporating digital health and innovative methods in further studies, the neurotoxicity study will have a comprehensive approach since total RNA and microRNA485 are promising developmental biomarkers. Digital technology incorporated with in silico analysis enables the implementation of relevant and impactful data collection, analysis, and interpretation in clinical practice. The comprehensive and compelling analysis addresses these points of the manuscript to the broader audience.
Supplemental Material
Supplemental Material - Analysis of total RNA as a potential biomarker of developmental neurotoxicity in silico
Supplemental Material for Analysis of total RNA as a potential biomarker of developmental neurotoxicity in silico by Snežana M. Jovičić in Health Informatics Journal.
Footnotes
Acknowledgements
I want to acknowledge the kind support of my parents for their sustained love and support. Thank you for enabling me to be who I am. Moreover, I want to thank the people who contributed to my education. Thank you all for being a part of this lovely Snežana (Snow White) story, my life story. Life writes novels.
Author contributions
Author (Snežana Jovičić, PhD student at the Faculty of Biology, University of Belgrade, Serbia), originated data collection, analysis, interpretation and writing. The author made all the effort, accuracy, integrity and quality of the presented work. The author read and approved the manuscript for submission. The author confirms that this work is original and has not been published elsewhere, nor is it currently under consideration for publication elsewhere.
Declaration of conflicting interests
The author(s) declared the following potential conflicts of interest with respect to the research, authorship, and/or publication of this article: The author, a PhD student, Snežana Jovičić, declares no competing interest.
Funding
The author(s) received no financial support for the research, authorship, and/or publication of this article.
Data availability statement
The dataset used and interpreted in the current study is available from the publication.
Supplemental Material
Supplemental material for this article is available online.
Appendix
References
Supplementary Material
Please find the following supplemental material available below.
For Open Access articles published under a Creative Commons License, all supplemental material carries the same license as the article it is associated with.
For non-Open Access articles published, all supplemental material carries a non-exclusive license, and permission requests for re-use of supplemental material or any part of supplemental material shall be sent directly to the copyright owner as specified in the copyright notice associated with the article.