
Abstract
Kinsa Inc. sells Food and Drug Administration–cleared smart thermometers, which synchronize with a mobile application, and may aid influenza forecasting efforts. We compare smart thermometer and mobile application data to regional influenza and influenza-like illness surveillance data from the California Department of Public Health. We evaluated the correlation between the regional California surveillance data and smart thermometer data, tested the hypothesis that smart thermometer readings and symptom reports provide regionally specific predictions, and determined whether smart thermometer and mobile application improved disease forecasts. Smart thermometer readings are highly correlated with regional surveillance data, are more predictive of surveillance data for their own region and season than for other times and places, and improve predictions of influenza, but not predictions of influenza-like illness. These results are consistent with the hypothesis that smart thermometer readings and symptom reports reflect underlying disease transmission in California. Data from such cloud-based devices could supplement syndromic influenza surveillance data.
Introduction
Participatory surveillance systems, or systems that encourage the general public to voluntarily report health-related information, have the potential to strengthen disease surveillance systems and provide real-time estimates of disease burden. 1 Influenza and influenza-like illnesses (ILIs) are significant public health concerns, but the timing and peak intensity vary considerably from season to season and regionally. Prediction of influenza and ILI trends could be used to help plan and execute an effective public health response. 2 In addition, delays in obtaining surveillance data have garnered interest in nowcasting, or the use of forecasting techniques to estimate current influenza and ILI activity. 3 Kinsa Inc. sells Food and Drug Administration (FDA)-cleared Bluetooth and wired thermometers nationally and internationally. These smart thermometers synchronize with a mobile application, which records temperature readings and can also be used to record symptoms. Although multiple individuals, typically members of the same household, may share a thermometer, users may indicate which temperature readings and symptom reports belong to a specific user.
The potential for participatory surveillance for monitoring ILI has been explored in other settings4,5,6 and in-the-field thermometers have been used for disease monitoring in school children in China. 7 Previous work has shown that smart thermometer readings from the Kinsa application can improve ILI forecasts using national Centers for Disease Control (CDC) data, 8 and we aim to extend this work for influenza and smaller geographic regions. The data collected from temperature readings and user-provided symptom reports from the Kinsa application may be informative for influenza forecasting efforts.
Using California influenza laboratory surveillance data and ILI surveillance data from the 2015 to 2016 and 2016 to 2017 influenza seasons, we aim to determine whether the smart thermometer readings and symptom reports provide timely and regionally specific information on influenza and ILI trends. More specifically, we assess whether the data from the smart thermometer device can improve forecasting when used in conjunction with the existing surveillance data. There is no standardized approach for simultaneously validating crowdsourced data and data from cloud-based devices. We therefore adopted a three-tiered approach to evaluate how the smart thermometer and mobile application data corresponded with California influenza surveillance data. First, we evaluated the correlation between the California influenza surveillance data and smart thermometer data. Second, we test the hypothesis that smart thermometer and mobile application data from a given season and region predicts influenza and ILI surveillance data for that season and region better than data from other seasons and regions (in the sense of reducing the squared error of prediction). 9 Finally, in the most demanding test, we evaluate whether data from the smart thermometer and mobile application may be useful in influenza and ILI nowcasting and prediction efforts.
Methods
California influenza surveillance data
Outpatient visits for ILI reported by volunteer sentinel providers and influenza laboratory surveillance data from volunteer sentinel clinical laboratories reported to the California Department of Public Health (CDPH) for the 2015–2016 and 2016–2017 influenza seasons were available for this study. Sentinel providers (physicians, nurse practitioners, and physician assistants) situated throughout California report on a weekly basis the number of patients seen with ILI and the total number of patients seen for any reason, from which the percentage of provider visits due to ILI can be obtained. ILI is defined as any illness with fever (greater than 37.8°C for oral readings) and cough and/or sore throat in the absence of a known cause other than influenza. Laboratory surveillance for influenza involves the use of data from clinical laboratories throughout California. These laboratories report the number of laboratory-confirmed influenza virus detections and the total number of specimens tested for each virus on a weekly basis, from which the percentage of laboratory tests positive for influenza can be obtained. All data from CDPH were divided into five standard California regions (shown in Figure 2(a) and in the Supplemental Information) and aggregated by CDC weekending date prior to analysis. Herein, ILI surveillance data refer to the percentage of provider visits due to ILI as reported by sentinel providers. Influenza laboratory surveillance refers to the percentage of laboratory tests positive for influenza.
Smart thermometer and mobile application data
The typical Kinsa user is a family with one or more children below the age of 12. Kinsa thermometers are sold in 5000 retail stores across the country and on Amazon. Anonymized data from smart thermometers and the corresponding mobile application collected for the 2015–2016 and 2016–2017 influenza seasons and reported in California were available for this study and are summarized in Figure 1. For the purposes of our analysis, season 1 is defined to be 30 August 2015 to 27 August 2016 and season 2 is defined to be 28 August 2016 to 26 August 2017. With each temperature reading, users have the option to specify type of temperature reading—oral, rectal, aural, or underarm—and which user associated with the device took the reading, as well as indicate which of 12 symptoms were present from a preset list of the following: body aches, chills, cough, diarrhea, earache, fatigue, headache, nausea, runny nose, shortness of breath, sore throat, and stomachache. Users also had the option of inputting symptoms without taking a temperature reading. Readings and records were assigned a geolocation based on GPS or IP address and this was used to assign each reading to one of the five CDPH influenza surveillance regions prior to delivery of the data set. The timestamp for each reading and record was given as a CDC weekending date. During seasons 1 and 2, there were 1,120,508 entries, with 1,016,610 temperature readings and 168,564 symptoms reports (readings and symptom reports can be entered contemporaneously or separately). To exclude devices used for testing and devices used for non-ILI related temperature monitoring, devices associated with more than an average rate greater than 500 temperature readings per year were excluded (based on number of readings since the device was initialized), resulting in 1,058,617 entries, with 957,695 temperature readings and 165,440 symptom reports. See Supplemental Information for more details.
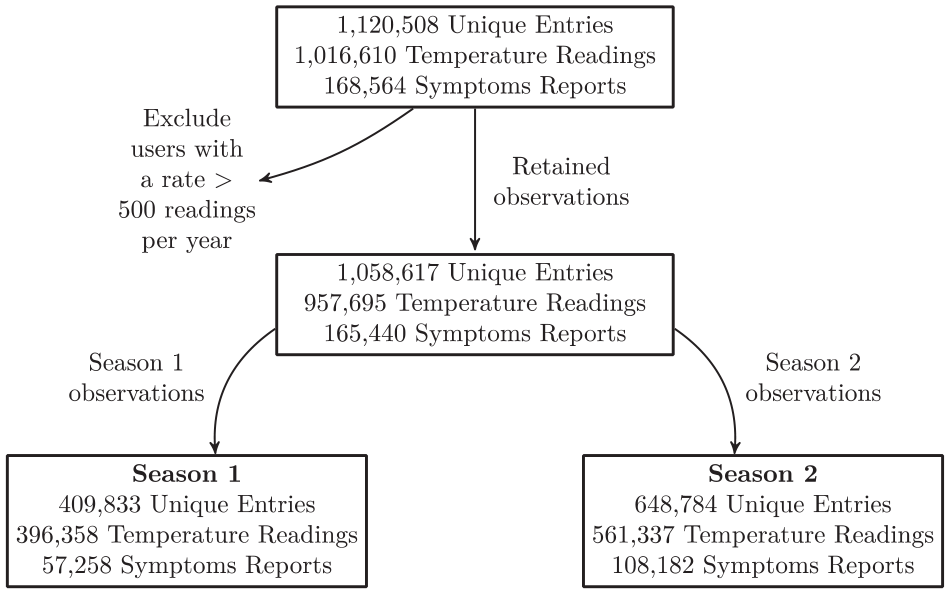
Summary of smart thermometer and mobile application data available for seasons 1 and 2 in California. Note that an entry may consist of a temperature reading, reported symptoms, or both. The smoothed data, filtered using a 3-point moving average, includes data from the week before season 1 and the week after season 2 in the smoothed time series data within seasons 1 and 2.
Line listed temperature readings and symptom reports from the smart thermometer and mobile application were converted into time series data as follows: temperature readings were considered fevers if they were ⩾38.0°C for rectal and aural readings, ⩾37.8°C for oral readings and readings from unknown body sites, and ⩾37.2°C for underarm readings. Temperature readings outside of the range 34°C–43°C were not categorized as fever or non-fever readings. 8
Multiple readings and records from a single user (or device, if user was not specified) for a given week were collapsed into a single reading or record indicating whether a fever or symptom occurred at any point during that week, as defined by the CDC weekending date. Number of temperature readings, fevers, and symptom reports were aggregated by week. We also determined the number of unique users with fever and cough or sore throat at any point during each week, corresponding to the ILI case definition. When unique user profile was not specified, number of unique devices with fever and cough or sore throat at any point during each week was used. If for a given device, user was not consistently entered, the minimum possible number of unique users was assumed.
To simplify the time series symptoms reports data, we used principal component analysis to extract lower dimensional information that can account for the majority of the variance from a high dimensional data set. 10 Since our objective was to quantify the predictive capability of the temperature readings and symptom reports, principal component analysis was performed on the weekly time series of the number reporting each of the 12 symptoms to reduce the dimensionality of this subset of the data. A priori, we planned to retain only the minimum number of principal components to account for at least 90 percent of the variance in weekly symptoms reporting.
To account for a growing number of smart thermometer users over time, time series data from the smart thermometers and mobile application were detrended. Detrending was performed for each region sequentially by fitting a linear model using weekending date as the only predictor and returning the residuals from that fit.
A 3-point moving average, referred to as smoothing herein, was applied to the following smart thermometer and mobile application time series data: number of temperature readings, number of fevers, percentage of readings indicating fever, number of users meeting the ILI case definition, and principal components extracted from the weekly symptoms data. A 3-point moving average was also applied to CDPH influenza surveillance data and ILI surveillance data.
Analysis
The aims of our analysis were threefold: first, we aimed to quantify the correlation between time series data from the smart thermometer and mobile application and time series influenza laboratory surveillance data and ILI surveillance data and determine whether these correlations differed across regions. Correlations between smoothed and detrended time series smart thermometer and mobile application data and time series CDPH data for seasons 1 and 2 and all five California regions were calculated using the Spearman’s rank correlation coefficient. Confidence intervals were determined using the time series bootstrap with a fixed width of 5. 11 Unsmoothed and raw correlations are presented in the Supplemental Information.
Second, we aimed to determine whether smart thermometer readings and symptom reports in a given region and season were more predictive of CDPH influenza and ILI surveillance data for that region than for other regions or seasons. That is, since influenza patterns are highly correlated across regions in California, high correlations could be indicative of capturing regionally and seasonally independent trends. Therefore, we aimed to ascertain whether smart thermometer readings and symptom reports are correlated with surveillance data because they are reflective of differences in influenza and ILI timing and intensity for the region in which they were recorded. To achieve this aim, smart thermometer and mobile application data were used to predict influenza laboratory surveillance data and ILI surveillance data using a pre-specified time series regression model, with the following regressors: weekending date, total number of users taking temperature readings, total number of users with fevers, percentage of users with fever, and the principal components of the symptoms, accounting for at least 90 percent of the variance in symptoms reporting (see Supplemental Information for further details). Specifically, we tested the hypothesis that data from a given season and region predicts an outcome for that season and region better than data from other seasons and regions. For each of 10 possible combinations of season and region, smart thermometer and mobile application data were used to predict state regional data for the corresponding week in that season and region combination, as well as the corresponding week in all other season and region combinations. For each model, we estimated an R2. This yields a 10 × 10 matrix, whose diagonal elements represent the predictive capability based on modeling using the same season and region. Permutation testing was used to test the hypothesis that the off-diagonal elements were smaller than the diagonal elements. The predictive specificity of the smart thermometer and mobile application was evaluated for both CDPH influenza laboratory surveillance data and CDPH ILI surveillance data. See Supplemental Information for additional details.
Third and finally, we aimed to determine whether the smart thermometer and mobile application data have the potential to improve influenza and ILI predictions. To do this, for each week j in year 2, we first developed a model to predict week k of influenza surveillance data, using only the k – 2 and k – 3 weeks of influenza surveillance data (to account for realistic reporting delays), as well as flexible functions of time, for all k < j. Using LASSO regression, 12 we selected a set of regressors that minimized the squared error for the predictions of week j using regressors determined only from prior times summed over each j (see Supplemental Information for additional details). These regressors were used in a final model. We then evaluated whether including the percentage of users meeting the ILI case definition reduced the sum of squared errors. Specifically, we added a linear term for the change in the percentage of smart thermometer users meeting the ILI case definition determined from the prior and current week, reflecting the fact that smart thermometer and mobile application participant data are available in real-time. The p values and percent decrease in the mean-squared error were determined using time series bootstrap with a fixed width of 5. Confidence intervals were obtained using the percentile method. A similar procedure was performed for ILI surveillance data. Our criterion was whether or not the addition of the smart thermometer time series yielded a statistically significant improvement of predictive capability beyond what is possible with the surveillance data alone.
Results
Smart thermometer and mobile application data change with a temporal pattern mirroring changes in the California influenza and ILI surveillance data (Figure 2). After smoothing and detrending, they are strongly correlated with regional CDPH influenza laboratory surveillance data and ILI surveillance data, with Spearman’s rank correlation coefficients ranging from 0.79 to 0.91 (Table 1). Detrended fevers are plotted against CDPH influenza and ILI surveillance data for each region in Figure 3. The correlations were comparably strong for all regions and for both influenza and ILI. Unsmoothed and raw correlations are also all significantly different from 0 and are given in the Supplemental Information. Correlations with other smart thermometer and mobile application time series data are given in the Supplemental Information.
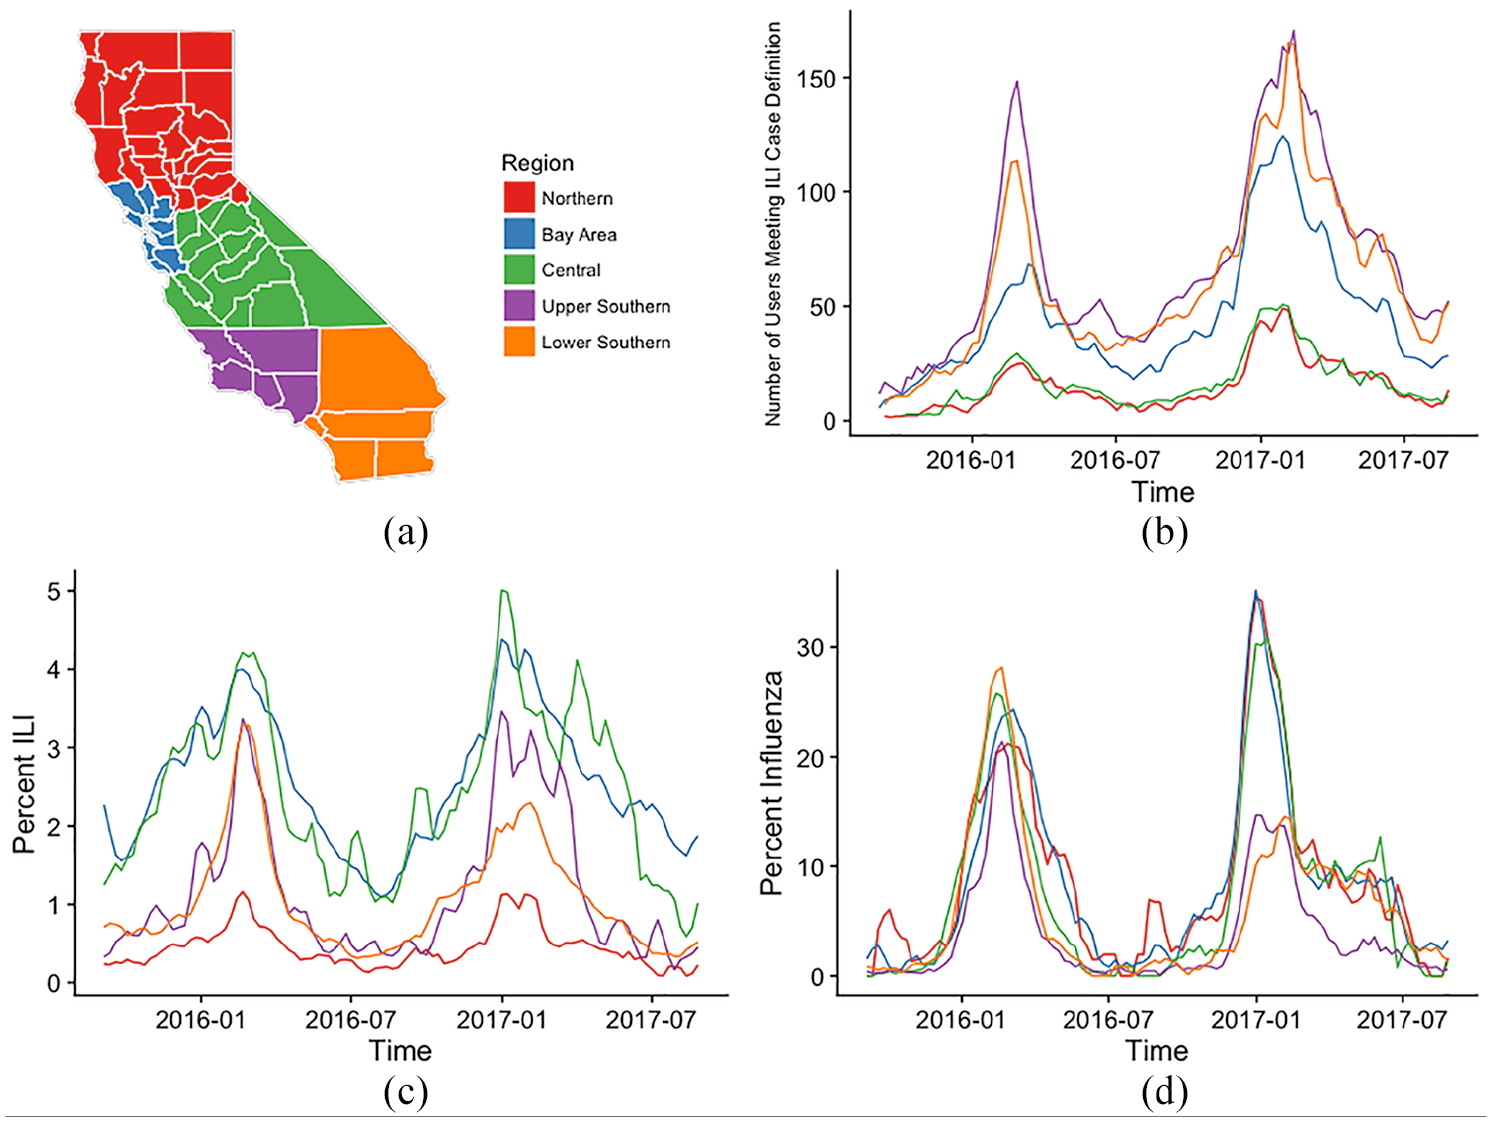
Influenza and ILI activity by California region: (a) California regions (annotated version in the Supplemental Information). (b) Number of individuals with temperature readings and reporting symptoms consistent with the ILI case definition using the smart thermometer and mobile application (not detrended). (c) ILI surveillance data (CDPH sentinel provider data). (d) Influenza laboratory surveillance data (CDPH laboratory data). All data are smoothed using a 3-point moving average.
Correlations between smoothed detrended number of fevers from the smart thermometer readings and smoothed influenza laboratory surveillance data and ILI surveillance data by California region (correlations for data without smoothing and/or detrending are given in the Supplemental Information).
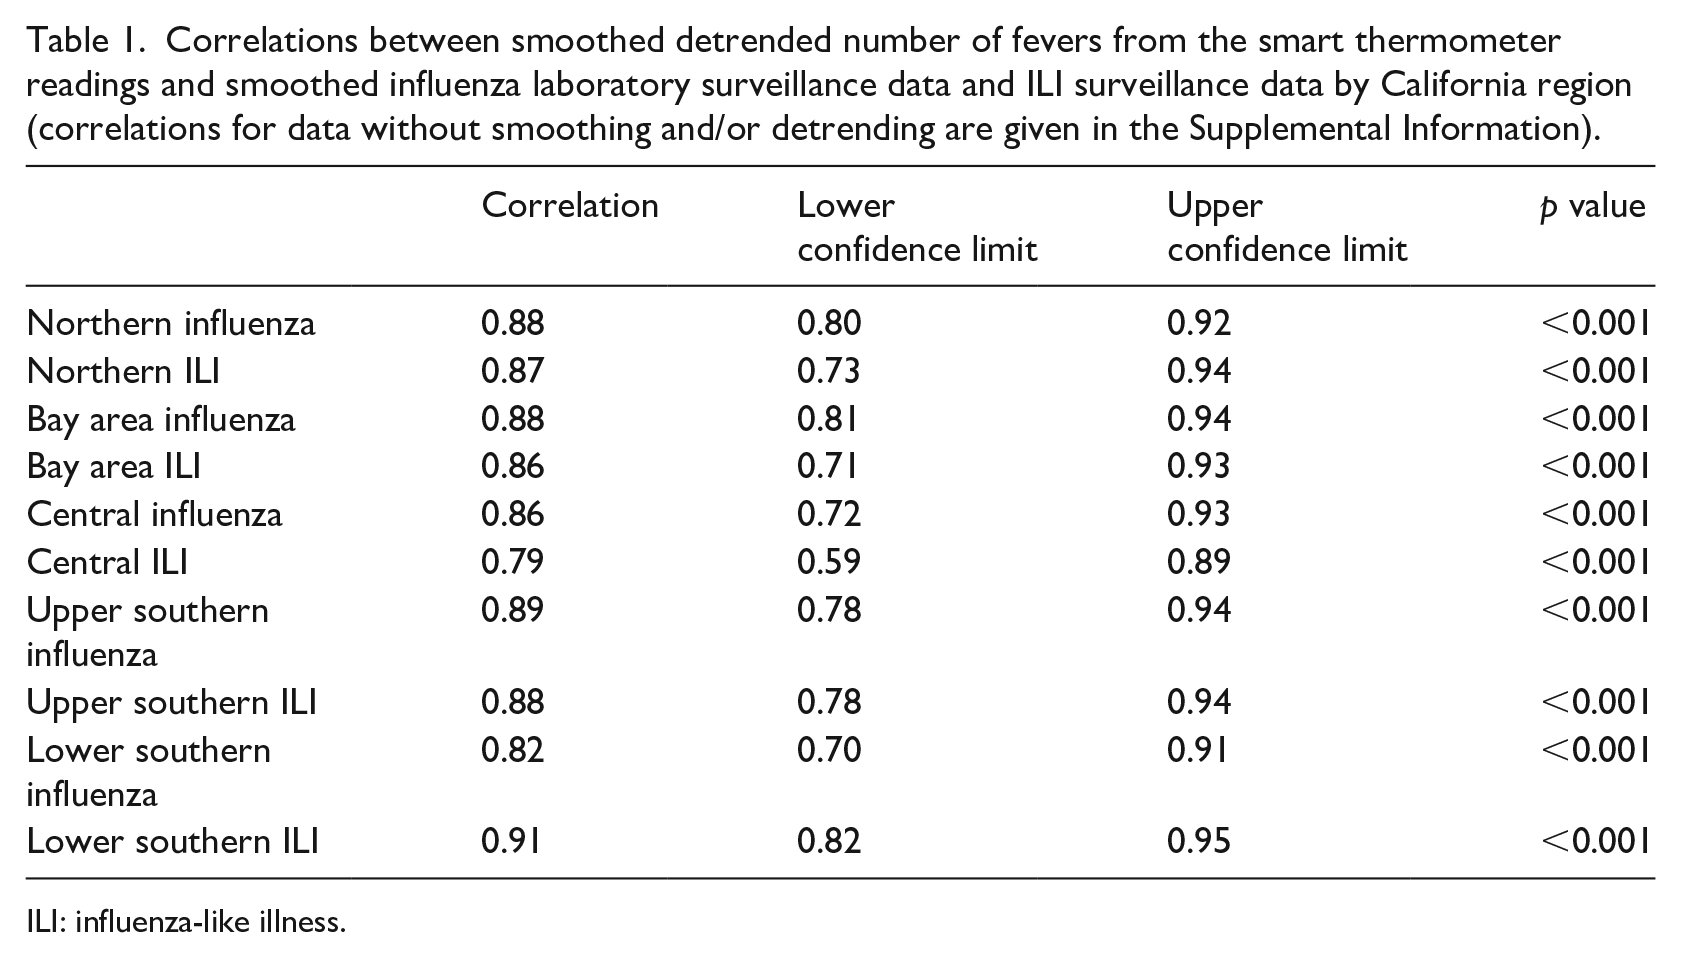
ILI: influenza-like illness.
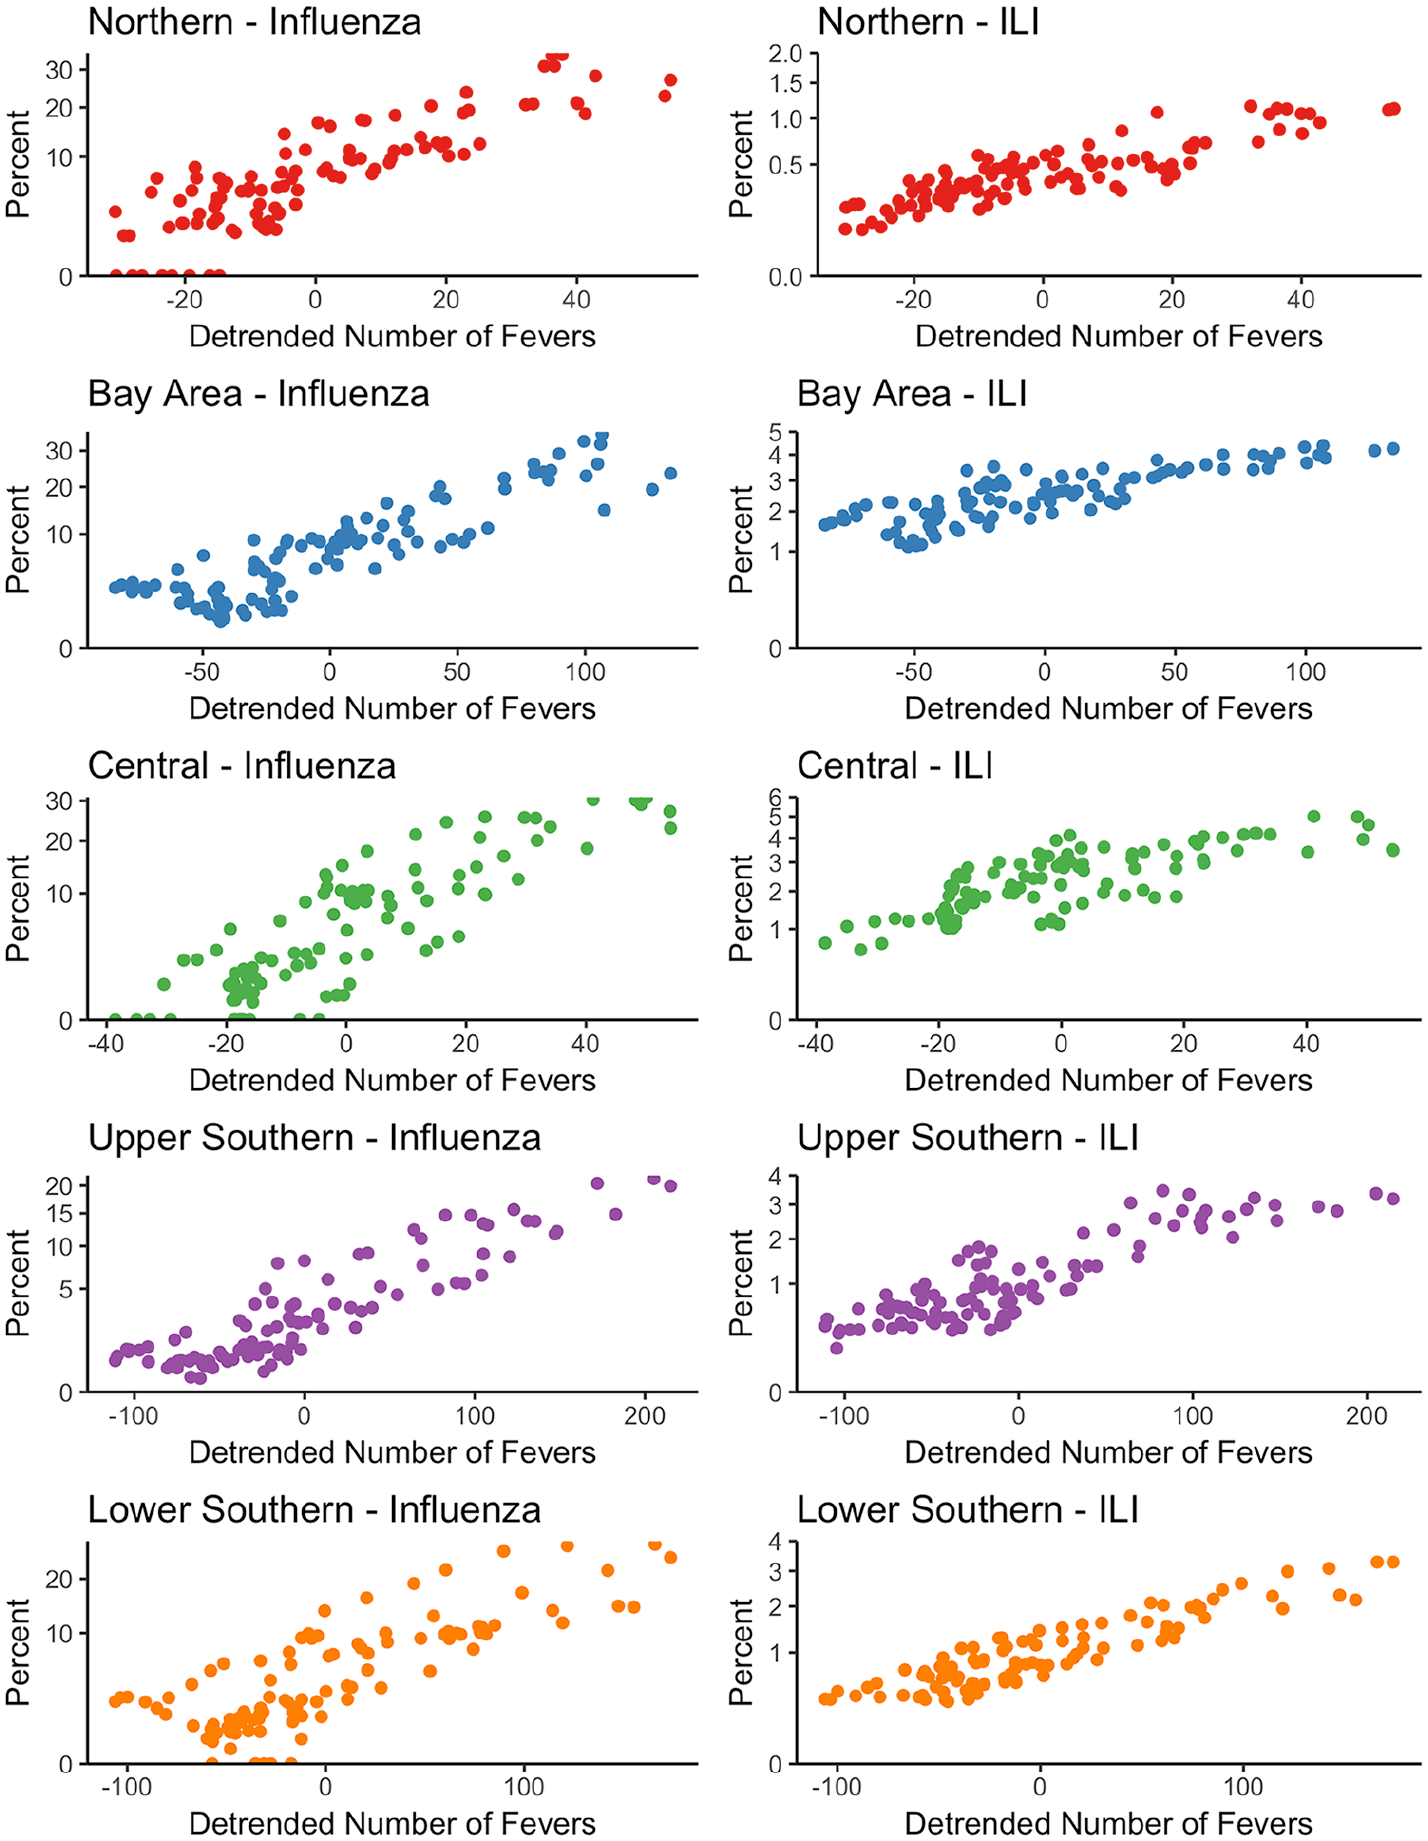
Influenza laboratory surveillance data and ILI surveillance data versus detrended number of fevers as reported with the smart thermometer by California region. All values are smoothed using a 3-point moving average. For influenza graphs, percentage of tests positive for influenza are shown. For ILI graphs, percentage of provider visits due to ILI are shown.
Smoothed thermometer readings and symptom reports were more predictive of smoothed influenza and ILI surveillance data in the same season and region than in others: p = 0.0032 and p = 0.0051, for influenza and ILI, respectively. We find the first principal component derived from the time series symptoms data explains 96 percent of the variance. In the first principal component, cough is a very important symptom, followed by runny nose and fatigue; gastrointestinal symptoms are the least important. The loadings of the first four principal components and plots of the time series for the first four principal components are given in the Supplemental Information.
For predictions of influenza surveillance data, inclusion of the first difference in percentage of users meeting the ILI case definition as a linear predictor in the model improved model fit (p = 0.0049), resulting in a 2.1 percent, 95 percent confidence interval with (0.18%, 4.9%), reduction in mean-squared error. For predictions of ILI surveillance data, we failed to find evidence that the inclusion of the first difference in percentage of users meeting the ILI case definition as a linear predictor in the model improved model fit (p = 0.39).
Discussion
We examine smart thermometer readings and symptom reports from a mobile application and their relationship to influenza laboratory surveillance data and ILI surveillance data by California region. Smart thermometer readings and symptom reports are more predictive of influenza and ILI for their own region and season than for other times and places. Furthermore, regional temperature readings from the smart thermometer are highly correlated with reported influenza and ILI and these associations are comparable across California regions. Finally, these data can be used to improve predictions of regional influenza surveillance data, but not necessarily ILI surveillance data with the model selection procedure we employ. Therefore, these results are consistent with the hypothesis that smart thermometer readings and symptom reports from a mobile application reflect underlying disease transmission and can provide insight into the epidemiology of influenza and ILI in California.
While crowdsourced data lacks the quality assurance and face validity of surveillance data from providers and laboratories,13–15 it may nevertheless provide additional insight on disease transmission dynamics. 16 The real-time availability of such data may aid in prediction and nowcasting efforts.17,18 Influenza is not a reportable disease in California, except for outbreaks, influenza-associated deaths in persons below 65 years of age, and novel influenza infections. Furthermore, testing and reporting practices may vary with seasonal expectations of influenza. For example, there may be less testing and reporting in the late spring, summer, and early fall than in the winter months. Therefore, California influenza laboratory surveillance data and ILI surveillance data may provide an incomplete picture of influenza activity. Participatory surveillance systems have the potential to address gaps in these systems by bolstering surveillance in regions with fewer participating sentinel providers and laboratories and in young and middle-aged adult populations. In addition, crowdsourced data are available in real-time and may be useful for influenza prediction efforts, particularly with the addition of data from a cloud-based device. Under realistic conditions, there may be delays in obtaining surveillance data, and we find that the addition of smart thermometer and mobile application data can improve predictions of influenza surveillance data. While reductions in the mean-squared error in predictions were not large, influenza follows a predictable seasonal pattern and is autocorrelated, and thus large reductions in error from a single data source can be difficult to achieve. 19 We failed to find evidence that such data could improve ILI predictions made using the model selection procedure we employ and regressing on two prior weeks, however. In addition, while we used prediction in this analysis as a metric for added value over surveillance data, there are typically delays associated with surveillance data and smart thermometer and mobile application data are useful for real-world nowcasts and forecasts. Specifically, we note that at the multi-state level, these data were found to improve ILI predictions.8,20 Future work may include using such data in influenza prediction contests, as well as using a hidden Markov model to compare crowdsourced and surveillance data to a virtual gold standard.
The majority of previous participatory surveillance efforts have relied solely on self-reported fevers, in addition to self-reported symptoms. 21 Our study extends this literature by using temperature readings directly from an FDA-cleared device. Previous studies have illustrated that time series participatory surveillance data are strongly correlated with influenza and ILI surveillance data4,7 and that data from the Kinsa smart thermometer is correlated with and predictive of ILI at the multi-state level.8,20 Corroborating such findings, this study suggests that smart thermometer data can provide epidemiologically specific data on regional influenza and ILI activity in California and improve influenza predictions in California.
This study has several limitations. Our analysis pertained to only the two recent influenza seasons. Thermometers are sold in retail stores throughout the state of California. Nonetheless, purchasers and users of smart thermometers may not be a representative sample and may not have a uniform geographic distribution. In addition, not all smart thermometer users were necessarily residents of the region for which their data were attributed. Location was determined based on location of reading or report as determined by GPS or IP address, and not region or state of residence. The CDPH surveillance data may also include individuals who traveled outside their region or state of residence, although the probability a sick individual outside of their region or state of residence visited a clinic and/or provided a specimen may differ from the probability that such an individual used a smart thermometer. Since weekending date were the smallest time increment, there may be some error in the estimates of the number of smart thermometer users with fever or meeting the ILI case definition. Our procedure to test the predictive capability of these data aimed to minimize the potential for spurious conclusions due to over or under fitting the data prior to the inclusion of smart thermometer and mobile application data in predictive models. However, to rigorously evaluate the predictive capability of the percentage of users meeting the ILI case definition, as well as other channels of these data, predictions of influenza and ILI surveillance data would need to be tested as current surveillance data became available. Other machine learning approaches, such as support vector regression, 22 may be useful in future studies.
Crowdsourced data from mobile applications may contain their own biases.23,24 Nonetheless, crowdsourced data and data from cloud-based devices may provide unique benefits, which may not be available for other data collection methods,25,26 such as real-time availability and geoprecision. Furthermore, such data may be particularly useful when it does not rely entirely on self-report, as is the case with smart thermometer readings from an FDA-cleared device. As the user base continues to grow for cloud-based devices, these data will likely continue to provide epidemiologically specific data on regional influenza and ILI activity in California. These findings may contribute to our understanding of the strengths and weaknesses of big data in epidemiology.
Smart thermometers and mobile applications have the potential to supplement influenza and ILI surveillance systems in regions with a sufficient user base. In addition, real-time data on influenza and ILI are needed to mobilize public health resources in a timely fashion, and crowdsourced data can help address this by nowcasting before CDC reports become available. These data could be used for influenza and ILI prediction efforts at the regional level in California.
Human participant protection
This study received ethics approval from the Institutional Review Board at University of California, San Francisco. The Institutional Review Board at CDPH also reviewed this study and approved it as not research since it was considered surveillance evaluation. All CDPH data were aggregated by region and week such that only count data were available. For the smart thermometer and mobile application data, no identifiers were presented, location was given at the regional level, and the smallest time increment for temperature reporting was weekending date.
Supplemental Material
Supplemental_Information – Supplemental material for Assessing the utility of a smart thermometer and mobile application as a surveillance tool for influenza and influenza-like illness
Supplemental material, Supplemental_Information for Assessing the utility of a smart thermometer and mobile application as a surveillance tool for influenza and influenza-like illness by Sarah F Ackley, Sarah Pilewski, Vladimir S Petrovic, Lee Worden, Erin Murray and Travis C Porco in Health Informatics Journal
Footnotes
Declaration of conflicting interests
The author(s) declared the following potential conflicts of interest with respect to the research, authorship, and/or publication of this article: S.F.A., L.W., T.C.P., and E.M. have no conflicts of interest regarding this work. S.P. and V.S.P. were employees of Kinsa Inc. and shareholders in this company.
Funding
The author(s) disclosed receipt of the following financial support for the research, authorship, and/or publication of this article: S.F.A. acknowledges support from the US National Institutes of Health (NIH) National Institute of General Medical Sciences (NIGMS) (grant number F31GM120985). L.W. and T.C.P. acknowledge support from the NIH NIGMS Models of Infectious Disease Agent Study (MIDAS) program (grant number U01GM087728 and R01-GM130900). T.C.P. acknowledges support from NIH National Eye Institute (NEI) (grant number R01EY024608). S.P. and V.S.P. are employees of Kinsa Inc. The University of California, San Francisco (UCSF) Department of Ophthalmology acknowledges support from an unrestricted grant from Research to Prevent Blindness.
Supplemental material
Supplemental material for this article is available online.
References
Supplementary Material
Please find the following supplemental material available below.
For Open Access articles published under a Creative Commons License, all supplemental material carries the same license as the article it is associated with.
For non-Open Access articles published, all supplemental material carries a non-exclusive license, and permission requests for re-use of supplemental material or any part of supplemental material shall be sent directly to the copyright owner as specified in the copyright notice associated with the article.