
Abstract
In Germany and elsewhere, few hospital electronic patient record usability surveys are available. Moreover, there seems to be a complete lack of validated instruments in the respective literature. Hence, this study’s purpose is to validate a scale for measuring the usability of hospital electronic patient record systems. The data used for the study’s analyses (n = 949) were originally obtained during the German national initiative ‘Hospital IT User Questionnaire’. In the course of the study, reliability and exploratory factor analyses were conducted and psychometric tests showed a reliable, valid and suitable instrument. Descriptive data analysis suggests a generally low user perception and variances hint at a high potential for future improvements. To our knowledge, this study shows that a general inventory (subscales from the IsoMetrics inventory) can be applied to measuring hospital electronic patient record usability as well. The validated instrument can be used to inform healthcare providers, decision makers and politicians of a given state of usability, discrepancies between different hospitals or systems providers, and serve as a basis for improvements.
Introduction
The healthcare sector is an information-intensive area with high information demands and a rapidly growing market for eHealth/mHealth industries and information technology (IT) service providers (see market research studies listed below). 1 IT provides timely and accurate information to make sure that physicians, nurses and other healthcare professionals obtain the complete and comprehensive information they need to provide high-quality care.2,3 At the same time, hospital IT also has to meet managerial needs, continually improving the hospital’s effectiveness and efficiency in providing such care.4,5 Given the rapid development of healthcare IT in recent years, many hospitals have ambitiously introduced IT systems. Today, myriads of information systems (IS) are being used in hospitals, from the widely spread electronic patient records (EPRs), computerised order entry systems, to highly specified radiology IS, including speech recognition technology. A series of IT support services, such as maintenance, consultation and training, usually provided by a hospital’s IT department, are now in high demand. Even though the benefits of IT technology seem obvious in theory, IT systems appear only poorly integrated in current hospital operations management. The evidence is strong; a high number of reports are being published on topics, such as system flaws, poor IT usability and an insufficient correspondence between existing IT services and the particular demands of clinical work settings.6,7 Previous research indicated that user acceptance, perceived usability and user satisfaction are key factors, which influence a successful systems adoption at the hospital IT.6,8–15 This article focuses on the usability of EPR systems and clinical users’ experiences with the application of these systems. In recent years, only few large-scale studies have inquired into the usefulness and usability of EPR systems from the particular viewpoint of clinical users. 15
Despite the increasing prominence of user experience in the literature, the amount of comprehensive data gathered on the usability of EPR systems in hospitals remains small. Commonly, the successful implementation, adoption and use of hospital IT depend on the quality of the IS themselves and on the various IT services provided by a given hospital IT department (i.e. IT hotline, on-site services, on-call duty, user training and advising, project management, etc.). Previous publications on the subject focused mainly on individual projects and specific healthcare IS,10,12–18 were conducted in specific use contexts,11,14,19–23 involved rather small numbers of participants or dealt with a single health profession (i.e. only physicians or leading staff members).6,7,13,15 Based on a recent systematic scoping review, Kaipio and colleagues concluded: ‘[. . .] it appears that long-term research and follow-up studies of usability of EPR systems in use are scarce. Only the German study 9 reported results, which can be used to get an overview of the current situation of usability [. . .]’ 15 (p. 269). An important reason for the perceived lack of national data beyond the aforementioned German study is that there are no validated instruments and scales with published psychometric properties available (such as validity or reliability).9,15
Health professionals, such as physicians and nurses, are key providers of healthcare services in hospitals and primary users of hospital IT and EPR systems, in particular. Adequate implementation and usage of EPR systems can improve considerably the quality of the healthcare provided by these professionals, as do high usability and user satisfaction with EPR systems. These factors also determine the overall performance of a hospital and the outcome quality for patients. The aim of this investigation is to identify and validate a comprehensive instrument for measuring the usability of EPR systems in hospitals, which makes this study one of the first of its kind. Research outcomes should not only answer questions of senior hospital management, such as ‘how good is our hospital EPR system?’ The study also hopes to provide hospital IT researchers and practitioners alike with useful and valid measuring instruments, such as a best practice standard questionnaire.
Methods
Study design and questionnaire
As mentioned above, the study’s main subject includes two concepts, namely usability and EPR systems, both of which should be defined. However, when taking a closer look at the matter, the question of finding working definitions of these terms appears problematic. In one of the main publications in the research field, Viitanen and her colleagues emphasise that,
From the viewpoint of healthcare professionals, research on the usability of a single system is somehow contradictory when considering their daily work and surroundings. The technology environment in clinical work consists of tens of ICT systems, of which several are used simultaneously (e.g. the process of electronic prescribing using EHR and other ICT systems). With the end-users’ perspective in mind, it is easy to argue that research should address the usability of ICT systems in clinical contexts from a broader viewpoint: consider applications as integrated parts of the technology environment and describe the objectives of usability considerations with regards to user’s tasks and goals while utilizing numerous ICT systems in their daily work.
6
(pp. 709f)
Moreover, research in health informatics suffers severe confusion with core terms, such as hospital information system (HIS), clinical information system (CIS), electronic medical record (EMR), EPR, electronic health record (EHR), personal electronic health record (PHR), minimum data set (MDS), patient summary record (PSR) and many more (see overview and discussion by Haas 24 and Bertram et al. 25 ). Despite a general growing interest in the topic, terminological definitions remain imprecise with respect to their scope and application. While authors use the term EHR to refer to local or institutional EHR6,15 (IT systems pertaining to a specific healthcare provider or institution, such as a hospital, clinical practice or other care setting), in the wider literature, definitions of the EHR go beyond standard clinical data collected by a provider, are more comprehensive and contain the medical and treatment histories of patients (contain and share information from all providers involved in a patient’s lifetime care). 26 Thus, for the purpose of clarity in our study focussing on hospitals, using the term ‘institutional electronic patient record’ would seem more appropriate. Following the definitions provided by Haas 24 (p. 55) and Hübner et al. 27 (p. 36), the EPR is meant to contain all patient data and related documents pertaining to a specific healthcare institution, that is, a given hospital. EPRs replace paper-based documentation and register all current and past treatments (including the patient’s medical history, diagnoses, medication, treatment plans, immunisation records, allergies, laboratory and other test results). They allow access to decision-support tools and automate and streamline provider workflow.
The backbone EPR systems included in this study are based on an architecture that stores core patient information, such as narrative patient records, including detailed medical and administrative patient information, all accessible through a common user interface. 15 The same user interface allows access to medication data, nursing documents, and diagnosis and treatment history. Depending on the EPR system, also radiological images and laboratory data are stored in a separate database but are commonly retrieved through the main EPR system by exchanging the patient context. Also, the computerised order entries are managed in the main EPR. The same goes for specific departmental systems, such as patient data management system (PDMS) in intensive care and operation room information systems (ORIS) in operation rooms. These systems are often partially integrated into the overall EPR system through standard data exchange interfaces.
Nowadays, German hospitals use a mixture of paper-based and EPRs to manage patient data. Many patient data are electronic, but still large parts of patient records remain paper-based. 27 Also, several service providers scan patients’ paper records.
Software usability is generally understood as the subjective perception of the quality of use of a given system. As a notion, software usability is a multifactorial construct based on the concept of human–computer interaction (ISO standard EN ISO 9241-10).28,29 Although there exist many definitions in the literature, there seems to be a common set of core characteristics. Belden and Grayson offered the following definition: A system with good usability is easy to use and effective. It is intuitive, forgiving of mistakes and allows one to perform necessary tasks quickly, efficiently and with a minimum of mental effort. Tasks which can be performed by the software (such as data retrieval, organisation, summary, cross-checking, calculating, etc.) are done in the background, improving accuracy and freeing up the user’s cognitive resources for other tasks.
30
(p. 3)
In the course of this study, systematic literature searches have been conducted to identify appropriate metrics and scales. Search criteria for software usability measurements were as follows:
The scale’s construction and development should be theory-based and suitable for EPR systems, particularly for the target group of healthcare professionals;
The scale covers dimension (as well as items) usable for all types of EPR systems in a generalised way (to avoid system-specific scale features, only applicable in certain software, i.e. PACS or LIS);
The scale is suited for both paper and pencil questionnaires and online surveys.
Developing a questionnaire to evaluate the usability of EPR systems presented a challenge. The comprehensive research process came up with no more than two publications, one in Germany 9 and one in Finland. 6 A recent systematic scoping review 15 later confirmed these results.
Initially, we considered the scales developed by Viitanen et al. 6 Since the presented questionnaire mainly addresses physicians’ needs and since psychometric scale values were unknown so far (compare follow-up study from 2017 15 ), it became necessary to look for a broader approach. As a consequence, this study defined the usability scales on the basis of the IsoMetrics inventory, an assessment tool that follows the ISO standard EN ISO 9241-10 ergonomic principles.9,31 Due to IsoMetrics’ broad range, Bundschuh et al. 9 adapted the questionnaire focusing on three principles, a choice that proved to be most relevant for clinical IT: suitability for the task (with 15 items), suitability for learning (with 8 items) and conformity with user expectations (with 8 items). Moreover, generalised evaluation scales are applicable to all types of EPR systems. Although the survey provided the first German hospital EPR usability data in 2011, apart from Cronbach’s alpha values, the adapted scale’s psychometric properties remained largely unknown.
The questionnaire was conceived as an online survey (applied in Questback Unipark, EFS Survey, version 8.0). Socio-demographic and open variables (i.e. appraisal, critical issues, statements and hints) were added. For all usability items, closed questions allowed answers on a 5-point Likert-type scale. 32 To test for criterion validity, we included an overall user satisfaction rating (single item, 7-point Likert-type scale).6,15 Given the heavy workload health professionals face in their hospital routines, the online survey was designed to take no longer than 10 min to answer.
Data collection and participants
Data used in the analyses were obtained during the national initiative ‘Hospital IT User Questionnaire’, which aimed at developing and validating various questionnaires to measure users’ perception of the quality of IT services and systems in German hospitals.
The project started in 2011, and the German Association of Hospital Chief Information Officer (CIO; KH-IT Bundesverband e.V.) formed a task force group. The multi-centred and cross-sectional investigation was conducted between January and June 2015.
All participants fulfilled the following inclusion criteria:
Staff member in a clinical department, that is, physician, nurse or other health professional;
Employed by the hospital for more than 3 months;
Regular and active user of an hospital EPR system;
Willing to participate in the study.
Participation in the study was entirely voluntary and anonymous for the clinical users.
After a period of agreed confidentiality between the German Hospital CIO Association and the author had ended (access only for certain members), validation results of selected instruments are now to be published (and shared with the science community and the public).
Data analyses
Statistical analyses were performed by Statistical Package for the Social Sciences (SPSS) statistics software, version 25 (including SPSSINC HETCOR extension command R essential for polyserial and polychoric correlations). Descriptive statistics, including mean, standard deviation, frequency and percentage, were calculated. The differences between the results of this study and other available reference values 31 were compared using the t-test. Psychometric evaluation according to classic test theory was conducted to validate the adapted usability scales. The reliability of the scales (internal consistency, split-half reliability) and their validity (exploratory factor analysis or EFA) were reported. Significance was set at the 5 per cent level (p < 0.05). To detect underlying patterns in the data and to develop an empirically based instrument, a principal component analysis (PCA) with an orthogonal rotation method/varimax was performed. Following the strong recommendations in relevant methodological literature,33,34 we used polychoric correlation to pre-calculate the correlation matrix, which was then entered into the PCA. The applicability of the matrix was evaluated based on the Kaiser–Meyer–Olkin (KMO) criterion (ranges from 0 to 1, with 0.50 considered suitable for factor analysis) and the Bartlett’s test of sphericity (with p < 0.05 considered suitable for factor analysis). 28 Components were extracted based on an eigenvalue of >1 and the scree plot. In the course of reducing the inventory, poor fitting items were excluded as follows: commonality < 0.3, KMO/measure of sample adequacy (MSA) value < 0.6, maximum factor loading < 0.3 and double or multiple loadings > 0.4.32,35 To test for criterion validity, usability scales were correlated with overall user satisfaction (OUS) rating. Analysis of variance (ANOVA) was used to show the ability of the usability scales to distinguish between subgroups (the following exemplary providers with the highest market share 36 were selected and later anonymised: Orbis by Agfa, i.s.h.med by Cerner, Medico by Cerner).
Results
Participating hospitals and study population
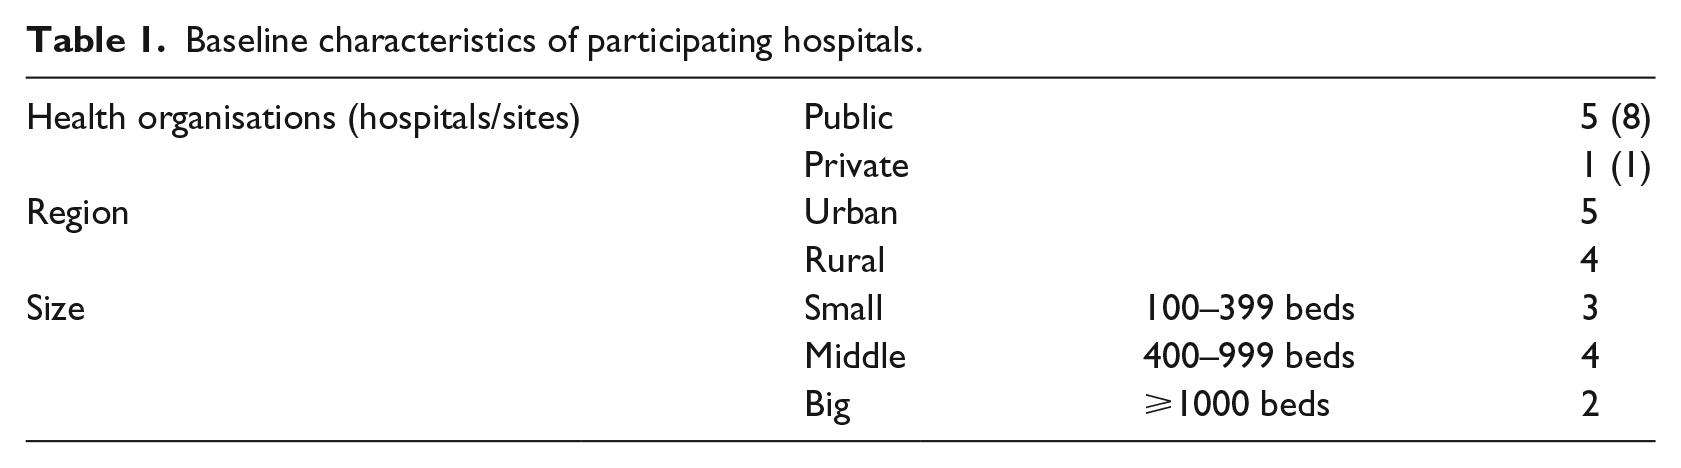
The instrument’s validation study includes nine hospitals (six healthcare organisations), as shown in Table 1, and covers different sizes of hospitals, regions and types of ownership. One hospital had to be excluded from the study due to a low response rate of below 1 per cent.
Baseline characteristics of participating hospitals.
Hospital management was contacted in person and through email and invited to participate in the survey, together with their clinical staff. A total of 949 health professionals took part in the survey (see Table 2), including 190 physicians, 231 nurses and 186 members of other health professions, such as medical technical assistance, physiotherapy and other therapeutic specialists, and clinical administration (342 respondents did not indicate their occupation). On average, the questionnaires took about 9.98 (SD 17.28) min to complete.
Baseline characteristics of participants.
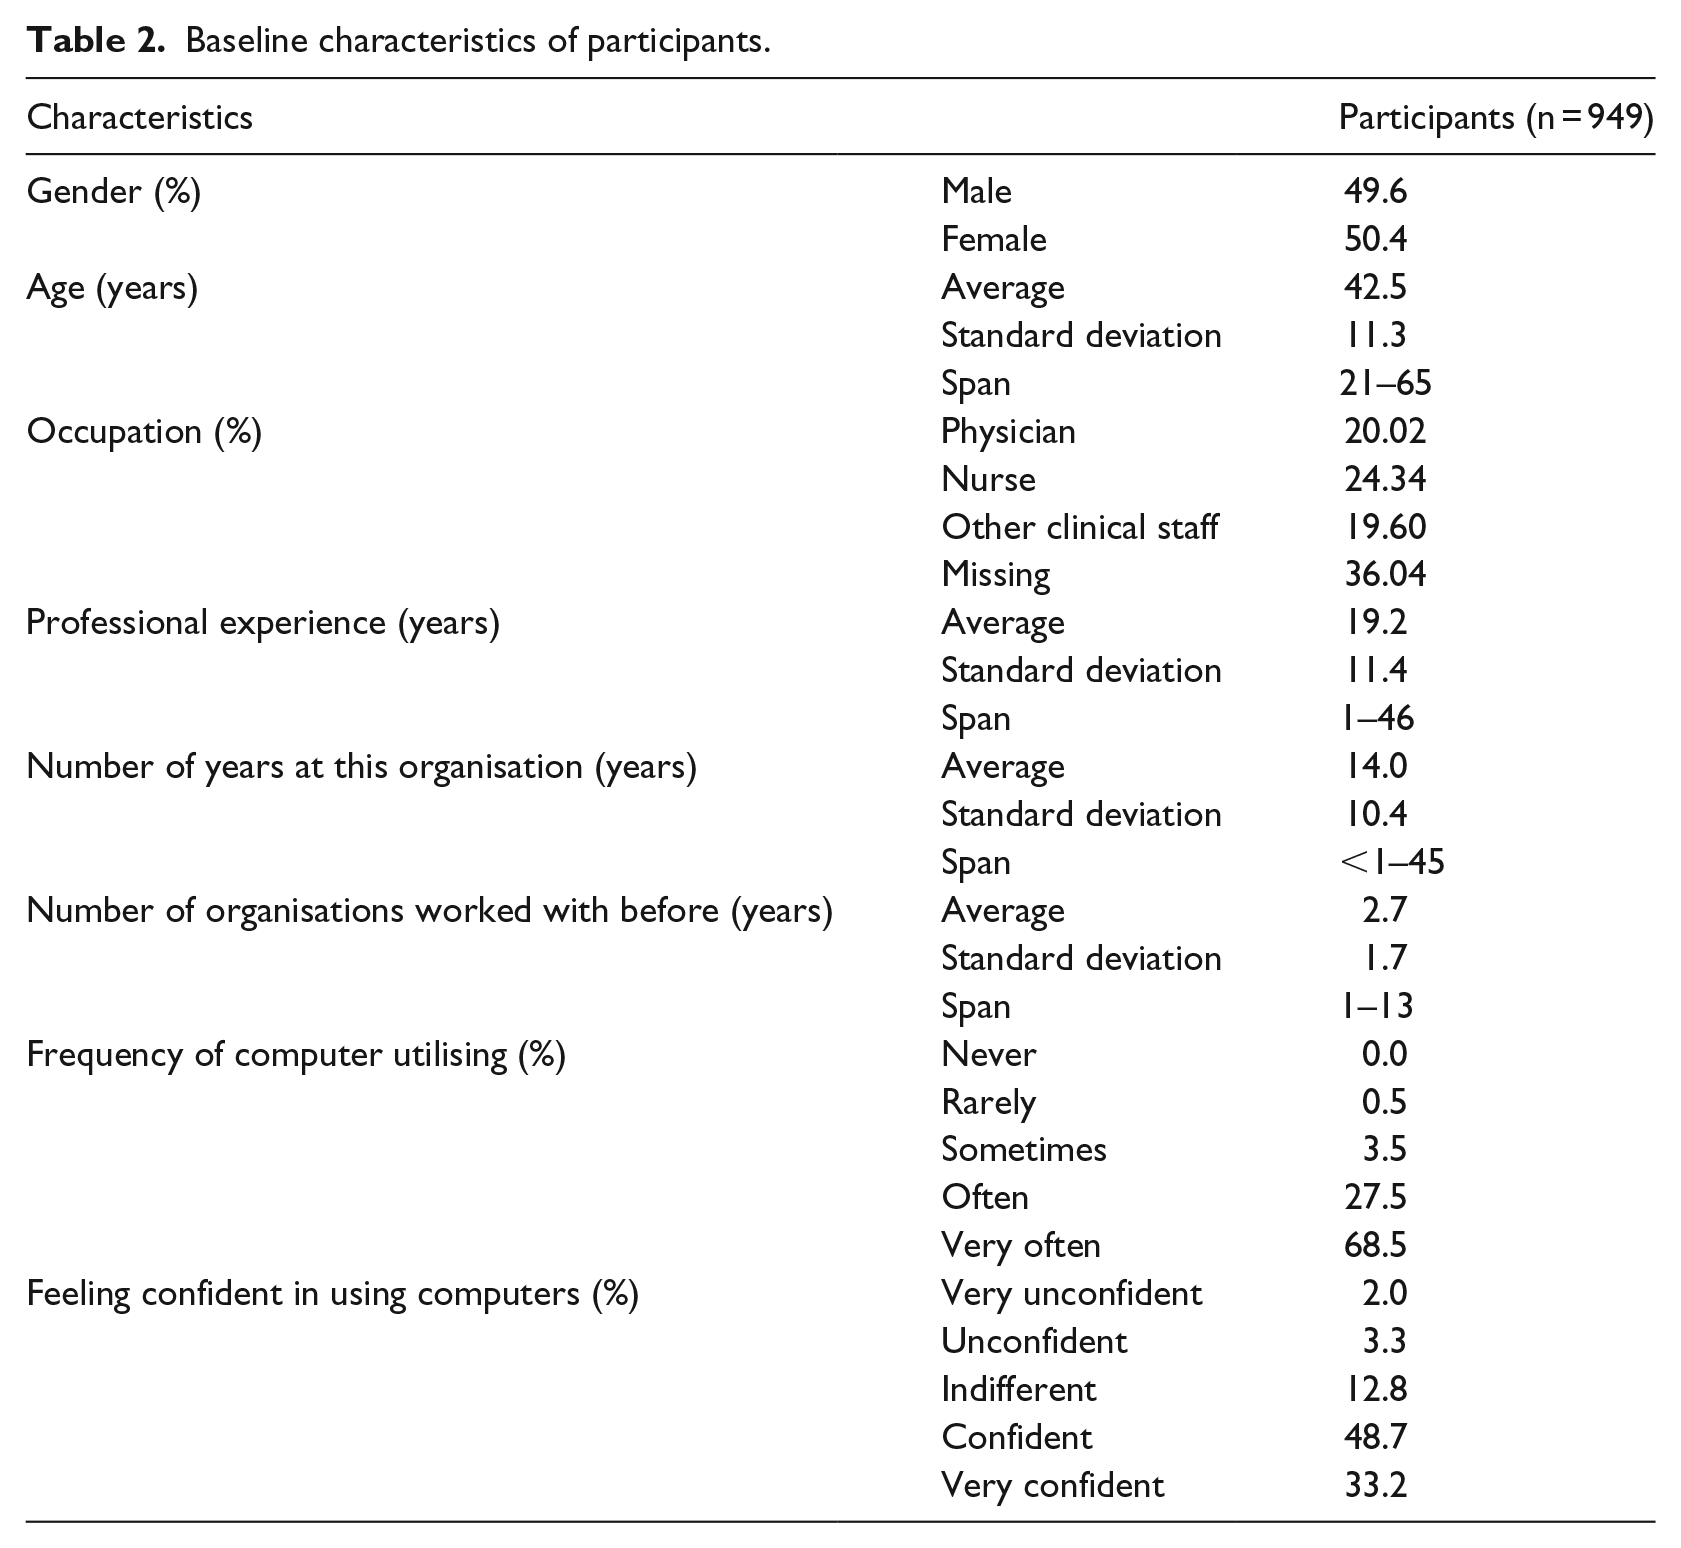
Taking into account the specificity of the subject and the survey method applied, the response rate of 14.01 (population = 6.774) can be considered satisfactory.
However, 50.4 per cent of the participating health professionals were female, and the mean age was 42.5 years. The majority of the respondents had been working in their profession for several years, had a rich work experience and worked at other hospitals during their career. The vast majority of participants are used to working with computers in their daily routine and feel confident in doing so.
Validity and reliability of the usability instrument applied to EPRs
As mentioned above, while previous studies provided reliability values (Cronbach’s alpha), they showed no further test results to prove construct validity and underlying factor structure. This is the first study to present the results of an EFA used to evaluate the dimensionality of a usability construct applied to hospital EPR systems.
Psychometric scale values (mean, standard deviation and skewness) are listed in Table 3, along with other items, such as mean selectivity, value range and internal consistency. Scale distribution was slightly skewed to the left. Selectivity analyses estimate how well participants can differentiate between different manifestations of an attribute. With only a few exceptions, present results prove a high scale selectivity (values between 0.3 and 0.5 are considered moderate, values > 0.5 as high). The scales showed good reliability in terms of internal consistency (with Cronbach’s alpha between 0.85 and 0.94, and a split-half reliability between 0.84 and 0.89), indicating a good scales fitness.
Psychometric values.
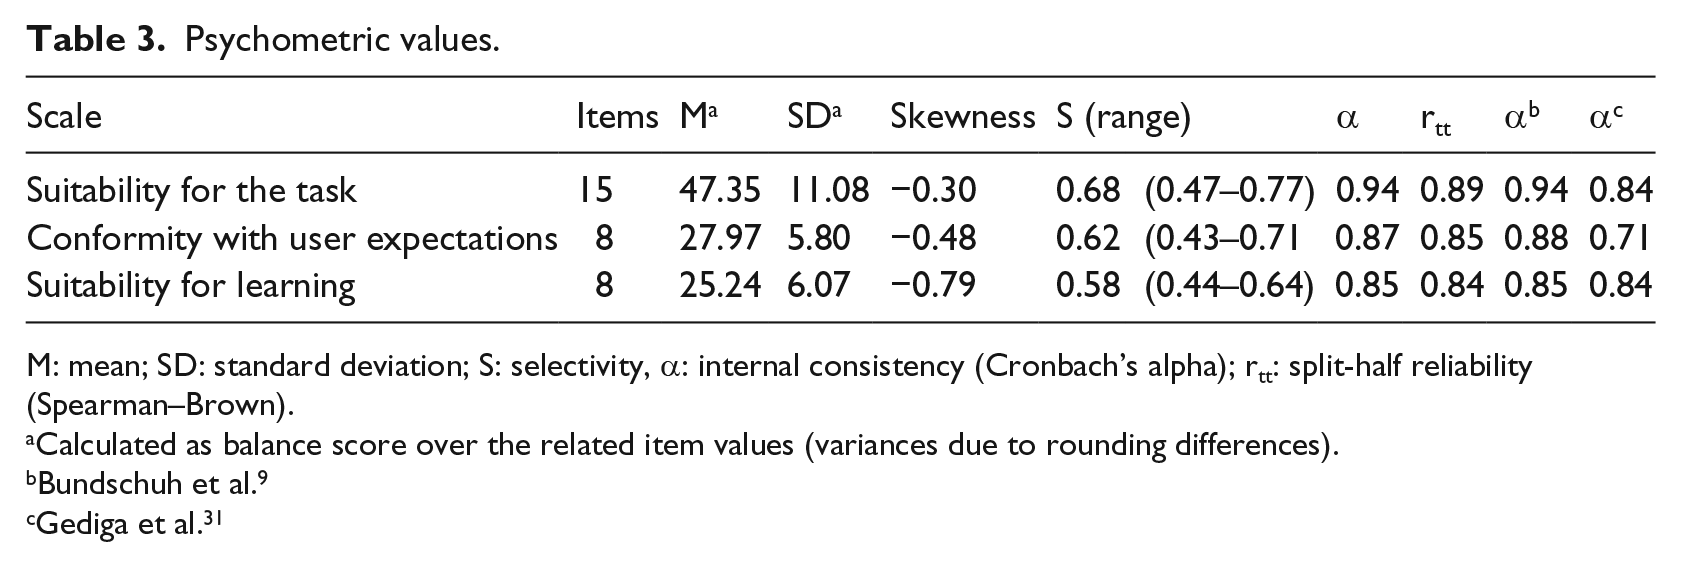
M: mean; SD: standard deviation; S: selectivity, α: internal consistency (Cronbach’s alpha); rtt: split-half reliability (Spearman–Brown).
Calculated as balance score over the related item values (variances due to rounding differences).
Bundschuh et al. 9
Gediga et al. 31
Based on a high KMO coefficient of 0.956 (and further item-specific KMO values) and a highly significant result of the Bartlett’s test of sphericity (χ2 = 5688.315, df = 351, p < 0.001), the data generated by this study proved to be suited for PCA. A final set of 27 items was attained. The final solution comprised three factors (Table 4), explaining 59 per cent of the total variance.
Rotated factor matrix and communalities.
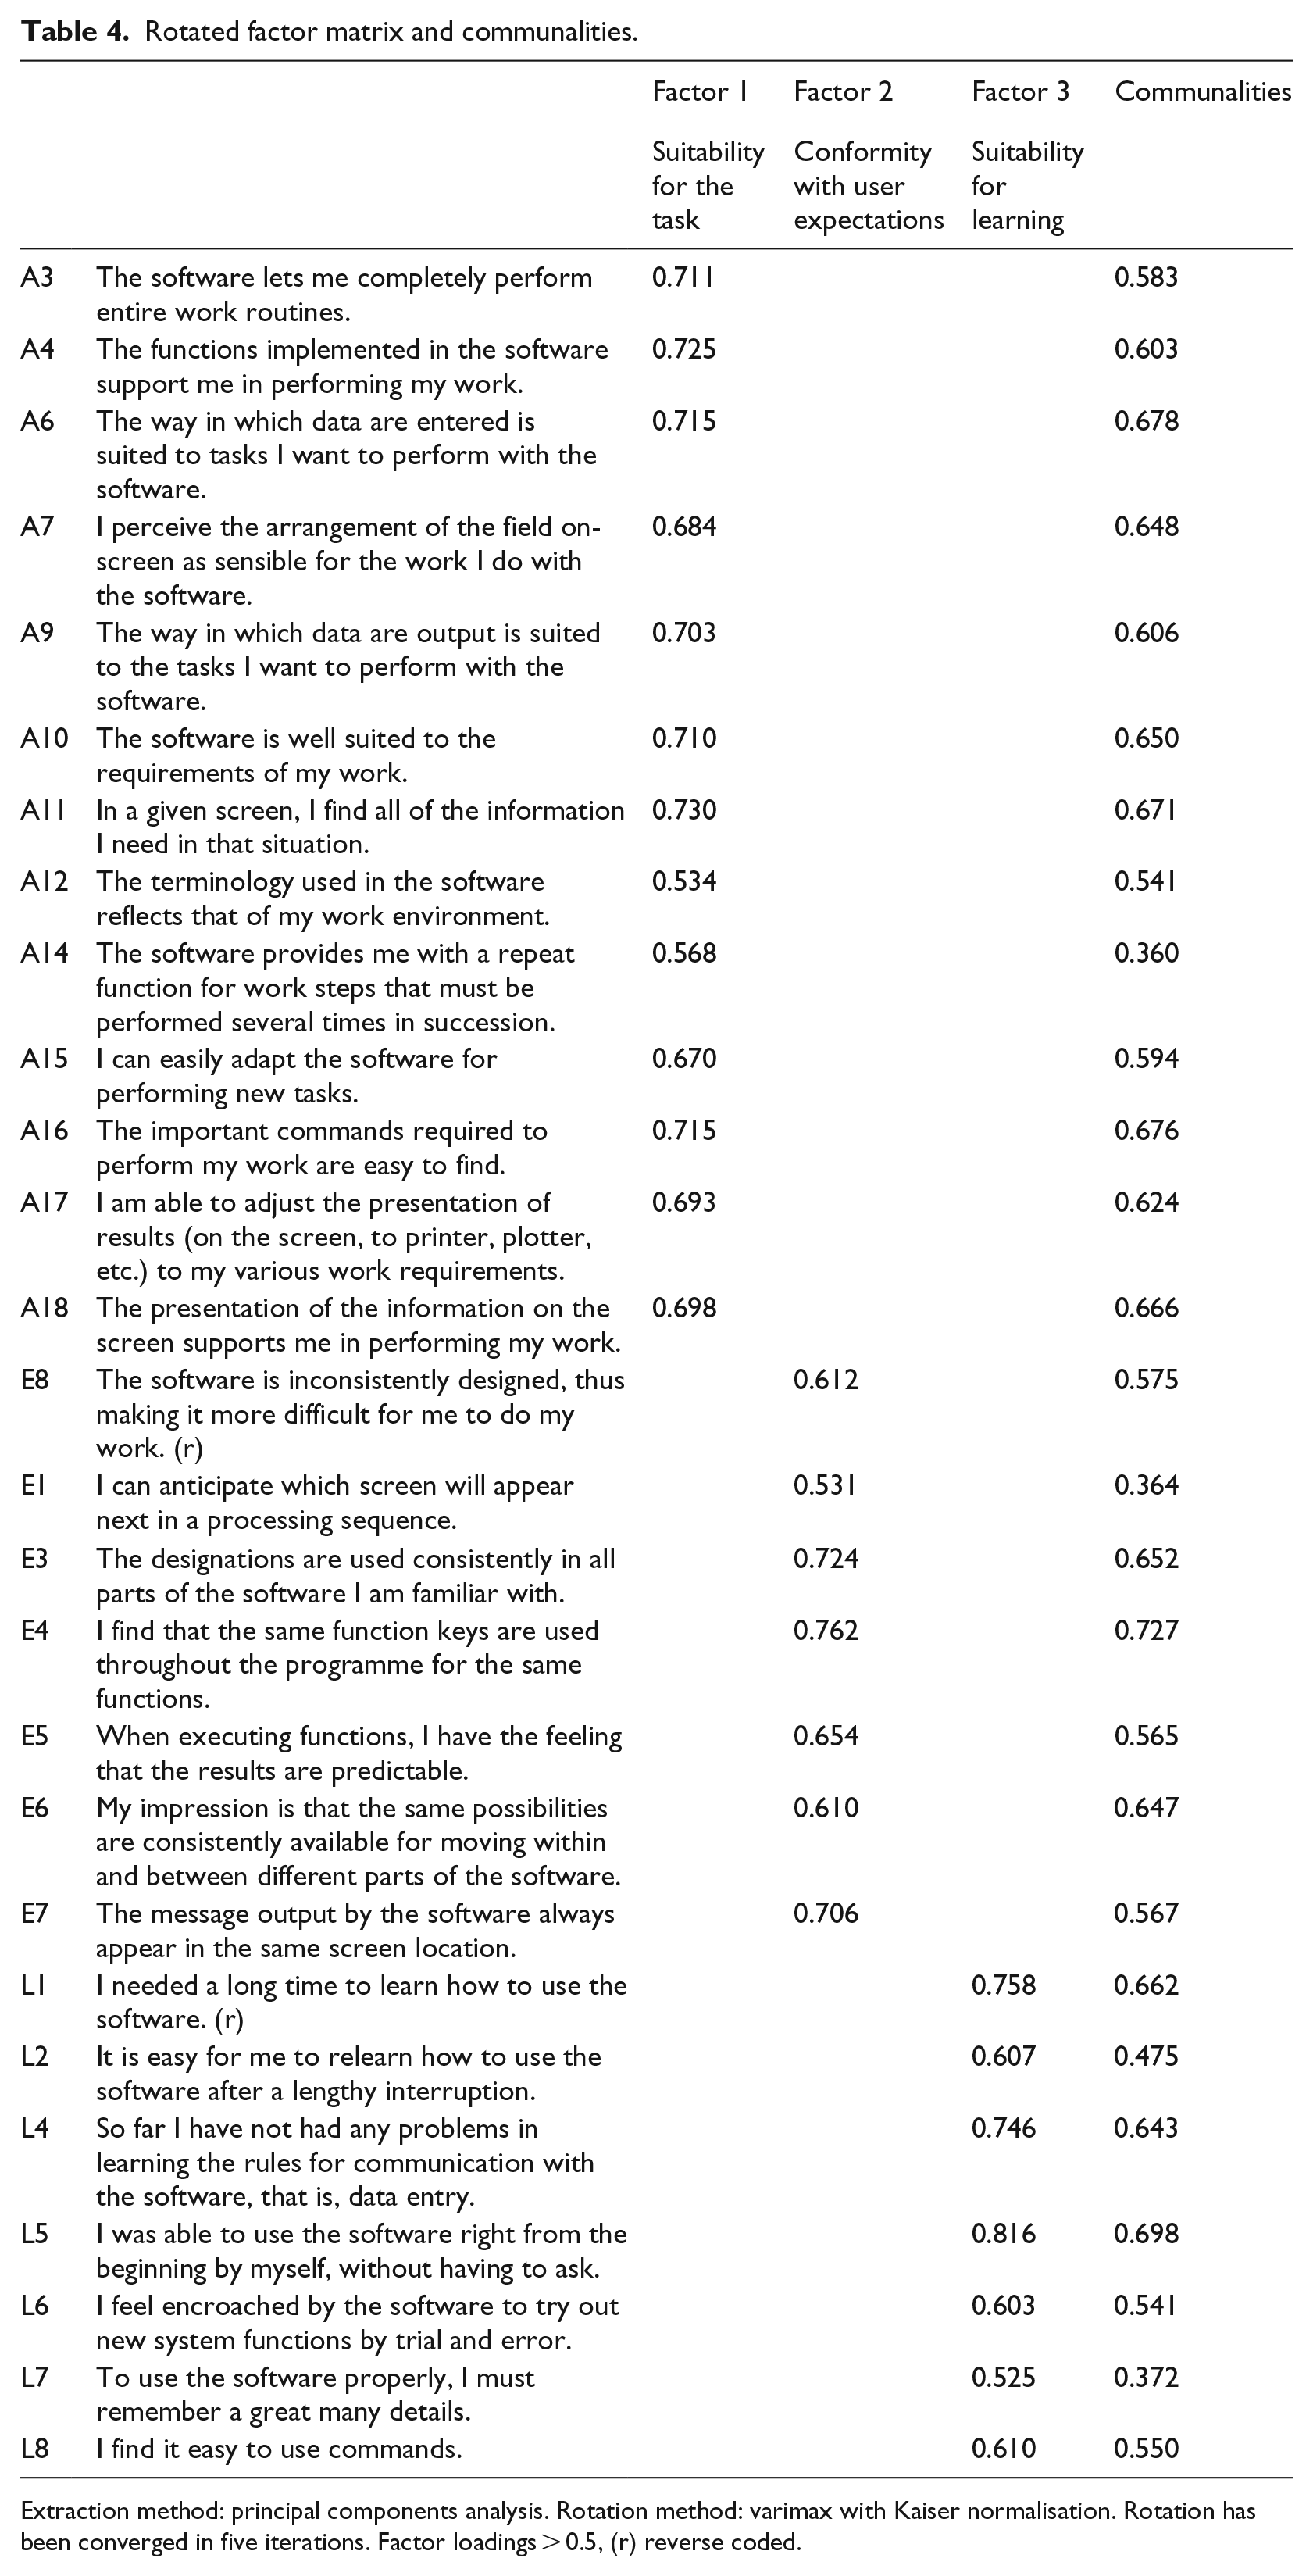
Extraction method: principal components analysis. Rotation method: varimax with Kaiser normalisation. Rotation has been converged in five iterations. Factor loadings > 0.5, (r) reverse coded.
Not one item had to be eliminated due to poor factor loading (<0.3) or a commonality lower than 0.3 (the latter with one exception). Some EPR usability aspects showed double as well as multiple factor loadings. The items ‘unnecessary tasks’ (A1, reverse coded) and ‘too many different steps’ (A8) presented multiple factor loadings on all three factors (>0.4). Poor communality (<0.3) revealed the item ‘no difficulty in predicting how long the software will need’ (E2). Double loadings on two factors showed the item ‘support on demand’ (L3). Accordingly, the inventory had to be reduced. The final solution consisted of three factors: (1) suitability for the task (explaining 46% of the proportion of variance), (2) conformity with user expectations (explaining 7% of the proportion of variance), and (3) suitability for learning (explaining 5% of the proportion of variance).
To evaluate potential method variances and their effects, an additional principal axis factoring and a maximum likelihood analysis were performed. Both extraction methods revealed identical factor structure and item–factor relations, proving a stable three-dimensional scale. Further analysis revealed strong inter-correlations between the three EPR usability factors (Table 5). Moreover, the subscales highly correlated with the overall user satisfaction rating.
Inter-correlations.
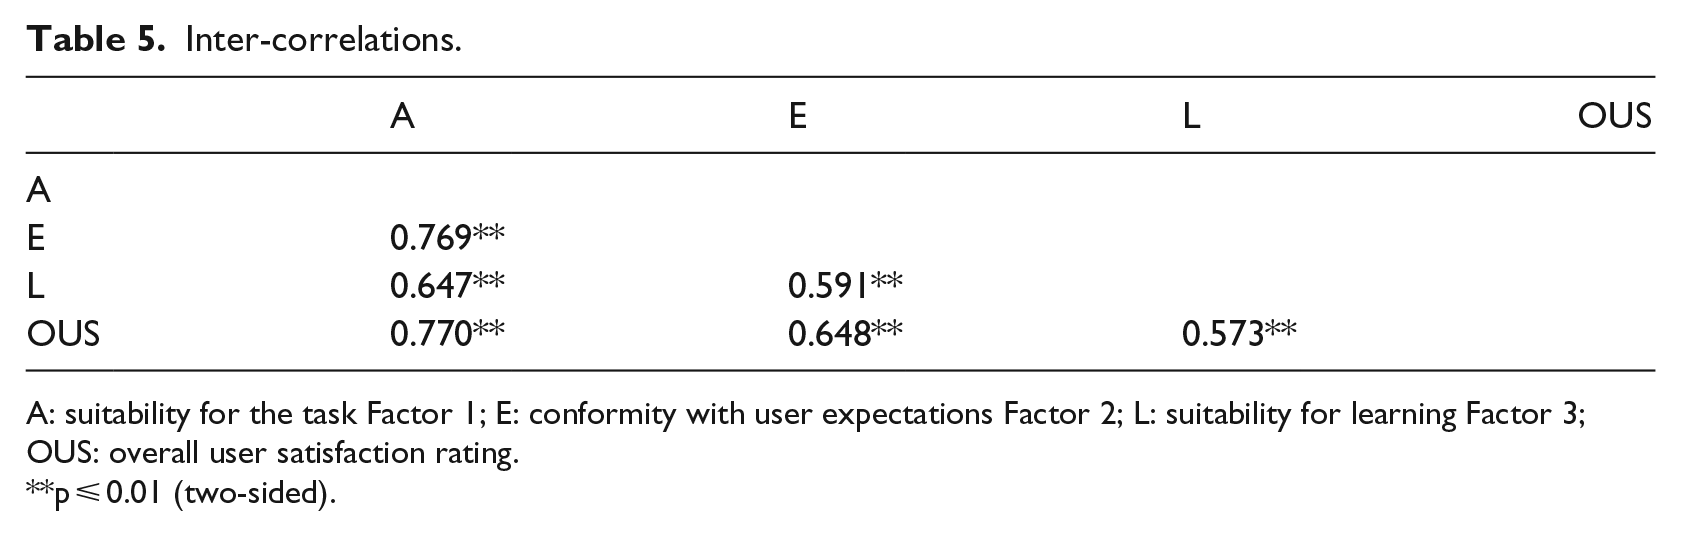
A: suitability for the task Factor 1; E: conformity with user expectations Factor 2; L: suitability for learning Factor 3; OUS: overall user satisfaction rating.
p ⩽ 0.01 (two-sided).
The sample included different system providers and system implementations. Table 6 exemplifies the further ability of the usability scales to distinguish between the three anonymised providers with the highest market share in Germany.
Provider group differences.
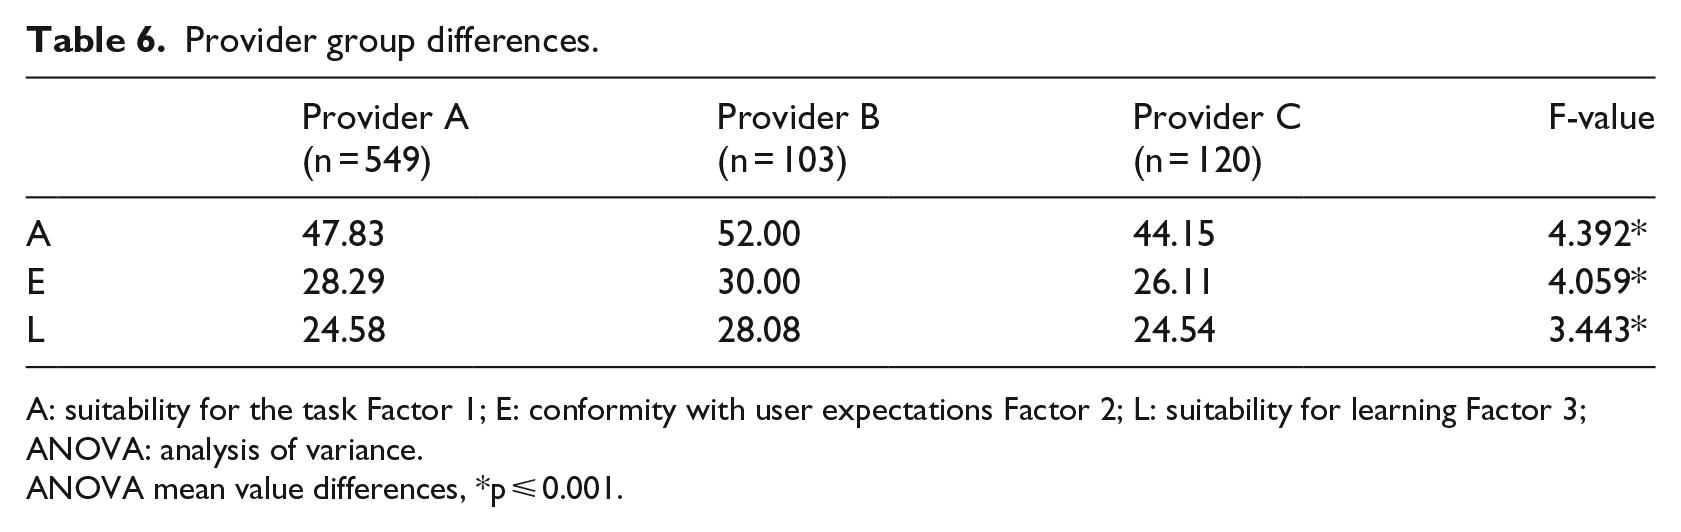
A: suitability for the task Factor 1; E: conformity with user expectations Factor 2; L: suitability for learning Factor 3; ANOVA: analysis of variance.
ANOVA mean value differences, *p ⩽ 0.001.
Descriptive results of EPR usability
Given the rarity of the EPR usability data shown in the above mentioned systematic review, the study will present its descriptive results in addition to the instrument validation reported above. Our descriptive analysis calculated weighed mean values, standard deviation and span per scale, as shown in Table 7.
Descriptive results.
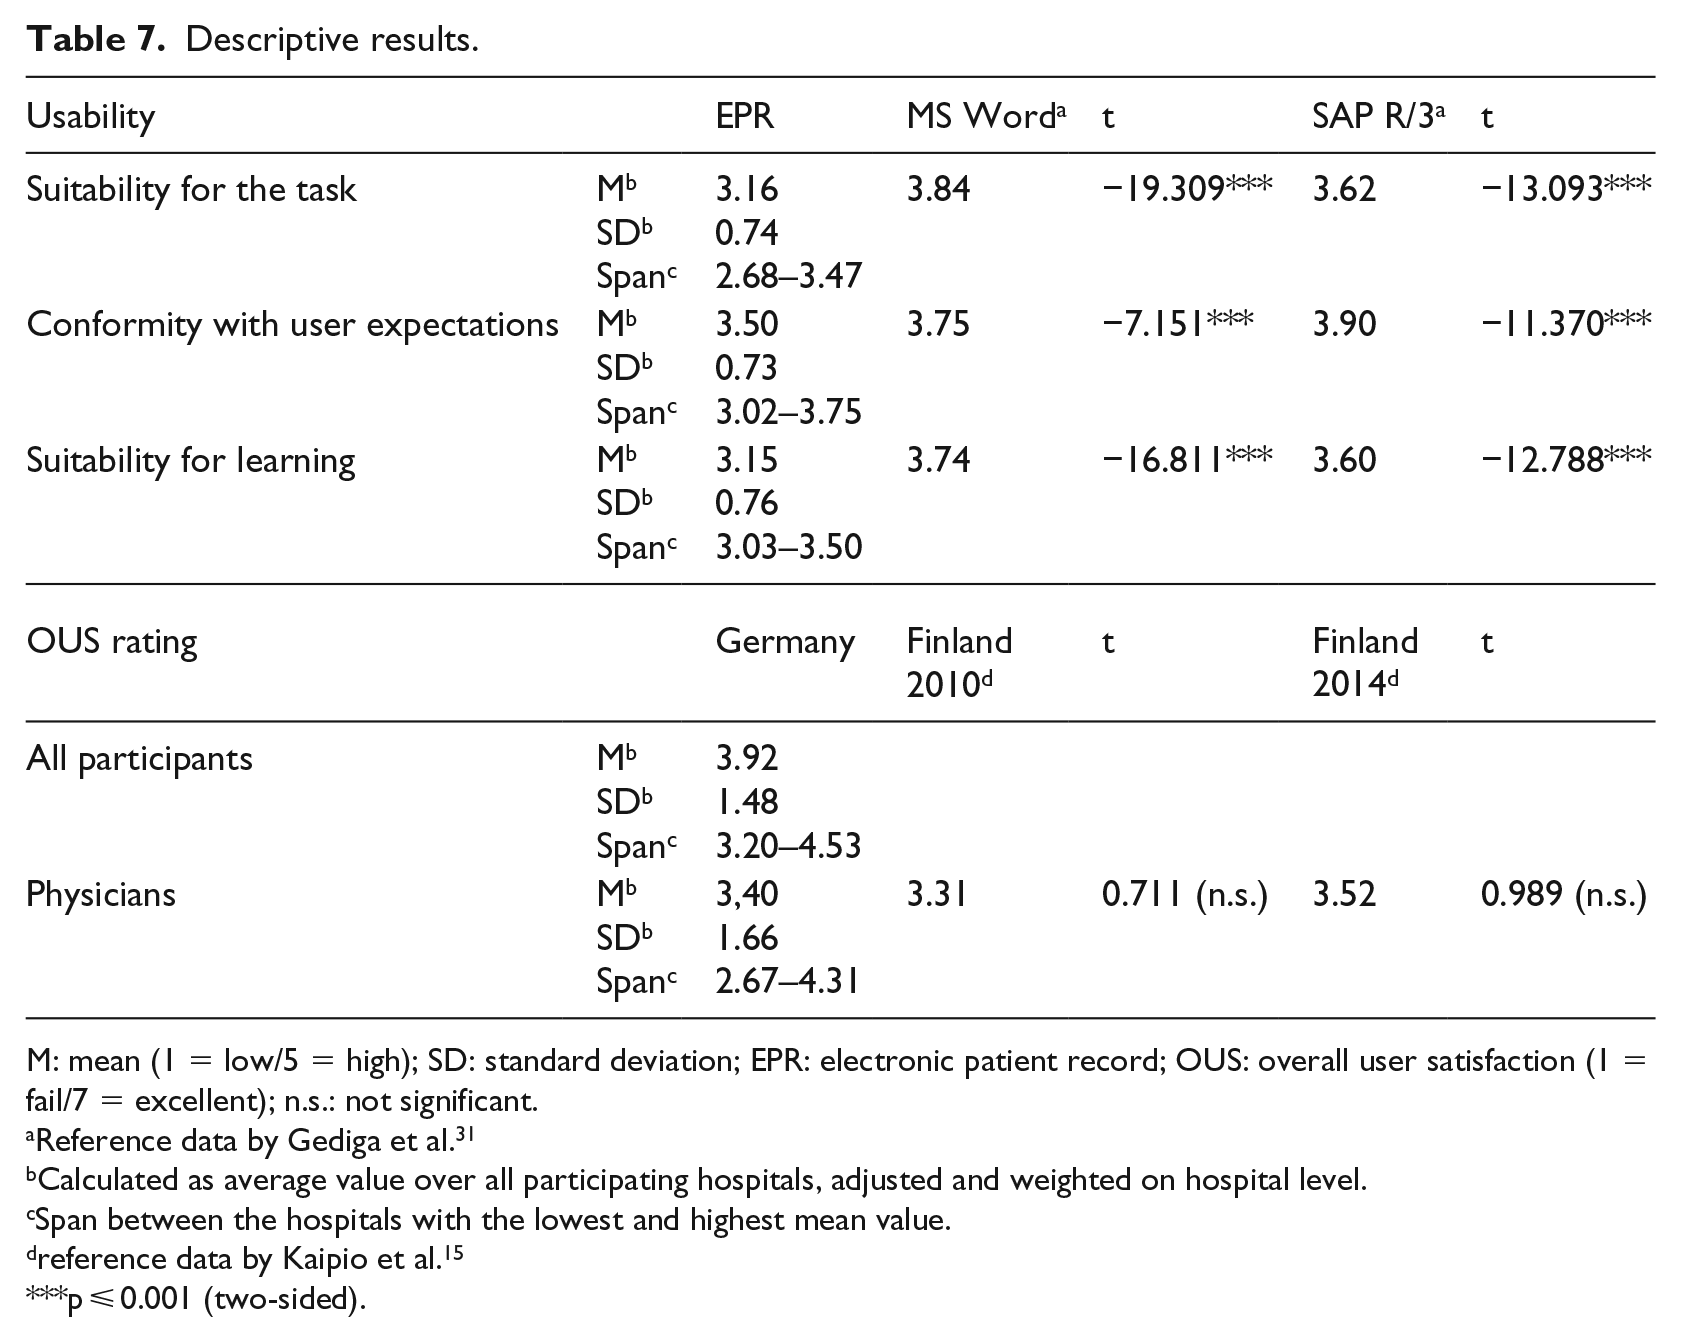
M: mean (1 = low/5 = high); SD: standard deviation; EPR: electronic patient record; OUS: overall user satisfaction (1 = fail/7 = excellent); n.s.: not significant.
Reference data by Gediga et al. 31
Calculated as average value over all participating hospitals, adjusted and weighted on hospital level.
Span between the hospitals with the lowest and highest mean value.
reference data by Kaipio et al. 15
p ⩽ 0.001 (two-sided).
Table 7 shows that from a health professional’s perspective, EPR usability was best for conformity with user expectations. Both suitability for the task and suitability for learning received poorer evaluation. Relevant variations between the different usability dimensions were found, as well as a large span between minimum and maximum values. Differences between health organisations appear rather high considering the large span between the hospital with the lowest and the highest ratings. The comparison of reference values for the usability of standard systems, such as Windows Word or SAP/R3, shows a significant lower usability for EPR.
From the viewpoint of the German health professionals in our sample, EPR systems not only modestly meet their expectations but also show a high potential for improvement.
Discussion, limitations and perspectives
The main purpose of our study was to validate an instrument for measuring clinicians’ perceived usability of EPR systems in a German hospital setting. The study shows that a general inventory (subscales from the IsoMetrics inventory) can be applied to measuring EPR usability as well. As the items demonstrate, the statements are generally valid and can be applied to hospital ERP systems.
Our analysis led to a full set of 27 items comprising three different dimensions of EPR usability. Internal consistency measures were satisfying. EFA revealed a stable three-factor structure which was well aligned with the theoretical framework11,31 and mirrored the dimensions: (1) suitability with the task, (2) conformity with user expectations and (3) suitability for learning. Even though our extracted scale structure already explained 59 per cent of the total variance, there might be further usability factors that can be explored with this instrument, as was suggested by a recent preliminary study based on IsoMetrics content analysis and expert opinion. 37 A recently presented validation study on the national usability-focused health IS scale (PCA led to a 32-item 7-component solution with 65% of the total variance explained in 2014 and 63% in 2017) addressed only physicians’ perceived usability and did not include nurses and other health professions. 38
Our descriptive findings are in line with the pilot survey conducted by Bundschuh et al., 9 revealing also a rather low user perception. (Since Bundschuh provided only graphs and no detailed values, further comparisons were impossible.) Although the Finish survey addressed only physicians, the EPR overall user satisfaction rating was as poor as the results from Finland (Finish survey 2010 and follow-up study 2014).6,15
Also, the large standard deviation suggests a high potential for EPR improvement. In line with the findings from Finland, there seems to be a general risk of delayed improvements due to a general lack of action. 15 Mediocre and poor usability ratings affect the daily work of healthcare professionals, reduce clinical process performance and restrain the overall quality of care for patients. 39 Resent findings on mediocre physicians’ user satisfaction with hospital IT in Germany 40 and less than average results on Electronic Medical Record Adoption Model (EMRAM) maturity level by country comparison 41 correspond with our study results. Although another main issue in German hospitals might be an insufficient IT budget (IT investments in 91% of German hospitals are lower than 2% on revenue 42 and an extrapolated IT investment gap of 11, 6 Mrd. € 43 ) in the hospitals of our validation sample, several points for improving EPR usability were defined, for a start, that is, performance tests to improve speed and reduce ‘click rate’, workflow adjustments, natural dialog, inclusion of essential documents and functions, introduction of power users to better support clinical staff.
This study exhibits some limitations in the cross-sectional design (at a specific point in the time) and the investigational method of the online survey. In spite of the entirely anonymous study setting, among the clinical staff alone 342 respondents did not specify their occupation, which could be interpreted as an indicator of the sensibility of the subject. While the open recruitment procedure of the online study design perfectly suits the study’s main purpose of instrument validation, it does, however, allow neither for a controlled population nor for a representative test. Therefore, our descriptive results do not aim at generalisation. The nine selected hospitals from six hospital organisations represent a certain data sample, and their individual sizes (number of beds) do not reflect the existing distribution. The shift to larger hospitals might correlate with a larger number of heterogeneous applications and potentially independent EPR solutions. As such, our descriptive results obtained are indicative, but certainly not representative. In addition, issues of anonymous questionnaire method are relevant to point out. In our study, we assured all participating hospitals and EPR providers anonymity, following the example of leading studies in this particular field before.6,9,15 We think this has influenced the response rate in a positive way. For further research, especially ERP provider benchmark studies on usability, legal requirements and a national representative sample should be considered.
As outlined above, this study mainly focuses on the validation of a usability instrument applied to hospital EPR systems. According to Comrey, the study’s sample size is very suitable for the purpose of factor analysis. 44
To our knowledge, this is the first study applying and validating a general usability instrument for measuring clinicians’ perceived usability of hospital EPRs. The validated instruments can be used to inform healthcare providers, decision makers and politicians of a given state of EPR usability, discrepancies between different hospitals, systems providers or brands and about potential improvements of EPR usability. Moreover, our descriptive sample data obtained at nine hospitals suggest the existence of serious problems and deficiencies, which significantly affect the efficiency of IT use and clinicians’ routine work in those hospitals. Our study provides a valuable questionnaire as a basis for further representative national surveys in Germany and for future international research.
Footnotes
Acknowledgements
Initially, the investigation responded to an initiative of the German Association of Hospital CIOs (KH-IT – the highest body of German hospital CIOs, representing more than 400 members). The authors thank the participating hospitals and participating IT users. They are also indebted to the students (School of Health Sciences and Management) for helping in the investigation. The authors also thank several hospital CEOs, CIOs, leading physicians and nurses for their administrative support.
Data accessibility
All questionnaires in German and English will be provided upon request by the corresponding author.
Declaration of conflicting interests
The author(s) declared no potential conflicts of interest with respect to the research, authorship, and/or publication of this article.
Funding
The author(s) received no financial support for the research, authorship, and/or publication of this article.