
Abstract
Postoperative pain scores are widely monitored and collected in the electronic health record, yet current methods fail to fully leverage the data with fast implementation. A robust linear regression was fitted to describe the association between the log-scaled pain score and time from discharge after total knee replacement. The estimated trajectories were used for a subsequent K-medians cluster analysis to categorize the longitudinal pain score patterns into distinct clusters. For each cluster, a mixture regression model estimated the association between pain score and time to discharge adjusting for confounding. The fitted regression model generated the pain trajectory pattern for given cluster. Finally, regression analyses examined the association between pain trajectories and patient outcomes. A total of 3442 surgeries were identified with a median of 22 pain scores at an academic hospital during 2009–2016. Four pain trajectory patterns were identified and one was associated with higher rates of outcomes. In conclusion, we described a novel approach with fast implementation to model patients’ pain experience using electronic health records. In the era of big data science, clinical research should be learning from all available data regarding a patient’s episode of care instead of focusing on the “average” patient outcomes.
Background
Every year over 53 million Americans have surgery and pain is an expected treatment-related side effect.1,2 Appropriate postoperative pain management is critical, as poor management can lead to adverse events (e.g. deep vein thrombosis, pneumonia), compromise care of the underlying disease, and promote the transition into chronic pain.3 –5 However, appropriate postoperative pain management remains a major challenge.6 –8 Although patient-reported pain scores are routinely collected and widely monitored in electronic health records (EHRs), 9 the appropriate utilization of these scores is not clear from a policy, clinician, or research point of view. 10 Pain scores are typically reported on a 0–10 scale, where 0 indicates “no pain” and 10 indicates “worst pain.” These scores are generally used reduced to in a single moment, for example, mean or last pain score on discharge day.
Postoperative pain scores are often used as critical indicators for quality of care, providing information on patients’ recovery, guiding pain medications, including opioids, and assisting with clinical judgment regarding their postoperative care. However, there is a big gap between condensing these abundant amounts of data with plausible statistical assumptions and delivering evidence based on these statistical results to care providers. Most studies examining postoperative pain use a single time point or simple summary measures of pain scores (e.g. mean or maximum).11 –13 Nevertheless, within the EHR, pain scores are captured at multiple time points and vary greatly throughout the inpatient stay.13,14 The reduction of pain scores to a single value leads to loss of information that could be critical to pain management and hence patient recovery.
Currently, there is no consensus on the best approaches for reducing the pain score data into a single value. One of the most commonly used methods is to select one summary score on the day of discharge, the mean, maximum, or last pain score before discharge, which is often then categorized into distinct groups (e.g. “no pain, pain score = 0,” “mild pain, pain score 1–3,” “moderate pain, pain score 4–6”, and “severe pain, pain score 7–10”). 15 These categories are then used to represent patients’ entire postoperative pain experience during inpatient stay, which can range from days to weeks depending on the patient’s diagnosis. One criticism of this naïve method is that the selection of a single summary pain score is subjective and sometimes controversial. 16 Simply averaging pain scores across the entire admission might overemphasize irrelevant portions of the clinical course.
Statistical methods, such as latent class growth analysis (LCGA) implemented in PROC TRAJ (SAS), 17 longitudinal LCGA, and growth mixture models (GMMs) implemented with Mplus 18 and R, 19 make it possible to cluster patients’ longitudinal pain path using a unified statistical model. However, most of these methods are sensitive to outliers and model assumptions, and are therefore not suitable for analyzing big data extracted from EHRs. Specifically, mixture models such as LCGA require the outcome of interest to follow a normal distribution. 20 LCGA and GMM models put restrictive parametric assumptions on the structure of clusters, for example, the regression coefficients for individual trajectory need to follow normal distribution, whose mean and variance–covariance matrix depend on the corresponding cluster. Violation of these assumptions may lead to false discoveries and non-reproducible results. Another pitfall for the latent class growth model lies in the fact that the module of some analytical programs, such as PROC TRAJ in SAS, only allows pain scores to be measured at the same schedule for all patients (i.e. 2 days post operation). This is not a realistic case for application with EHR data, whereas pain scores are recorded randomly at any time point throughout the inpatient stay. Furthermore, models such as GMM, implemented in Mplus and R, were computationally intensive, because the model would estimate both the coefficients of the trajectories and the cluster parameters simultaneously, which would lead to exhausted computational memory. To make things worse, computational time could rise exponentially with each increase in the number of clusters. To ensure fast implementation, recent publications on pain trajectory analysis have focused on some semiparametric methods. For example, Kannampallil et al. 21 proposed a method to identify pain trajectories by introducing K-means cluster analysis upon the empirical Bayes (EB) estimates generated from a single mixed-effect model of the entire data. This method is easy to implement, however, the employment of nonparametric K-means cluster analysis is not compatible with its key assumption that estimates generated from the mixed-effect model are from the distribution of one single target population, which also contradicted our original motivation for clustering patients into distinctive underlying subgroups.
Therefore, a new set of methods should be proposed to fully leverage the rich EHR data with fast implementation and appropriate model assumptions that current methods failed to consider. Unlike most existing methods that focus on limited data with stringent assumptions not applicable to EHR data, we propose a new set of methods in consideration of the strength (large sample size) and weakness (big noise) of the EHR data and attempted to address two major challenges: (1) scalability for computation and (2) robustness to model misspecifications. The resulting proposal is a multistep process that requires minimum model assumptions, is robust to outliers, and fast to implement. Therefore, the methods we proposed are the most appropriate to leverage the vast amount of EHR data we currently face and generate evidence that can guide clinical care.
Methods
The method we propose here can be separated into three major steps (Figure 1). We propose to first use robust linear regression to get the individual trajectory. Second, K-medians cluster analysis are applied on these trajectories to identify clusters. The final step is to run generalized mixed models on each cluster to plot the corresponding trajectory patterns.
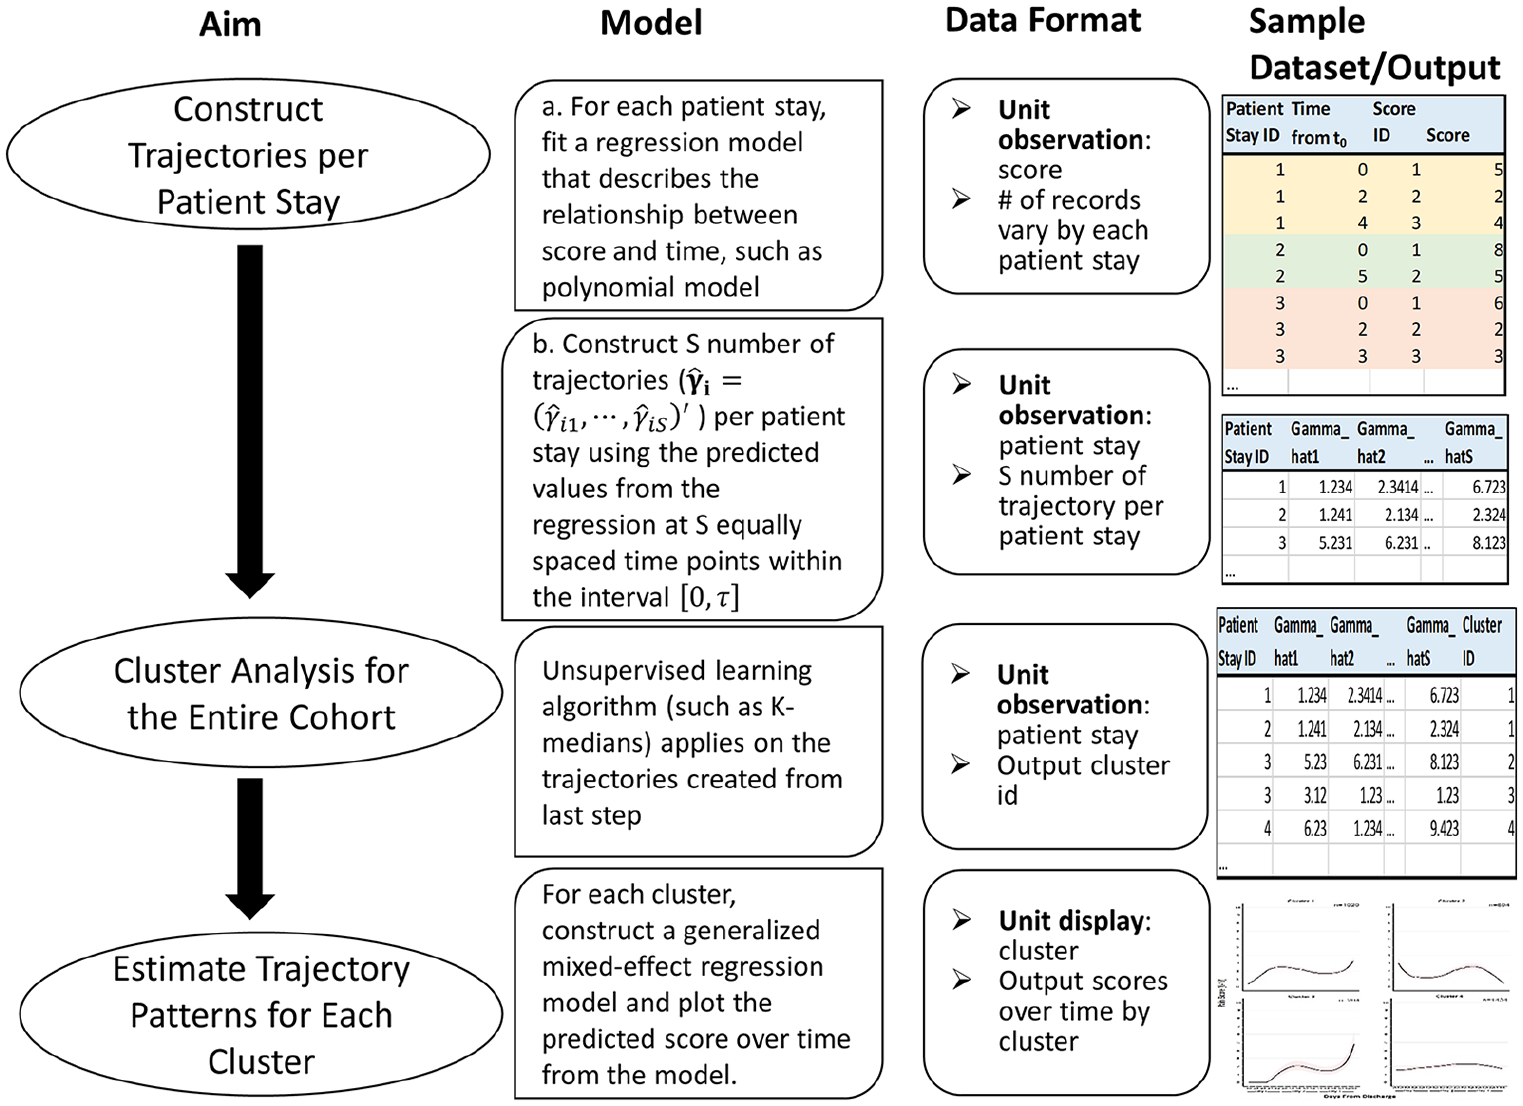
Overview of the three-step methodology employed.
Construct individual trajectory for each inpatient stay
As opposed to longitudinal cohorts, which have a limited number of baseline and follow-up measures, in EHRs, each patient can have multiple pain scores recorded each day throughout their inpatient stay. This provides enough data to separately fit a regression model for each patients’ inpatient stay. Here, we propose to perform robust linear regression (M-estimator from the “rlm function” in MASS package of R) to model the log transformed pain score as a function of the time. This accommodates the non-normal distribution of pain score measures and potential outliers. Coefficient estimates from each regression model are obtained via iterative weighted least square method and used for further cluster analysis.
Specifically, for each individual inpatient stay

where


where
The “basis function” can be any function that may characterize the trajectory pattern, for example, polynomial function, B-spline, S-spline, and so on. Taking the three-degree polynomial function as an example, the regression model can be written as

Nonparametric cluster analysis to identify the trajectory subgroups
The aim is to cluster patient stays according to their estimated trajectory

where
1. For patient-stay

2. K-medians cluster analysis
18
is applied to

where
We will conduct the K-medians clustering analysis with increasing number of clusters
The increase of between cluster variation (BCV) is above 5 %
The smallest cluster is over 5 percent of the overall population,
where the BCV is measured as

These criteria can be adjusted according to the sample size and cluster performance. The final clustering result is given based on the largest number of clusters prior to termination. The cluster performance is also graphically examined by plotting the first two principal components (PCs) from the principal components analysis (PCA) for the trajectory parameters,
Estimate the trajectory patterns for each subgroup
For each cluster we identify in section “Nonparametric cluster analysis to identify the trajectory subgroups,” we further fit a generalized mixed-effects model using the log-scaled pain score as the outcome measure. We may incorporate patient demographics, clinical variables, and treatment variables as independent variables in the generalized mixed-effects model to estimate the adjusted trajectory. Specifically, for all inpatient stays in an identified cluster, we fit the following mixed-effects model

where

and

where
The method implementation is coded using R software (version 3.2.4).
Results
We used data captured in our institution’s EHR database, CLARITY, which is a component of the Epic Systems software. We identified patients undergoing total knee arthroplasty (TKA), which is a common and often painful surgery, using ICD-9-CM, ICD-10-CM and CPT codes, 2009–2016. We captured patient demographics, inpatient/outpatient medications (down to the ingredient level), pain scores spanning the episode of care, type of insurance coverage, and follow-up visits/diagnoses/procedures up to 90 days after discharge. Patients were excluded if age at surgery was less than 18 years or death occurred during the hospitalization. This study was approved by our Institutional Review Board.
A total of 4453 encounters were identified. We excluded encounters that had a length of stay (LOS) less than 1 day or less than 10 pain scores recorded during their inpatient stay. Patients with less than 10 pain scores were excluded from analysis to prevent variability in regression coefficients estimates for individual trajectories. A total of 3442 encounters from 3025 patients were included in our final analytical dataset. There were 81,106 pain scores for the first surgery during the last 3 days of their inpatient stay. The median number of pain scores per inpatient stay was 22 (IQR: 17–28), which is sufficient to fit a cubic polynomial regression model for each inpatient stay.
We focused on the last three postoperative days before discharge since the median of inpatient stay for TKA was 3.2 (IQR: 3.0 – 3.4). A three-degree polynomial function of time, which represented the linear, quadratic, and cubic terms of time from discharge, was used for building the regression model (section “Construct individual trajectory for each inpatient stay”). The pain scores were incremented by one to take into account the information corresponding to 0 pain score (indicating no pain) in the logarithmic response variable. Estimated coefficients (including the intercept) per inpatient stay were used to calculate the trajectory values at seven equally spaced time points
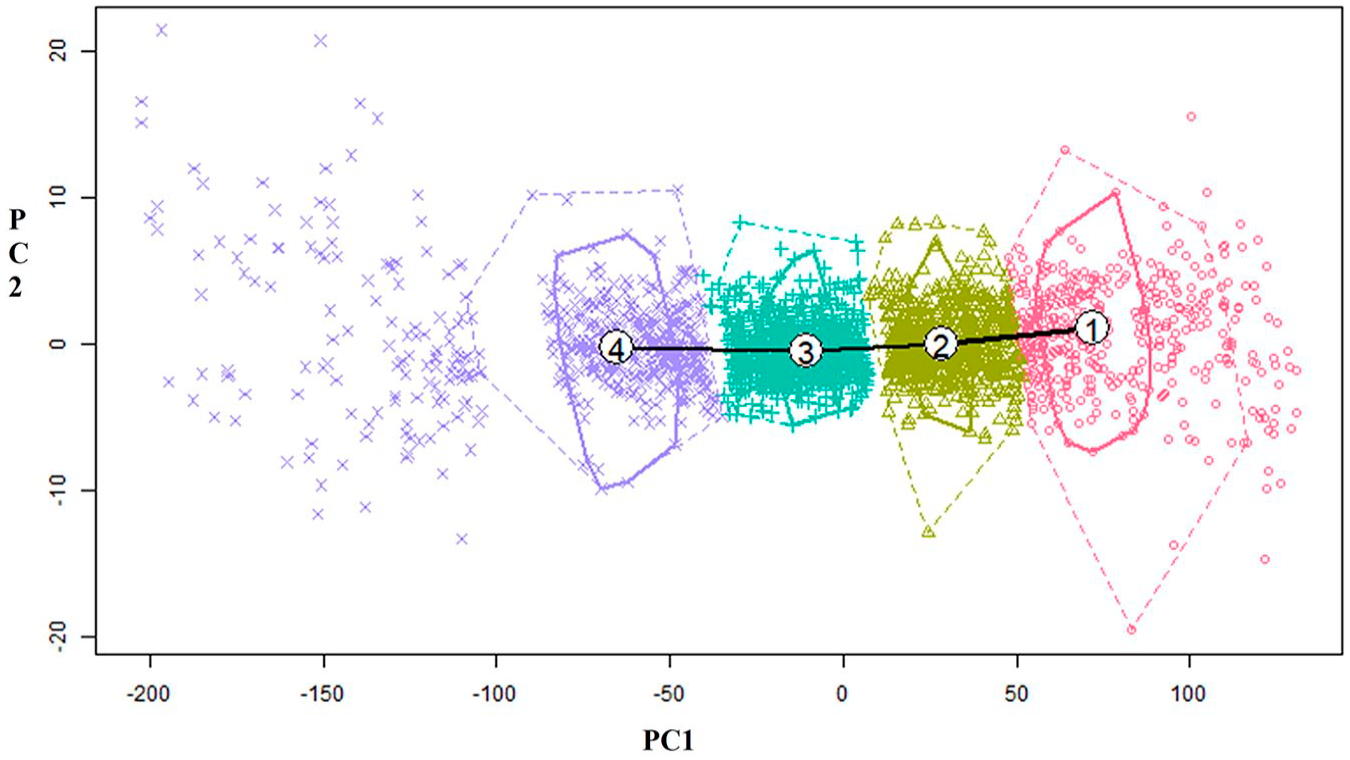
Distribution of the robust linear regression by cluster and major principal components.
Next, we estimated the trajectory pattern by fitting the mixed-effects model for each cluster, adjusting for several patient and clinical-related covariates: patients’ age at admission, race-ethnicity, gender, marital status, number of comorbidities at admission, 23 body mass index (BMI), LOS, length of the procedure in hours, presurgery pain score, and pre- and postsurgery morphine equivalent value per day calculated using oral morphine conversion factors.24,25 Marital status was included because it is related to social isolation and associated with overall well-being. 26 The predicted pain score as a function of time from discharge were plotted for each cluster as shown in Figure 3.
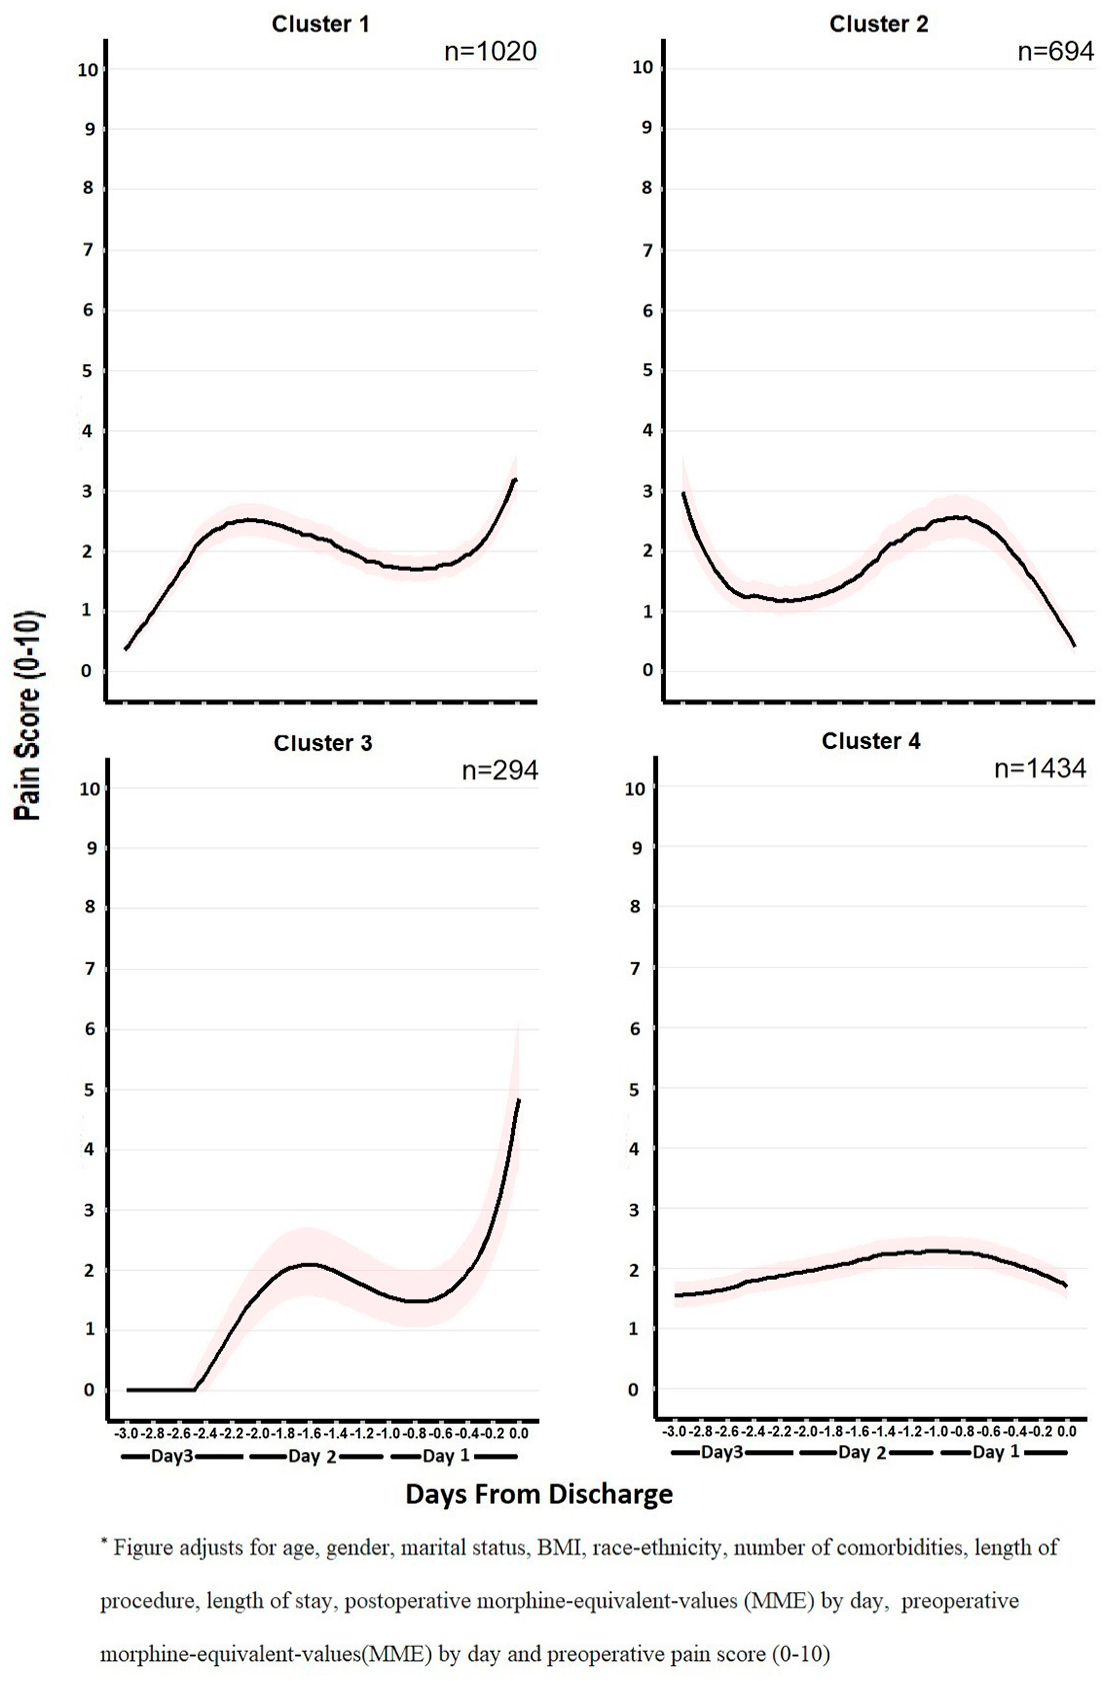
Patients’ patterns of pain score versus days from discharge.
Patients’ characteristics and their clinical information are summarized by cluster in Table 1. Four unique patterns of postoperative pain experience were discovered in our patient cohort. Cluster 1 encounters had mild pain after surgery followed by a steady rise in pain scores before discharge (“Slightly Rise” Group). Their final pain levels at discharge were between three and four. This group of patients was more likely to be female (66%), living without a partner (21%), stayed in the hospital longer (3.5 days), had higher opioid usage after surgery (67.1 mg/day), and higher preoperative pain scores (2.3). Cluster 2 encounters represented a pain trajectory of patients undergoing TKA with moderate pain scores after surgery and fluctuated pain level during their stay but reported very low pain at discharge (“Completely Drop” Group). The patients of this group were older (69.4 years), took less opioids (55.0 mg/day), and received less complicated procedures (length of procedure: 1.7 h). Cluster 3 was a small group of unique patients that initially experienced very low pain immediately following surgery, but their pain rose sharply before discharge (“Sudden Rise” Group). These patients were younger (66.5 years old), more likely to be male (49%), more likely to be Hispanic and Black (20%), had lower preoperative pain scores (1.9), and had less complicated procedures (length of procedure: 1.6 h) compared to patients in the other clusters. Cluster 4 consisted of patients who reported moderate pain (pain score = 2–3) throughout their inpatient stay (“Steady” Group). The “steady” group tended to be younger (67.2 years), had higher preoperative pain scores (pain score = 2.4), experienced longer procedure time (1.9 h), and received more postoperative opioid drugs (69.3 mg/day) during the inpatient stay compared to other clusters.
Patients’ characteristics by cluster.
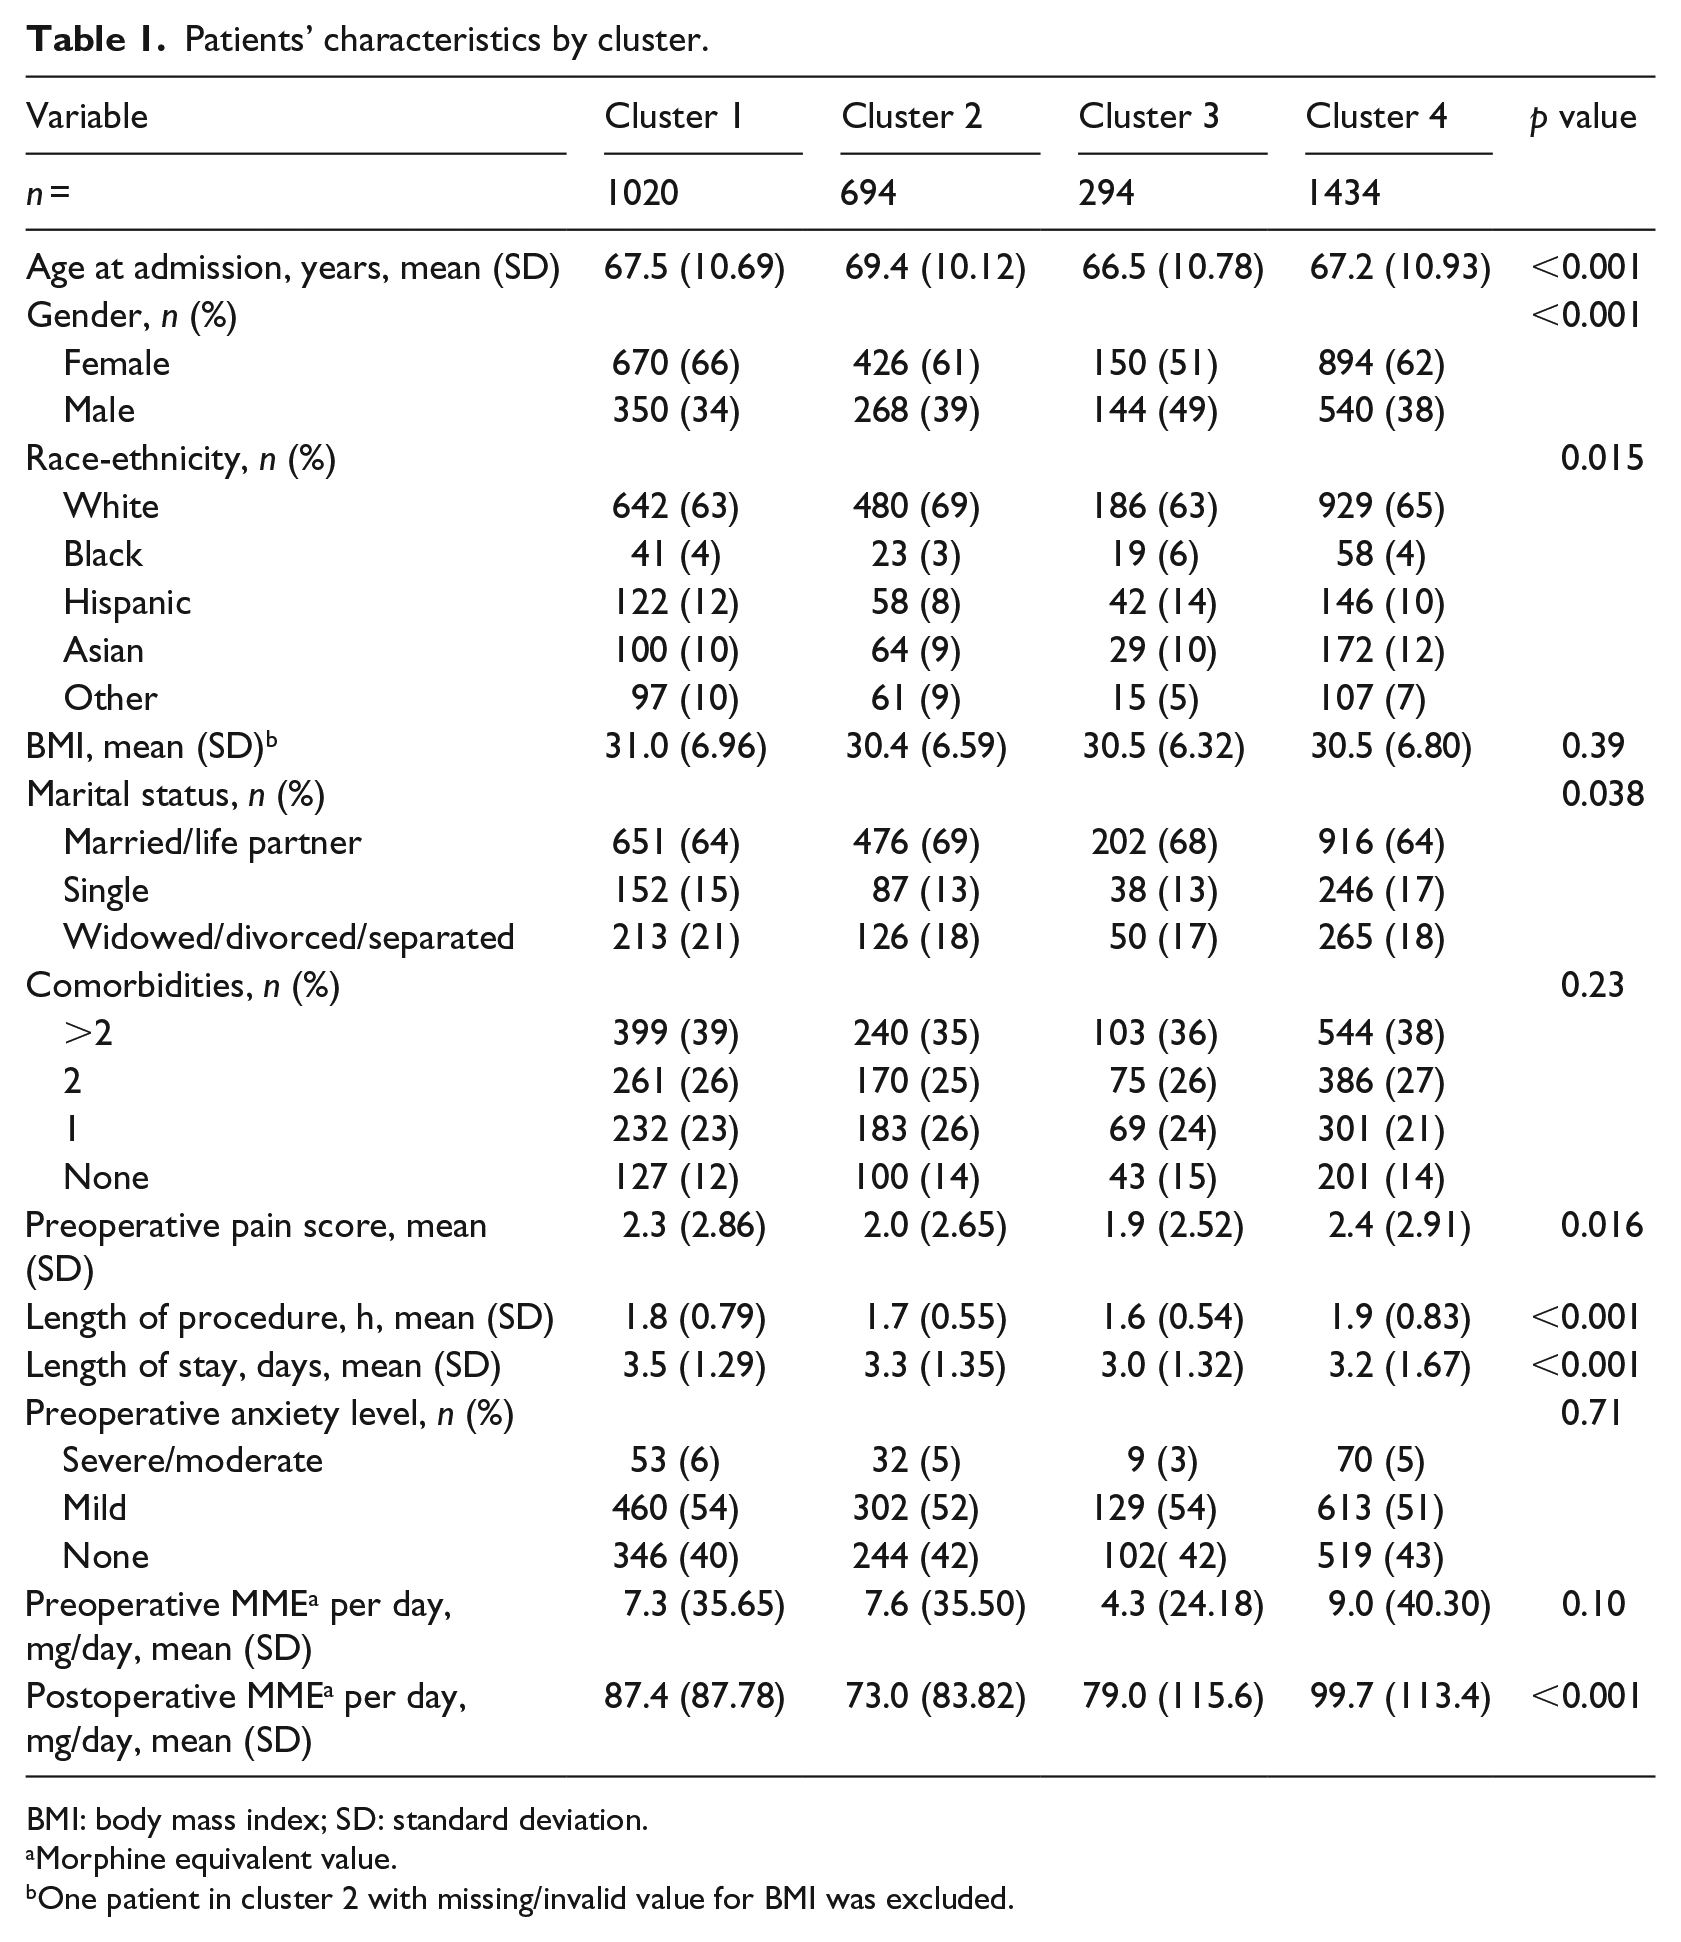
BMI: body mass index; SD: standard deviation.
Morphine equivalent value.
One patient in cluster 2 with missing/invalid value for BMI was excluded.
In our cohort, patients’ inpatient pain experience was marginally associated with patients’ demographics, injury severity, treatment options, and opioid medications. We hypothesized that these trajectories could be used as surrogates of patients’ recovery or early indicators of post-discharge complications in addition to other important clinical factors. Among all the four groups, we also hypothesized that “Sudden Rise” would be one distinct group of patients who might be more susceptible to complications after discharge.
To test these hypotheses, we conducted a set of logistic regressions with the occurrence of 30, 60, and 90-day follow-up visits of all purposes, inpatient readmissions or subsequent emergency department visits, and post-discharge complications (surgery-pain-related revisits, wound infection and others, see Supplementary Table 1) as the binary outcomes, respectively. The pain trajectory pattern, patients’ demographics, and clinical covariates were included as covariates. The “Steady” cluster was set to be the reference group in our analysis because it was a group with the largest sample size and was considered a clinically typical “well-managed” group. Compared to the “Steady” group (Cluster 4), patients in the “Sudden Rise” group (Cluster 3) were associated with higher risk of follow-up revisits (odds ratio (OR): 2.37, 2.11, and 1.97 for 30, 60, and 90-day windows, respectively), any surgery-related pain (OR: 5.49, 3.41, 2.73), and surgery-related chronic pain (OR: 5.82, 2.96, 2.03). In addition, we noticed that the “Complete Drop” group had higher risk of any surgery-related pain (OR: 2.36), follow-up visits of any types (OR: 1.36), and inpatient readmissions/subsequent ED (emergency department) visits (OR: 1.93) 30 days after discharge, although we failed to observe statistically significant effects in 60 and 90 days for these outcomes. No statistical significance was detected for complications of any types across all the observation windows (Table 2). Since readmissions and complications were rare in our population, Poisson regressions and negative-binomial regressions were also performed using the number of post-discharge revisits with any specific outcome as the dependent variable. Consistent with the results from logistic regression, the “Sudden Rise” group had higher rates of follow-up visits at 30-day post-discharge as well as higher rates of any surgical-related pain, including chronic pain in 30, 60, or 90-day window (Supplementary Table 2).
Logistic regression for major post-discharge outcomes by cluster. a
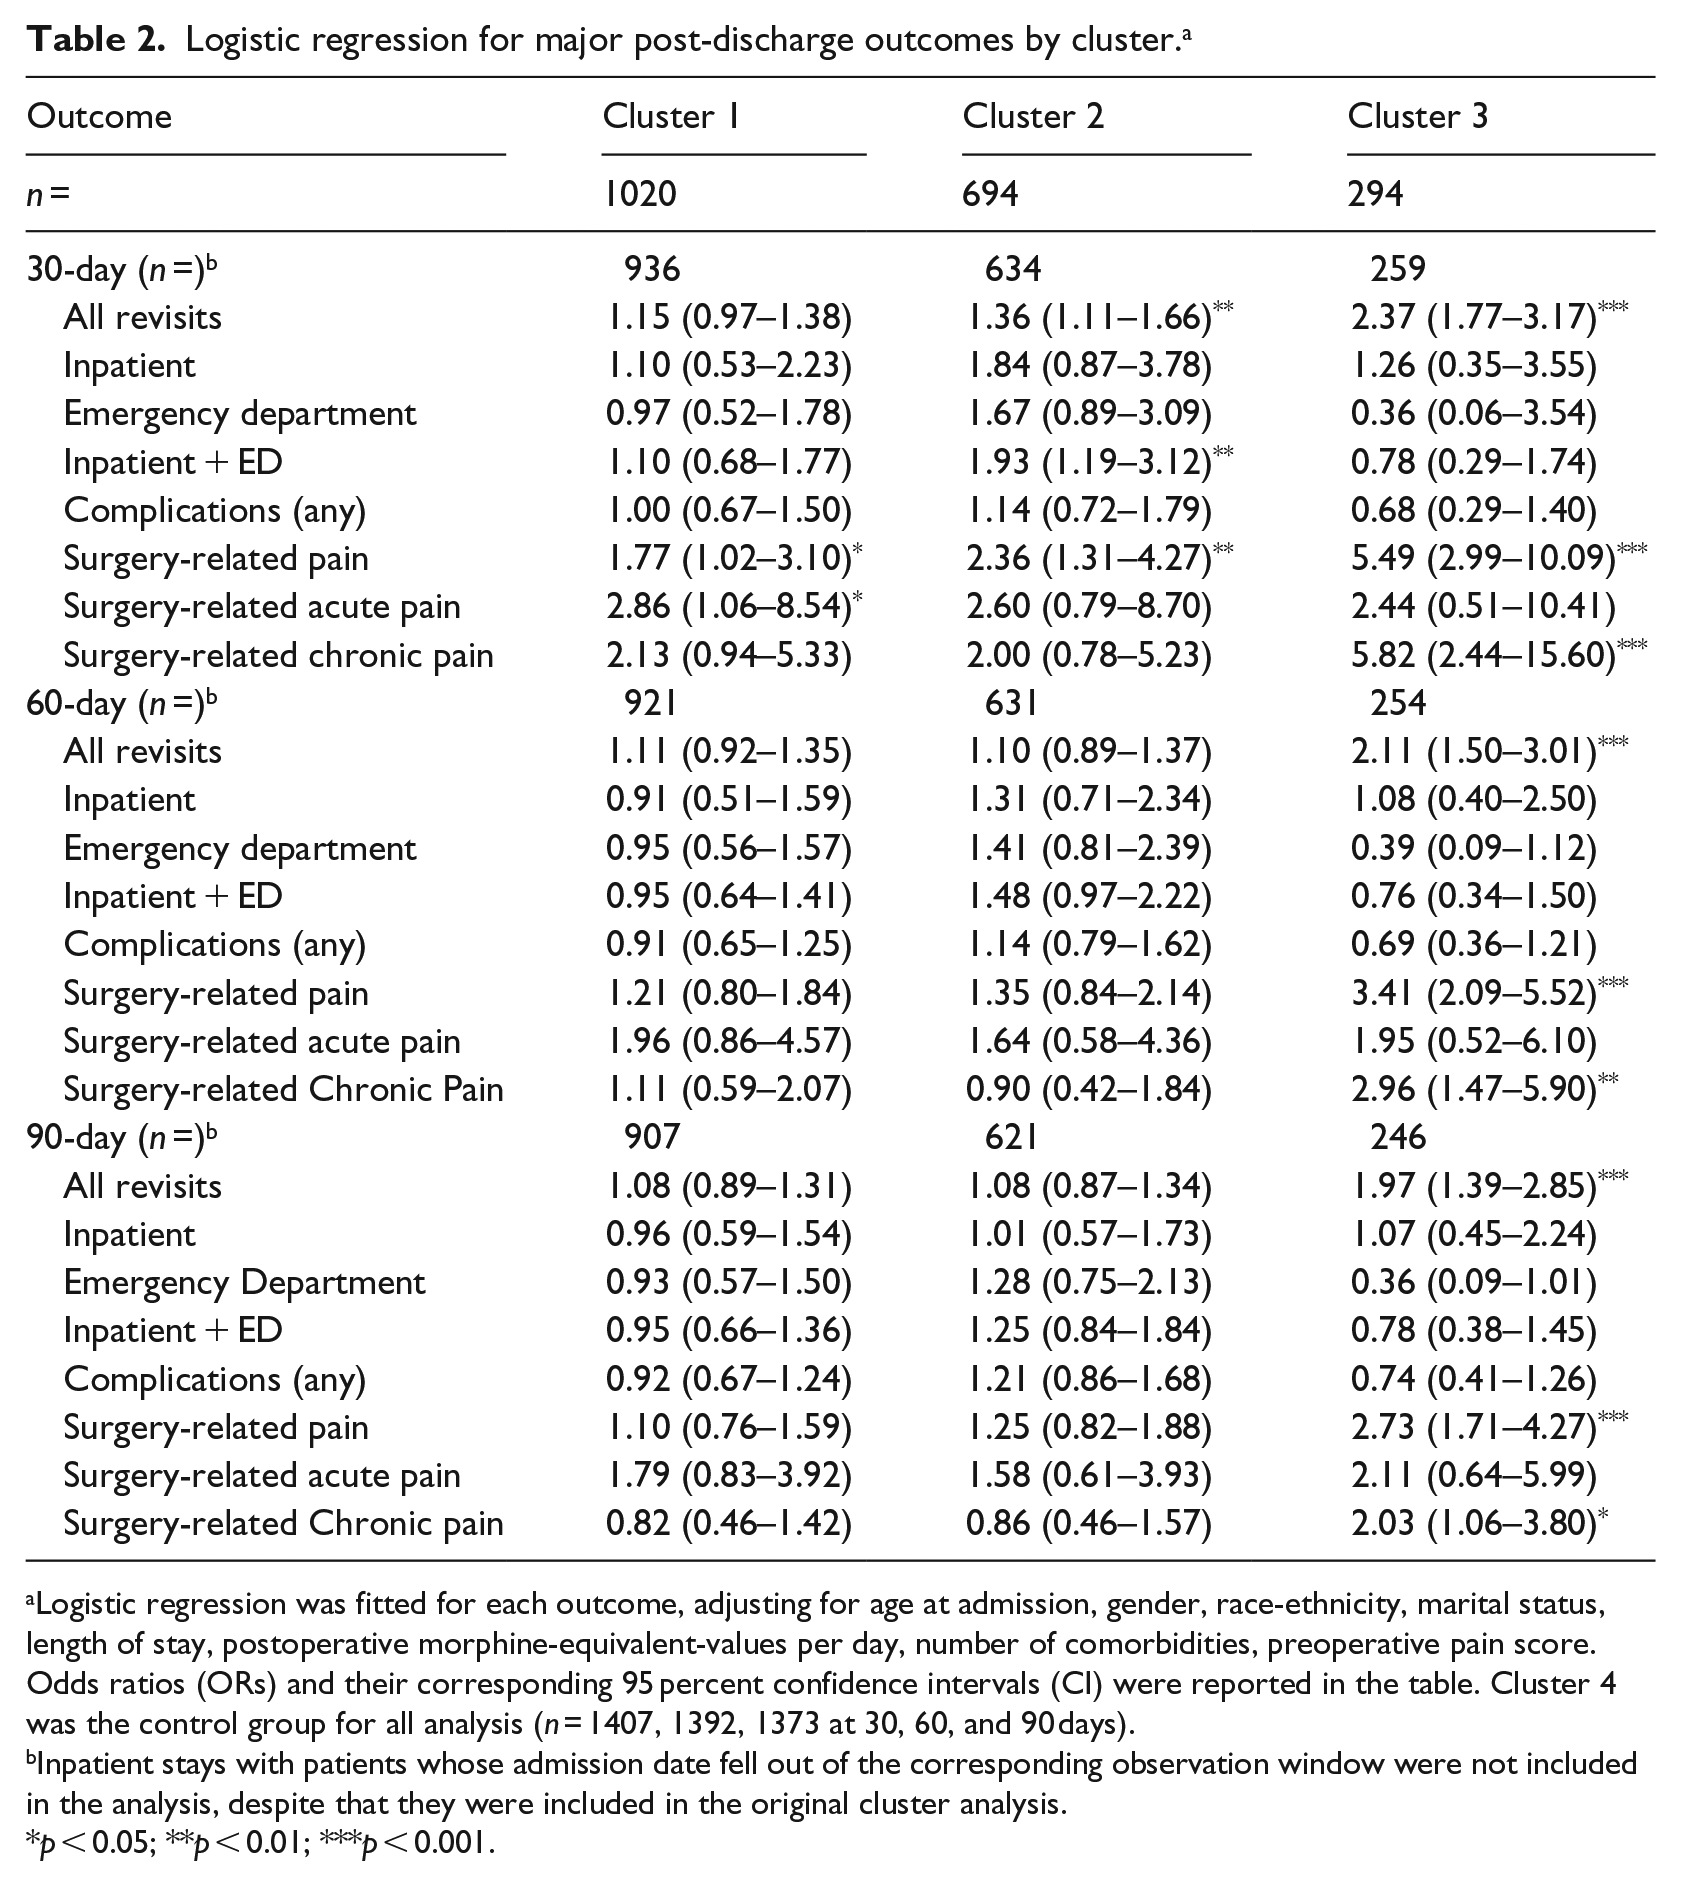
Logistic regression was fitted for each outcome, adjusting for age at admission, gender, race-ethnicity, marital status, length of stay, postoperative morphine-equivalent-values per day, number of comorbidities, preoperative pain score. Odds ratios (ORs) and their corresponding 95 percent confidence intervals (CI) were reported in the table. Cluster 4 was the control group for all analysis (n = 1407, 1392, 1373 at 30, 60, and 90 days).
Inpatient stays with patients whose admission date fell out of the corresponding observation window were not included in the analysis, despite that they were included in the original cluster analysis.
p < 0.05; **p < 0.01; ***p < 0.001.
The trajectory analyses were compared with other basic analytical approaches that are common in the literature, that is last recorded pain score, mean pain score on discharge day, and max pain score on discharge day (Supplementary Figure 1).27 –30 In terms of predictions and model fits, our trajectory analyses outperform all the single score discharge pain methods in regard to their area under curve (AUC) and Akaike information criterion (AIC). (Supplementary Table 3).
Discussion
We have entered a new era in which the healthcare system has undergone dramatic changes. In 2017, over 90 percent of US hospitals had a functioning EHR system. 31 With the improvement of health informatics technology, massive amounts of patient and clinical information are now captured and stored in EHRs. However, how to meaningfully extract and analyze these data becomes a new challenge in both the clinical and statistics world. Pain scores derived from EHRs, as an example here, are often not used efficiently and effectively in clinical research. The practical difficulty lies in that current analytical methods, such as mixed growth curve modeling or GMM, are not scalable to cope with the amount of data in large EHR datasets and other methods of limiting assumptions cannot be used on the complex and abundant EHR data. Therefore, novel methods that are applicable to massive EHR data are critically needed in new areas in big data clinical research.
The method we proposed here, which combined robust linear regression and unsupervised K-medians cluster analysis, was able to compile all the pain score data recorded in the EHR and identify distinguished patterns of inpatient pain scores after TKA surgery. This is achieved by using a scalable approach for dimension reduction, which utilizes regression models to describe the relationship between score and time for each time series/patient stay. Predicted values at a set of prespecific time points that converted varied numbers of scores into a fixed number of trajectories per patient stay were therefore constructed from the regression models for further unsupervised learning/cluster analysis. Our method is flexible with any time metrics (e.g. time before discharge and time after surgery) and any hypothesized shape of the pain scores (e.g. polynomial and S-pline). It is not limited to model pain scores and other numeric or ordinal values that were commonly recorded in the EHR data (e.g. lab values) can be modeled similarly with appropriate modifications. The method is scalable to large amounts of data and does not heavily rely on the restrictive underlying distributional assumptions as the other statistical methods, for example, the GMM. In addition, K-medians clustering was proposed for clustering, which minimized the effects of outliers upon the clustering results. Although we proposed to implement the K-medians clustering and robust linear regression to address the negative effect of the outliers, other techniques, such as weighted dynamic time warping or longest common subsequence distance measure, could be incorporated in our proposed 3-step method with minor modifications as well.
The method developed here was robust and superior in terms of prediction compared to other commonly used pain score analyses, that is mean, last, and maximum pain scores on discharge day.32,33 The single-value analyses were not able to distinguish between patient in the steady pain trajectory and those in the cluster with a sudden rise in pain scores at discharge. This is an important distinction, as patients in the sudden rise trajectory were more likely to have adverse pain-related events following discharge. When analyses focus on a single pain score, it is important understand the ubiquity of pain score recordings in the EHRs. For example, the last pain score recorded can occur minutes or hours prior to discharge, making this number extremely susceptible to inpatient pain medication. Our method that leverages all pain scores captured during the inpatient stay is a clear step toward patient-centered care, enabling clinicians to treat a patient’s pain experience rather than a single pain score.
From a clinical perspective, our method was able to identify subpopulations of patients whose distinguishable inpatient pain trajectories were associated with adverse outcomes, in particular pain-related readmissions. Pain-related readmissions following surgery are not uncommon and are costly to the healthcare system.34,35 The methods developed in this study could be used to identify patients needing additional pain management resources upon discharge. Such pain trajectories could also be incorporated into clinical decision tools at the point of care, providing evidence to guide pain management—a clear need given our nation’s current opioid epidemic.36 –38
There are several limitations in our method. First, the method was developed under the EHR setting in which pain scores are attempted to be recorded at varying intervals over the entire inpatient stay. Furthermore, many question the utilization of pain scores to represent a patient’s pain experience.39,40 However, to date, pain scores are the best representation of a patient’s pain experience at a population level and outside of controlled, qualitative studies. For a single robust linear regression with three-degree polynomial expansion of time, we need to have at least 10 pain scores per stay to obtain an acceptable fit. Therefore, our methods exclude stays with too few values, which may still contain valuable information. Second, we employed several criteria to select the optimal number of clusters, such as the size of the smallest cluster. These criteria can be subjective based on both clinical and statistical judgments and often are determined in an ad hoc manner. Selection of different criteria will therefore result in different results. In addition, for patients that lie close to the boundary between two clusters, the distance to two cluster centers can be similar. Although we choose to assign them into the cluster with the nearest distance numerically, interpretation of these patients is difficult. Such assignment criteria ignored the uncertainty in cluster membership for those patients and tend to dilute the association between the trajectory pattern and clinical outcome. On the other hand, a large number of patients or inpatient stays are needed to identify a trajectory pattern, which is not commonly observed but may be clinically important. For cohorts with small numbers of observations, it will be difficult to distinguish genuine trajectory patterns from “artificial” clusters formed by a random chance. Future application of the method in a nationwide EHR system should be implemented to validate our findings. If validated, the approach could be applied to many other longitudinal clinical data to predict meaningful patient outcomes. Finally, our method could be criticized by the fact that it fails to incorporate the sampling variability of the coefficient estimates in its first step of the individual regressions. In our sample implementation, we specifically restricted the inpatient stays into the analysis with those that had at least 10 pain scores to ensure stability of estimates for the coefficients across all individual regressions. However, further modification that enables the incorporation of the sampling variability could be promising on the premises of our current algorithm.
This work provides several avenues for future research. First, the replication of this study in other healthcare systems could provide meaningful evidence on health setting pain management practices and its effect on postoperative pain outcomes. Here, we look at the associations of pain trajectories with adverse events; however, future work could use pain trajectories to predict patients at risk for adverse events prior to discharge—a clinical tool that would be useful for quality improvement and resource allocation. Finally, the methodology developed in pain can be applied to other clinical domains, such as prostate-specific antigen (PSA) trajectory analyses, and their association with mortality in prostate cancer patients.
Conclusion
In summary, we have described a novel approach with fast implementation to model patients’ pain experience using EHRs. Higher rates of surgery-related pain after discharge were observed in one empirically distinguishable inpatient pain trajectory with EHR data. This approach could be applied to many other longitudinal clinical data to predict meaningful patient outcomes. Moving toward a learning healthcare system, clinical care should be learning from all available data regarding a patient’s episode of care instead of focusing on an “average” patient or score. We now have ever-advancing analytic capacity and our method provides a rigorous and statistically sound approach to leverage longitudinal clinical data from EHRs for personalized treatment plans.
Supplemental Material
Supplementary_Tables – Supplemental material for Trajectory analysis for postoperative pain using electronic health records: A nonparametric method with robust linear regression and K-medians cluster analysis
Supplemental material, Supplementary_Tables for Trajectory analysis for postoperative pain using electronic health records: A nonparametric method with robust linear regression and K-medians cluster analysis by Yingjie Weng, Lu Tian, Dario Tedesco, Karishma Desai, Steven M Asch, Ian Carroll, Catherine Curtin, Kathryn M McDonald and Tina Hernandez-Boussard in Health Informatics Journal
Footnotes
Declaration of conflicting interests
The author(s) declared no potential conflicts of interest with respect to the research, authorship, and/or publication of this article.
Funding
The author(s) disclosed receipt of the following financial support for the research, authorship, and/or publication of this article: This project was supported by Grant No. R01HS024096 from the Agency for Healthcare Research and Quality. The content is solely the responsibility of the authors and does not necessarily represent the official views of the Agency for Healthcare Research and Quality.
Supplemental material
Supplemental material for this article is available online.
References
Supplementary Material
Please find the following supplemental material available below.
For Open Access articles published under a Creative Commons License, all supplemental material carries the same license as the article it is associated with.
For non-Open Access articles published, all supplemental material carries a non-exclusive license, and permission requests for re-use of supplemental material or any part of supplemental material shall be sent directly to the copyright owner as specified in the copyright notice associated with the article.