
Abstract
Getting enough quality sleep plays a vital role in protecting our mental health, physical health, and quality of life. Sleep deprivation can make it difficult to concentrate on daily activities, and lower sleep quality is associated with hypertension, hyperglycemia, and hyperlipidemia. The amount of sleep we get is important, but in recent years, quality sleep has also been deemed significant. Polysomnography, which has been the gold standard in assessing sleep quality based on stages, requires that the subject be attached to electrodes, which can disrupt sleep. An easier method to objectively measure sleep is therefore needed. The aim of this study was to construct an easy and objective sleep stage monitoring method. A cross-sectional study for healthy subjects has been done in our research. A new easy model for monitoring the sleep stages is built on only heart rate calculated by the electrocardiogram. This enabled us to easily assess the sleep quality based on five stages. This experiment included a total of 50 subjects. The overall accuracy in determining the five sleep stages was 66.0 percent. Four stages for sleep are identified accurately compared with other conventional methods. Despite there are no five sleep stage separation method using only heart rate, our method achieved the five separation for sleep with a relatively good accuracy. This study represents a great contribution to the field of sleep science. Because sleep stages can be recognized by the heart rate alone, sleep can be noninvasively assessed with any heart rate meter. This method will make it easier to determine sleep stages and diagnose sleep disorders.
Introduction
This study aimed to identify sleep stages using only heart rate variability. Poor sleep quality and lack of sleep can lead to decreased quality of life and increased risk of lifestyle-related diseases. 1 As sleep monitoring is used to prevent and treat lifestyle diseases, the study of sleep is important.
In general, polysomnography (PSG) is required to precisely evaluate sleep quality overnight. PSG evaluates sleep stages using an electroencephalogram (EEG), electrooculogram (EOG), electrocardiogram (ECG), and electromyogram (EMG) of the jaw and leg muscles, in addition to monitoring airflow and blood oxygen concentration. Based on the analysis of electrical signals, a professional technician identifies the five sleep stages: WK (arousal), REM (random eye movement sleep), N1 (shallow sleep), N2 (moderate sleep), and N3 (deep sleep). PSG is considered to be the gold standard for evaluating the quality of these sleep stages. The first criteria for sleep stages were standardized in 1968. 2 The American Academy of Sleep Medicine (AASM) subsequently published revised sleep scoring criteria, covering both sleep stages and the scoring of arousals, respiratory events, sleep-related movement disorders, and cardiac abnormalities. 3 Iber et al. 4 then published a new scoring manual in 2007. However, the PSG examination requires 45–50 min to attach monitoring devices to the body; these devices limit the subject’s ability to move and use the toilet. PSG also requires hospitalization and is difficult to perform routinely. A better method to easily evaluate sleep quality that does not restrain the individual is warranted. Recently, attempts have been made to automatically determine sleep stages using biological signals in order to reduce the burden on the examinee and the technician as well who must manually determine the sleep stage. Liang et al. 5 assessed the five sleep stages with an accuracy of 88.1 percent using multi-scale entropy for C3 EEG. In addition, Zhu et al. 6 achieved a six-stage assessment with an accuracy of 87.5 percent by applying difference visibility graphs to the Pz position of the EEG. Although these studies achieved high recognition rates for determining sleep stages, these methods also required time to attach the EEG electrodes. Furthermore, any method using EEG is difficult to perform routinely. Accordingly, this article proposes a new and simple method for easily discriminating sleep stages using only heart rate variability by sophisticated signal analysis and feature extraction of heart rate and heart rate variability at each stage of sleep.
The interval between human heart beats varies depending on sympathetic and parasympathetic activities. Differences in heart rate variability are generally compared using the low-to-high frequency (LF:HF) ratio. A previous study proposed discriminating between REM and non-REM (NREM) sleep using the LF:HF ratio. 7 As humans transition from the awake state to the sleep state, the LF:HF ratio decreases. 8 This is due to recovery of the body, a decrease in the basal metabolic rate, and activation of the parasympathetic nervous system during sleep. As a result, the heart rate and heart rate variability decrease and the LF:HF ratio is relatively low. The LF:HF ratio is also different in each sleep stage.9,10 The LF:HF ratio is reportedly higher during REM sleep than during other sleep stages.11,12 During REM sleep, the basal metabolic rate increases 13 and the sympathetic nervous system is activated, causing the LF:HF ratio to increase. In addition, there may be a relationship between heart rate variability during sleep and EEG findings.
Dumont et al. 14 showed the interdependence between heart rate variability during breathing and the EEG using synchronization likelihood. In addition, Yeh et al. 15 used detrended fluctuation analysis to show that there is fractality in heart rate variability and EEG findings during sleep. Since sleep stages are mainly determined using an EEG, documentation of a correlation between heart rate variability and EEG characteristics would suggest the feasibility of determining sleep stages using heart rate variability, which is the objective of this study.
Participants and methods
Participants
PSG was used to monitor 50 healthy people during the experiment. As data were missing from five subjects, these individuals were excluded from the study. All participants provided written informed consent, and this study was approved by the ethics committee of the university (no. 30-25).
PSG
In this study, sleep stages were determined using only ECG data, and the recognition rate was calculated in comparison with correct data determined by PSG. PSG was performed using an Alice PDx (Koninklijke Philips) portable diagnostic recording device in a temperature- and humidity-controlled room (26°C, 55% humidity) at the Kyosei-kan Collaboration Complex at Keio University. The PSG recording included 16 channels: 4 channels for EEG (C3, O2, A1, and A2 in a 10–20 systems), 2 for EOG, 3 for EMG, 2 for ECG, and 1 each for nasal cannula flow, pulse oximetry, abdominal/chest movement, temperature, and position sensing. A blinded, board-certified, experienced sleep technician manually performed PSG scoring every 30 s based on the AASM guidelines (AASM manual for the scoring of sleep and associated events, 2007, ver. 2.1). The sampling rates for the EEG, EOG, and ECG were 1000 Hz (data logging) and 128 Hz (data analysis). Sampling rates for the other measurements were 128 Hz for both data logging and analysis.
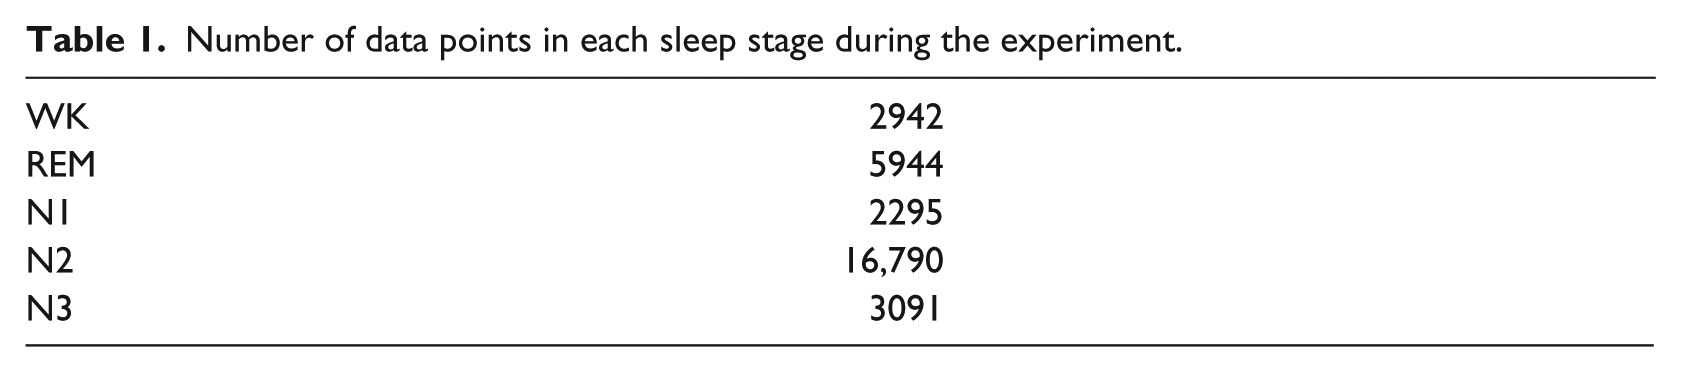
In this study, sleep stages were estimated using only ECG data, and the recognition rate was calculated in comparison with correct data obtained by PSG. Table 1 indicates the total sleep stage data from all participants, recorded every 30 s by PSG.
Number of data points in each sleep stage during the experiment.
Feature extraction using the ECG for sleep stage classification
Preprocessing and calculation of the ECG R-R interval
First, a band-pass filter of 5–15 Hz was applied to the ECG to eliminate noise. Subsequently, the ECG was divided into 30-s intervals. To emphasize the R-wave peak (Figure 1), the signal was squared to specify the R-wave with a window width of 0.5 s and a shift length of 0.25 s.
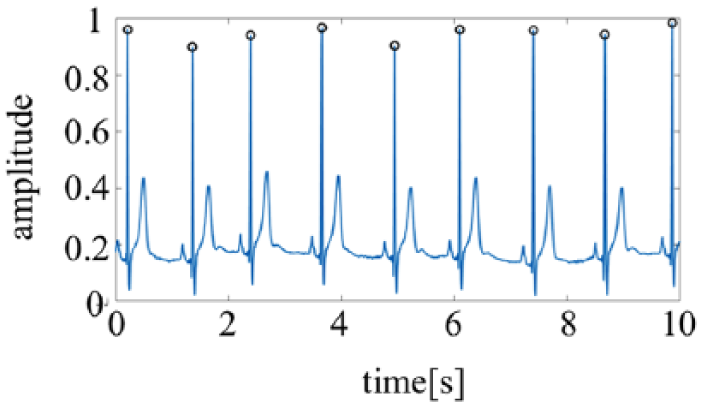
Sample of R-wave detection. Open circles indicate the R-wave peak.
Calculation of the R-R interval
After specifying the R-wave, the R-R interval (RRI) was calculated by creating RRI time series data (Figure 2). Since the RRI varies, resampling was performed using a spline interpolation with a sampling frequency of 4 Hz.
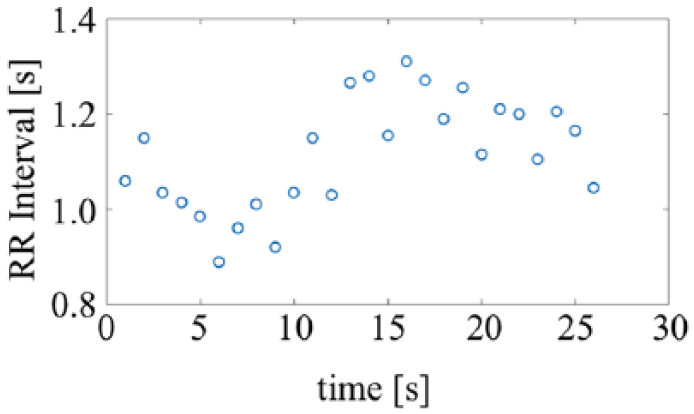
Sample of R-R interval series data. Open circles indicate the trajectory of the RRI.
Calculation of VLF, LF, and HF by the power spectral density
Next, the power spectral density (PSD) was calculated from the RRI time series data using an autoregressive (AR) model 16 (Figure 3). The PSD was used to obtain very low frequency (VLF), LF, and HF data, and the LF:HF ratio. Unlike the Fourier transform, the AR model can even perform frequency translation with HF resolution for short time series data. The AR model is also suitable for determining variations in peak frequency; thus, PSD was used in this study. The AR model was constructed using the Yule–Walker method, 17 and the order of the AR model was selected based on the Akaike information criterion (AIC) 18

where
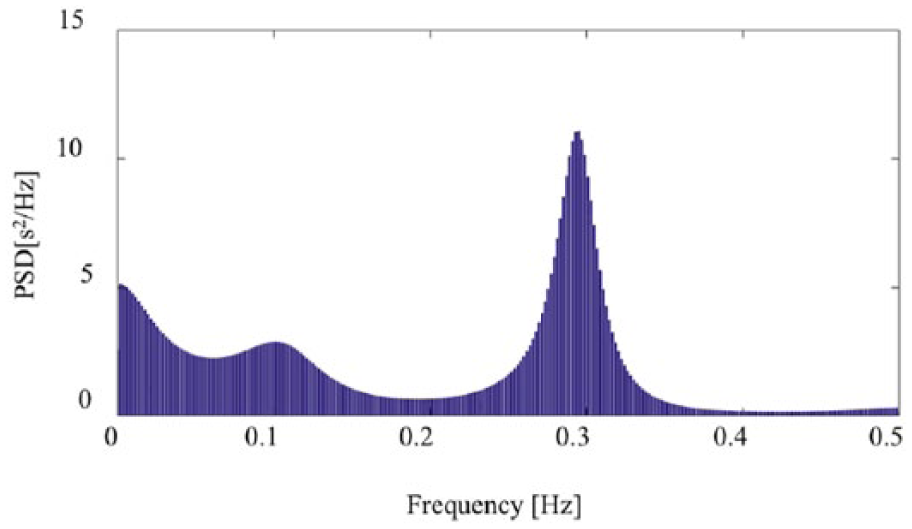
PSD data calculated using the RRI.
The PSD was calculated using the following equation
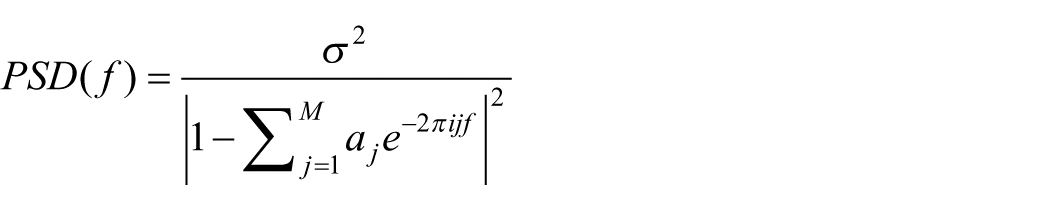
where
Classification method for sleep stages
The sleep stage was determined using the calculated feature values from the ECG. In this study, a recurrent neural network (RNN), 19 hidden Markov model (HMM), 20 neural network (NN), 21 support vector machine (SVM), 22 and random forest (RF) 23 were used as classifiers for sleep stage determination. RNN and HMM consider time series information of observed values, whereas NN, SVM, and RF treat the observed values as independent. In HMM, vector quantization of the features is necessary. Vector quantization and clustering were performed with self-organizing maps, 24 after which we used the Baum–Welch method and Viterbi algorithm. 25 Leave-one-out cross-validation with one subject as the test data and the remaining subjects as the training data was performed to evaluate the classifier. Finally, the classifier was evaluated by calculating the recognition ratio for each sleep stage; this ratio was obtained by dividing the number of correctly classified stages by the total number of stages. To clarify the optimal classification method for sleep stage classification using heart rate and heart rate variability in this article.
Results
Data analysis
The RRI (average and standard deviation of all subjects) for each sleep stage is shown in Figure 4. Significance levels were set to 5 percent.
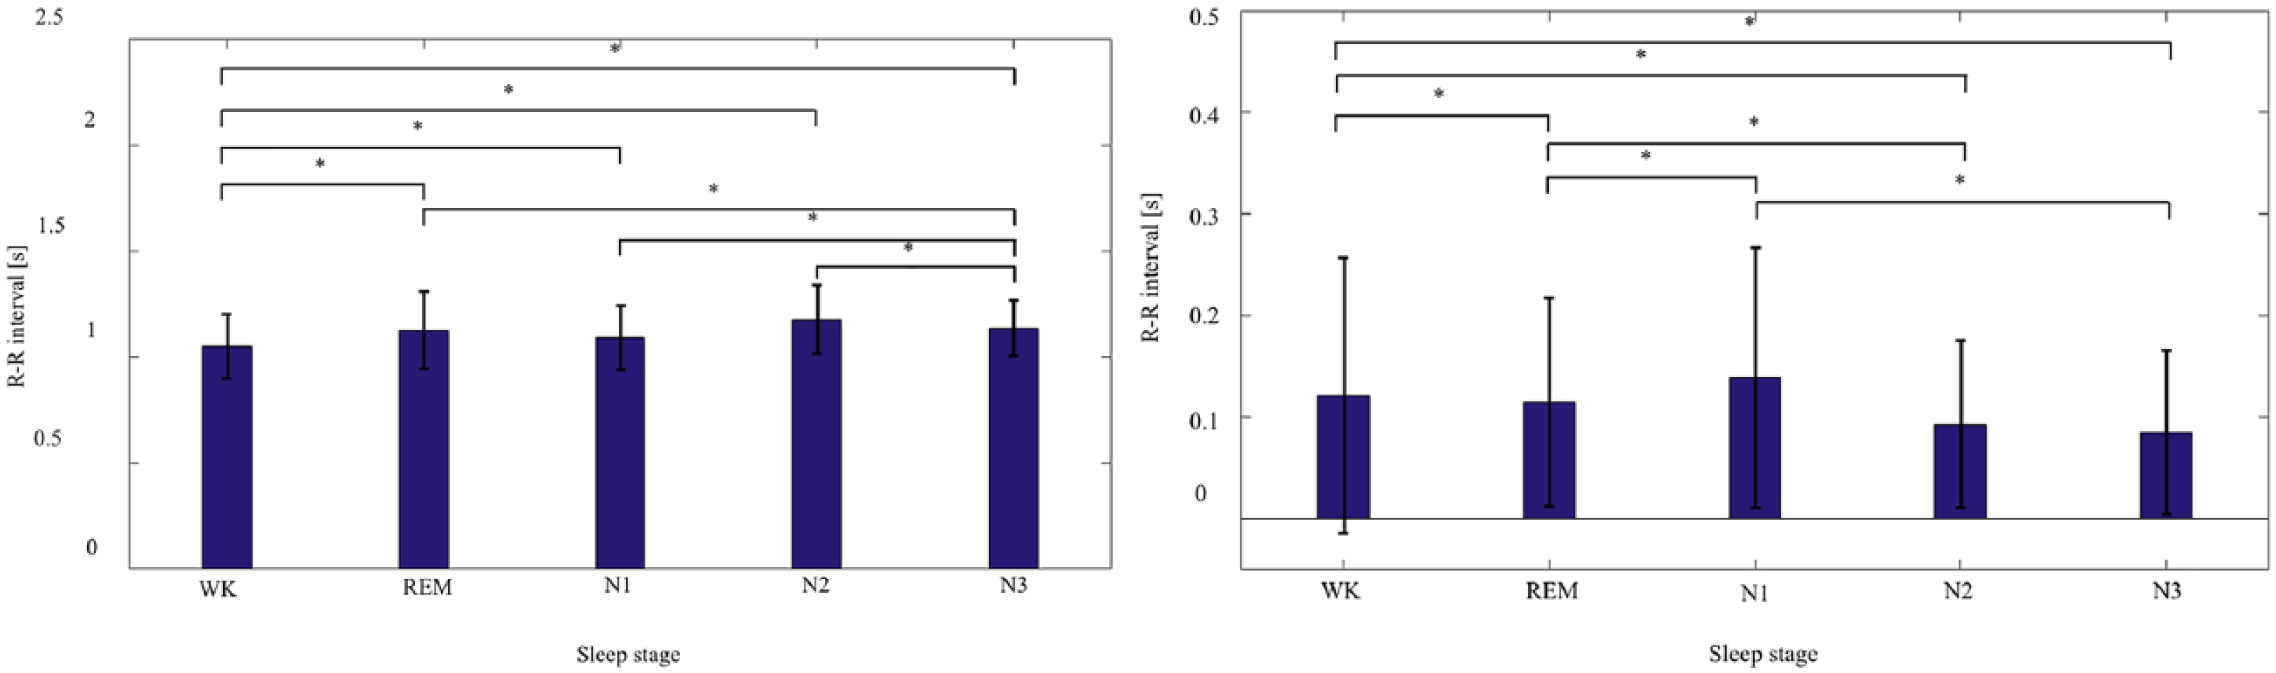
RRI for each sleep stage (left: average RRI, right: standard deviation).
Although the RRI feature was relatively useful for classifying the sleep stage, it was difficult to determine precise sleep classification using only the RRI. Based on the RRI, a significant difference was found between WK and N3 versus REM, N1, and N2; however, no significant difference was observed between REM, N1, and N2. The heart rate was lower during sleep than during WK. The heart rate is believed to decrease from WK to N3, 26 and this tendency was seen; however, in this study, the heart rate was lower in N2 than in N3. Although it is believed that the standard deviation of heart rate variability is highest and similar to WK during the REM stage,27,28 such a tendency was not seen in this study (Figure 5). In fact, heart rate variability during N1 was higher than during WK. Next, LF, HF, VLF, and LF:HF ratio were used respectively, and the results are shown for each sleep stage in Figure 5.
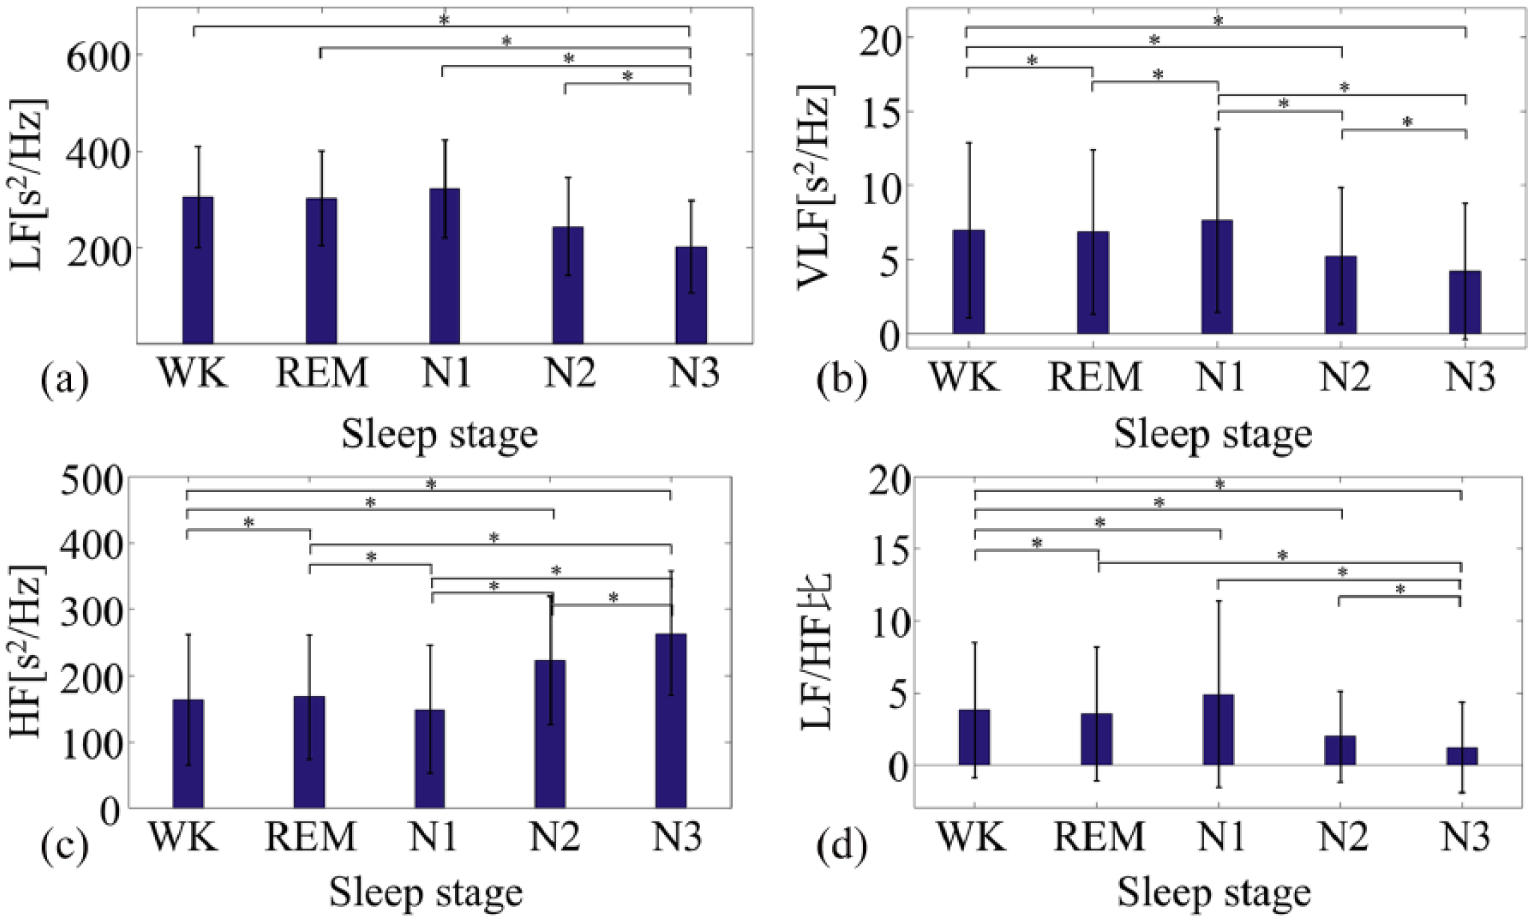
LF, HF, VLF, and LF:HF features in each sleep stage calculated by RRI: (a) low frequency (LF), (b) high frequency (HF), (c) very low frequency (VLF), and (d) LF:HF ratio for each sleep stage.
From these figures, WK was confirmed to be significantly different from all sleep stages. As sleep deepens, it is believed that LF decreases and HF increases, 29 and the same trend was seen in this study. Every frequency feature was recognized by the previously mentioned RNN and HMM methods, and the results are shown in Table 2.
Recognition results using the recurrent neural network (RNN) and hidden Markov model (HMM) methods.
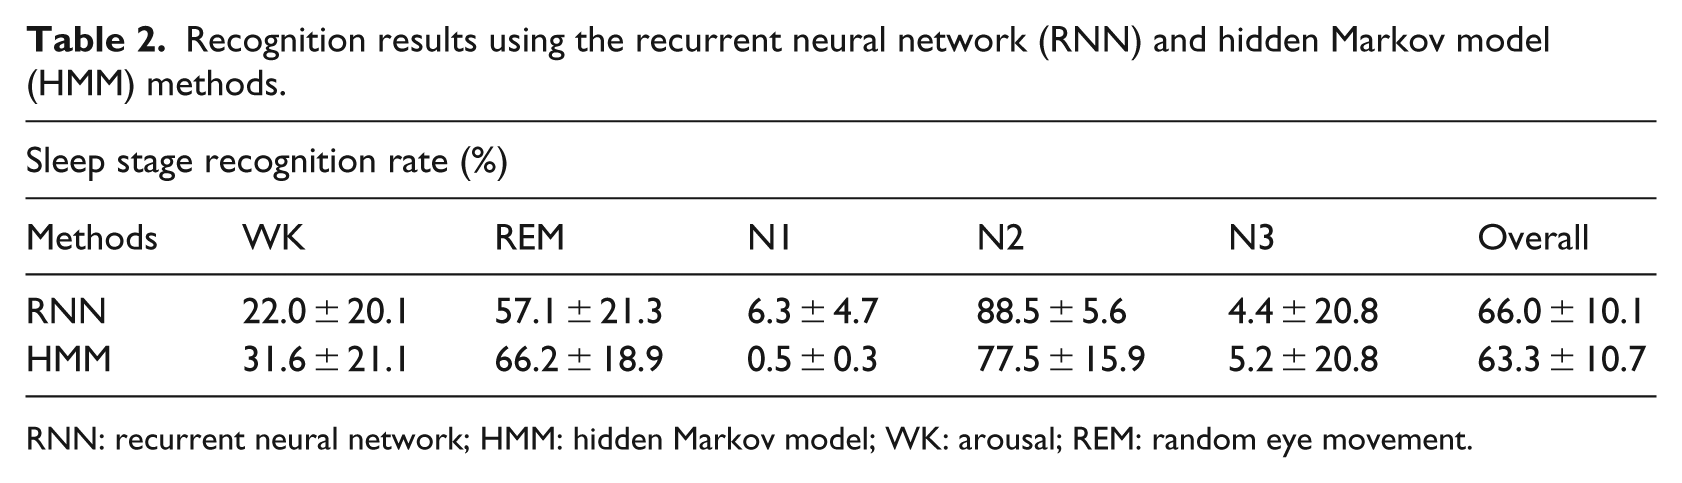
RNN: recurrent neural network; HMM: hidden Markov model; WK: arousal; REM: random eye movement.
In this study, one-third of all data was used for learning, two-thirds were used for testing, and experiments were repeated 20 times. In the case of RNN, the best recognition accuracy was obtained using the various classification methods. Because it is important but difficult to determine the structure of the RNN and HMM, we tried several variations using the learning set for the number of layers and adopted those with high recognition accuracy. Similar to the RNN, the optimal structure of the HMM was determined by changing the number of clusters using the learning data. Figure 6 shows the transition of the sleep stage recognition accuracy by the number of layers of RNN and the number of clusters of HMM, respectively. The more clusters in the structure of RNN and HMM, the higher the recognition rate of the sleep stage.
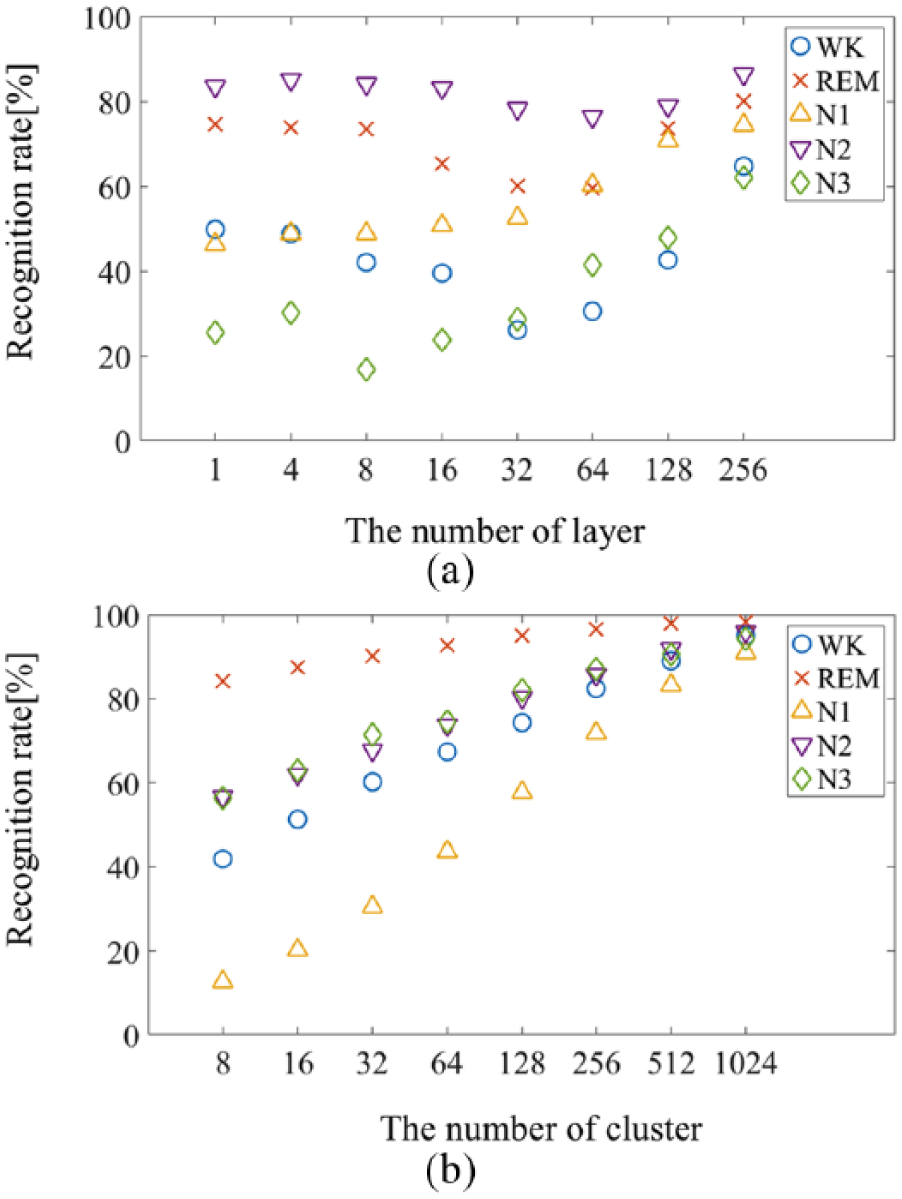
Transition of recognition accuracy by (a) the number of layers of RNN and (b) the number of clusters of HMM.
From these results, the number of layers in the RNN and clusters in the HMM were set as 256 and 1024, respectively.
Furthermore, in order to show the effectiveness of the proposed method, the conventional classification method was also used. The recognition accuracies are shown in Table 3.
Comparison of the proposed method with previous studies.
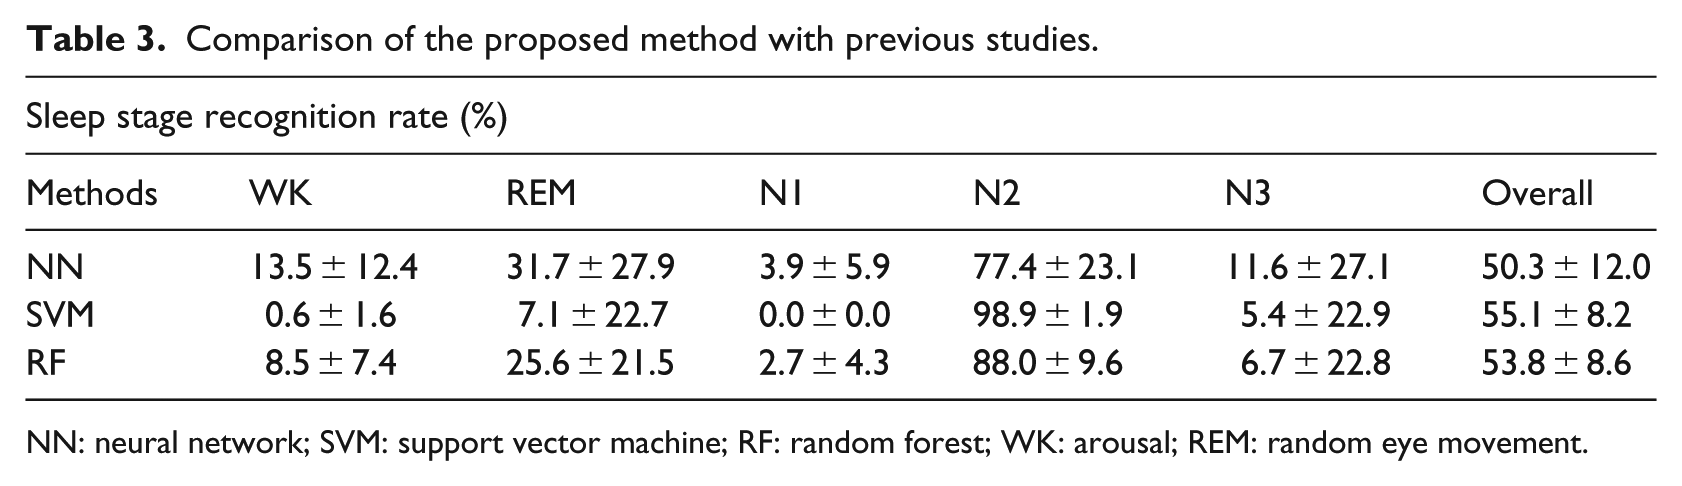
NN: neural network; SVM: support vector machine; RF: random forest; WK: arousal; REM: random eye movement.
From these results, it was confirmed that the RNN is an effective classification method for sleep stage recognition.
Comparing the methods, it was possible to obtain a higher recognition rate when the time information was considered. Since sleep stages do not change drastically, it is believed that using time series information improves the recognition ratio. In the NN and SVM, learning to minimize the classification error of all the data was performed such that the other stages were erroneously classified as N2, which had a large amount of data. Since there was a considerable amount of N2 data and relatively little N1 and N3 data in this experiment (Table 1), increasing the amounts of N1 and N3 data led to an increase in the recognition rate.
Generally, REM, N2, and N3 are considered to occupy 25, 50, and 20 percent of the total period during normal sleep, respectively. In this experiment, REM, N2, and N3 represented 21, 60, and 10 percent of the total sleep period, respectively, for the entire subjects. For this reason, it can be considered that the small number of learning data of N3 leads to a low recognition rate.
Discussion
A comparison of previous studies7,30–32 with the proposed method is summarized in Table 4. Respiratory flow was measured with respiratory inductance plethysmography (RIP), while body movements were measured with an actigraph (ACT), an accelerometer that is worn on a wrist or ankle.
Comparison of the proposed method with previous studies.
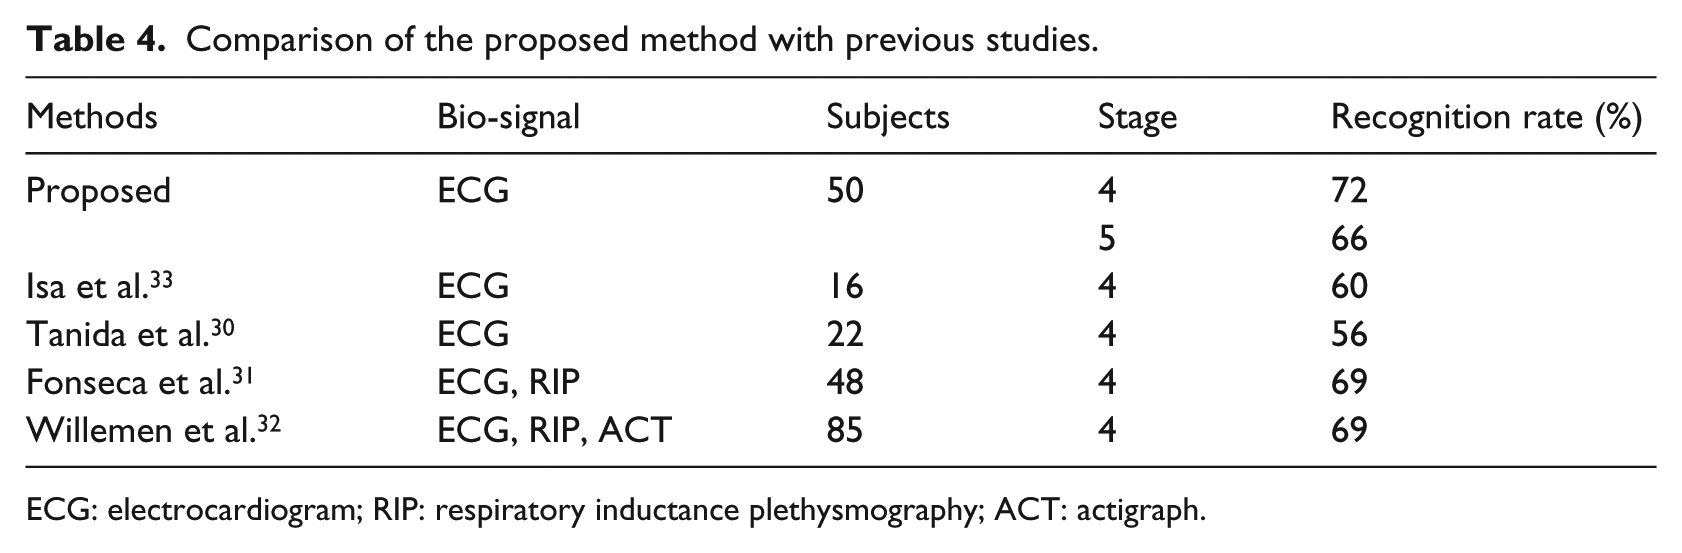
ECG: electrocardiogram; RIP: respiratory inductance plethysmography; ACT: actigraph.
In general, the more the data used for learning, the better the recognition rate by refining the classifier. In the existing methods with few subjects, it is thought that the recognition rate increases as subjects increase. However, N3 data are extremely small in our experiments. Generally, REM, N2, and N3 are considered to account for 25, 50, and 20 percent of the total duration during normal sleep, respectively. However, in this experiment, REM, N2, and N3 were 21, 60, and 10 percent of the total sleep period, respectively, for the entire subjects. Increasing N3 as learning data is thought to lead to obtaining a recognition rate. In addition to the proposed method only using ECG, high recognition accuracy can be obtained without using RIP or ACT.
No previous studies have reported five-stage sleep recognition using only ECG; in many studies, sleep is assessed in four stages, because N1 and N2 are regarded as a single stage. N1 represents shallow sleep and is an important stage. There is a report that the apnea-hypopnea index (AHI) during N2 correlated significantly with excessive daytime sleepiness (EDS). Moreover, as a result of multivariate regression analysis, AHI-N1 reportedly correlates significantly with PSG factors (sleep efficiency and sleep urgency) and AHI-N2 correlates with chief complaints (drowsiness and insomnia). 34 Separating the N1 and N2 leads to detect the symptom for daytime sleepiness in mild sleep apnea. Moreover, N1 can be used to evaluate the efficacy of sleeping pills. N1 is also considered important in the early stages of dementia and Parkinson’s disease. Therefore, it is confirmed that separating N1 and N2 is necessary and effective for detecting symptoms of specific diseases.35–37 Based on these results, it is important to perform five-stage sleep recognition by separating N1 and N2.
In this study, we aimed to construct a sleep stage recognition system using only the heart rate as measured by ECG. Previous studies have sought ways to easily determine sleep stages on a daily basis. In the previous studies, sleep was assessed using four stages (N1 and N2 were combined into one stage) by ECG with an approximate accuracy of 60.0 percent. 33 However, our study achieved an accuracy of 72 and 66 percent in the four- and five-stage separation, respectively. Accordingly, this simple method was able to recognize the various sleep stages with a greater degree of accuracy compared with previous studies. The method proposed here may contribute to simple evaluation of clinical sleep stages of patients with sleep-related problems.
Conclusion
In this study, we used ECG alone to determine the five sleep stages. In the previous studies, a standard method was used to combine N1 and N2, recognizing only four stages of sleep. However, we have proposed a method to classify sleep into five stages by separating N1 and N2.
This study offers several new contributions. First, when using a four-stage classification, the recognition rate was higher in this study than in the previous studies, which used RIP and ACT in addition to the ECG. Furthermore, our accuracy rate using a five-stage classification was similar to the accuracy of previous studies that only used a four-stage classification.
No previous studies have reported using five-stage sleep recognition with ECG alone, and in many studies, sleep is assessed in four stages. We believe that a five-stage assessment is necessary, because diagnosing many sleep disorders or EDS requires separation of N1 and N2. Because N1 data were limited in this study, the recognition rate of N1 was not very accurate; however, the recognition rate of N2 was as high as 90 percent.
Again, it can manage sleep quality on a daily basis by being able to determine sleep in five stages by simply using heart rate. Accuracy is not very good yet, but this method does not require any special equipment; if you can acquire a heart rate, you can determine the stage of sleep in five stages. As a result, the daily record can be taken into consideration, for example, when it is in bad condition and a simple relationship based on the ratio of light and deep sleep. We also believe that it is important to be able to easily measure the relationship between sleepiness during the day and the quality of sleep, dementia, and the relationship between Parkinson’s disease and sleep. For example, watch-type heart rate measurement is one of them. From these points, our research considers it to be a simple way to investigate the relationship between sleep and disease.
We are currently conducting further studies with an increased number of subjects to assess whether sleep stages can be accurately classified using a simple heart rate measurement method (e.g. a wristwatch-type heart rate monitor).
Footnotes
Acknowledgements
Experiments were conceived and designed by Y.M., M.Y., and K.F. Experiments and data analysis were performed by Y.M. This paper was written by all authors.
Declaration of conflicting interests
The author(s) declared no potential conflicts of interest with respect to the research, authorship, and/or publication of this article.
Funding
The author(s) received no financial support for the research, authorship, and/or publication of this article.