
Abstract
Patient-care data from the electronic health record systems are increasingly in demand for re-use in administration and resource planning. Nursing documentation with coded concepts is expected to produce more reliable data, fulfilling better requirements for re-use. The aim was to ascertain what kind of relation exist between coded nursing diagnoses, nursing interventions, and nursing intensity and to discuss the possibilities for re-using nursing data for workload design. We analysed the retrospective nursing records of 794 patients documented by the Finnish Care Classification and nursing intensity data assessed by the Oulu Patient Classification over a 15-day period in nine inpatient units at a university hospital. Using the generalised linear mixed model, the clear relationship between the number of coded nursing notes and nursing intensity levels were ascertained. The number of coded nursing notes increases when the nursing intensity increases. The outcomes construct a good basis for continuing elaboration of electronic health record data re-use.
Keywords
Introduction
Apart from patient care, electronic health record (EHR) data are increasingly needed for secondary or re-use purposes, such as administration and resource planning.1–3 Re-use of routine clinical data outside direct care has received significant interest as essential for achieving the promises for high-quality healthcare, improved healthcare management, reduced healthcare costs, and effective clinical research.2,4,5
In fact, there are many requirements and challenges in the re-use of routine clinical data for workload design. 2 The healthcare clinical context and clinical processes are complex. Providing high-quality healthcare in conditions where the complexity of hospital patients is increasing and patients need to be treated with reduced resources is challenging. 6 Methods of clinical documentation vary from unstructured to semi-structured forms, and many clinical documentation systems are designed to support only the specific information needs of specific users2,4 without fluent connection and interoperability. 7 To overcome these challenges, the development of health information technology (HIT) is expected to provide better opportunities for re-using of EHR data.3,5
It has been showed that structured documentation can produce more complete and reliable patient records, better fulfilling the requirements of data quality for the purposes of secondary use.3,8,9 The different standards for representing; communicating; exchanging; managing; and reporting data, information, and knowledge in the EHRs have been developed in order to support nursing practice and to ensure the validity of the data.10,11 The most important standards for nursing are content, messaging, and confidentiality and security standards. 12 The account that follows will focus on the content standard relevant to this research.
Standardised nursing terminologies (SNTs) are content standards which include the terms or concepts that represent a focus on health-concerning diagnoses, interventions, and outcomes consistent with the scope of practice for nursing. 10 In literature, several terms, such as ‘a data set’, ‘terminology’, ‘language’, ‘nomenclature’, ‘classification’, ‘vocabulary’, and ‘taxonomy’, have been used to describe the structures of nursing concepts in order to document and communicate practice.11,13–15 Structured or coded concepts allow the performance of evaluation of the nursing process, the key structure for care plans and documentation, and the provision of valid electronically documented nursing clinical data shareable across HIT and EHR systems. 16 The coded concepts also permit the measurement of nursing outcomes and effectiveness providing evidence for decision-making.13,16,17
The need for developing a unified SNT in order to enhance comparability of nursing data is well recognised.8,15–18 Cross-mapping and co-ordination across classifications renders it possible to evaluate the equivalence of the content and concepts used and to promote shared use of the various nursing classifications and data generated while avoiding redundancy in the information saved,19–22 which also promotes data re-use.
In Finland, the EHR systems cover 100 per cent of specialised and primary healthcare organisations and are used across disciplines. 23 Nationally defined nursing data structures are nursing diagnoses, interventions, outcomes, nursing intensity, and nursing summary.24,25 Internationally, many nursing classifications have been cross-mapped with other interfaces or reference terminology systems.20–22,26,27 In Finland, SNT, the Finnish Care Classification (FinCC), has been cross-mapped with the Oulu Patient Classification (OPCq) designed to measure the nursing intensity (NI; Figure 1). 28 In Finland, many hospitals have used these two classifications at the same time with a stand-alone system. Thus, the objective of the cross-mapping was to contribute to the re-use of the coded data in the assessment of NI. The cross-mapped codes can be used by open source in EHRs from the Finnish National Code Server, which contains all approved terminologies in Finland.28,30,31
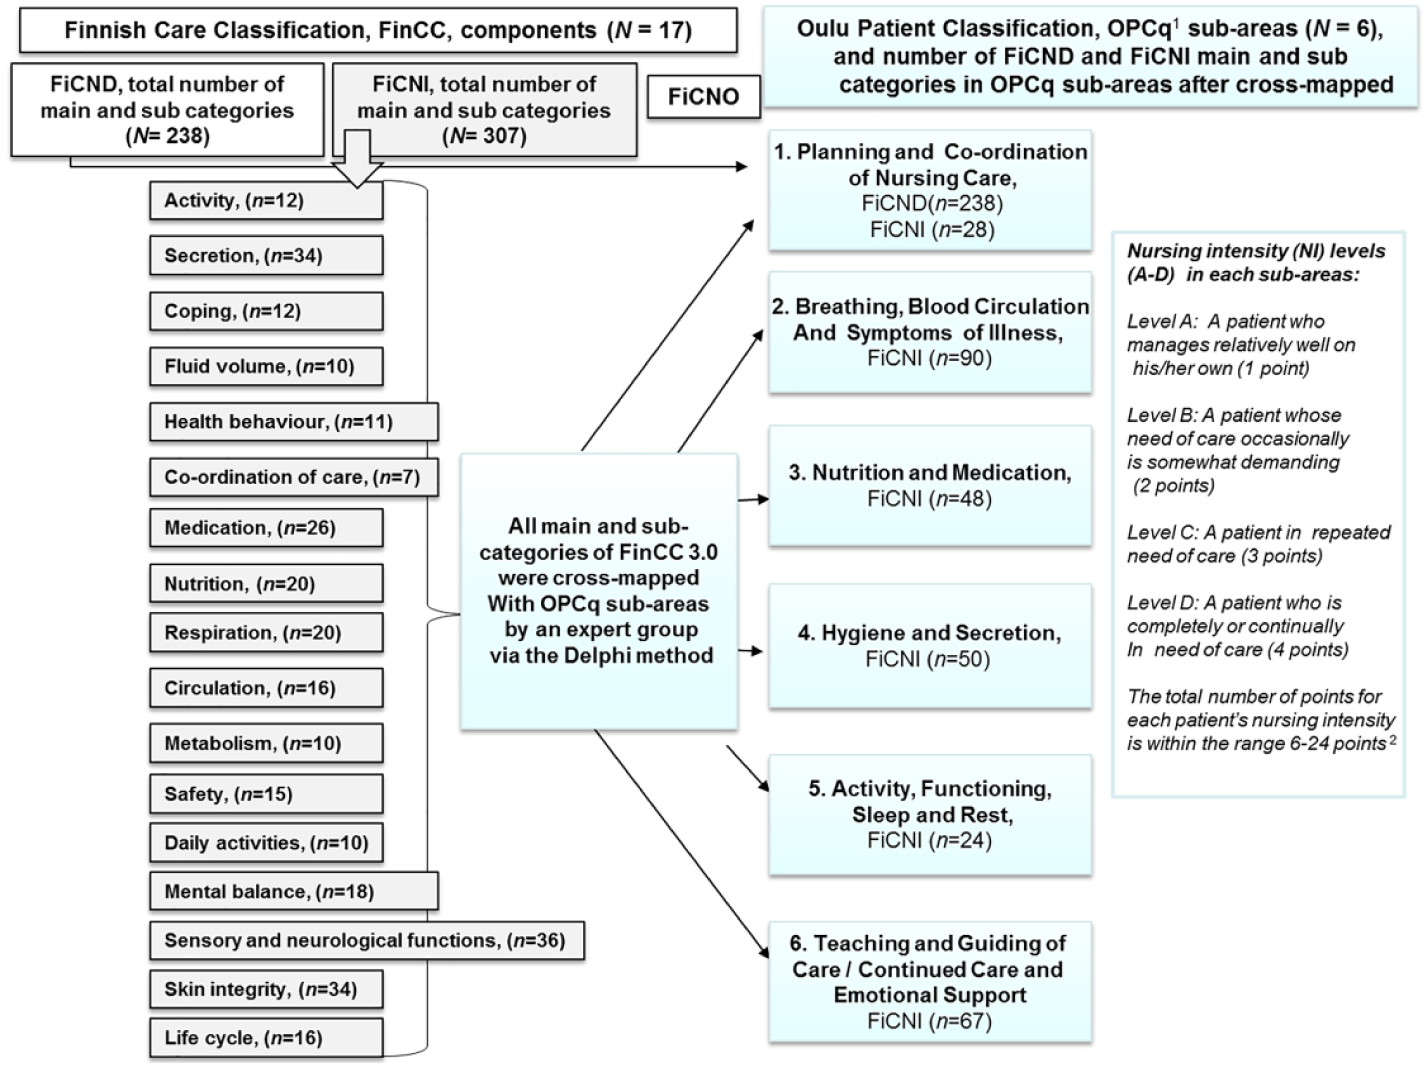
Structures of the Finnish Care Classification (FinCC) and the Oulu Patient Classification (OPCq) and the results after cross-mapping FinCC with OPCq. 28
For decades, many healthcare organisations with more than 20,000 nurses have used the structure of the Finnish documentation model based on the decision-making process and the FinCC.24,25Apart from patient-care documentation, nurses assess patients’ care intensity daily by using the OPCq, which is a part of the RAFAELA® Nursing Intensity and Staffing System.29,30 The system also contains two other parts: the records of daily nursing resources and the Professional Assessment of Optimal Nursing Care Intensity Level (PAONCIL) questionnaire. These three parts are combined so as to generate information for optimal staff allocation based on patients’ care needs.29,30 The scientifically assessed system is widely used in Finland and in some Nordic countries.32–35
Globally, over the last two decades, evidence has been accumulated relating to nurse staffing levels6,36,37 and nursing diagnoses38–40 with patient and organisational outcomes. At the same time, there has been an interest in developing a valid and flexible system for measuring nursing workload and the intensity of care.32,41–43 The HIT developments have produced new possibilities to utilise the structured nursing documentation, and increased interest in the re-use of EHR data.40,44,45 In addition, the analytical methods of the potential of big data have raised that investigation to a new level.3–5,46
The aim of this study is to evaluate what kind of relation exists between the nursing data and the NI data. The following research questions are examined: (1) what diagnosis and interventions are most often used in the different NI categories? (2) what is the relation between nursing diagnosis and NI categories? and (3) what is the relation between nursing interventions and NI categories? The further aim is to discuss the possibilities of re-using coded nursing data to measure NI and using it at the administrative level on the assessment and prediction of the need of nursing workload.
Methodology
In this retrospective registry study, two different classifications were utilised as follows: the FinCC and the OPCq.
The FinCC
The FinCC, based on the Clinical Care Classification (CCC), 47 consists of three separate classifications: the Classification of Nursing Diagnoses (FiCND), Nursing Interventions (FiCNI), and Nursing Outcomes (FiCNO). 25 The FiCND and FiCNI have the same three-level hierarchy structure, with components (n = 17), main, and subcategory levels. There are 238 main and subcategories in the FiCND and 307 in the FiCNI (Figure 1). In the first phase of the nursing process, when assessing the patients’ need for care by FiCND, it is possible to use all parts of the three-level hierarchy: components, main, and subcategories. Documentation of the nursing interventions using the FiCNI is usually done using the main and subcategories, not using the components. Evaluation of the nursing outcomes by FiCNO is done by again using the components.25,48 To ensure the quality of process-based nursing documentation in EHR, an annual audit is carried out by a specific audit instrument. 49
The OPCq
In the OPCq, the classification for measuring NI in the hospitals’ inpatient units, the core idea is to ensure that the workload per nurse is optimal in terms of NI. The OPCq include six sub-areas of care, described in Figure 1. The nurse classifies the patient care once a day at the end of morning shift at 14:00–15:00 for the previous 24-h period based on nursing interventions and nursing notes. NI is denoted in each subarea at one of the four care levels (A–D/1–4 points). A single patient’s NI points vary from 6 to 24. According to certain point limits, patients’ care provided are classified into five (I–V) NI categories (Figure 1). 29 NI category I, minimal need for care, means that patient manages relatively well on his or her own or need of care is occasionally somewhat demanding. In the highest category V, intensive need for care, a patient is completely or continually in need of care in every six sub-areas of care. To ensure the quality of NI results, there are annual inter-rater reliability tests in every unit using RAFAELA. 35
Sample and data collection
The retrospective data were collected from one Finnish university hospital representing 36 specialised care inpatient units and 671 beds over a 15-day period in November 2014. The FinCC and the RAFAELA System have been in daily use for years. The following criteria for inpatient units were set before data were pooled out of the databases: (1) the unit had received a good or excellent quality level of nursing documentation measured by an audit instrument 49 and (2) the unit had passed certain quality criteria of the RAFAELA system for achieving the national benchmarking database at 2014. 29
Research data were extracted and delivered in text stored on a secured memory stick by the Information and Communication Technology (ICT) organisation providing services to the hospital. There were three separate Excel datafiles of the same patients: (1) patients’ encrypted identity with care episodes, diagnosis, and operation codes; (2) coded nursing data with free-text in all phases of nursing process; and (3) data of NI.
Nursing data with nursing notes in all phases of the nursing process have a timestamp, which is the time at which an event is recorded on a computer. Because of the specific period of NI (24-h period from 15:00 to next day 15:00), some timestamp-based date allocations had to be made in order that nursing data can be linked to the corresponding NI data. For example, the nursing notes made before 15:00 allocated to the previous day and after 15:00 to the next day’s NI assessment. Due to the 24-h period, the number of NI classifications is equal to the number of the inpatient days (IPDs). Nursing data without NI data were excluded.
Statistical analyses
Before the statistical analyses, coded nursing data and corresponding NI data were combined using the results of cross-mapping FinCC and OPCq 28 into one database using the options of Microsoft Access 2010. To describe the research data, the descriptive statistics, such as material characteristics, frequencies, and mean with standard deviation (SD), were applied. As the distribution of NI categories was very different between units, we decided to use the unit as a random effect in the generalised linear mixed model (GLMM). We used GLMM for the count data: the number of nursing diagnoses (FiCND) and the number of nursing interventions (FiCNI) in relation to the NI categories. The results of GLMM are presented as a rate ratio (RR, exponential of the coefficient) with 95 per cent confidence interval (95% CI) as an estimate of the change in expected rate using the first NI category as a reference. Two-tailed p-values are presented; the statistical significance was set at p < 0.05. Statistical analyses were performed using SPSS for windows (IBM Corp, Released 2012, IBM SPSS Statistics for Windows, version 21.0, Armonk, NY) and SAS (version 9.4, SAS Institute Inc, Cary, NC).
Ethical considerations
Permission for this research was obtained according to the guidelines of the research organisation. The research agreement concerning the OPCq was concluded with the system provider. 29 The principles of the Guidelines of the Finnish Advisory Board on Research Integrity 50 were followed; there was no need for ethics committee approval under Finnish rules because the data collected did not include individual patient or nurse identifiers. Data from EHR were de-identified and assigned to a progressive code before the material was given to the first author. The first author has a hard disc for research data storage.
Results
Description of the sample
Research units that passed the selection criteria (n = 9) represent different medical specialties (Table 1). Research data consisted of the daily nursing documentation notes of 806 patients who had a total number of IPDs (n = 2564) and the same number of NI classifications measured by the OPCq. A total of 12 patients had care episodes in two different units, so the total number of different patients was 794.
Proportion of the patients, NI classifications and the FiCND and FiCNI categories in the different units.
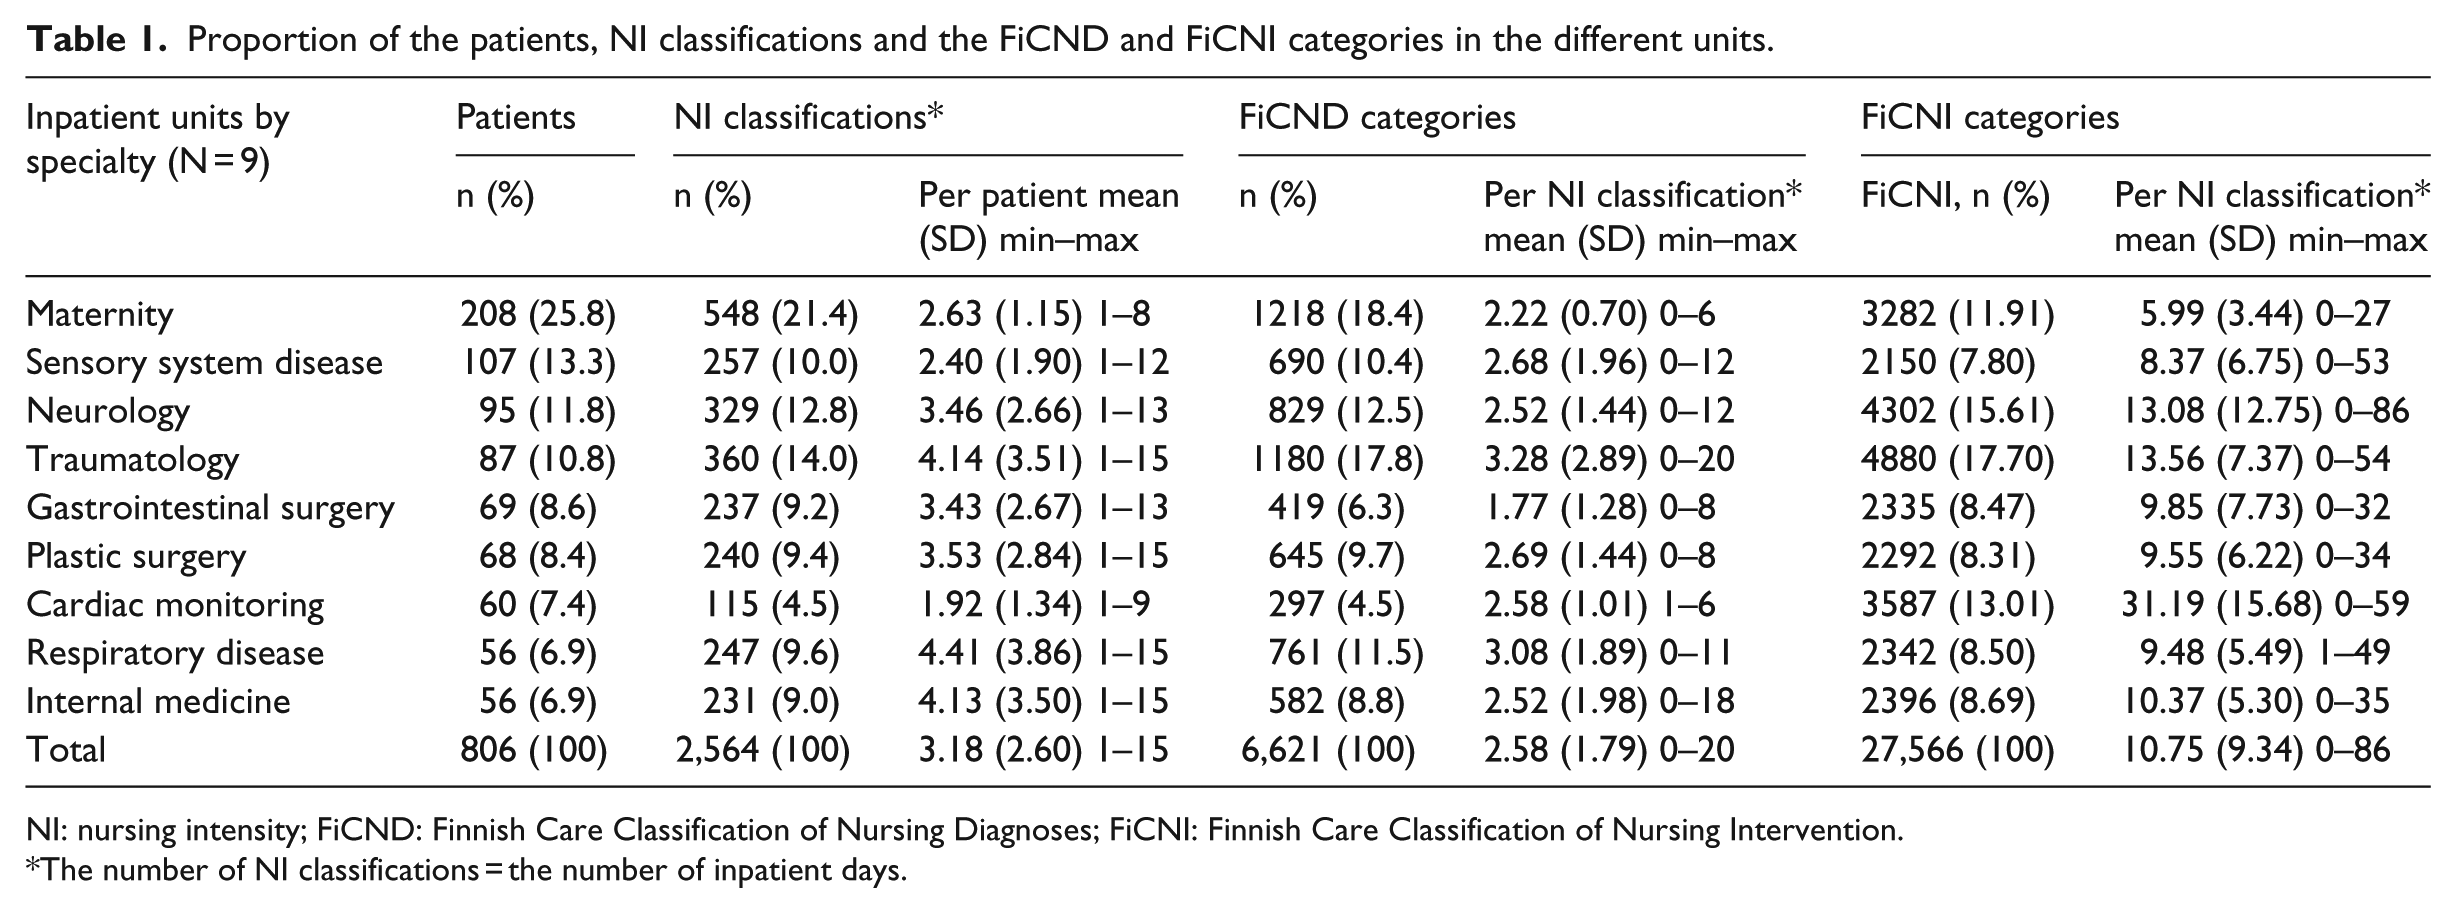
NI: nursing intensity; FiCND: Finnish Care Classification of Nursing Diagnoses; FiCNI: Finnish Care Classification of Nursing Intervention.
The number of NI classifications = the number of inpatient days.
The number of patients per unit varied from 56 (6.9%) in the respiratory and internal medicine units to 208 (25.8%) in the maternity unit (Table 1). The number of NI classifications varied from 1 to 15 per patient; the mean was 3.18 (SD = 2.60).
There were overall 6621 (Table 1) coded nursing notes by the FiCND during the first nursing process phase: assessment and naming the nursing needs (nursing diagnosis). The number of FiCND varied from a minimum 0 to maximum 20 per one NI classification. The number of FiCND per one NI classification varied from a mean of 1.77 (SD = 1.28) in gastrointestinal surgery to 3.28 (SD = 2.89) in the traumatology unit. The total mean of the number of FiCND per one NI classification was 2.58 (SD = 1.79). The number of NI classifications without any nursing diagnosis (ND) was 194 (7.6%).
Nursing data consisted of 27,566 nursing interventions documented using the FiCNI. The number of FiCNI varied from a minimum of 0 to a maximum of 86 per one NI classification (Table 1). The total mean of the number of the FiCNI per one NI classification was 10.75 (SD = 9.34). The number of nursing interventions varied from a mean of 5.99 (SD = 3.44) in the maternity unit to 31.19 (SD = 15.68) in the cardiac-monitoring unit. The number of NI classifications without any interventions was 14 (0.5%).
NI distribution
According the NI data, 44.0 per cent (n = 1128) of all NI classifications were assessed as NI category III (more than the average need for care). The two most infrequent ones were categories I (1.2%) and V (2.6%) (Table 2). Distribution of NI classifications to the different NI categories varied between different units. In five units, there were no patients assessed in NI category I. The greatest frequency of the most demanding patients (NI category V) were treated in the neurology unit (7.6%) and in the cardiac-monitoring unit (7.0%).
Distribution of the NI classifications in the different NI categories (I–V) in the different units.
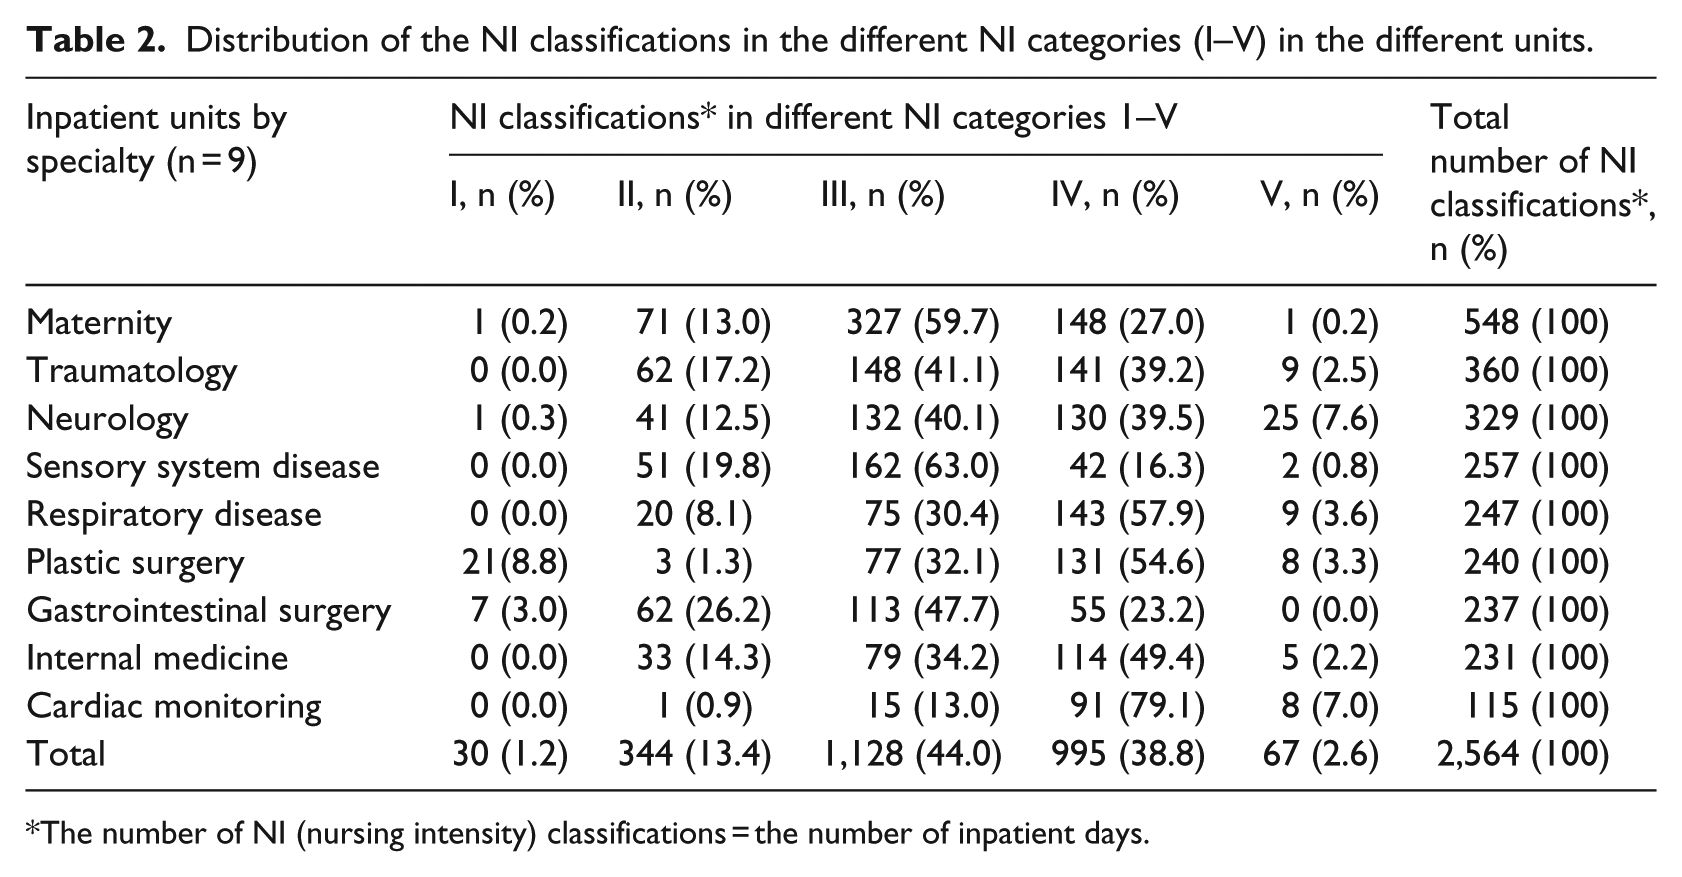
The number of NI (nursing intensity) classifications = the number of inpatient days.
Nursing diagnosis and interventions used in different NI categories
Nurses had used a total of 115 categories of the FiCND from all 17 components, which is 48.3% of all the possible FiCND categories (N = 238; Figure 1). The most often used diagnoses of the FiCND were sensory and neurological functions (9.7%), life cycle (9.1%), skin integrity (6.1%), and co-ordination of care (5.5%; Table 3). Neurological changes were the most often used main category. For every NI category, the same ND were used, but with different emphases.
The top 10 used FiCND and FiCNI categories in total data and top three in different NI category levels.
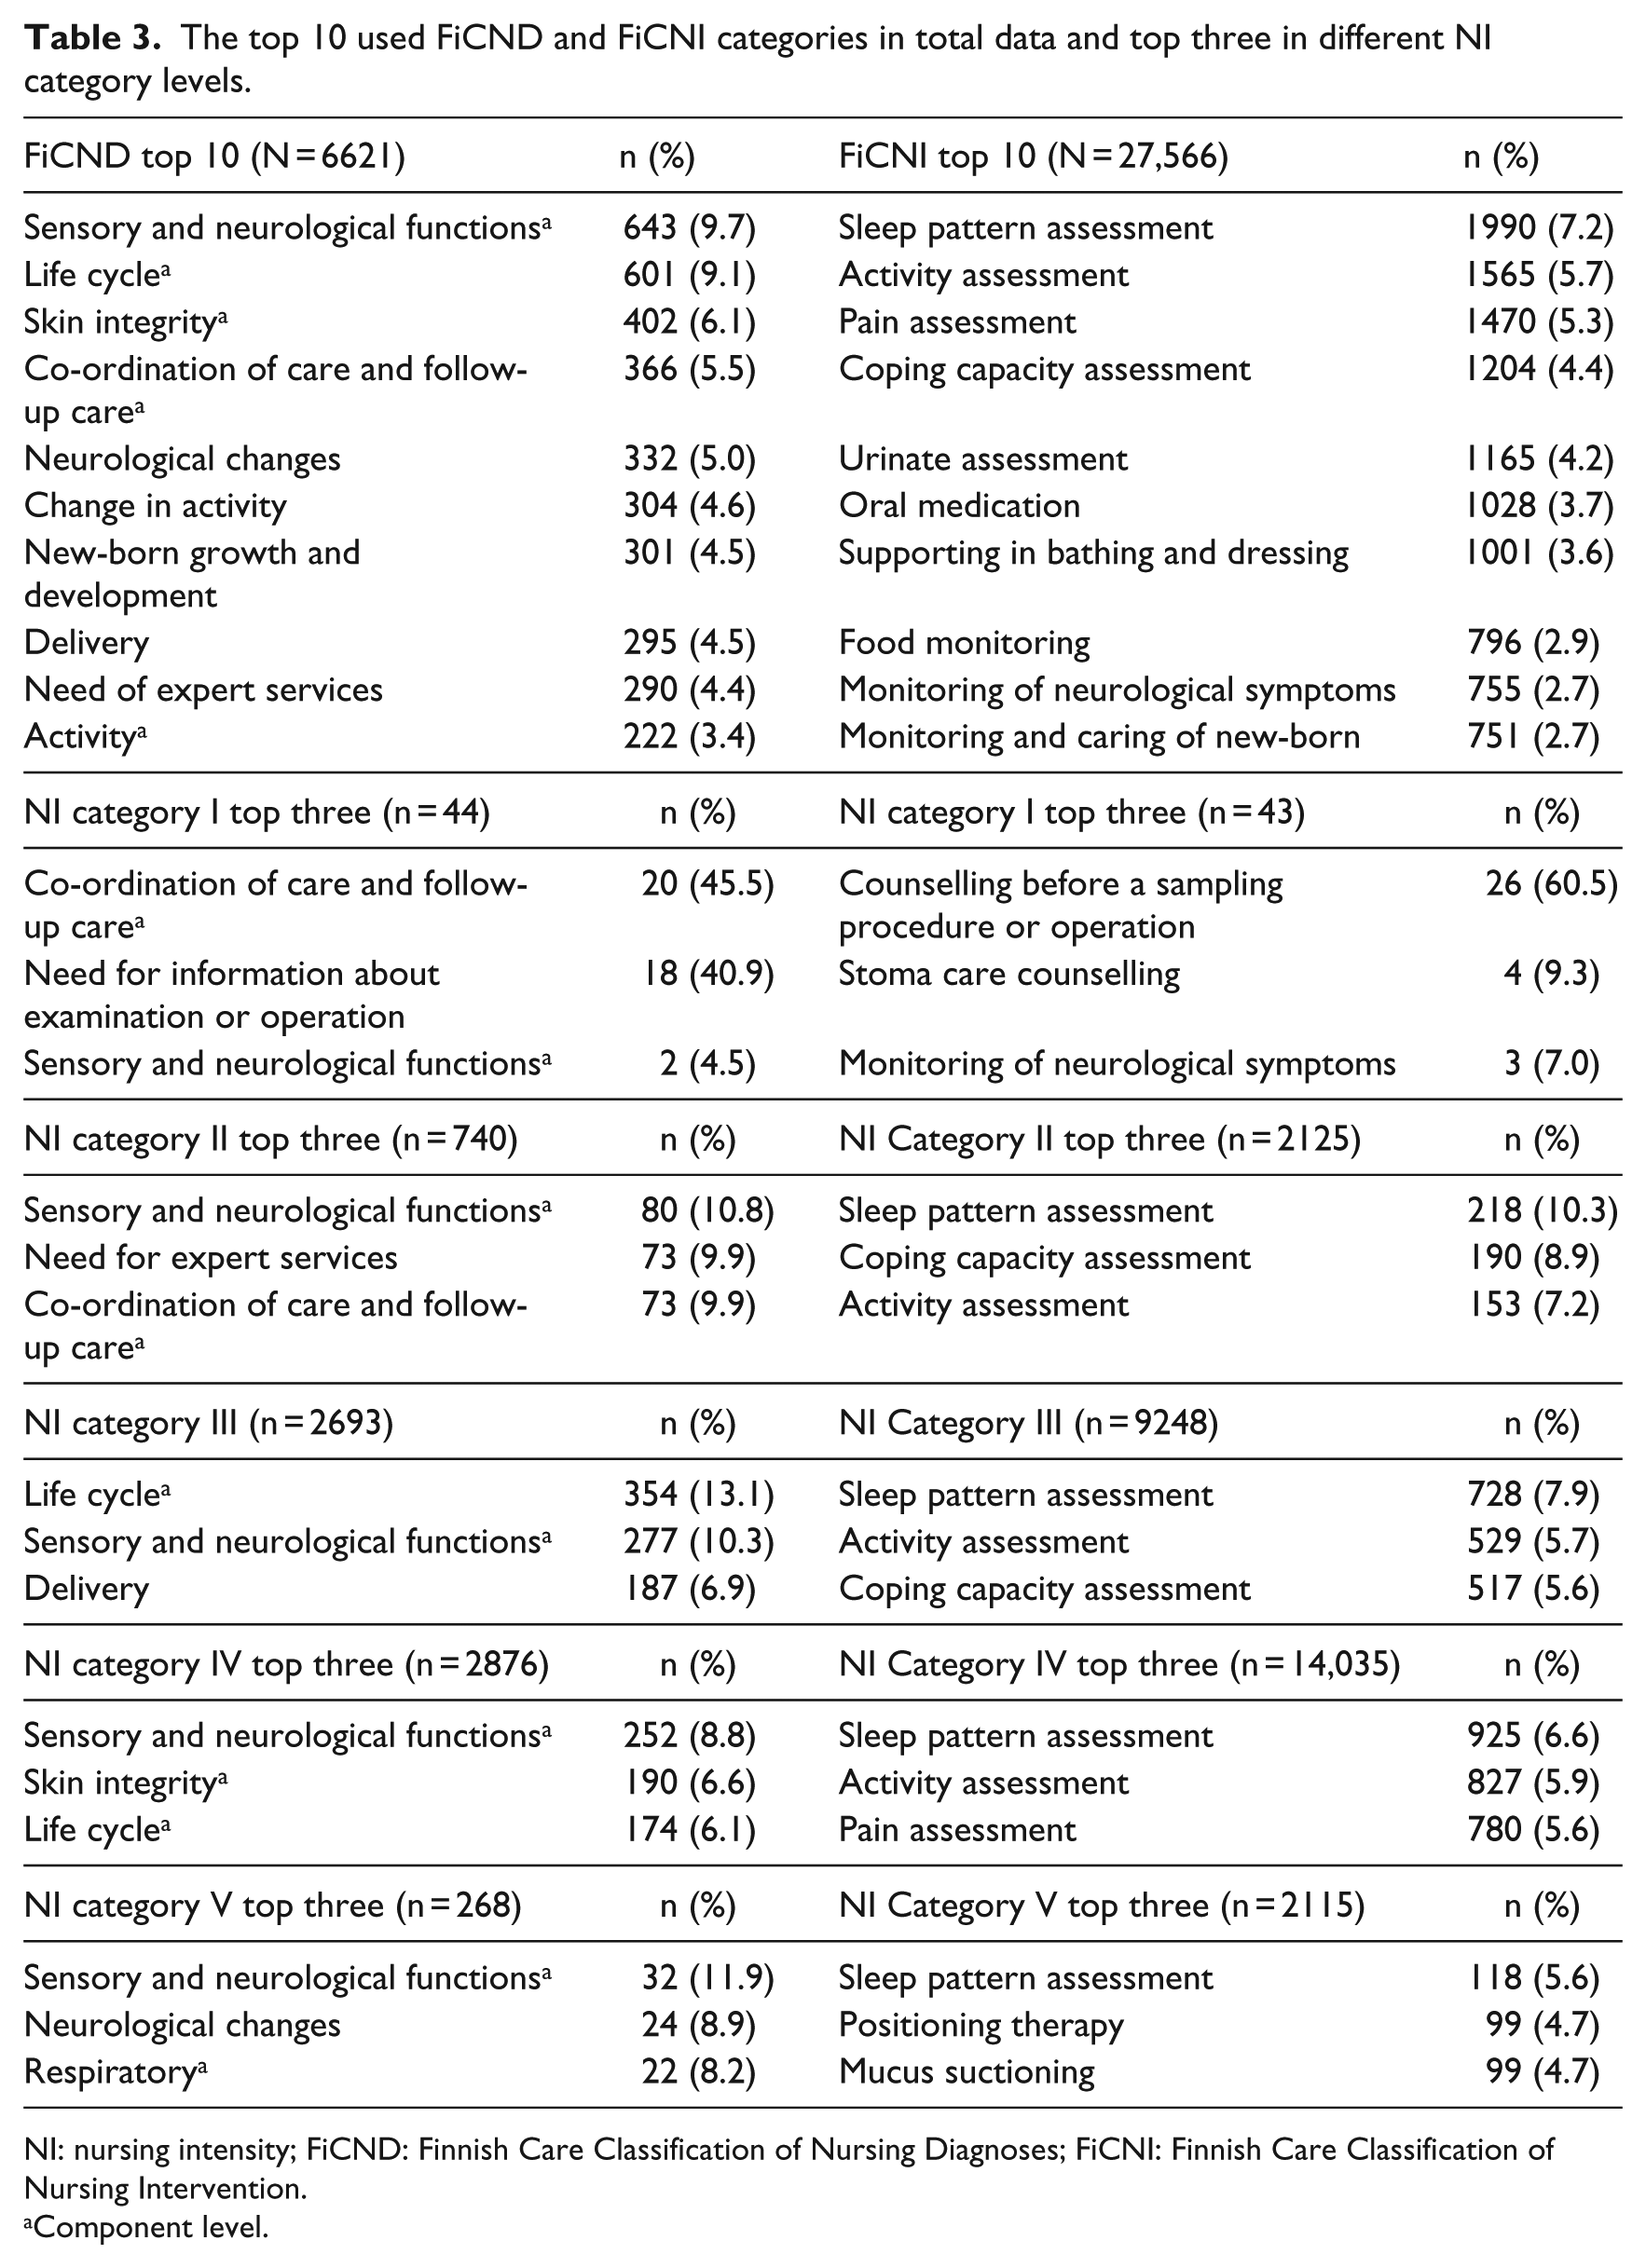
NI: nursing intensity; FiCND: Finnish Care Classification of Nursing Diagnoses; FiCNI: Finnish Care Classification of Nursing Intervention.
Component level.
In total, 217 different interventions of FiCNI from all 17 components were used, that is, 70.7% of all the possible FiCNI categories (N = 307; Figure 1). The most often used interventions were assessments of sleep pattern (7.2%), activity (5.7%), and pain (5.3%), as shown in Table 3. Counselling patient before a sampling procedure or operation was the most often used intervention (60.5%) in the lowest NI category. This type of preoperational counselling was given by a telephone from the gastrointestinal and plastic surgery units. The three most frequently used interventions were similar for NI categories II and III. In the intensive need for care category (V) positioning therapy and mucus suctioning were used; these were used predominantly in the neurology unit.
Relation between nursing diagnosis and NI categories
Of the total number of NDs (N = 6621), most (43.4%) were used at the NI category IV (Table 4). The mean of the diagnoses varied from 1.47 (SD = 1.17) in the NI category I to 4.00 (SD = 2.48) in the NI category V. When using the first NI category as a reference (RR = 1.0), the expected increase rate RR (the expected number of FiCND) according to GLMM in NI category II was 1.4, p = 0.030 (Table 4). In NI category III, RR was 1.6, p = 0.004. In NI category IV, RR was 1.9, p < 0.001. In NI category V, intensive need for care, the expected number of FiCND was 2.5, p < 0.001.
The FiCND components, main and sub-categories in the different NI category levels.
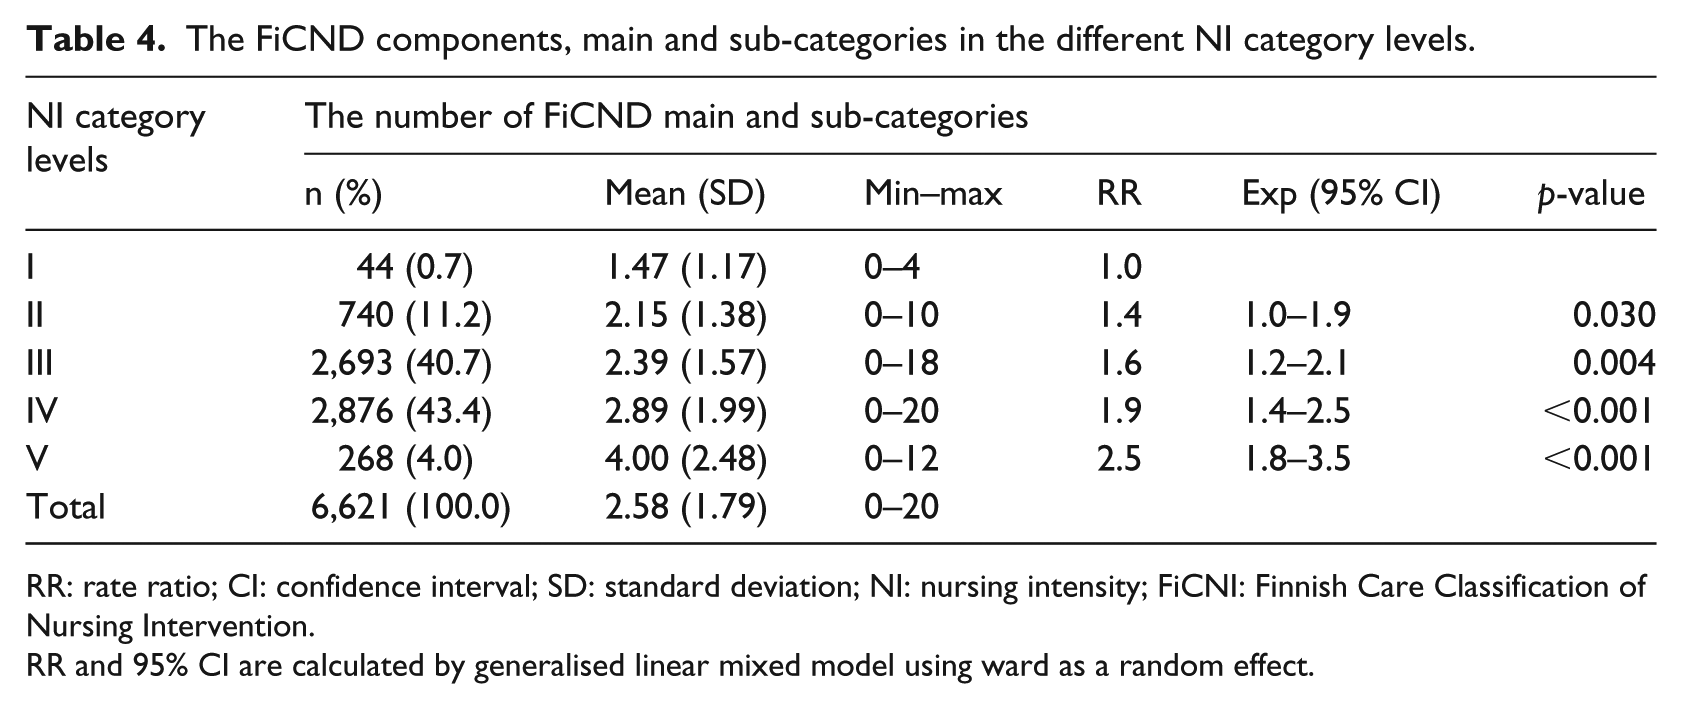
RR: rate ratio; CI: confidence interval; SD: standard deviation; NI: nursing intensity; FiCNI: Finnish Care Classification of Nursing Intervention.
RR and 95% CI are calculated by generalised linear mixed model using ward as a random effect.
Relation between nursing interventions and NI categories
The most frequent interventions of FiCNI were used at NI category IV (50.9%; Table 5). The mean varied from 1.43 (SD = 1.68) in NI category I to 31.57 (SD = 21.50) in NI category V. When using the first NI category as a reference, the expected RR in NI category II was 4.0, p < 0.001. In NI category III RR was 5.6, p < 0.001. In NI category IV RR was 8.4, p < 0.001. In NI category V, the expected number of FiCNI was 17.0, p < 0.001.
The FiCNI main and subcategories in the different NI category levels.
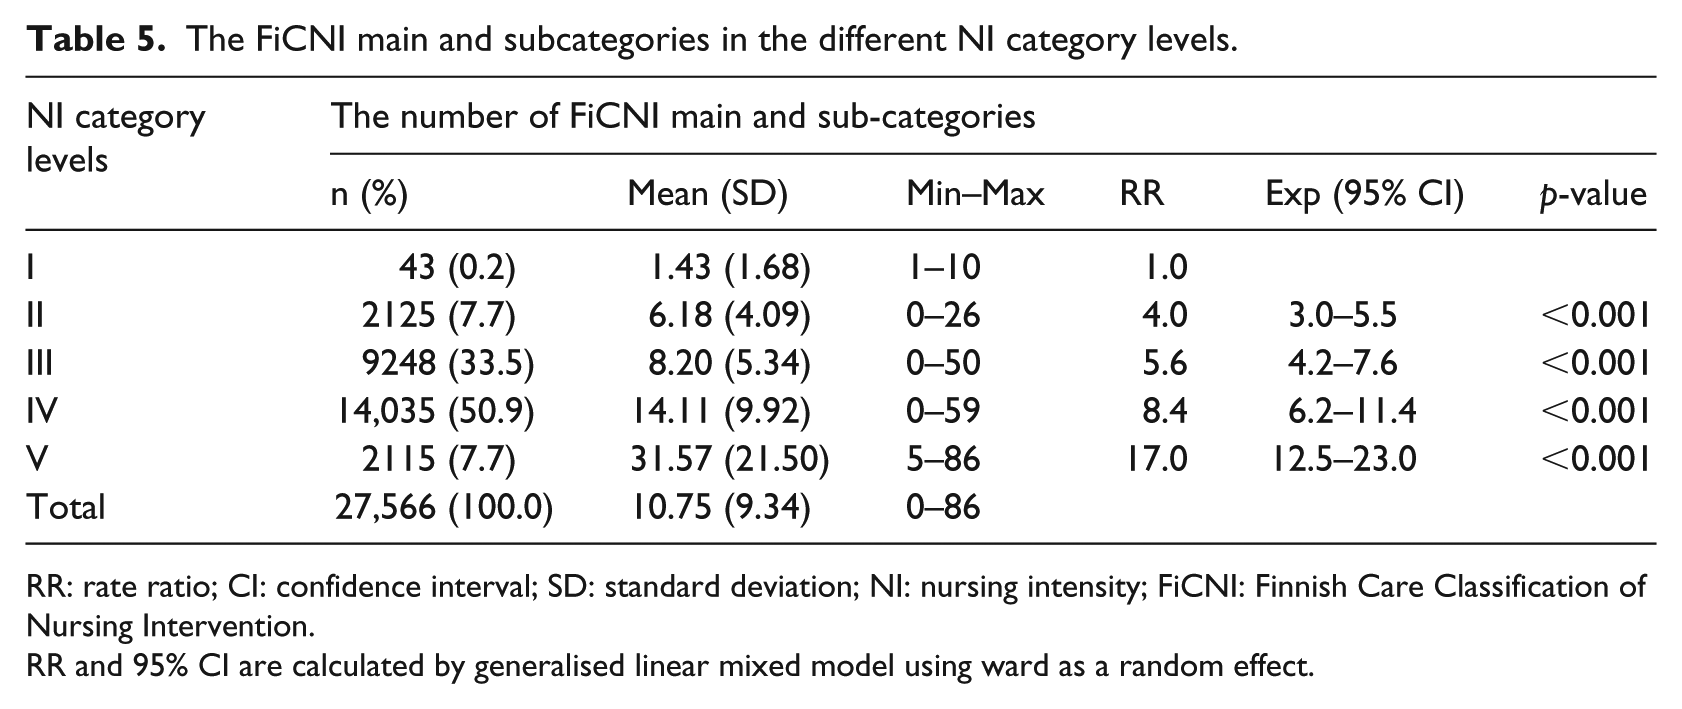
RR: rate ratio; CI: confidence interval; SD: standard deviation; NI: nursing intensity; FiCNI: Finnish Care Classification of Nursing Intervention.
RR and 95% CI are calculated by generalised linear mixed model using ward as a random effect.
Discussion
Discussion of the results
This study aimed to ascertain the relation between nursing data and NI data. This made possible our previous research on cross-mapping of the FinCC and the OPCq, two classifications originally developed for different purposes. 28 The most frequently used ND was the component ‘Sensory and neurological functions’ in the total data and in the different NI categories. Patient’s sleep pattern assessment, the main category of the activity component, was the most widely used of nursing intervention of the FiCNI in all NI categories except for category I. The result is in line with an earlier study at the same hospital with gastroenterological patients. 51 Our results show that the number of coded nursing notes increases when the NI increases. This applies to both nursing diagnoses and interventions.
In a sample of 794 patients with 806 care episodes from nine specialised inpatient units, patients have on average 2.6 NDs per one NI classification and IPD. The result is in line with a previous study concerning the documentation by the FinCC. 24 In practice, a patient’s need of care should be identified or at least updated daily to the nursing care plan even if the need is stable. For that reason, there can be same diagnoses for every IPDs during care episode. In an Italian study, in a sample of 2283 patients of four inpatient units, nurses identified on admission a mean of 4.5 NDs per patient based on the limited number of available NDs of the NANDA-International Taxonomy. 40
For one ND, there were on average 4.2 nursing interventions. The relation of NDs and interventions was the lowest in the maternity unit (2.7 interventions per diagnosis) and the highest in the cardiac-monitoring unit (12.1). In the cardiac-monitoring unit, the average of diagnoses was slightly different than in the maternity unit (mean difference = 0.30). However, the number of interventions used was five times higher (31.19/5.99). The result is understandable considering the patients’ care needs and the assessments of NI. In the maternity unit, the proportion of NI classifications in the two highest NI categories IV and V was 27.2%, while in the cardiac unit it was 86.5%. That result illustrates how different the distribution of NI categories was between units (Table 2).
IPDs and NI classifications without any NDs amounted in total to 189 (7.3%), but only 14 days (0.5%) without any interventions. Nursing care plans with a lack of notes in needs assessments, including NDs and even more using nursing interventions have also been found in earlier studies.24,44 NDs are a core element of the nursing process, forming the basis for selecting operative interventions and making possible the evaluation of effectiveness of care. 16 It is remarkable that among IPD without any diagnoses, there was a maximum of 72 interventions for one day, the mean was 8.26 interventions. There is risk that an inaccurate identification of ND can lead to implementing inappropriate interventions or misinterpreting the related outcomes. 39 Although, there are 238 concrete main and subcategories of FiCND available; nurses quite often selected the highest component levels for documentation of NDs. In this research, focus was on the coded data, so the free-text was not used for analyses. Anyway, we noticed that, instead of using free-text for documentation of nursing interventions, the suitable descriptive terms of the FiCNI would have been available.
Despite missing NDs, statistically significant differences exist in the numbers of FiCND in the different NI categories. Using as a reference, the lowest NI category I, a patient has one ND, the expected number of NDs of the demanding category V is 2.5. The number of NDs may influence the nursing workload because of the ability of diagnoses to determine the patient’s clinical condition 39 and because of a high number of diagnoses this means a higher nursing complexity in terms of outcome to pursue and interventions to perform.38–40
A clear statistical relation also exists between the number of interventions used and the level of NI of the care provided. The higher the NI category, the more FiCNI were used, and the more were expected to be used (Table 5). It can initially be concluded that the more interventions are used, the higher is the individual patient’s NI points. In the RAFAELA System, the greater number of the unit’s NI points do not necessarily correlate with the greater need for staffing resources because the optimal NI level should be defined for every units singularly.30,32 The evaluation of NI is based on the interventions that have been carried out, not only those planned. 30 In the OPCq in every six sub-areas there are four possible intensity levels described verbatim to choose between (Figure 1), the quantity of nursing interventions performed is not counted. An earlier time measurement study has found that patients’ care in the most demanding NI category needed about 3.5 times more time than in NI category I. 52 The result combined with our results gives indications that the number and time of nursing interventions go hand in hand with NI, even though the other interventions are more time-consuming and demanding.
Traditional patient-care classifications have been criticised for their subjectivity and for increasing nurses’ workloads by requiring the manual assessment of patients’ NI scores once a day.42,53 Our goal is equivalent with many other projects; there are great expectations for re-using already existing data that are available in the EHR to provide real-time estimates of NI without adding to the nurses’ workloads by requiring additional data collection or documentation.45,54
The results of our previous study showed that more reliable NI data can be obtained if assessments of NI are based on precise and unified nursing documentation supplemented, if necessary, by a verbal report.25,35 According to health professionals, structured documentation facilitates the assessment of NI when both classification systems, the FinCC, and the OPCq, are in simultaneous use. 25 In Finland, in some EHRs including the research organisation, after cross-mapping (Figure 1), it is possible to utilise the documented, coded nursing data in the assessment of NI. When nurses need to assess patients’ intensity, they can check the previous 24-h’s documentation grouped in the OPCq sub-areas via the specific NI summary generated automatically, which helps nurses to assess intensity by OPCq criteria.
The need for re-use data of patient care documented in EHR for nurse staffing and workload analyses is obvious.2,16 The applications of IT are rapidly expanding, and electronically collected data from patient care from different databases offer completely new opportunities to develop health services and research.41,46 The need for research into data-driven healthcare management and security/privacy/ethics is imminent. 55 Many challenges of re-use-once documented data must still be resolved. 2 Clinical data quality should be the focus of attention. 1 Without equal standardised coded nursing data and sophisticated data processing, no possibilities exist for developing automated measurement systems for analysing or predicting patient acuity and NI for decision-making to design optimal nurse resources. 41 The outcomes of this study revealed that actual potentiality exists, but the opportunities offered by health technology need to be utilised.
Limitations
One limitation of this study is the quite short 2-week period for statistical data analyses. Later, we perceived that it would have been possible to analyse data from a longer time period. In this part of our wider study, we have analysed only the coded nursing data, not narrative texts, medication, or the notes in the table of vital signs. These should also be considered for NI assessment and will be the subject of our interest in the future.
In the research organisation, it is possible that the patient’s admission is during the evening shift. The receiving nurse assesses the patient’s need for care and sets NDs to the EHR. A night shift nurse makes the next day’s care plan by copying NDs from the previous evening if they have remained the same. Because that specific NI period consisted of two different days, there can be double NDs in one NI 24-h period. To ensure the quality of data gathered, we selected units that met the standards for nursing documentation and NI data. During the data collecting period in December 2015, the latest valid data was available from 2014, which set limits for data collection. Since 2014, nurses have used FinCC and OPCq daily according to the instructions without any major changes in nursing practices. Therefore, the research material can be considered representative to describe the practice of present nursing care and its documentation.
Conclusion
This study aimed to analyse the relationship of coded nursing data and NI data. There was a clear statistical relation between the number of nursing diagnoses used and interventions of the FinCC and the categories of NI measured by the OPCq. The higher the number of nursing diagnoses and interventions documented, the higher the NI level was. According to this initial study, there are possibilities for re-using coded nursing data for an administrative, resource planning purposes. Together with IT-developments, greater elaboration of both classifications is needed to get more precise and accurate coded data for evidence-based workload design.
Footnotes
Acknowledgements
Special thanks to Biostatician, Pasi Ohtonen, Oulu University Hospital, for statistical help and guidance.
Declaration of conflicting interests
The author(s) declared no potential conflicts of interest with respect to the research, authorship, and/or publication of this article.
Funding
The author(s) received no financial support for the research, authorship, and/or publication of this article.