
Abstract
We validate our previously developed (DOI: 10.1101/089227) clinical prediction rule for diagnosing transient ischemic attack on the basis of presenting clinical symptoms and compare its performance with the ABCD2 score in first-contact patient settings. Two independent and prospectively collected patient validation cohorts were used: (a) referral cohort–prospectively referred emergency department and general practitioner patients (N = 877); and (b) SpecTRA cohort–participants recruited as part of the SpecTRA biomarker project (N = 545). Outcome measure consisted of imaging-confirmed clinical diagnosis of mild stroke/transient ischemic attack. Results showed that our clinical prediction rule demonstrated significantly higher accuracy than the ABCD2 score for both the referral cohort (70.5% vs 59.0%; p < 0.001) and SpecTRA cohort (72.8% vs 68.3%; p = 0.028). We discuss the potential of our clinical prediction rule to replace the use of the ABCD2 score in the triage of transient ischemic attack clinic referrals.
Keywords
Introduction
The initiation of management of acute cerebrovascular syndrome (ACVS) 1 —such as transient ischemic attacks (TIA) and mild stroke—necessitates a clinical suspicion of ACVS based solely upon patients presenting clinical symptoms. National guidelines2,3 for ACVS management typically emphasize clinical symptoms representing motor (unilateral limb weakness) or speech deficits, as these symptoms are the most prevalent and characteristic of ACVS. The ABCD2 score, 4 for example, is a well-known prognostic risk score designed to predict the risk of recurrent stroke after an ischemic event, primarily on the basis of motor/speech deficits. The score is recommended by several guidelines to risk stratify patients3,5 and is also used by over one-third of TIA clinics to triage patient referrals. 6
Many non-cerebrovascular or “mimic” conditions, such as hemiplegic migraine, similarly present with motor/speech deficits. First-contact physicians frequently have difficulty in differentiating these conditions from ACVS. Of referrals to fast-track TIA clinics, approximately 30–60 percent of patients are ultimately diagnosed with a mimic condition.7–11 This difficulty in diagnosing ACVS on the basis of unassisted clinical judgment over-burdens TIA clinics, increasing patient wait-times for consultation and intervention. Limited medical resources, such as brain imaging (computed tomography angiography (CTA) and magnetic resonance imaging (MRI)), are also inappropriately allocated to low-risk, mimic patients. The ABCD2 score is of limited use in these contexts; being prognostic in nature, the score presupposes the very diagnosis of ACVS under deliberation. Therefore, increasing physicians’ ability to differentiate ACVS from mimic patients using only presenting clinical symptoms would be a first step to addressing these resource issues.
Our research group—Spectrometry in TIA Rapid Assessment (SpecTRA) 12 —has developed a clinical prediction rule (CPR) to differentiate ACVS from mimic condition on the basis of presenting clinical symptoms. 13 Our goal in the current analysis is to prospectively validate the diagnostic performance of our CPR using two independent, prospectively collected datasets. We also examine the performance of the ABCD2 score to better contextualize the performance of our CPR, as the ABCD2 score is the most frequently recommended and used CPR to guide ACVS management.
Method
Design
To validate our CPR, we utilized prospectively presenting successive TIA clinic referrals (i.e. referral cohort) as well as patients from a multi-site, clinical observational research study (i.e. SpecTRA cohort). Institutional review board approval to use the referral cohort data and to conduct the SpecTRA study was provided by the Island Health Research Ethics Board.
Referral cohort
The Stroke Rapid Assessment Unit (SRAU), Victoria, BC, Canada, is a specialized outpatient stroke unit servicing most of Vancouver Island (population 759,366). The SRAU receives referrals from emergency departments, general practice, and specialists (e.g. ophthalmologists). The referral dataset was chronologically collected after the initial phases of CPR derivation and temporal hold-out validation. In November 2014, the form used by physicians to refer patients to the SRAU was updated. By design, the updated referral form includes all fields required for the evaluation of the CPR. Referral forms were completed by referring physicians and entered verbatim into the SRAU electronic medical record (EMR) by unit staff.
The referral dataset consists of patients who had been referred to the SRAU between November 2014 and September 2015. On initial extraction from the SRAU EMR, the referral dataset contained 1475 patients. Patients’ ABCD2 scores were computed on the basis of the data present on the referral form using the standard formula. 4 Clinical symptoms not selected on the referral form were treated as absent (i.e. not present). Patients’ final diagnoses were derived using the same procedure used during CPR development (as described elsewhere). 13
Figure 1 displays the patient flow diagram detailing the treatment of missing data by casewise deletion (N = 598). Table 1 summarizes the demographic characteristics of the evaluable referral dataset (N = 877). Demographic information of the CPR development dataset (N = 4187) is also included for comparison; additional details on the development dataset and methods have been provided elsewhere. 13
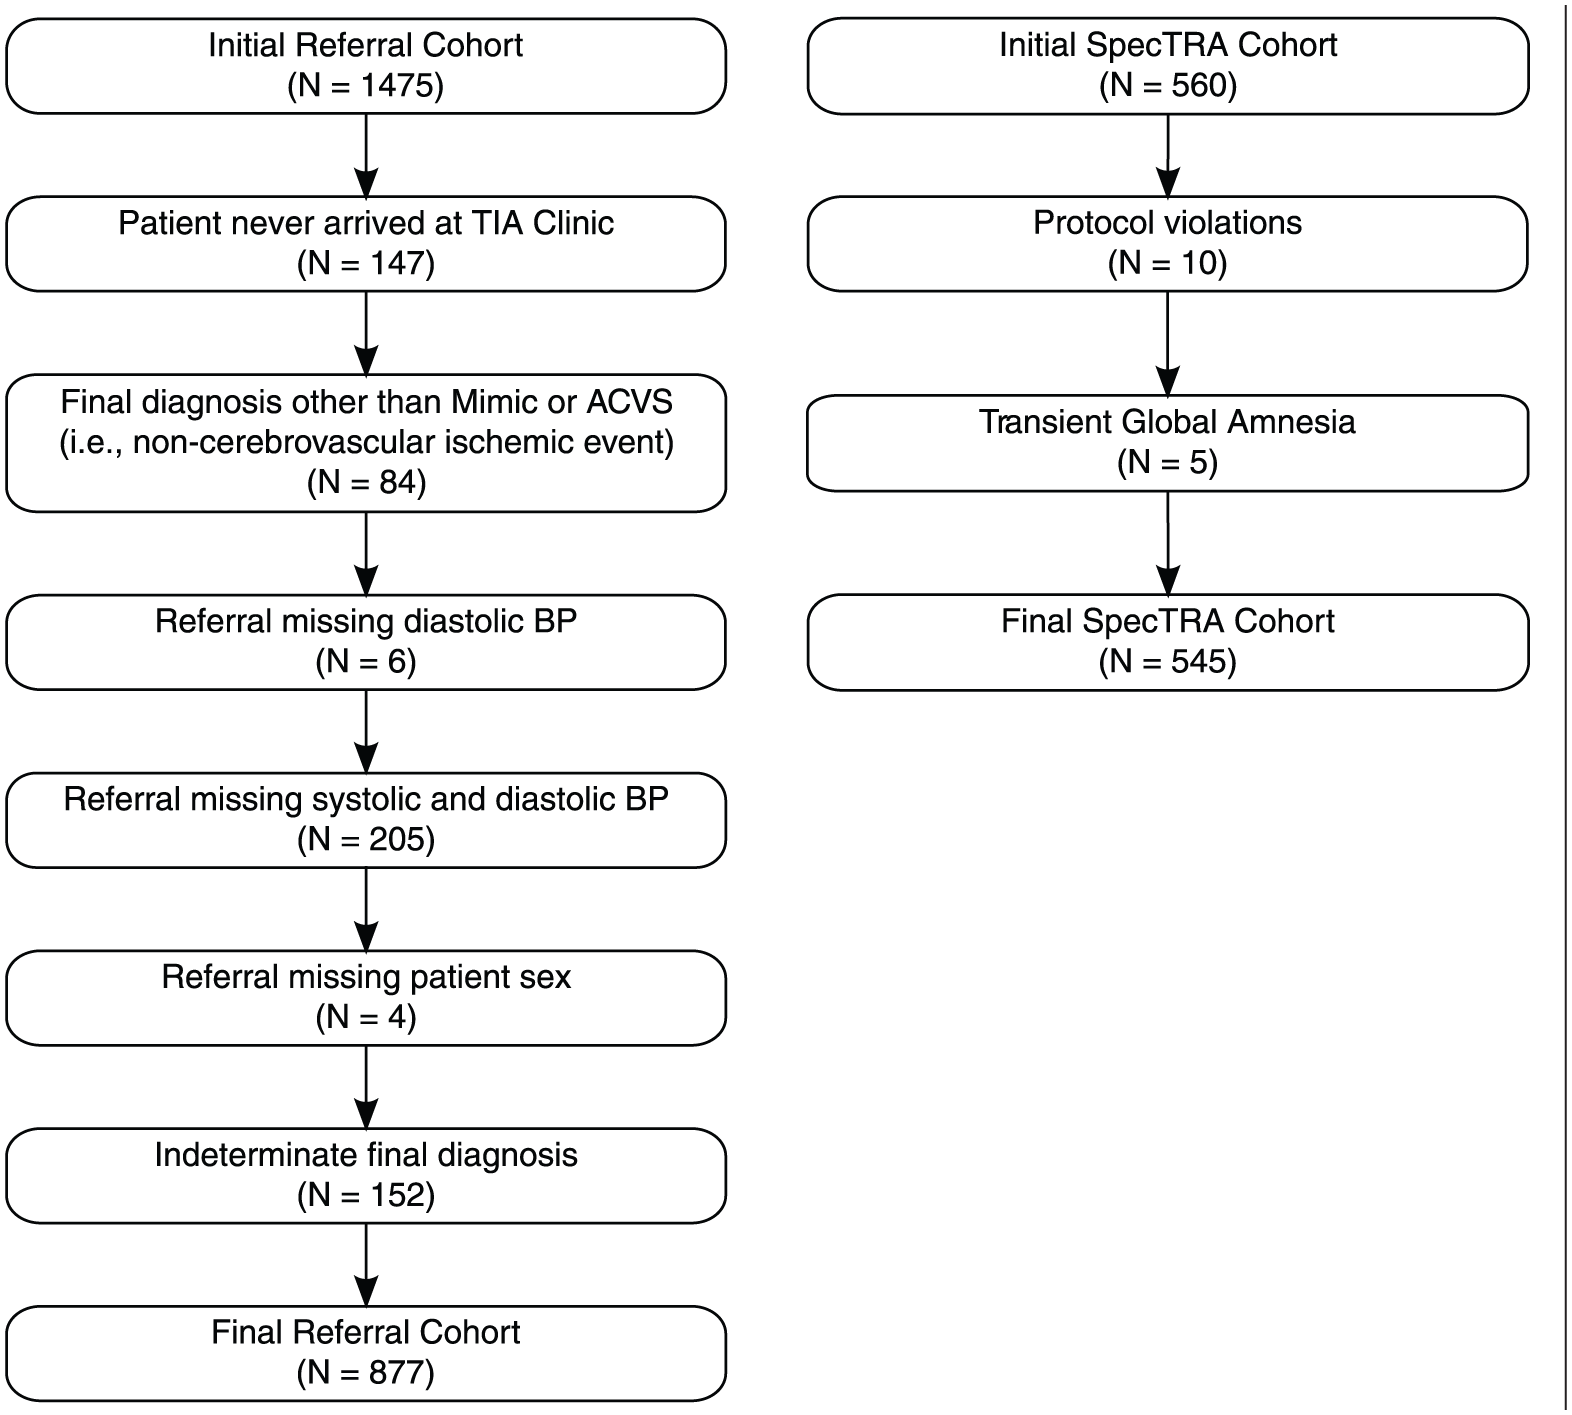
Participant flow diagram for referral and SpecTRA cohorts.
Demographics.
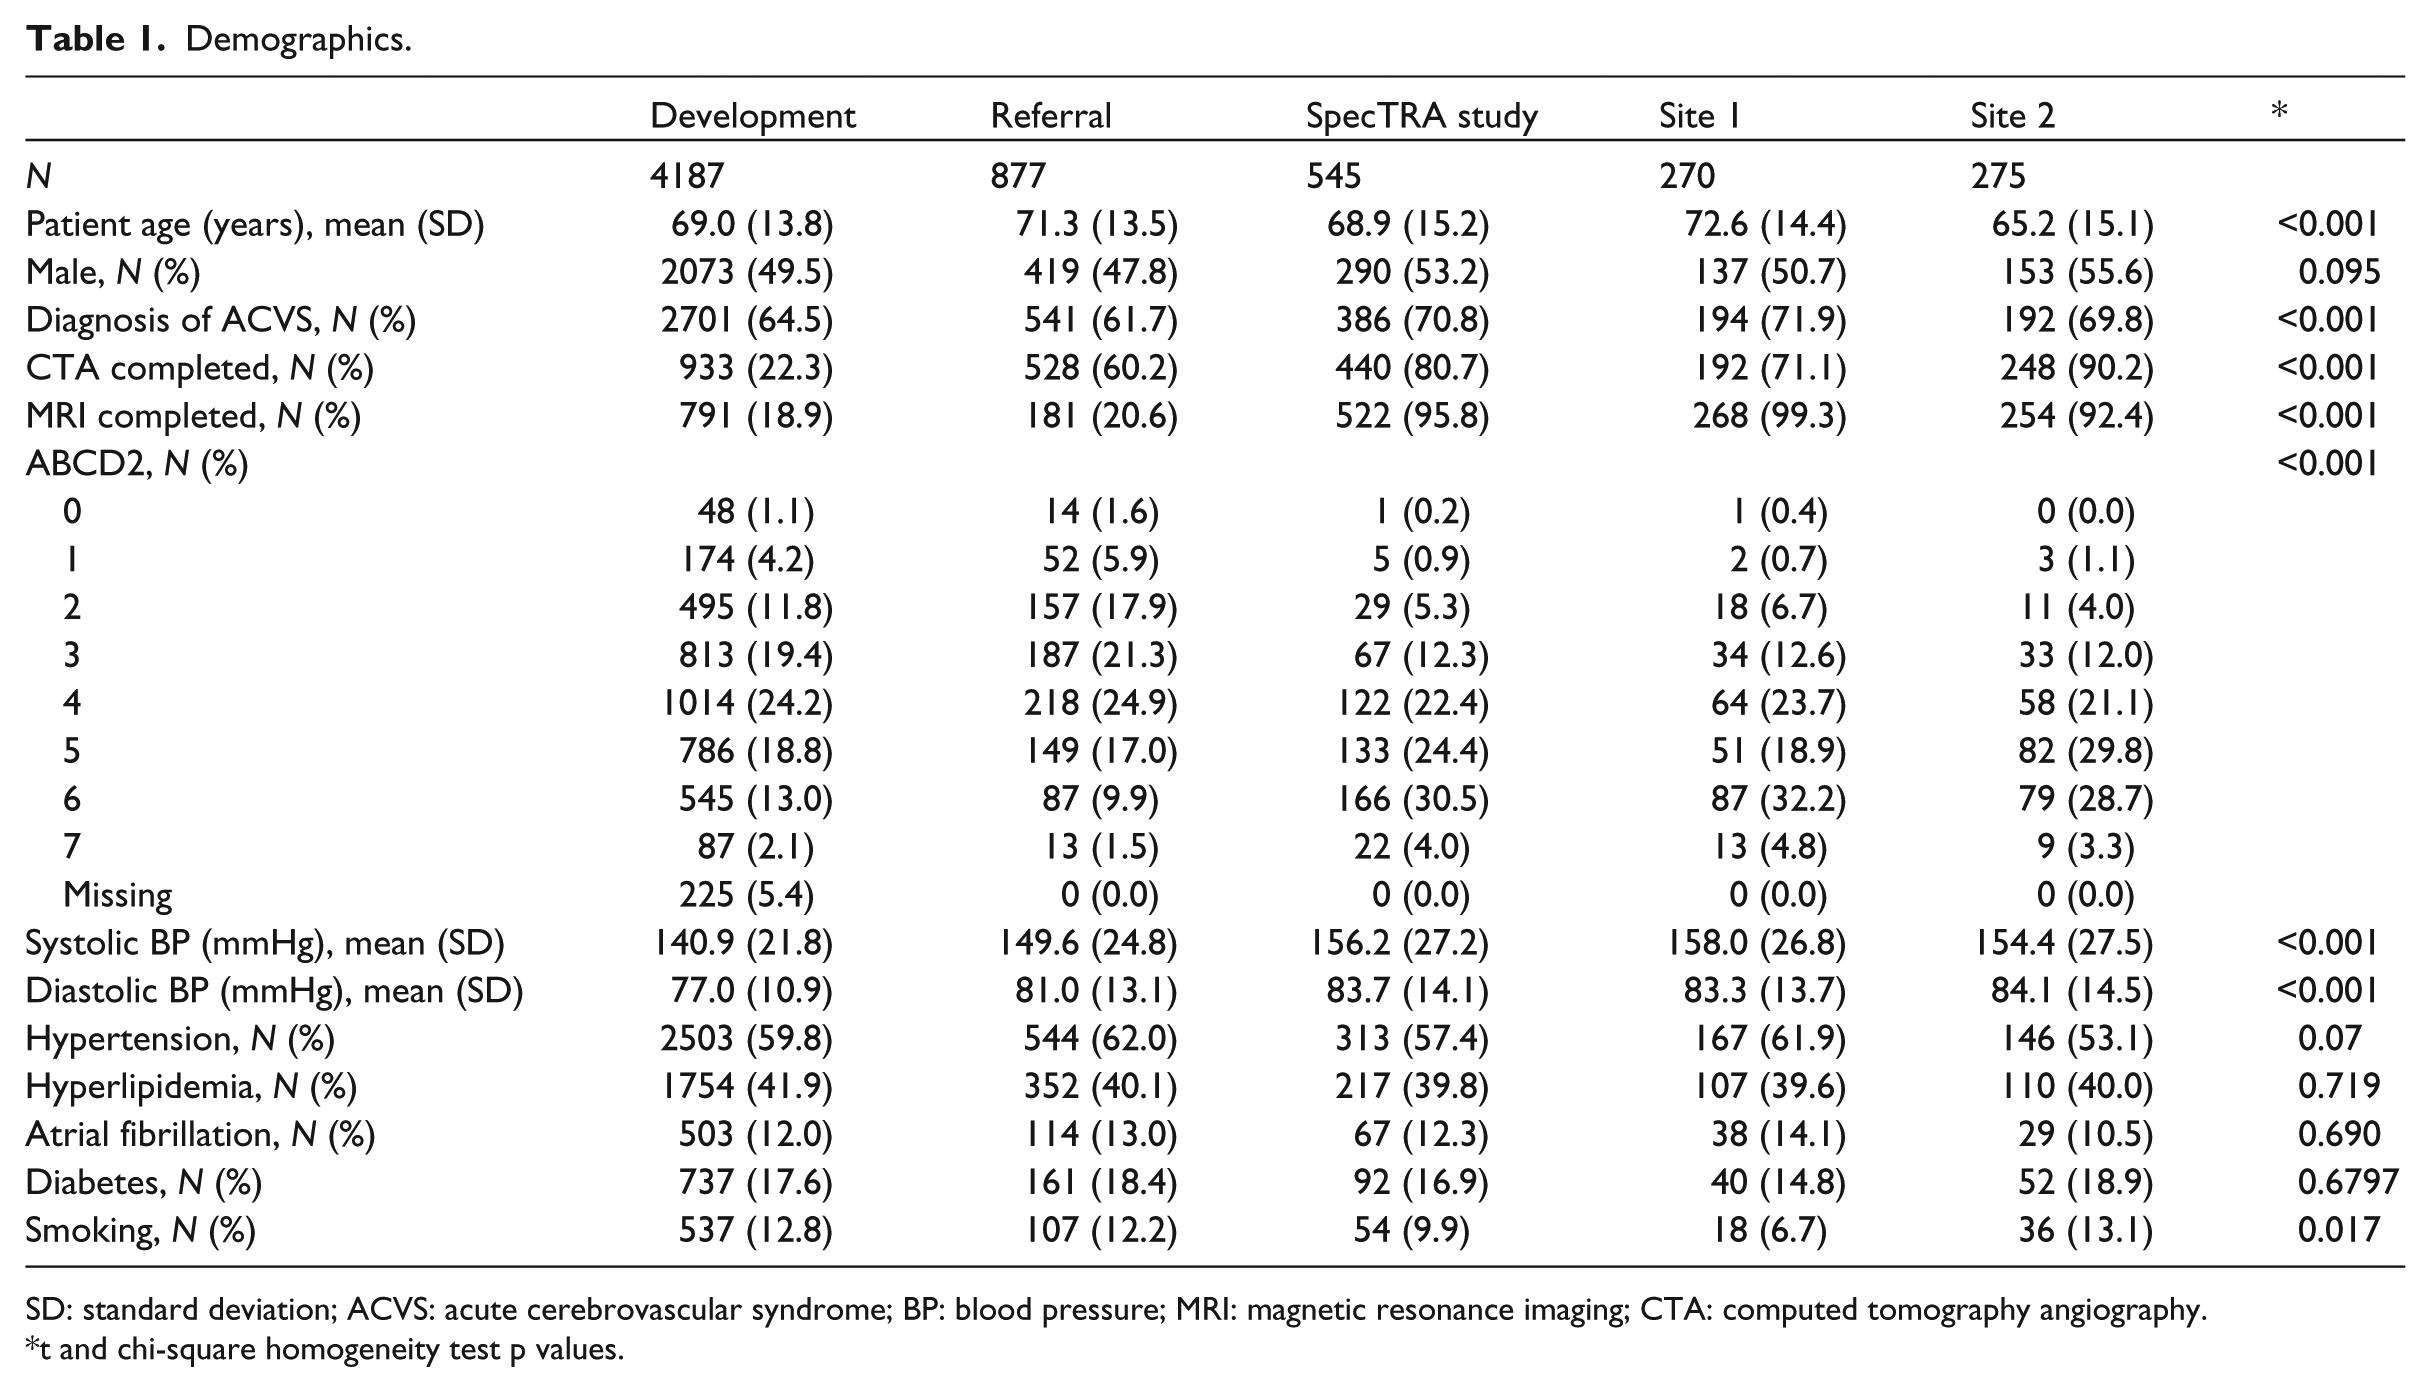
SD: standard deviation; ACVS: acute cerebrovascular syndrome; BP: blood pressure; MRI: magnetic resonance imaging; CTA: computed tomography angiography.
t and chi-square homogeneity test p values.
SpecTRA cohort
The SpecTRA cohort comes from the first phase of a multi-site, observational study that the SpecTRA group is conducting. The aim of the SpecTRA Study is to develop a blood-based, proteomic biomarker panel to differentiate mimic from ACVS patients in the emergency department (ED). Later phases of the SpecTRA study will validate the performance of the developed biomarker panel, both separately and in combination with some or all the clinical variables examined in this study. Patient enrollment for this SpecTRA cohort of participants (N = 560) occurred at two urban medical centers (Sites 1 and 2). Site 1 is an urban hospital with a small centralized stroke program, and Site 2 is an academic hospital with a large, centralized stroke program. Participants were enrolled within 24 h of symptom onset, and case-report forms (CRF) were completed by study nurses at the time of patient enrollment; the CRF included all clinical variables required by the CPR.
The participants for the SpecTRA cohort (N = 560) were recruited between December 2013 and May 2015. Enrolled patients received either MRI or CTA imaging as part of the study protocol. Double data entry was conducted by randomly selecting 10 percent of the patients from each enrolling site. Inter-rater reliability was calculated using Gwet’s AC1, 14 which ranges in value from −1 (perfect disagreement) to 1 (perfect agreement); values can be interpreted using standard benchmarking tables 14 (e.g. > 0.8 = excellent agreement). 15 Gwet’s AC1 was computed for each of the presenting clinical symptoms/variables recorded in the CRF. Mean Gwet’s AC1 was 0.995 (min = 0.97; max = 1.000).
Patients’ final diagnoses were adjudicated by study neurologists and based upon brain imaging results and neurological assessments. Of the initial sample, 10 patients were removed due to protocol violations, such as missing necessary brain imaging. On consideration of the medical and clinical ambiguity regarding Transient Global Amnesia (TGA) 16 and its potential relation to ACVS, an additional five patients were removed from the sample. In total, 15 patients were excluded from the dataset (see Figure 1). Patients’ ABCD2 scores were computed on the basis of the CRF data. Table 1 displays the demographic characteristics of the final evaluable SpecTRA dataset (N = 545).
Descriptive statistics comparing the individual predictors of the CPR between the development dataset and the referral and SpecTRA study datasets can be found in the supplement. 17
Statistical analysis
In the present analysis, we evaluate our CPR which takes the form of a fitted logistic regression model with 50 main effects and 12 interaction terms (coefficients can be found in Table 2 of Bibok et al. 13 ). The CPR is applied to both validation sets: referral dataset and SpecTRA study dataset. We also apply our CPR after stratifying the SpecTRA study dataset by study sites (Sites 1 and 2) to examine the impact of site-specific effects, as each site represents a different urban settings with potentially different patient and provider populations. Development of the CPR and associated datasets has been documented elsewhere. 13
Performance measures (95% confidence interval) of models on development, referral, SpecTRA study (combined), site 1, and site 2 datasets.
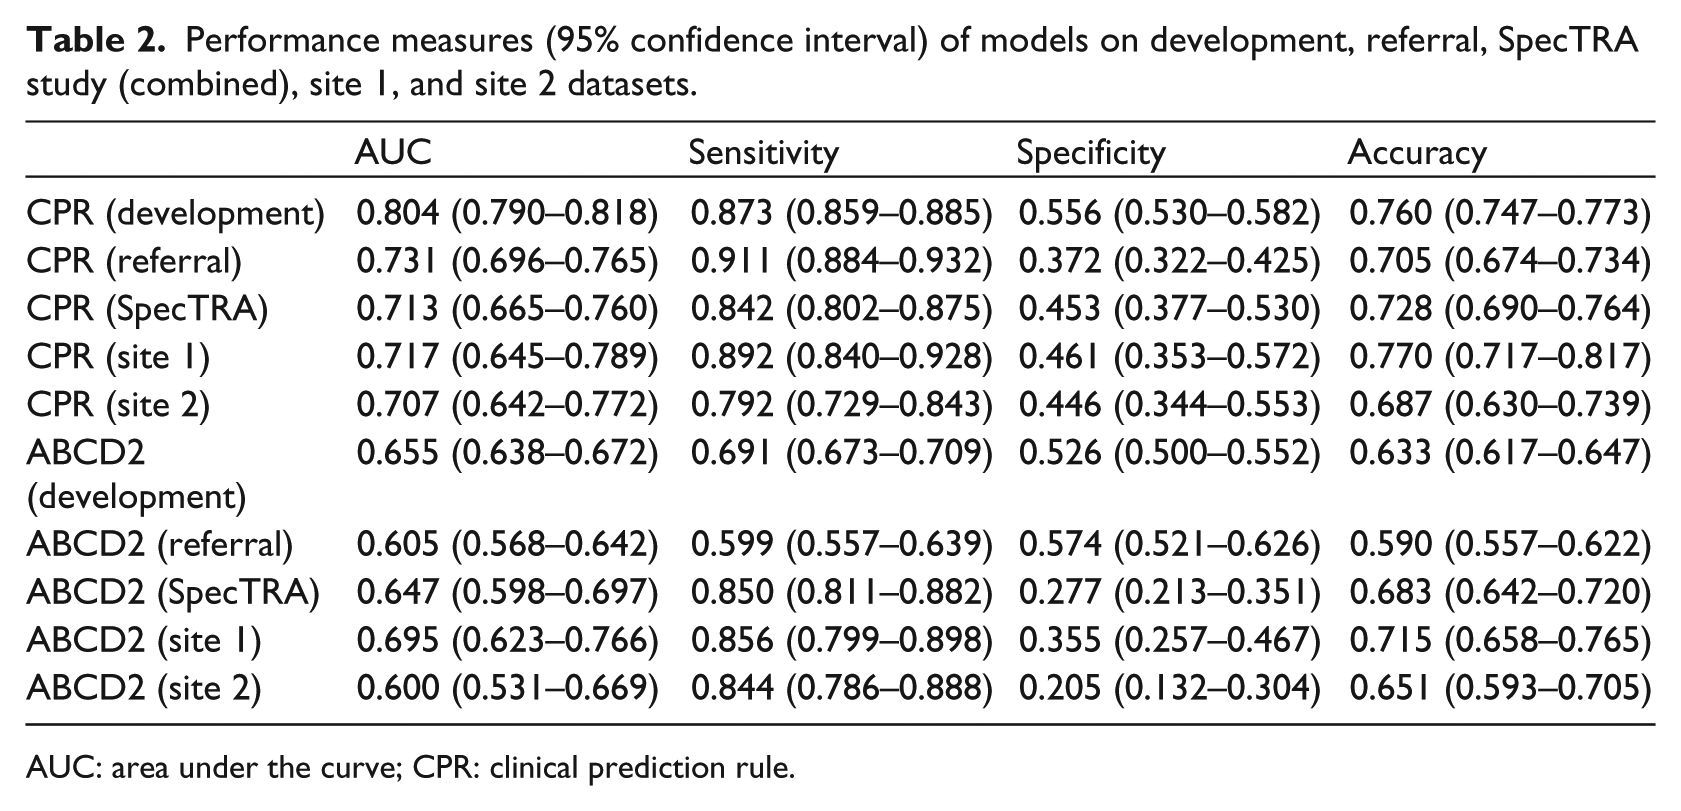
AUC: area under the curve; CPR: clinical prediction rule.
We assess the performance of our CPR using two criteria, the area under the curve (AUC) and the threshold for the linear predictor scores which maximizes diagnostic accuracy. 18 The threshold was previously established 13 on the development dataset and has a value of ≥0.063. For the ABCD2 score, a threshold of ≥4 was used to assess discriminant performance, as suggested by a number of national stroke guidelines.3,5 McNemar’s test 19 was used to assess differences in sensitivity, specificity, and accuracy between the classifications made by our CPR and the ABCD2 score within the validation datasets; Fisher’s exact test 20 was used to assess differences in these measures between the CPRs performance on the development dataset and the independent validation datasets. DeLong’s test of correlated receiver operating characteristic (ROC) curves 21 was used to access differences in the area under the ROC curve (AUC) between the two models within the validation datasets. Calibration plots22,23 were used for visual assessment of the CPR’s calibration against the final clinical diagnoses.
Analyzes were completed using the ROCR (v1.0.7), 24 pROC (v1.9.1), 25 immer (v0.5.0), 26 Hmisc (v4.0.2), 27 rms (v5.1.0), 28 and ggplot2 (v2.2.1) 29 libraries in the R statistical language (v3.3.2). 30
Results
Table 2 displays the discriminant performance of our CPR on the four validation datasets, along with the performance of the ABCD2 score.
Figure 2 displays ROC plots for the CPR performance on the validation datasets. With the exception of Site 1, the ROC curve of the ABCD2 score was completely encompassed by that of the CPR. These non-overlapping curves indicate that across the entire range of sensitivities (or specificities) the CPR has better discriminant performance than the ABCD2.
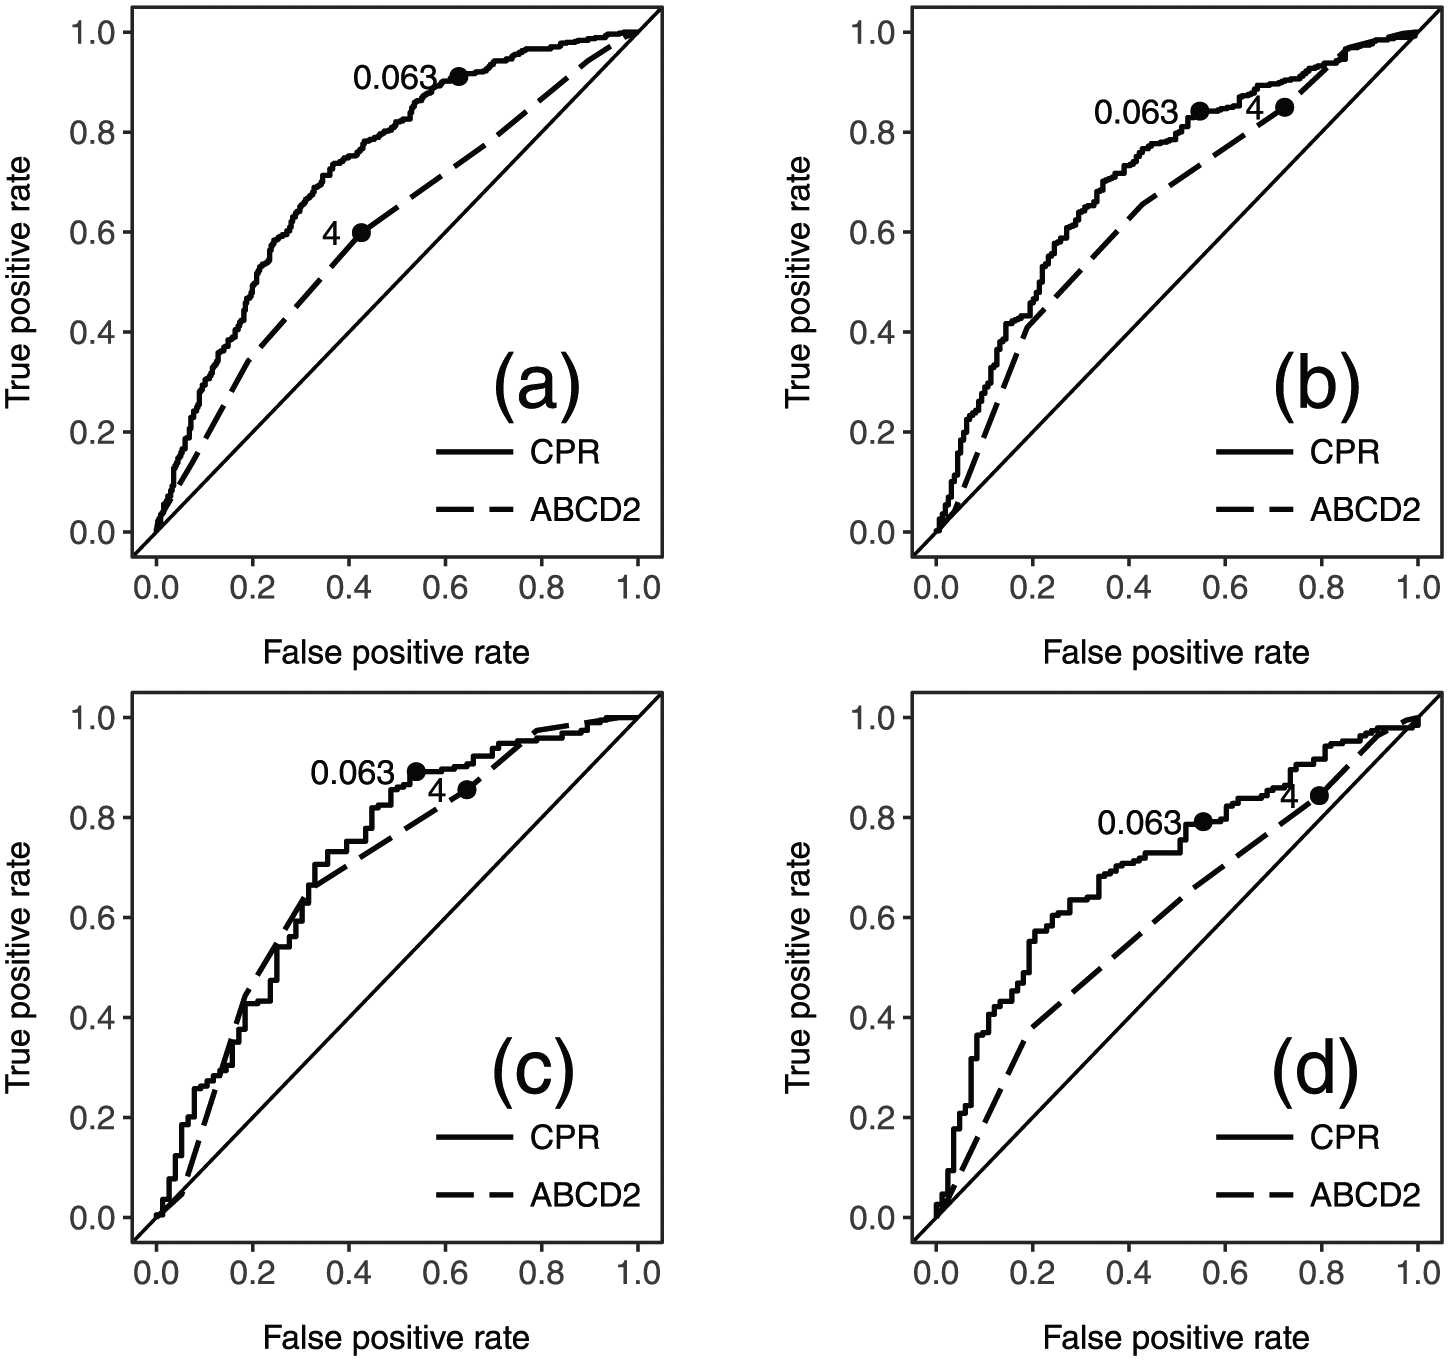
ROC plots of validation datasets with thresholds: (a) referral, (b) SpecTRA study (combined), (c) site 1, and (d) site 2. CPR: clinical prediction rule.
Figure 3 displays calibration plots for the CPR performance on the validation datasets. The calibration curve for the CPR on the referral dataset ran nearly parallel to the line of equality, with the confidence interval for the curve tracking the line. This suggests that in the context of the referral data, the model is well-specified.
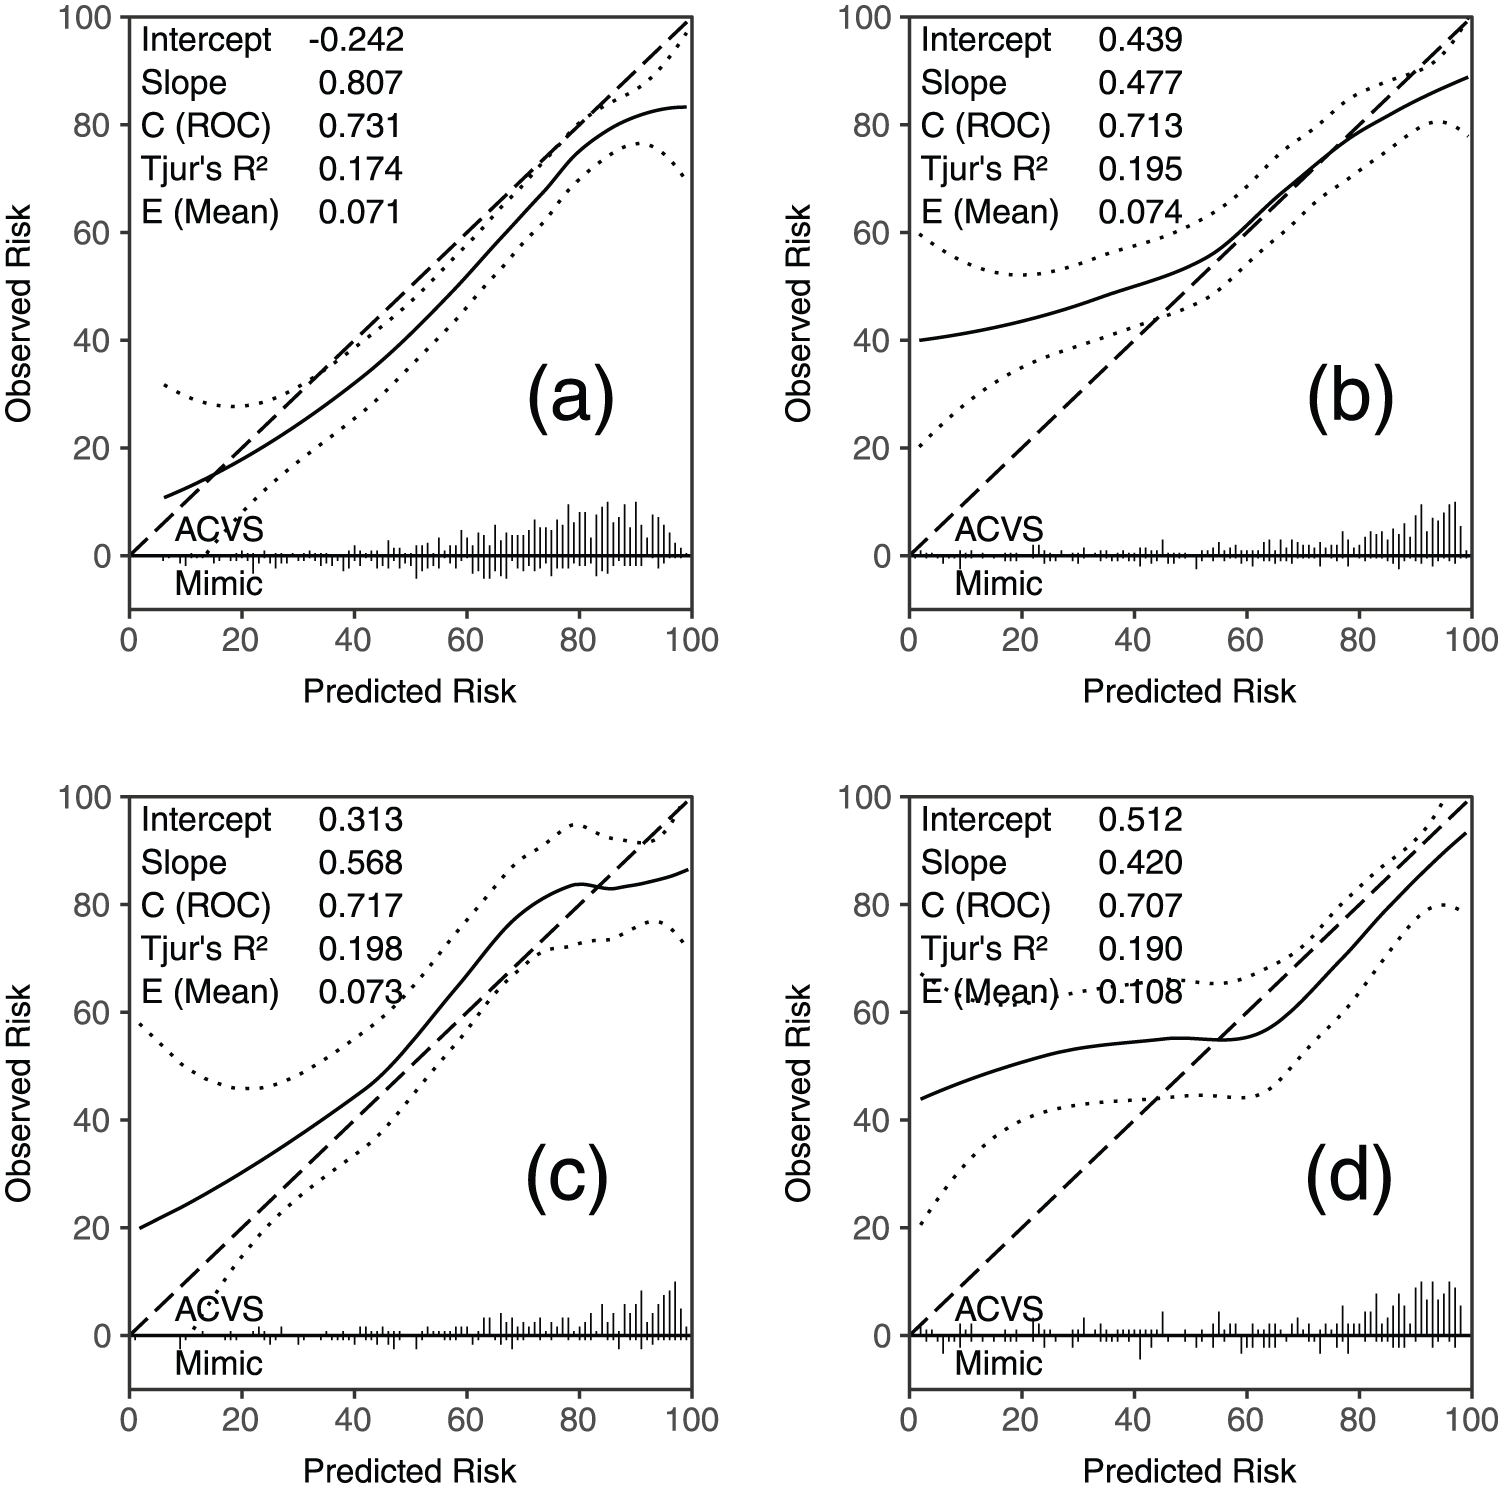
Calibration plots of validation datasets. (a) referral, (b) SpecTRA study (combined), (c) site 1, and (d) site 2. Solid line: calibration line; dashed line: line of equality; and dotted line: 95% confidence interval. Intercept/slope: intercept and slope of calibration line estimated by logistic regression (intercept = 0 and slope = 1 equals perfect calibration).22,31 C (ROC): AUC and Tjur’s R2 = Yate’s/discrimination slope. 32 E (mean): mean absolute difference between calibration curve and line of equality. 28 Ticks along x-axis: histograms of predicted probabilities separated by outcome.22,23
On the referral dataset, the CPR was found to have significantly higher accuracy (70.5% vs 59.0%; p < 0.001) and sensitivity (91.1% vs 59.9%; p < 0.001) than the ABCD2 score. DeLong’s test indicated that the CPR had a significantly higher AUC than the ABCD2 score (73.1% vs 60.5%; p < 0.001). The sensitivity, specificity, and accuracy of the CPR differed significantly between the development and referral dataset (each p < 0.01).
On the SpecTRA study dataset, the CPR had significantly higher accuracy than the ABCD2 score (72.8% vs 68.3%; p = 0.028). Sensitivities were not significantly different between the two models, but the CPR had significantly higher specificity (45.3% vs 27.7%; p < 0.001). The CPR had a significantly higher AUC than the ABCD2 score (71.3% vs 64.7%; p = 0.008). Fisher’s exact tests indicated that neither accuracy nor sensitivity for the CPR was significantly different between the development and SpecTRA study datasets (each p > 0.2).
When the SpecTRA dataset was stratified by site, sensitivity and specificity were not significantly different between the models for Site 1, although accuracy was higher for the CPR, (77.0% vs 71.5%; p = 0.041). The AUCs of the two models were not significantly different. Fisher’s exact tests indicated that neither sensitivity and specificity nor accuracy for the CPR was significantly different between the development and Site 1 study datasets (each p > 0.1).
For Site 2, only specificity was found to be significantly higher for the CPR than the ABCD2 score (46.1% vs 35.5%; p = 0.001). The CPR had a significantly higher AUC than the ABCD2 score (71.7% vs 69.5%; p = 0.002). Fisher’s exact tests indicated that the sensitivity and accuracy of the CPR differed significantly between the development and referral dataset (each p < 0.05).
Discussion
Our aim in this study was to validate the diagnostic performance of our CPR to distinguish mimic and ACVS patients based upon presenting clinical symptoms. To this end, we evaluated the diagnostic performance and calibration measures of our CPR on data collected from referral forms to a fast-track TIA clinic and prospectively collected clinical study data.
Overall, we found that the CPR evidenced greater accuracy than the ABCD2 score on the validation datasets, with the exception of Site 2 in which there was no difference. On the referral dataset, the CPR displayed promising performance. In the context of TIA clinic referrals, the model is likely to lead to an improvement in clinical decision making over the ABCD2 risk score traditionally used in TIA clinics for triaging patient referrals. This conclusion is further supported by the significantly increased accuracy, sensitivity, and AUC of the CPR compared to the ABCD2 score.
On the SpecTRA study dataset, the CPR displayed both sensitivity and accuracy that were consistent with that observed on the development dataset; moreover, for Site 1 dataset, the CPR also demonstrated consistent specificity. Both the CPR and the ABCD2 score were found to have similar sensitivities on the SpecTRA study datasets. Specificities, however, were observed to be markedly higher for the CPR than the ABCD2 score, along with AUCs for the combined and Site 2 datasets. This suggests that the CPR would likely be an improvement over the ABCD2 score for ED staff in differentiating ACVS from mimic patients and may have application in the areas of patient screening and triage for advanced neurological services.
Most encouragingly, the CPR performs consistently across different medical datasets despite the obvious variation in case-mixes between the historical training and validation datasets. Debray et al. 33 have suggested that models that display stable model performance across diverse case-mixes are likely to generalize well to other settings. Future work will need to verify whether the robustness of the CPR carries over into other patient populations with different assessment and triage procedures.
Footnotes
Acknowledgements
Research was conducted within the Department of Research and Capacity Building, Vancouver Island Health Authority (Island Health).
Declaration of conflicting interests
The author(s) declared no potential conflicts of interest with respect to the research, authorship, and/or publication of this article.
Funding
The author(s) disclosed receipt of the following financial support for the research, authorship, and/or publication of this article: Funding for this study was provided by non-industry sources: the Heart and Stroke Foundation (grant no. PG-08-0415), Genome British Columbia (grant no. 4125-Penn), and Genome Canada (grant no. 4125-Penn).