
Abstract
This article examines methods for automated question classification applied to cancer-related questions that people have asked on the web. This work is part of a broader effort to provide automated question answering for health education. We created a new corpus of consumer-health questions related to cancer and a new taxonomy for those questions. We then compared the effectiveness of different statistical methods for developing classifiers, including weighted classification and resampling. Basic methods for building classifiers were limited by the high variability in the natural distribution of questions and typical refinement approaches of feature selection and merging categories achieved only small improvements to classifier accuracy. Best performance was achieved using weighted classification and resampling methods, the latter yielding an accuracy of F1 = 0.963. Thus, it would appear that statistical classifiers can be trained on natural data, but only if natural distributions of classes are smoothed. Such classifiers would be useful for automated question answering, for enriching web-based content, or assisting clinical professionals to answer questions.
Introduction
This article considers the feasibility of using automated question classification to discriminate among a broad range of consumer-generated cancer questions. Question classification has been a key step in automated question answering (QA) and offers many potential benefits over a deep parsing strategy for interpreting questions; however, prior approaches1–6 have been too limited to answer the health questions of the general public. Question classification could also be used to assist clinical support staff in answering questions by suggesting a likely set of answer templates or be used to provide metadata for questions on the web, so that questions posted in social media could be linked to similar questions or to sources on the web that might provide answers.7–9 There are two critical limitations of existing approaches to classifying health questions; first, most often they have been developed using manually constructed corpora, rather than questions posed by people who had a true information need, or they address only simple categorizations, such as factoids in the general domain. Our research, by contrast, starts with a new collection of authentic questions, develops a new, non-factoid taxonomy from it, and tests the hypothesis that a properly trained classifier can provide an effective means of identifying the information need expressed by a question. Creating such a classifier requires addressing the challenges of real data, including errors in spelling or grammar, and the likelihood that the natural distribution of people’s information needs will not be uniform.
Question classification is a special case of document classification in which each question is considered a document and the classification is a label for the type of answer that the questioner is expecting.10–12 This class is referred to as the Expected Answer Type (EAT) of a question. The EAT, in conjunction with the topic of the question, can be used as input to an information extraction process (such as for open-domain question answering) or as a search key for real-time matching of questions to stored answers for closed-domain question-answering. Question classification requires having an appropriate taxonomy of EATs. Prior taxonomies for question-classification1–4 have been developed using synthetic questions (imagined by researchers) or from questions asked by clinical experts. Also, the questions have been limited to simple types (people, places, organizations, names of drugs, and so on), referred to as “factoids.” As questions from the general public might require a complex description and not just a simple entity, we investigated developing a new taxonomy that could make such distinctions. To obtain natural consumer-generated questions, we collected questions found on community-based question answering (cQA) websites. 13 An informal review of these data quickly revealed that no existing taxonomy would cover the range of questions posted by the public. Thus, collecting a natural corpus and creating such a taxonomy was essential.
We were most interested in assessing the feasibility of classifiers to support automated QA. Automated QA, while not new, is undergoing a resurgence, most notably IBM’s Watson.14–16 QA is very appealing to information seekers because it saves them from searching for information or having to wait until a person can respond to their inquiry. Documents for disseminating health information, such as paper booklets or public websites, generally aim to serve a broad audience and thus present far more information than required for an individual, requiring many steps to get to the needed information. Automated QA is also appealing to information providers, however, because it allows them to address the specific needs of their clients, without consuming too many resources. Consumer-support services, including telephone answer-lines, one-on-one phone calls, and even web-based email typically require at least one full-time staff person, and that person may need very specialized expertise (such as Medela’s lactation consultant).17,18
Automated QA would be especially useful for disseminating public health information, because it can be deployed to a broad audience using mobile phones, which we have found to be more prevalent than Internet use among some low-income populations.19–21 We have conducted both survey and observational studies and consistently found that many participants preferred the idea of asking health questions by text messages, rather than by conducting a web-search. A key concern is how to recognize the information need expressed by the question quickly and accurately, which led us to this investigation of question classifiers.
The research described here tests the hypothesis that a classifier trained on real users’ questions can provide an effective means of identifying the information need expressed by a question. There are three main parts to this research. First, we collected cancer questions from cQA websites 13 and performed some manual filtering to obtain relevant questions. Second, we iteratively built a taxonomy to divide questions by EAT and coded a sample of questions. Third, we created a set of test classifiers using our corpus as training and test data, and our taxonomy as our set of classifications, focusing on Supervised Machine Learning (SML) based techniques.11,12 The most common SML techniques used in question classification are statistical approaches, decision trees, and vector space algorithms, 11 but none of these techniques has been evaluated with real data. Real data are challenging for many SML techniques, because similar terms may appear in numerous forms and there may be an uneven distribution among the types. To address these concerns, we considered the performance of the basic classifiers and several simple methods to improve classifier performance (such as dimensionality reduction),11,22 as well as more sophisticated approaches, such as iterative resampling of the data.23,24 The results provide valuable insight for further research involving natural datasets.
Methods
This work addresses two main concerns: first, how can one develop a reliable coding scheme for consumers’ questions, and second, how well do different classifiers work after being trained on natural questions asked by the general public to address a true information need. This evaluation required obtaining a suitable corpus, creating a taxonomy, manually coding progressively larger samples of questions and then using the final corpus for testing a wide-variety of well-known classifiers, and techniques for improving their performance. Below we elaborate on each of these steps.
Building a corpus and a taxonomy
The first step was to build a corpus of natural questions coded using a taxonomy of EATs suitable for answering questions consumers have about cancer. We developed both together using an interleaved, iterative process. Using a large set of harvested questions that had been promoted and verified (as described below), each iteration involved coding a sample with the current version of the taxonomy, assessing inter-rater reliability, and extending and refining the taxonomy. Refinement stopped when no additional improvement in reliability was noted.
Question collection
To gather questions, we created a web-crawling application to visit selected sites. The application uses keyword matching to determine relevant questions when crawling sites not restricted to cancer. The saved data are then imported into a Structured Query Language (SQL) database for processing and classification. The cQA websites crawled for our corpus were All Experts, 25 The American Society of Clinical Oncology, 26 The Cleveland Clinic, 27 Med Help, 28 Net Wellness, 29 and Your Cancer Questions. 30
Question promotion and verification
Our automated method for gathering questions was noisy. Some of the “questions” contained 1000’s of characters of background description and it is beyond the scope of our work to filter this material automatically. Also, some of the questions were conjunctions of several questions, which again we do not aim to recognize or divide automatically as part of the current effort. Other issues we noted were items related to non-human species and items that were not questions in the rhetorical sense. To address these problems, we added some automated filtering based on length and a manual review of all items to filter ones not relevant to the task, remove material not essential to the question and subdivide compound questions. After a coder promoted a question, a second coder verified it to assure that it met our criteria. This process of promotion and verification and coding was performed eight times on progressively larger samples of data, starting with a 15-item sample, and ending with a sample of about 1500 items, as the taxonomy and coding protocols were refined. (The first two coding rounds, using the smallest samples, were considered pilot studies, and thus involved only a single coder.)
EAT Taxonomy construction
From the start, we structured the new taxonomy as a multi-level hierarchy, where the top-level categories are Factual, PatientSpecific, and NonClinician, as this suited our intended QA application; however, all coding was done at the level of terminal categories, which we refined over time. Factual questions are questions that can be answered directly with medical facts by an automated QA system. This includes traditional factoid questions as well as more complex information needs, such as “how” and “why” questions. PatientSpecific questions are also medical questions, except they are about a specific person’s condition or treatment. These questions can only be answered by a clinician, so a QA system should either suggest consulting a provider or forward the question to a provider itself. NonClinician questions ask for non-medical information related to cancer. For example, questions about health insurance, legal issues, or emotional needs belong in this category. Such questions might also be deemed outside the scope of the system and addressed via an external resource, possibly through social media. The more specific categories of the taxonomy cover subtypes of questions, such as questions about the meaning of a term or an explanation of some medical procedure. The organization and rationale for the taxonomy was explained to the coders to help them discriminate among labels that might otherwise seem similar.
Taxonomy refinement
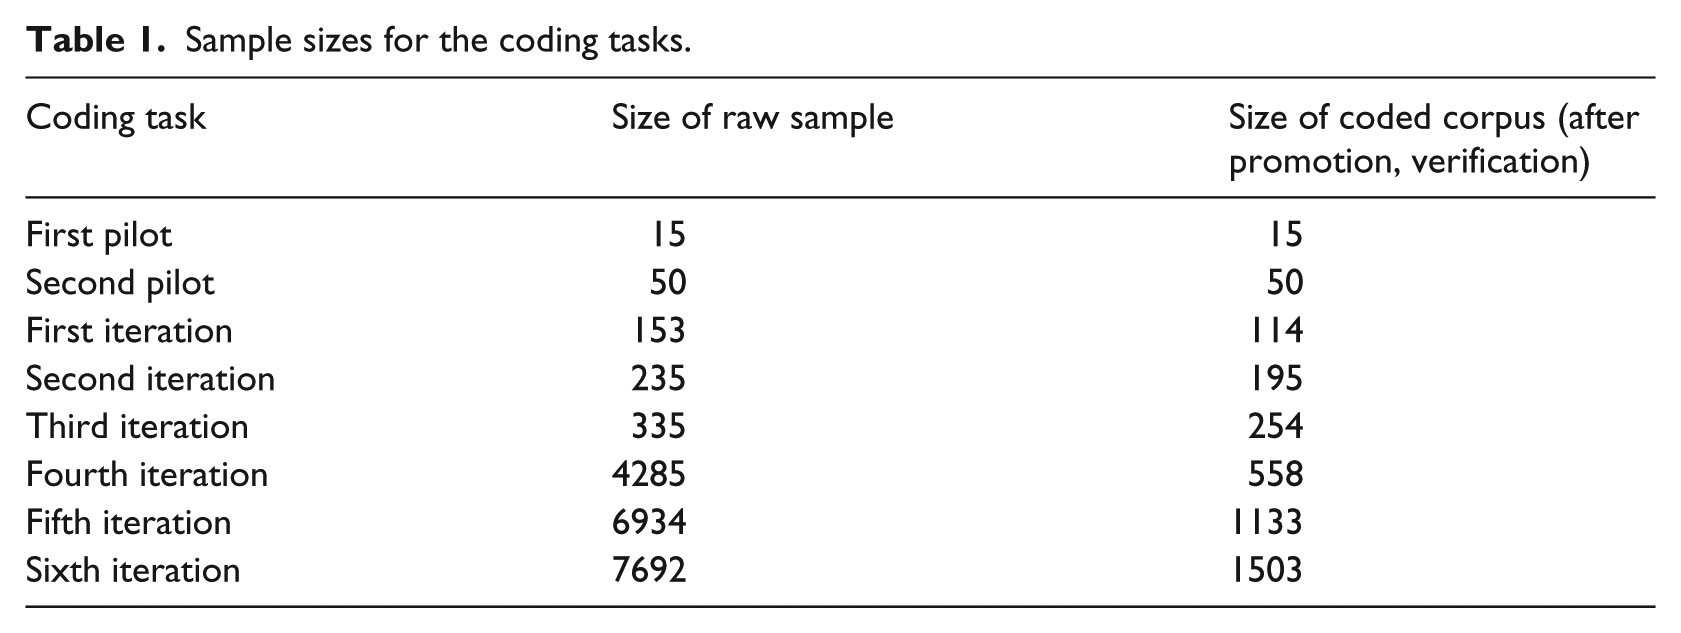
We used inter-coder agreement statistics31,33 measured from classifications of samples of our corpus as feedback to inform taxonomy construction. In this manner, we could objectively measure the impact of each revision of the taxonomy. Coders would independently classify a subset of the promoted questions by hand, using a software tool that we developed. The tool allowed them to select codes from a dropdown menu, eliminating the possibility of typographical errors in the coding. Inter-coder agreement statistics were then calculated and meetings held to discuss questions and categories with low inter-coder agreement scores. The goal was to achieve an agreement of 0.70, which is generally considered reliable for a coding scheme. In the early stages, the most common reasons for low agreement were misinterpretation of the category meaning on the part of coders, an ambiguity between two or more categories in the taxonomy, or a gap in the taxonomy where a question did not fit into any category. After discussion, the taxonomy or the coding protocol were revised accordingly. After each revision, the manual classification task was re-started using the revised taxonomy. Altogether, there were two pilot studies (single coder) and six iterations (multiple coders). Table 1 shows the size of the raw samples used in each step and the number of items that were subsequently coded after promotion and verification.
Sample sizes for the coding tasks.
Filtered Taxonomy construction
While there is no fixed standard for the minimum number of examples needed to train a SML-based classifier as it depends on specifics of the data, we felt that for a dataset of around 1300 questions one should have at least 25 instances of each class. Since a few of the classes in the final taxonomy had much less, we wrote a function to create a one-to-one transformation that automatically mapped this taxonomy onto a smaller one where similar classes with low question counts were merged. We refer to this as the Filtered Taxonomy. We then used this version to test classifiers.
Training statistical classifiers
The second main part of this effort was to test different configurations of classifiers. All testing was done using Weka, 34 along with some functions of Lucene 34 following widely used algorithms for text classification,1,3,11,12,36,37 as well as other techniques to address problems in question classification, such as sparseness of terms or unbalanced distribution of classes.11,12,23,24,38,39
Tests of classifier algorithms
For the basic classifiers, we tested naive Bayes (NB), 39 multinomial naive Bayes (MNB), 41 J48 Trees, 42 and a sequential minimal optimization (SMO) implementation of support vector machines (SVM), 43 which is faster than LibSVM, 44 comparable to others. 45 We used a linear kernel for SMO for the entirety of our testing, as pilot trials with radial and quadratic kernels performed consistently worse. All classifiers were tested with 10-fold cross validation12,33 using the Filtered Taxonomy shown in Figure 2. We tested both the Level 1 Taxonomy Distribution (comprising just the top-level categories) and the Terminal Distribution (comprising all bottom-level categories).
Tests of dimensionality reduction
Since lexical variation among semantically similar questions is common, we tested several dimensionality reduction techniques. Here, dimensionality reduction involves removing terms from questions to improve performance without compromising accuracy. We implemented two Local Relevancy latent semantic indexing (LSI) techniques similar to a Ladder-Weighted LSI. 22 We also tested automated spelling correction and feature replacement. We first tried a flat threshold Local Relevancy LSI technique, where a term was trimmed from the corpus if it appeared in more than a certain percentage of questions in every category. We tested the range of 5–25 percent as the threshold, in increments of 5 percent (there were no terms that appeared in 30 percent or more of questions every category). The second Local Relevancy LSI technique we tried used a range of incidence rates. A term was trimmed from the corpus if its incidence rate across all categories fell within a specified percentage of the mean incidence rate. This eliminated terms that had a similar rate of occurrence across all categories, not just a high rate. We tested ranges of 30–50 percent of the median in increments of 5 percent. (We did not use the LSI)12,22 attribute selection in Weka, 33 as it required too much memory.)
We tested spelling correction with Lucene’s 35 built-in spell-checking functionality. The Lucene spell checker uses a dictionary text file as input for the correct spelling of words and outputs a list of possible corrected spellings for each word in a document that does not match a word in the dictionary. We combined the Ispell 45 standard American English dictionary as compiled by WordList 46 and the Consumer Health Vocabulary 47 dictionaries into a single input file. To further reduce the number of terms, we also tested feature replacement strategies, including replacing sequences of digits with the token #NUMBER, replacing drug names with the token #DRUG, and dates with the token #DATE, using a method similar to Juan et al. 49
Tests of weighted classification
To address the lack of uniformity in the distribution of question types, we tested a weighted SVM. 38 To construct a weighted SVM, we used Weka’s LibSVM library with its default settings and calculated the weights based on the inverse percentage of their appearance in the dataset, and multiplied that result by a 100, an empirically chosen constant.
Tests of resampling
We also tested resampling,23,24 another method for imbalanced data. We used Weka’s supervised instance resampling filter. This filter was originally designed to classify large datasets by pulling out a portion of the data to generate a model. The filter can be “biased” to balance the subset closer to a uniform class distribution with an ensemble method of over-sampling under-represented class data and under-sampling over-represented classes. By keeping all the data, but adding a bias toward a more uniform class distribution, the filter balances a previously skewed dataset without reducing the overall sample size. We tested the filter using three values for bias, 1.0, 0.5, and 0.1.
Results
Test corpus
We collected items from six well-known health information websites that answer and archive consumer-generated questions. Formats for these sites include live chats, user answered forums, and e-mailed or web-form submitted questions. Our application retrieved more than 50,000 potentially relevant items. For the final testing of the classifiers, from a sample of 7692 items, a total of 1904 Raw Questions were processed, with 757 (39.7%) rejected by coders. The 1147 remaining Raw Questions yielded 1503 Promoted Questions. All 1503 Promoted Questions were classified by two coders, with 1279 placed in the final classified corpus. The remaining 224 (15%) questions were rejected by coders (during classification) or administrators (post classification). These rejected questions were determined to have been promoted improperly, either because they had been edited or split incorrectly, or because they were not questions related to cancer in humans. The final Level 1 Distribution agreement was close to 0.7 and the final terminal level distribution agreement was 0.55, which we deemed sufficient, given our task. 49 After these scores were calculated, examples with low agreement were discussed and the consensus coding was used. There were no relevant questions that coders were unable to place in a Level 1 Category.
Final EAT Taxonomy
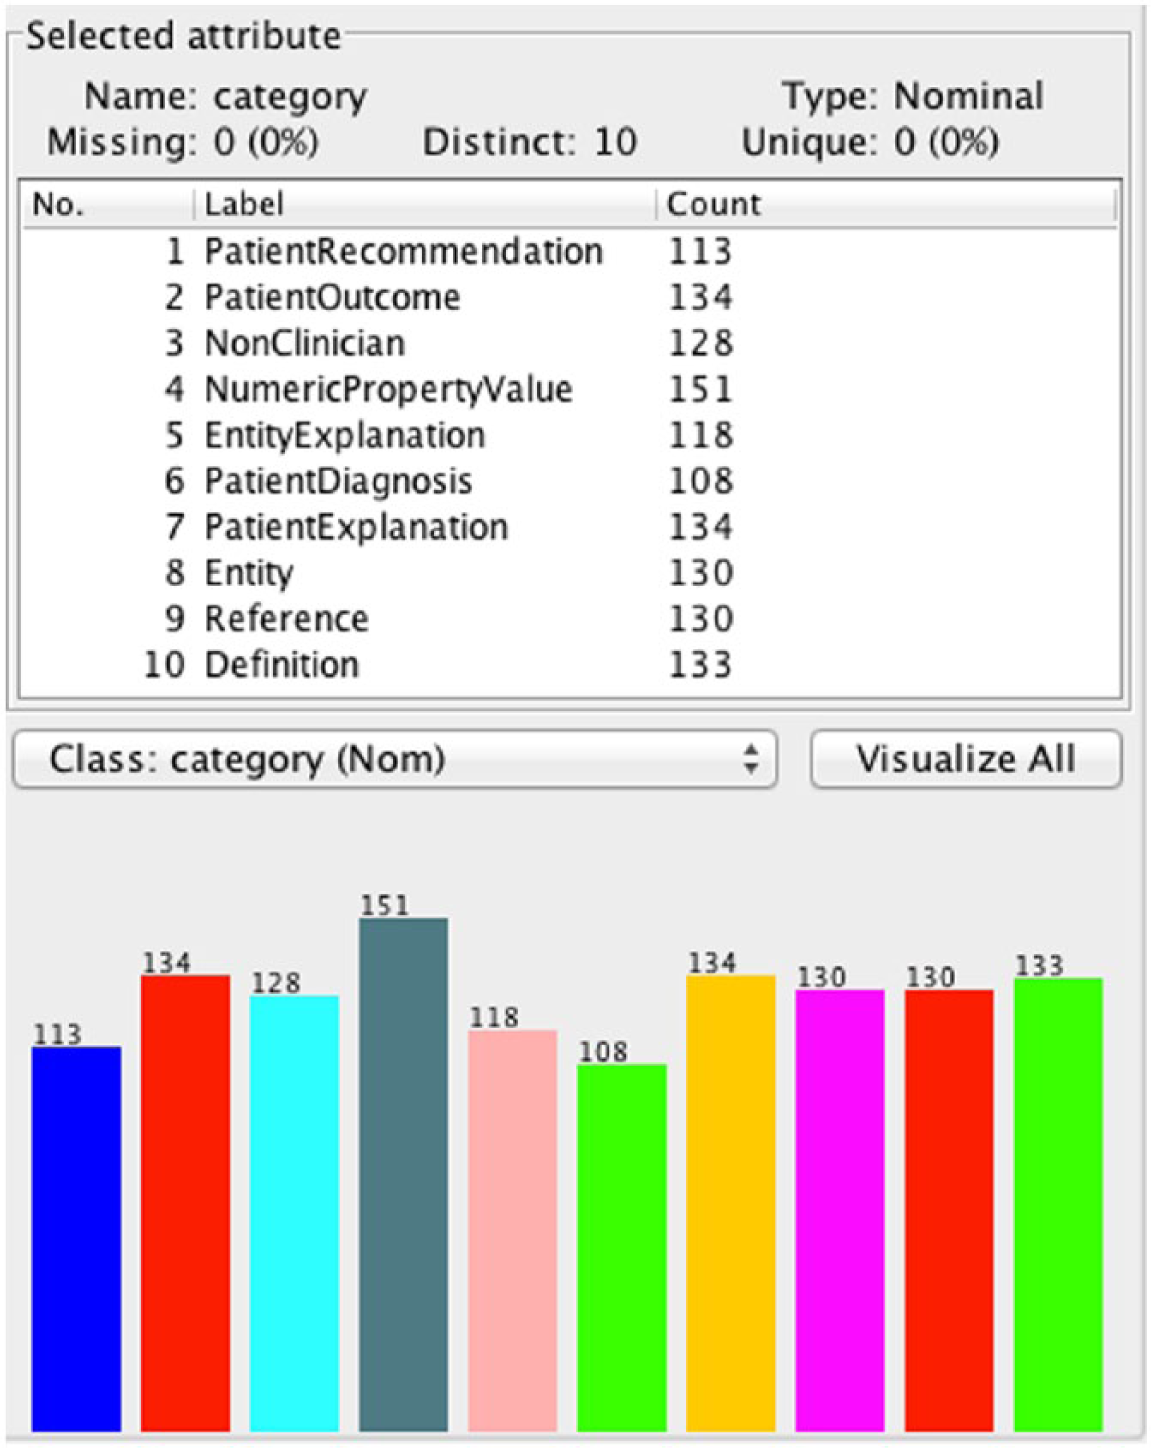
Figures 1 and 2 show the final versions of the Full and Filtered Taxonomies, respectively. The Level 1 Distribution of classes was Factual 44 percent (N = 561), PatientSpecific 48 percent (N = 613), and NonClinician 8 percent (N = 105). The question count for the Level 1 Distribution shows that even with the largest subgroups possible, the corpus is still significantly unbalanced. In the terminal distribution, three categories, PatientRecommendation, EntityExplanation, and PatientExplanation, comprised over 57 percent of the data, while three others, NumericPropertyValue, Reference, and Definition comprised only 8.33 percent of the data. The maximum ratio of questions in the Level 1 Distribution is 5.84, whereas in the Terminal distribution it is 13.23, another indicator of the large degree of imbalance we found. The distribution of classes for the Filtered Taxonomy is shown in Figure 3.
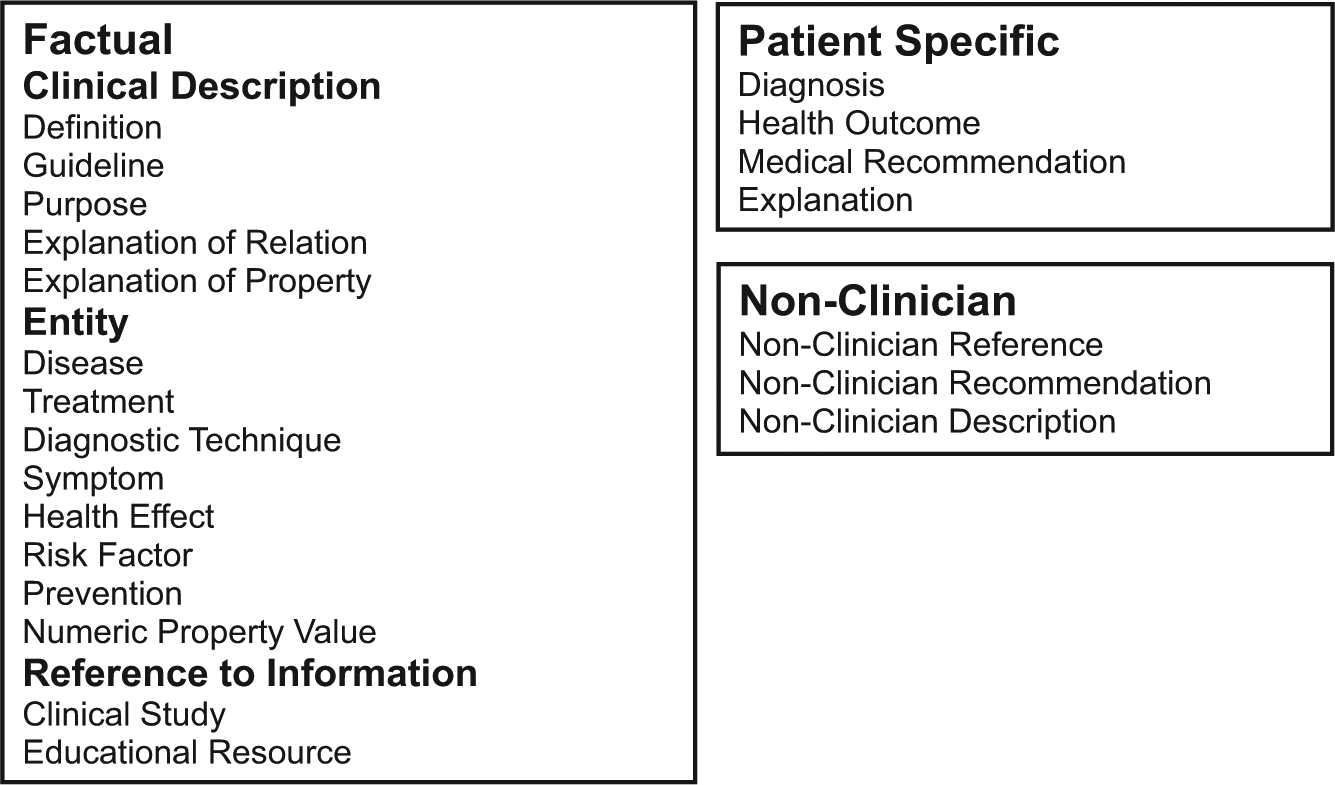
Full Taxonomy.
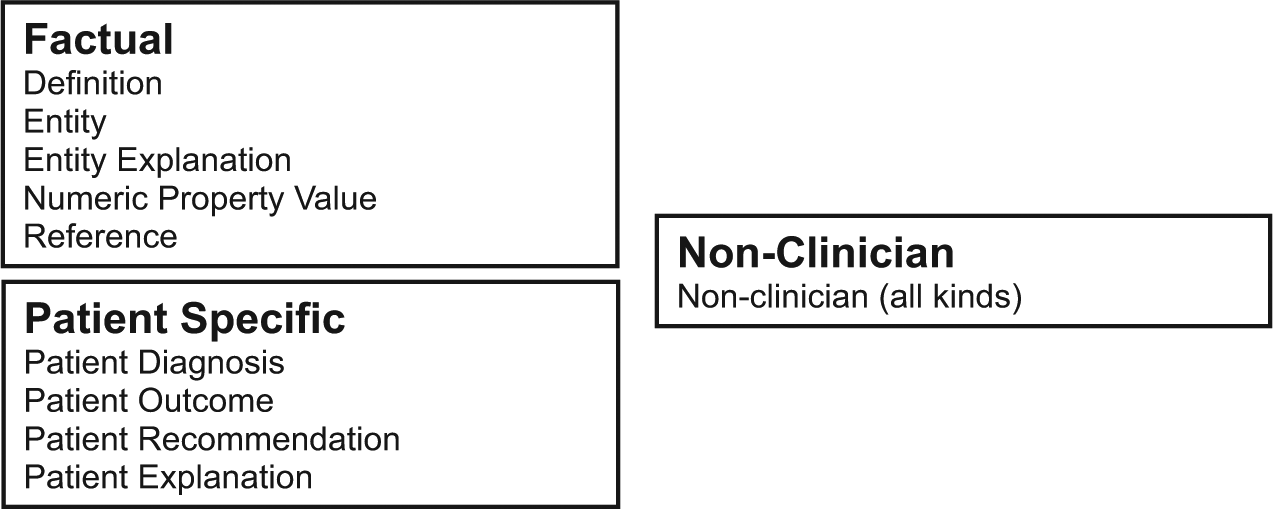
Filtered Taxonomy.
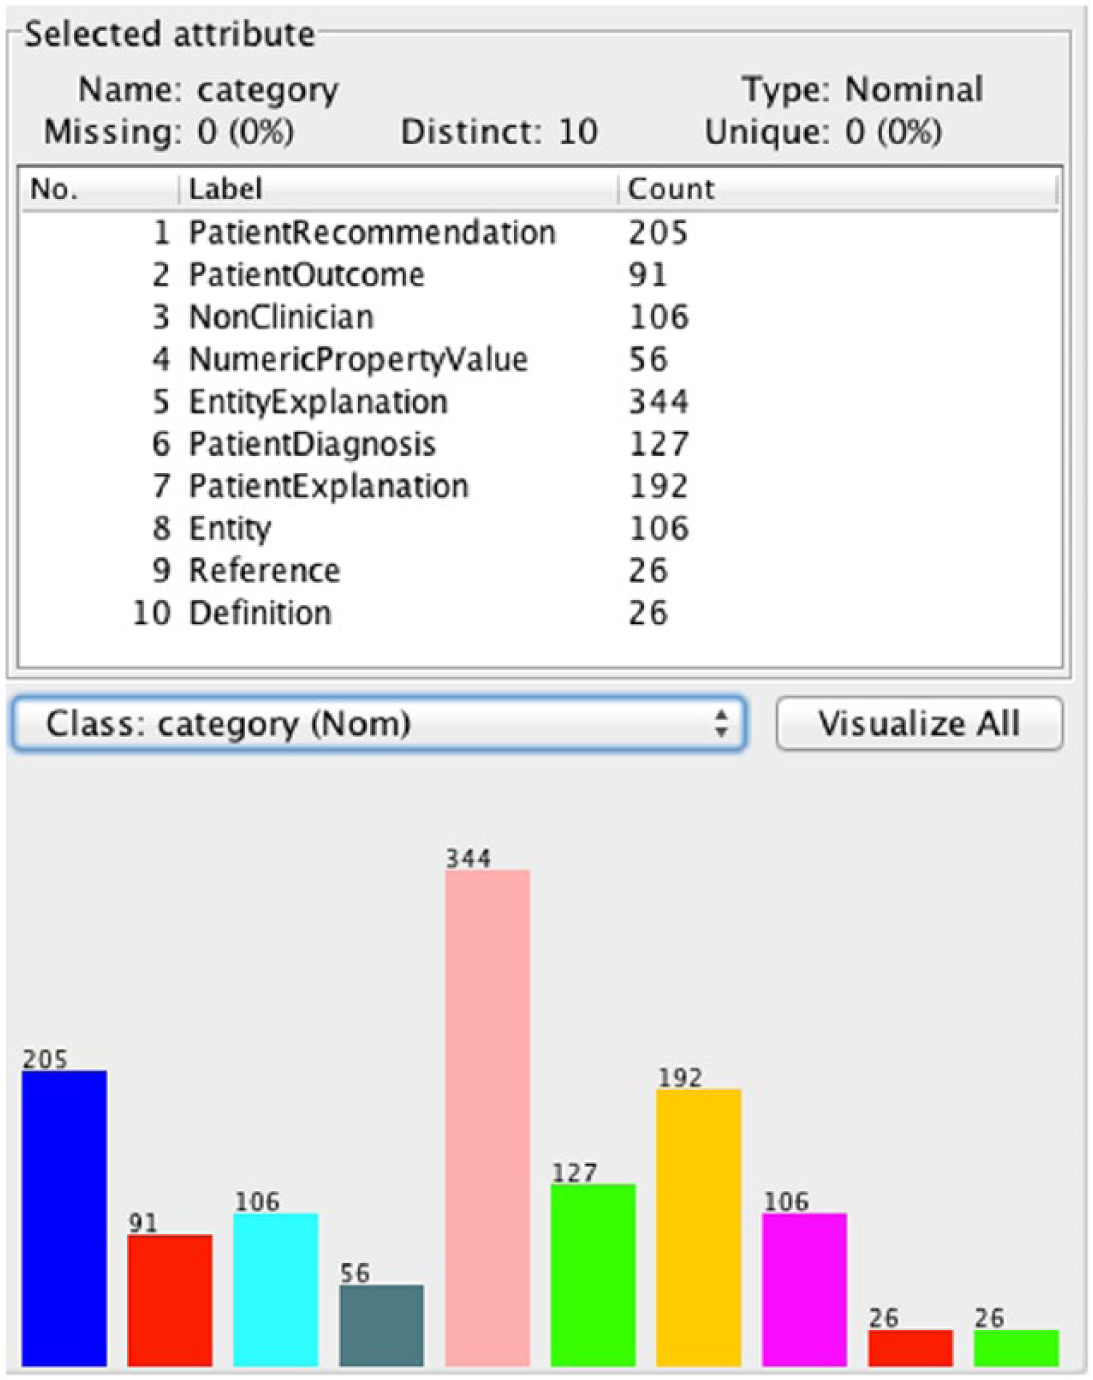
Class distribution in the unbiased Filtered Taxonomy.
Results of testing with the Level 1 Taxonomy
The percentage of correctly classified questions for all configurations of the Level 1 Distribution classifiers is shown in Table 2. The first row, marked U, corresponds to the corpus without any transformations applied. The second row, marked SC, corresponds to the transformed corpus that is obtained by applying the Lucene spell checker alone. Corpora with the threshold transform applied are labeled as Txx, where xx is the threshold percentage for trimming a term from the corpus. Similarly, corpora with the range transform applied are labeled as Rxx, where xx is the maximum percent deviance from the mean that incidence rates can occur in for a term to be trimmed from the corpus.
Classifier accuracy for the Level 1 Distribution.
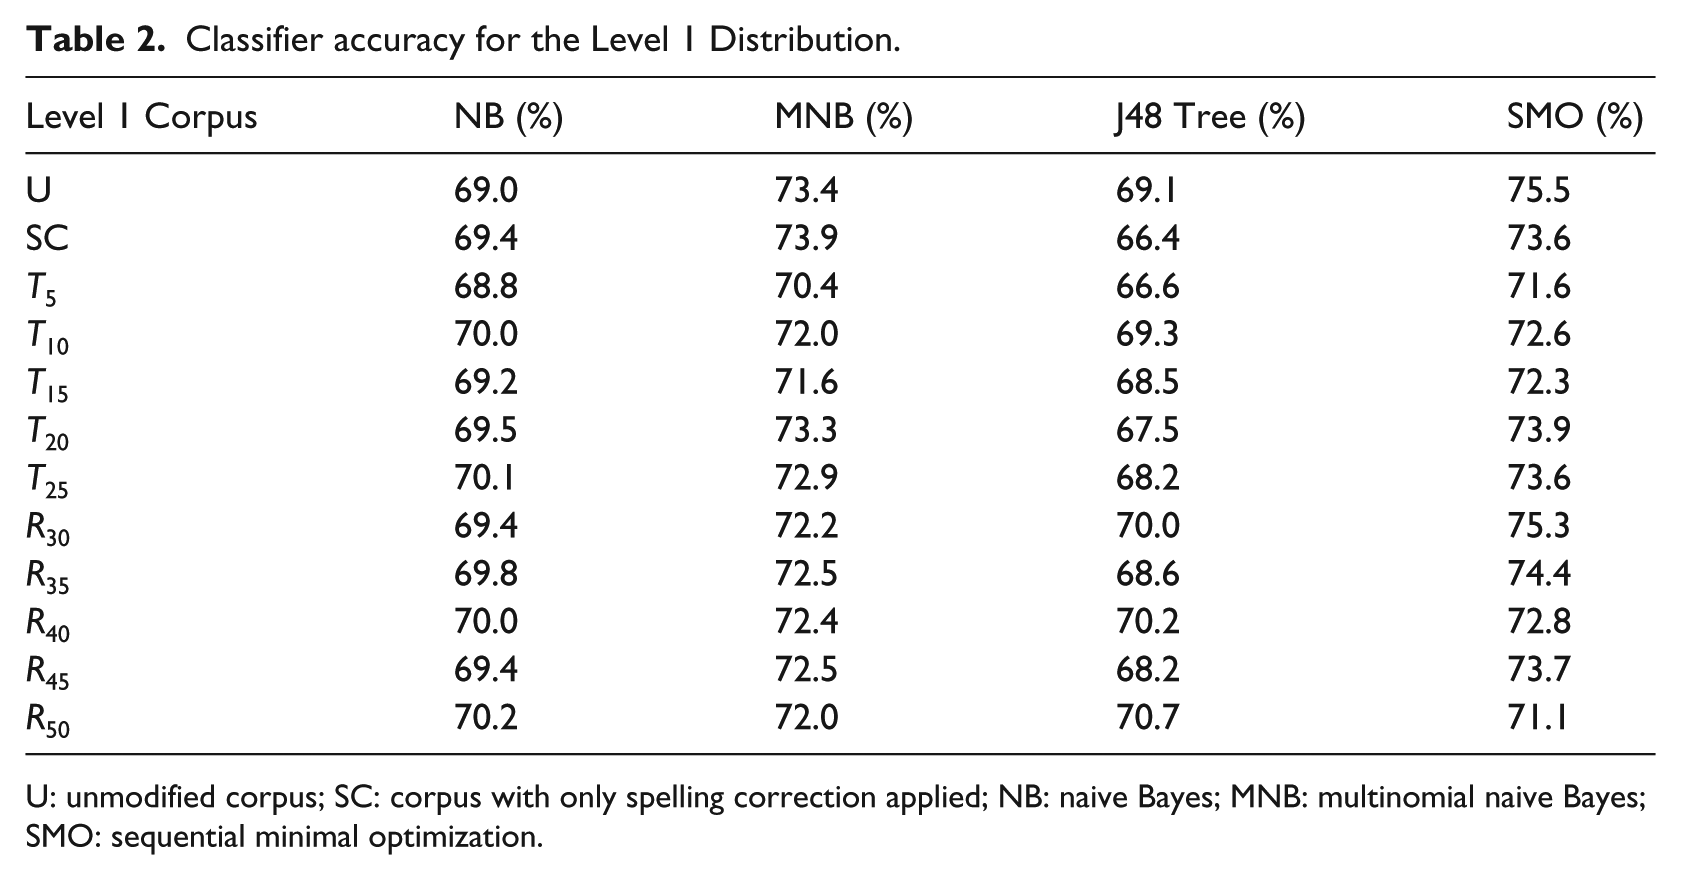
U: unmodified corpus; SC: corpus with only spelling correction applied; NB: naive Bayes; MNB: multinomial naive Bayes; SMO: sequential minimal optimization.
As Table 2 shows, none of the algorithms performs significantly better than the others on our classification task. SMO and mixed-membership naive Bayes (MMNB) slightly outperformed J48 and NB with our corpus. Dimensionality reduction, including spelling correction, term trimming, and feature replacement also had little impact, and upon investigation, was found to have removed very few terms (less than 5%, and often much less).
Results of testing with the Filtered Taxonomy
Accuracy results for dimensionality reduction configurations of the Filtered Taxonomy are shown in Table 3. The comparative results among classifier algorithms are similar to those in the Level 1 Distribution, albeit lower. SMO and MNB outperformed J48 and NB, however, the magnitude of the difference was small. The results of using SMO with feature replacement similarly showed insignificant improvement (F1 = 0.518; receiver operating characteristic (ROC) = 0.825) over the best prior configuration.
Classifier accuracy for Filtered Taxonomy.
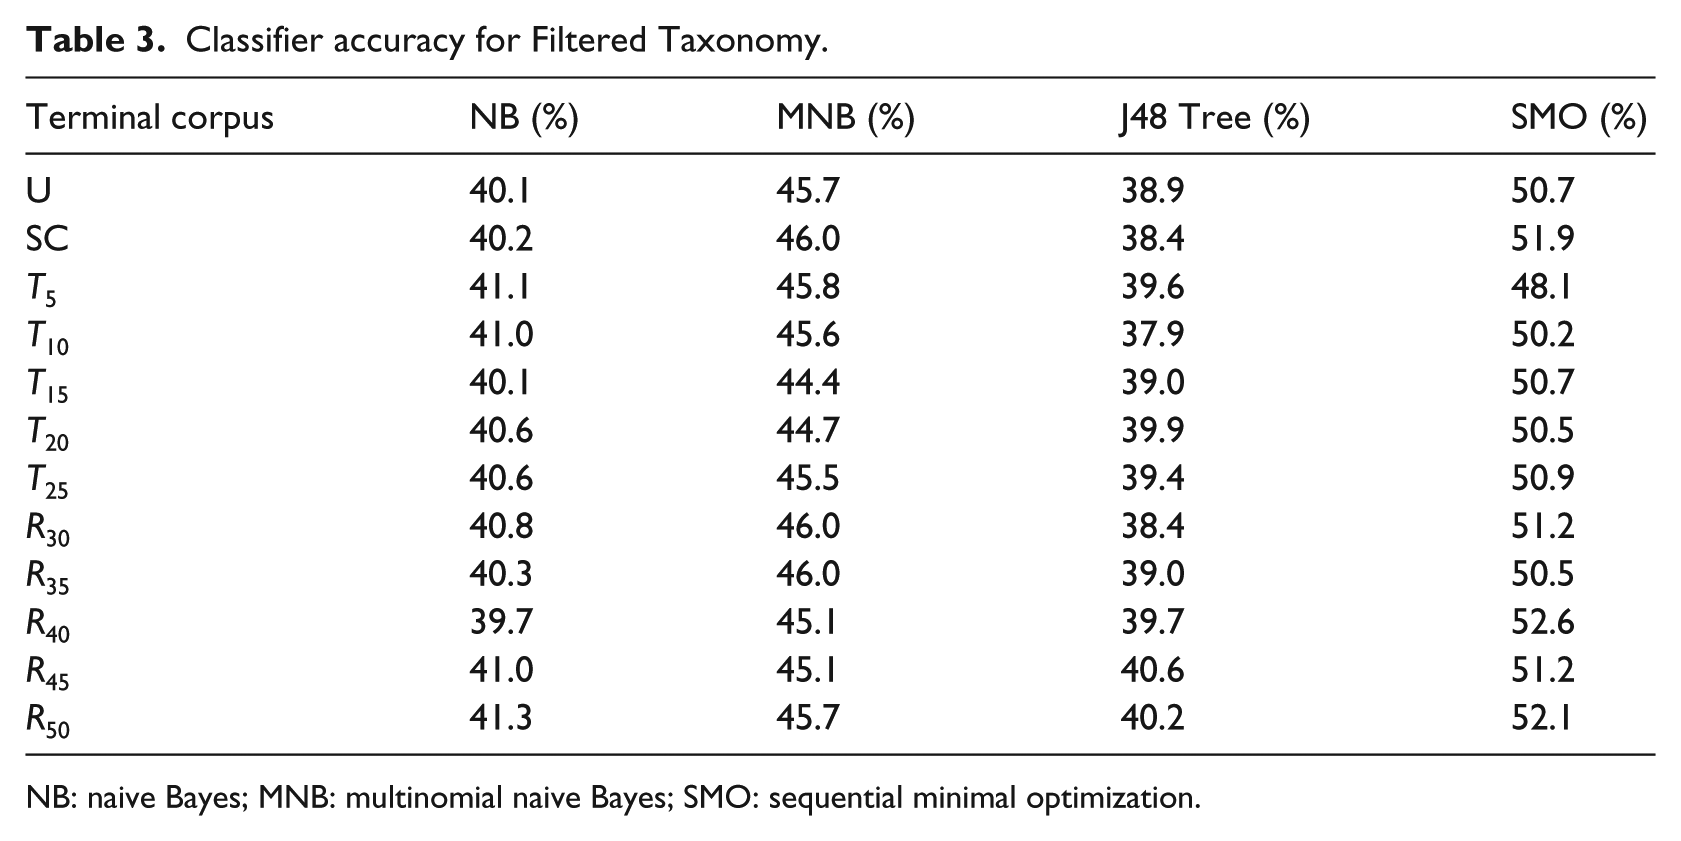
NB: naive Bayes; MNB: multinomial naive Bayes; SMO: sequential minimal optimization.
The results of using a weighted SVM showed some improvement over applying dimensionality reduction techniques. Using only the basic approach (default settings, weights all calculated based on the inverse percentage of a class’s appearance, and multiplication of the result by 100) yielded an F1 score of 0.565 (with ROC only 0.737). Since this improvement still seemed minor, we did not pursue this method further, although there are many ways to tune a weighted SVM.
The results of resampling the data with a bias of 1.0 and using the SMO classifier without other dimensionality reductions led to the best results overall. Figure 4 shows the results on the class distribution after rebalancing. The smoothing greatly improved the effectiveness of the classifier to F1 = 0.846, suggesting that the unbalance of the data was the main cause of the low accuracy. Running the data with a bias of 0.5 and 0.1 yielded similar results (F1 = 0.793 and F1 = 0.789, respectively), indicating that even with relatively little balancing, the results are significantly improved. Repeated resampling of the data further improves the results, to F1 = 0.963 (ROC = 0.985), after 5 applications.
Distribution of classes in Filtered Taxonomy re-sampled with bias = 1.0.
Discussion
Our results with a wide range of basic classifiers appear to be similar to those previously reported for classifiers trained on idealized (artificially created) questions for the open domain.35,46,50 This result suggests that while training a classifier should use a corpus of natural data, improvements to classifiers made on the basis of artificial data are likely to generalize to real data as well. However, because collections of natural questions are not likely to be as balanced as artificial datasets, additional statistical methods may be needed to compensate for the imbalance.
Classifiers trained for the Filtered (terminal) Taxonomy were initially much less accurate than classifiers trained on the Level 1 Distribution. This difference was not surprising given the lower levels of inter-coder agreement and poorer uniformity in the distribution of classes. Imbalance appears to have been the most significant factor however, as repeated statistical rebalancing was effective in improving classifier accuracy.
Prior work on question classification did not seem to consider the possible impact of dimensionality reduction or spelling correction, so we wanted to test them. However, our results suggest that these methods have little impact on question classifier results. We examined these results by hand to learn why they had such a small impact. From our sample of about 1300 items, there were 584 instances where a term was changed by our spelling correction. While term counts changed, however, a closer inspection of the corrected terms revealed that the spelling correction methods used were just as likely to create a new error as to correct one. For example, a user misspelled “chemotherapy” as “quimotherapy,” and it was corrected to “biotherapy.” Search engines make use of soundex algorithms (phonetic matching), which would be useful here as well. Replacing drug names with a general category also seems to have had a detrimental effect, possibly because specific drug names are more common in some categories than others.
We acknowledge the limitations of this work. Our results might be improved by coding more questions. Coding additional questions might have provided a training corpus with a more even distribution of questions; however, it is also possible that the distribution of question types is naturally uneven. Regarding the relevance of the training corpus for supporting interactive QA, although we selected questions submitted to websites that are similar in length to those that might be used in a QA dialog, most of the questions we found were embedded in longer narratives from which we manually extracted the questions. The degree to which these questions resemble questions sent in a more interactive modality (such as SMS) is still under investigation. In a related study, we examined the questions participants asked using text messages to be answered by a clinician. 21 These questions were found to be very similar to the cQA questions in our corpus in grammar and lexical choice. Additional questions might also be obtained from social media sites with length limits, such as Twitter.
Conclusion
We have developed a new cancer question corpus and EAT Taxonomy, as well as some tools for doing manual classification. The data confirm that people have a wide range of questions, but there may be a natural imbalance in the types of questions that they ask, creating challenges for training a classifier. With the application of methods to address imbalance in the distribution of question types, however, we found that statistical classification methods can be effective, especially for the task of discriminating between Factual and PatientSpecific questions. Hence, these methods could be used to develop an effective automated QA system or to create a system that filters Factual questions and refers the remainder to a person for an appropriate response.
Footnotes
Acknowledgements
The authors thank our colleagues at University of Wisconsin–Milwaukee who have read earlier versions of this work, including Dr Rashmi Prasad and Dr Jun Zhang. The authors thank Majid Rastegar-Mojarad, for his suggestions to look at weighted SVMs and resampling and his help in using Weka. The authors also thank Zong Xiong and Zahrah Dillard for their assistance.
Declaration of conflicting interests
The author(s) declared no potential conflicts of interest with respect to the research, authorship, and/or publication of this article.
Funding
The author(s) received no financial support for the research, authorship, and/or publication of this article.