
Abstract
This article presents a research work, the goal of which was to achieve a model for the evaluation of data quality in institutional websites of health units in a broad and balanced way. We have carried out a literature review of the available approaches for the evaluation of website content quality, in order to identify the most recurrent dimensions and attributes, and we have also carried out a Delphi method process with experts in order to reach an adequate set of attributes and their respective weights for the measurement of content quality. The results obtained revealed a high level of consensus among the experts who participated in the Delphi process. In addition, the different statistical analysis and techniques implemented are robust and attach confidence to our results and consequent model obtained.
Introduction
Websites are the face of organizations and, generally speaking, they provide the first interaction between the organization and its users.1,2 It is therefore necessary to know and explore the needs of website users to promote the development and the improvement of health institutions.
The Web is a great source of information, owing to its interactivity, ease of use and low cost accessibility. However, among other issues, the contents that are made available may be unreliable and may compromise decision-making processes. The fact that any individual can publish information on the Web without being subject to any control is one of the main factors behind the poor quality of disseminated contents;3,4 any Web user can publish content without complying with norms or rules, which makes it harder for website users to validate the quality of information.5,6
Faced with this problem and aware of the limited investigation carried out in this field,2,7,8 we decided to check for the existence of a model that would allow us to measure the data quality of institutional websites for health units. 9
We thus initiated a bibliographical review which allowed us to conclude that website quality is indeed strategically important for organizations and client satisfaction, and quality can be measured if its three main dimensions are considered as a whole: content, services and technique. This is a groundbreaking perspective, and any approach based on these three dimensions can offer an in-depth, cross-sectional, integrated and detailed quality measurement of a website. 8
Additionally, this bibliographical review allowed us to identify the existence of several investigations works published in the field of website quality, mainly focused on the technical dimension and often based on the software quality norm ISO/IEC 9126-1:2001 10 and, more recently, on its successor ISO/IEC 25010:2011. 11 As to software data/content quality, only recently did the norm ISO/IEC 25012:2008 12 emerge. So far, to our knowledge, there is no quality norm specifically focused on electronic services provided through websites.
According to Ruževičius and Gedminaitė, 13 different circumstances can dictate the choices made by users. Their experience, their knowledge and the moment can influence them to value certain attributes to a greater or lesser extent. 14 Thus, when measuring the data quality of websites, it is also important to consider the field of activity and the profile of the user.
Therefore, in this article, we present the results of an investigation whose main goal was to propose an evaluation model for data quality in health unit websites, from the perspective of the user.
The rest of this article is organized as follows: The ‘Data quality’ section discusses the problem and implications of data quality absence in website content. The ‘Research methodology’ section presents the research approach followed in order to achieve the proposed goals. Outline of the ‘Available approaches’ section synthesizes the categories and respective attributes for the measurement of data quality from approaches selected according to predefined criteria. Results from the ‘Application of the Delphi method’ section present and discuss the results for the website data quality measurement model derived from the application of the Delphi method. Finally, the ‘Conclusion’ section concludes the article and suggests some directions for future work.
Data quality
It is essential for users to know that they are reading credible information. Ruževičius and Gedminaitė 13 state that the adoption of sensible and accurate decisions by companies, institutions and organizations is dependent on their access to quality information.
Silva and Castro 4 mention that some users may evaluate the credibility of a page based solely on its aesthetics and neglecting, for instance, the authorship of the contents, which can result in bad decisions.
Users prefer electronic resources that are/provide:15,16 easy to use; accessible at any time without having to leave the house; quick access to information; a greater level of sharing and cooperation; autonomy; the choice of printing at home; and the choice of sending the information via email.
Internationally, several initiatives have emerged with the purpose of evaluating Internet use and developing the means to select information. Research published on the website of the Health on the Net Foundation (HON) revealed that the accuracy of content is the item that raises most concern among health care professionals and patients who use the Web. Moreover, research carried out by HON 17 showed that 55 per cent of patients believe that health care-related websites should have an accreditation seal.
The accelerated increase in websites in the health field raises the problem of guaranteeing and measuring the quality of the contents that are offered. 18 Considering this need to create norms that can guide the creation of webpages, HON has created a Code of Conduct, the HONcode. Those who follow the norms can display the HONcode accreditation seal in their websites. For the user, this serves as a guarantee that the information they are accessing is scientifically approved.
Moreover, people feel the need to be informed on every level. Health issues, among others, lead them to research information concerning a particular disease, from mere curiosity to real diagnoses.19,20 The Internet is, in our day and age, one of the most accessible vehicles of information, and people who research this information are unaware of the risks they are exposed to. The Internet allows for the publication of any health-related content without any previous validation of information. The absence of a regulating entity that controls health-related contents published on the Internet renders all information published on websites, often by people who lack proper training in the field, accessible to those who seek it. The existence of a relevant accreditation seal for health-related websites would make people feel safer and more trustful of the information they obtain via the Internet. 19
Data quality measurements resort mainly to models and methodologies based on questionnaires (and almost invariably using the Likert-type scale), where respondents (users, linguists and experts in website contents) assess the quality of contents. In the data quality dimension, a number of investigation efforts stand out, namely, Wang and Strong, 21 Bernstam et al., 22 Hargrave et al., 23 Parker et al., 6 Caro et al. 24 and Moraga et al. 25
Before Wang and Strong 21 started working in this field, the only attribute considered in the data evaluation process was ‘Accuracy’. Nowadays, the website data quality evaluation process includes several dimensions with several associated attributes.
The definition of attribute adopted in this investigation follows the ISO/IEC 25012 norm: ‘Inherent property or characteristic of an entity that can be distinguished quantitatively or qualitatively by human or automated means’. 12
Our bibliographical review revealed that some researchers adopt the concept of category to designate dimensions.
Research methodology
First, there was a need to identify, from the literature review, the group of models which could be used or adapted to evaluate and compare the quality of website content of health units, in a comprehensive and balanced way.
The available literature puts forth several models that allow for the evaluation and comparison of website content, but none proved suitable to evaluate, in a comprehensive and balanced way, the quality of content in health-unit-related websites. The main gap in these was the absence of the weight attached to each attribute, something that no other author used when defining his model.
As to the main goal driving this investigation work, it was achieved to the extent that it was possible to create a list of categories and respective attributes, as well as to define the weight of each attribute, with a view to develop a content quality model for health unit websites. Accordingly, we reached a subjective measure that represents the quality of a quantitative objective measure, through the identification and classification of relevant attributes, thus obtaining an encompassing evaluation model that is able to rate each website based on the individual evaluation of each attribute.
The methodology we used to develop this investigation relied primarily on the adoption of quantitative methods, namely, the analysis of the results obtained with the Delphi authentication method. Bearing in mind the goals of this study, this was the method we chose to carry out the research, perceiving it to be the best process, which allowed us to adjust our path according to the results that were progressively obtained.
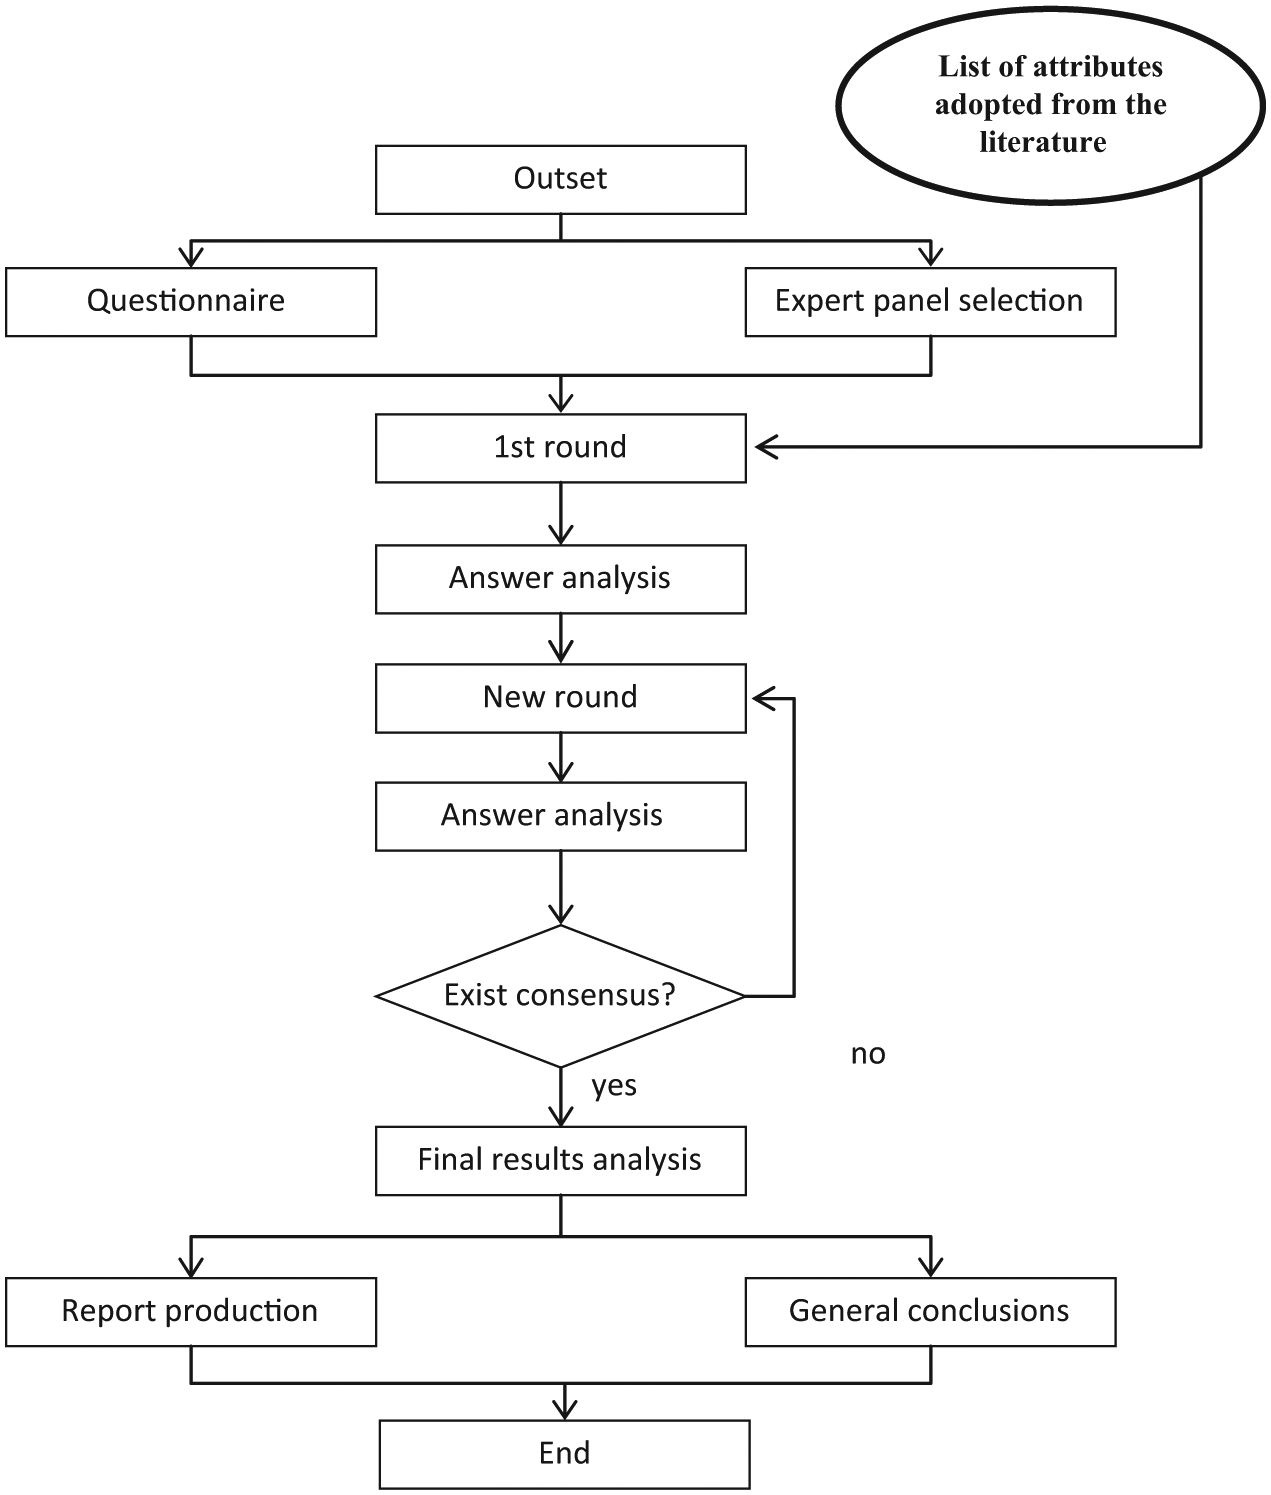
The Delphi method is structured in a sequential set of rounds (which guarantees its interactivity) where a questionnaire is administered to a previously selected group of experts. The answers in each round are analysed and serve as a basis for the questionnaire of the subsequent round. The process is repeated until the maximum level of consensus between the expert panel elements is achieved in the round. The interactive process comes to an end in the round where the agreement of the answers reaches a pre-established value.
In the original Delphi format, the first round has an unstructured nature, starting with the placement of a set of open questions, which enables us to explore the subject under study. 22 The members of the panel are allowed to answer freely and express their opinions and perceptions surrounding the addressed subjects. However, this process may give way to an excessively high number of items considered in the study or bias its purpose and render the questionnaire of the following rounds too long. 26 One way of controlling this risk is to open the first round with a predefined list of items. 27
The Delphi method, because of its characteristics, suited the pursuit of the goals established in this project, allowing us to define the relative weight of each attribute (the main purpose behind the implementation of this method) and, simultaneously, validate what we found in the available literature as to the categories that characterize the quality of website content in the health field, and the attributes that compose each of these categories.
To set the Delphi process in motion, we had to select the experts who would form the panel, mandatory for the development of this study. We opted for a convenience sample, ensuring that the panel comprised individuals with experience and scientific knowledge in the area under study. Accordingly, we defined a panel composed of 30 individuals, including health professionals (8), academics researching this area (12) and university students working as interns in health units, in the technological field (10).
The purpose of this study was briefly disclosed to the individuals who comprised the panel. The Delphi method was also succinctly explained to them, as well as the reason behind the administration of the questionnaire in this context. The anonymity of the members of the panel was guaranteed, as well as the confidentiality of their answers.
The respondents were asked their views on the significance of each attribute and whether they should be placed in a different category. It was stressed that despite being linked to a category, the relevancy of the attributes should be scored regardless of their category. What was intended in this stage was to obtain the significance of each attribute and not their significance inside each category. An open question allowed the introduction of new attributes in the list (the elimination of attributes followed the results of the evaluation), and thus, we were able to validate the attributes collected from the available literature.
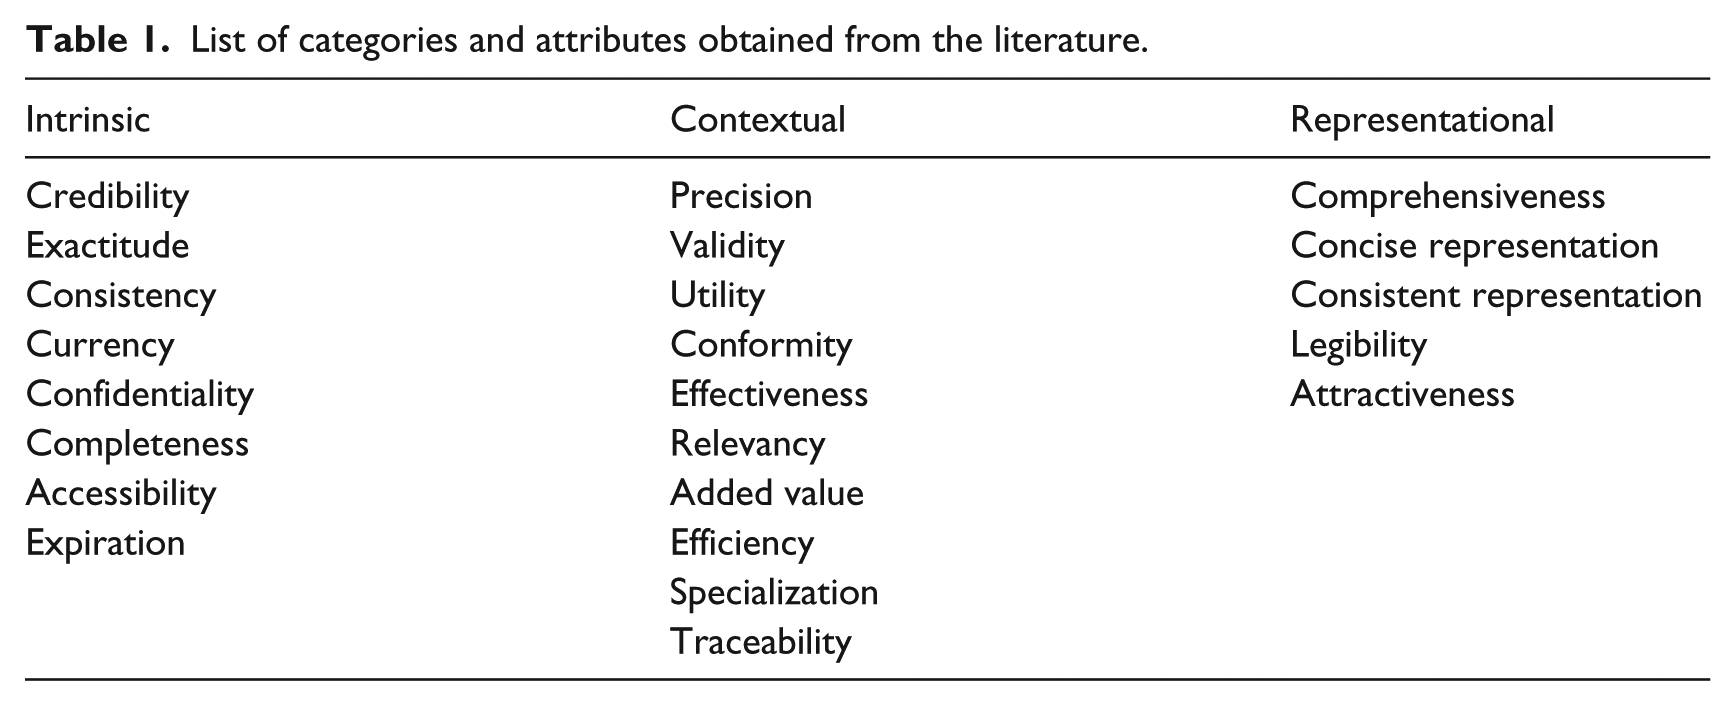
For the first round of the method, which took place between September and November 2012, we started with a predefined list of categories and attributes, obtained and selected from the available literature (see Table 1). This way we were able to avoid a randomly large set of items in the outset of the process.
List of categories and attributes obtained from the literature.
The questionnaire was administered in paper format. The definition of a criterion to include and exclude items constitutes an important step of the Delphi method. A poorly selected group of items may require an excessive number of rounds to reach a solution. In this study, we resorted to the average and to the variation coefficient as the indicators that would be analysed to include (or exclude) categories and attributes. It was established that an attribute would be eliminated from the list when its average value fell below 3 (the mid-point of the scale) or its variation coefficient surpassed 33 per cent (using as a reference 1 as the standard deviation and 3 as the average). It is important to stress that a high variation coefficient indicates lack of consistency in the evaluation of the attribute, and a high level of dispersion removes the credibility of the average as a measure.
We determined the significance of each attribute in the following way:
First round – average of scores assigned by the experts.
Second and third rounds – average of scores pertaining to the relevancy order assigned by the experts.
This change in the format was owed to the fact that in the first round, we intended to create a basis to organize attributes according to relevance (something that did not exist) in order to simplify the process in the following rounds, where the respondents were only asked whether they agreed or disagreed with the relative position of the attribute.
The criterion used to stop the method is equally relevant in the process. On the one hand, it must ensure that the obtained result is representative, whereas on the other hand, it must allow us to reach a solution. The relative frequency of the answers was the adopted indicator, and it was established that 90 per cent of consensual answers would determine the end of the process.
In each round, we carried out an answer frequency analysis, followed by an exploratory analysis whose purpose was to understand the opinions of the panel and the variability of the answers, and particularly to verify whether this variability was connected with the professional activity of each panel member. From the results of these analyses, we prepared a summary that was handed to the members of the panel for them to apprise.
Moreover, the results served as a basis for the creation of a new questionnaire, where the suggestions offered by the expert group were included in accordance with the goals of our study, and which served as a basis for the second round.
Figure 1 illustrates the group of activities developed in the context of this study.
List of categories and attributes obtained from the literature.
Following the previously established rules, when the level of agreement was considered satisfactory, the process came to its end and the preparation of a detailed report followed. This report served as a basis for the construction of the intended measuring tool.
Outline of the available approaches
In this section, we identify from the scientific literature found in relevant databases such as ACM, Elsevier, IEEE, ISO, Taylor & Francis and Wiley, the most relevant approaches in the field. The approaches were searched based on keywords such as ‘web site content quality’, ‘web site data quality’, ‘content quality’ and ‘data quality’ and were selected according to the following criteria:
Having been mentioned in other investigations;
Having a sufficiently encompassing data quality dimension;
Offering a measurement method and/or instrument.
After analysing and studying the selected approaches, based on their origin, goals, the processes followed to reach the model, dimensions and attributes, and the evaluation/validation process, we came to the conclusion that many of the reviewed authors adopted as a starting point the approach proposed by Wang and Strong. 21 Wang and Strong were the pioneers in the evolution of data quality measurement of Web content from the perspective of the user. Subsequently, other authors, namely, Cappiello et al., 28 Caro et al., 29 Parker et al., 6 Ruževičius and Gedminaitė, 13 Calero et al. 18 and Moraga et al., 25 have developed their work based on the theory proposed by Wang and Strong. 21
In the course of this research, we organized a table featuring the authors and the attributes they proposed, in a total of 48 quality attributes for websites, as seen in Table 1.
In this table, we did not differentiate the attributes according to dimension or category, our intention was to have a global perspective of the relationship between the attributes and the authors who mentioned them.
After studying Table 2, we concluded that the attributes that were most frequently mentioned were as follows:
Nine times – credibility, consistent representation and comprehensiveness;
Eight times – accuracy and accessibility;
Seven times – security;
Six times – objectivity, reputation, concise representation, suitable content quantity, relevancy and currency;
Five times – interpretability and value added;
Four times – fullness and ease of operation;
Three times – opportunity, availability, efficiency, completeness and compliance with specifications.
Condensed list of attributes from different approaches.
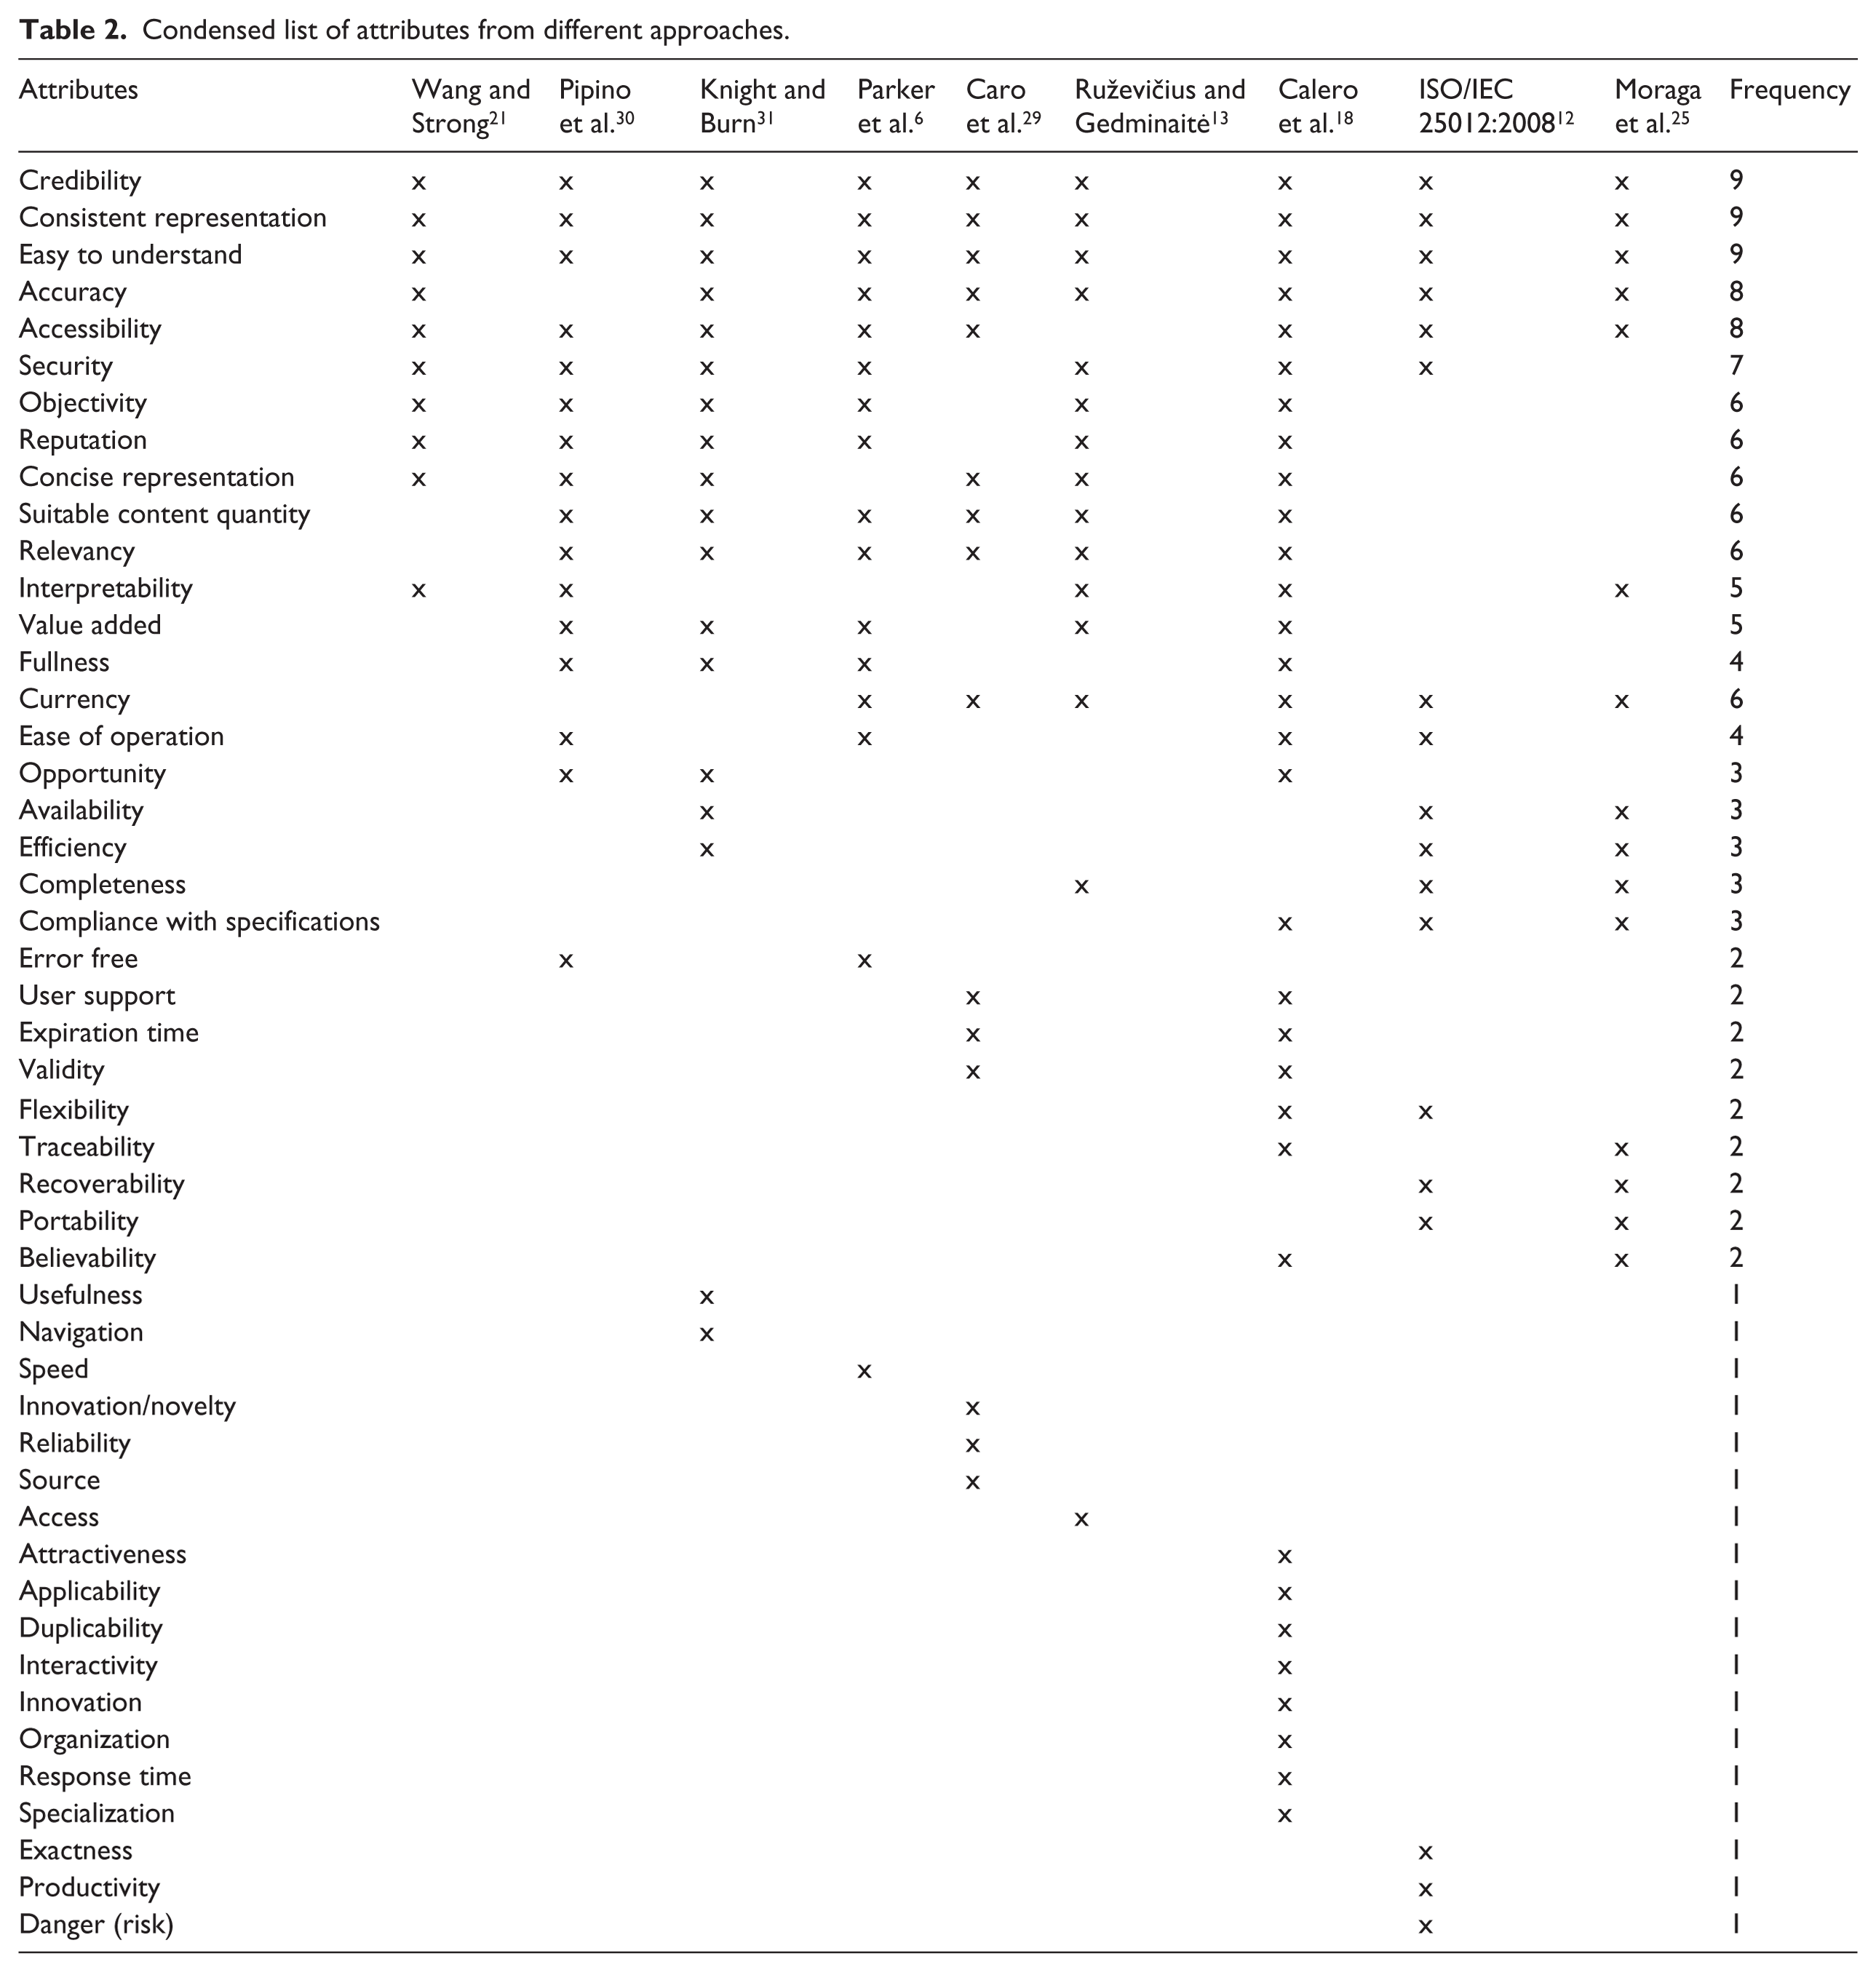
We analysed the meaning of each attribute in this 48-item list and defined 23 attributes with different meanings.
Results from the application of the Delphi method
In the first round, the questionnaire included a list of categories and respective attributes, adopted from the literature review. The respondents were asked about the relevance of each attribute and whether it should change categories. In this round, the inclusion of an open question allowed for the introduction of new elements in the list. We obtained the participation of 25 members of the expert panel.
We used two indicators to evaluate the significance of the attributes, the average and the variation coefficient of the scores ascribed by the panel members. These indicators were also decisive elements in the elimination of attributes. Attributes whose average fell below 3 (the mid-point of the scale) or whose variation coefficient was above 33 per cent (using as a reference 1 for standard deviation and 3 for average) were eliminated. Concerning the average, we established that an attribute that did not reach the average value was not significant enough for the construction of the measure; as to the variation coefficient, we believe that it would bias the measure.
As to the agreement criterion, we decided that the process would end when the level of consensus surpassed 90 per cent. For the second round, we used the attributes that were not eliminated, along with attributes suggested in answer to the open question. In the case of ‘Expiration’, given the lack of consensus as to the category in which it should be included, we opted for the category that was mentioned by the majority, the ‘Intrinsic’ category.
The organized results (Table 3) reveal that only the attribute ‘Confidentiality’ fails to comply with the established requirements (variation coefficient of 34.4%), which meant its exclusion from the second round.
Average, standard deviation and variation coefficient of each attribute.
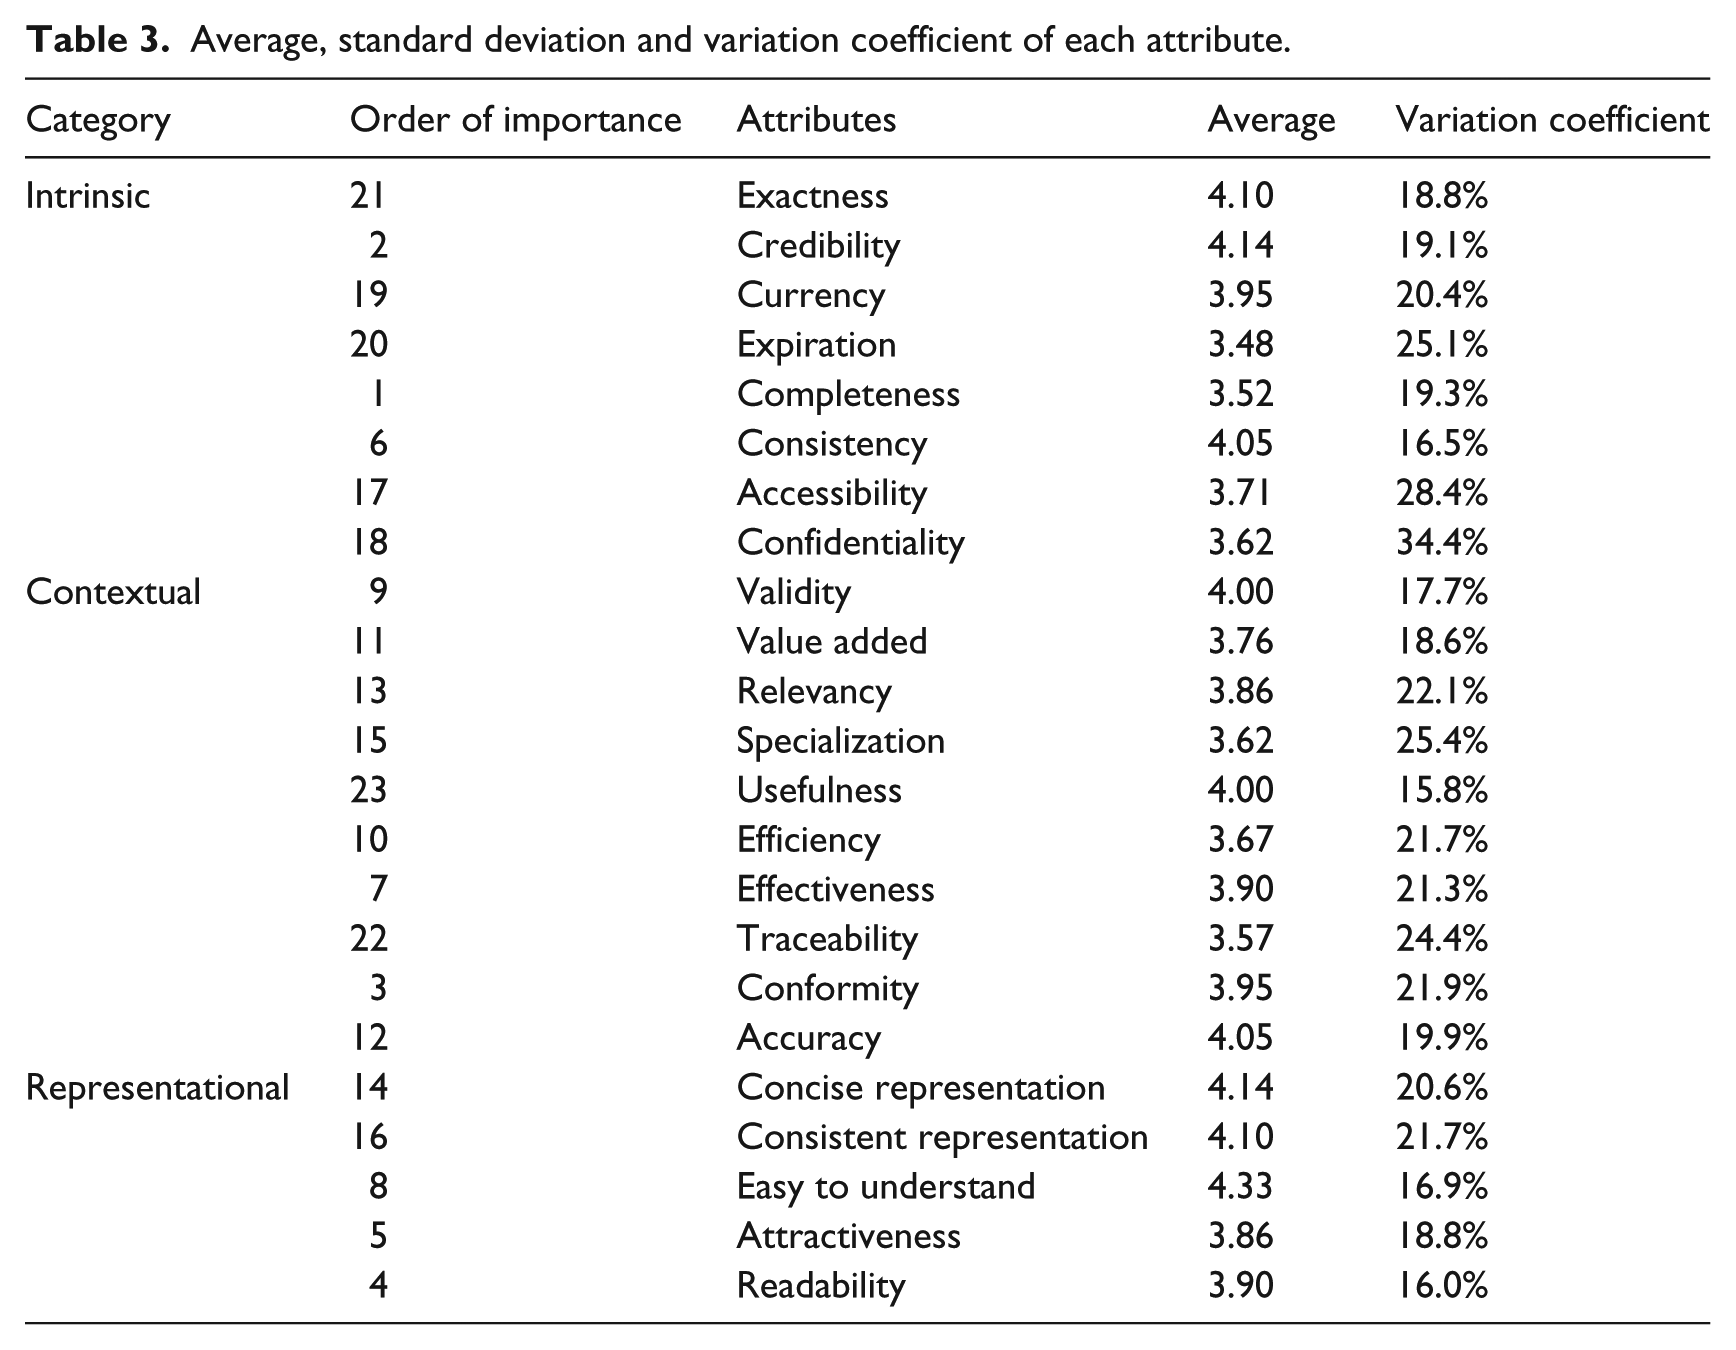
From the analysis of this table, a number of indicators that must be considered stand out. First, the fact that the three bottom positions are occupied by attributes forms the ‘Intrinsic’ category, but this category also includes three of the six that were considered the most relevant. On the other hand, the attributes included in the ‘Representational’ category are considered the most important, with three of its five attributes occupying the top four positions (first, third and fourth). A possible explanation for this was offered by the respondents, who mentioned that some of the attributes lacked a clear definition, namely, ‘Expiration’, ‘Confidentiality’ and ‘Attractiveness’.
To compare the relevancy of categories, we added up the order of the attributes comprising each category, defining its individual significance. The results are 37.5 per cent, 48.85 per cent and 75.56 per cent for the ‘Intrinsic’, ‘Contextual’ and ‘Representational’ categories, respectively.
When asked about the possibility of including attributes that had not been considered in these categories, only one was suggested: ‘Easy to use’. We therefore included this attribute in the ‘Intrinsic’ category, occupying the bottom position. As to the placement of attributes in categories, some of the respondents suggested switching them between categories; however, since the suggestions proposed for each attribute never involved more than one member, switching was not considered.
To understand whether the attributes were independent, we checked for the existence of relationships between them, and we estimated the Spearman correlation coefficient (the most frequently used in ordinal scales 32 which allowed us to identify a strong correlation (r = 0.800) between the attributes ‘Efficiency’ and ‘Effectiveness’, as well as between the attributes ‘Expiration’ and ‘Value added’ (r = 0.739) and ‘Relevancy’ and ‘Expiration’ (r = 0.732)). It is important to note that in the first two cases, the attributes belong to the same category, but in the third case they come from different categories. This situation suggests that these attributes were not perceived by the respondents as having different meanings or that their meaning was not understood.
These results serve as a solid indicator for the distinction of meanings between attributes, that is, the respondents were capable of understanding the different measures provided by each attribute. However, the questionnaire that was considered in the second round allowed us to further clarify the definition of the attributes that revealed a strong correlation.
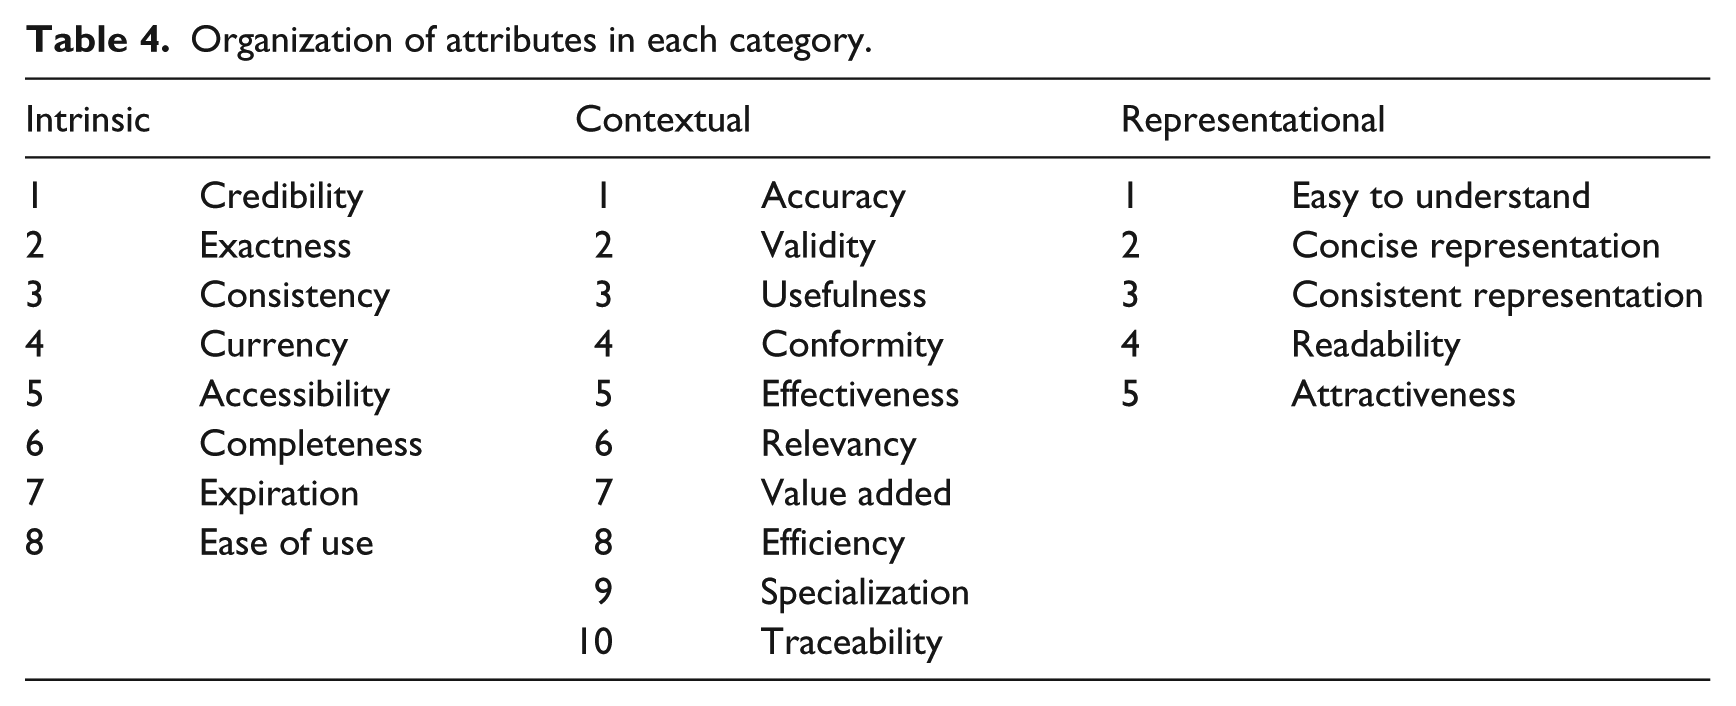
Subsequently, the attributes were placed inside the respective categories in descending order of importance, with the inclusion of the attribute suggested by the respondents (Table 4).
Organization of attributes in each category.
In the second round, and based on the results obtained in the first round, we asked the panel to express their opinion as to
The order of the attributes in each category;
The permanence of attributes in each category.
We also estimated the weight of each attribute according to its order. Table 5 shows the percentage of agreement between the 25 experts/participants as to the order of the attributes and their permanence in the list, as well as to their relative weight.
Percentage of agreement between the experts.
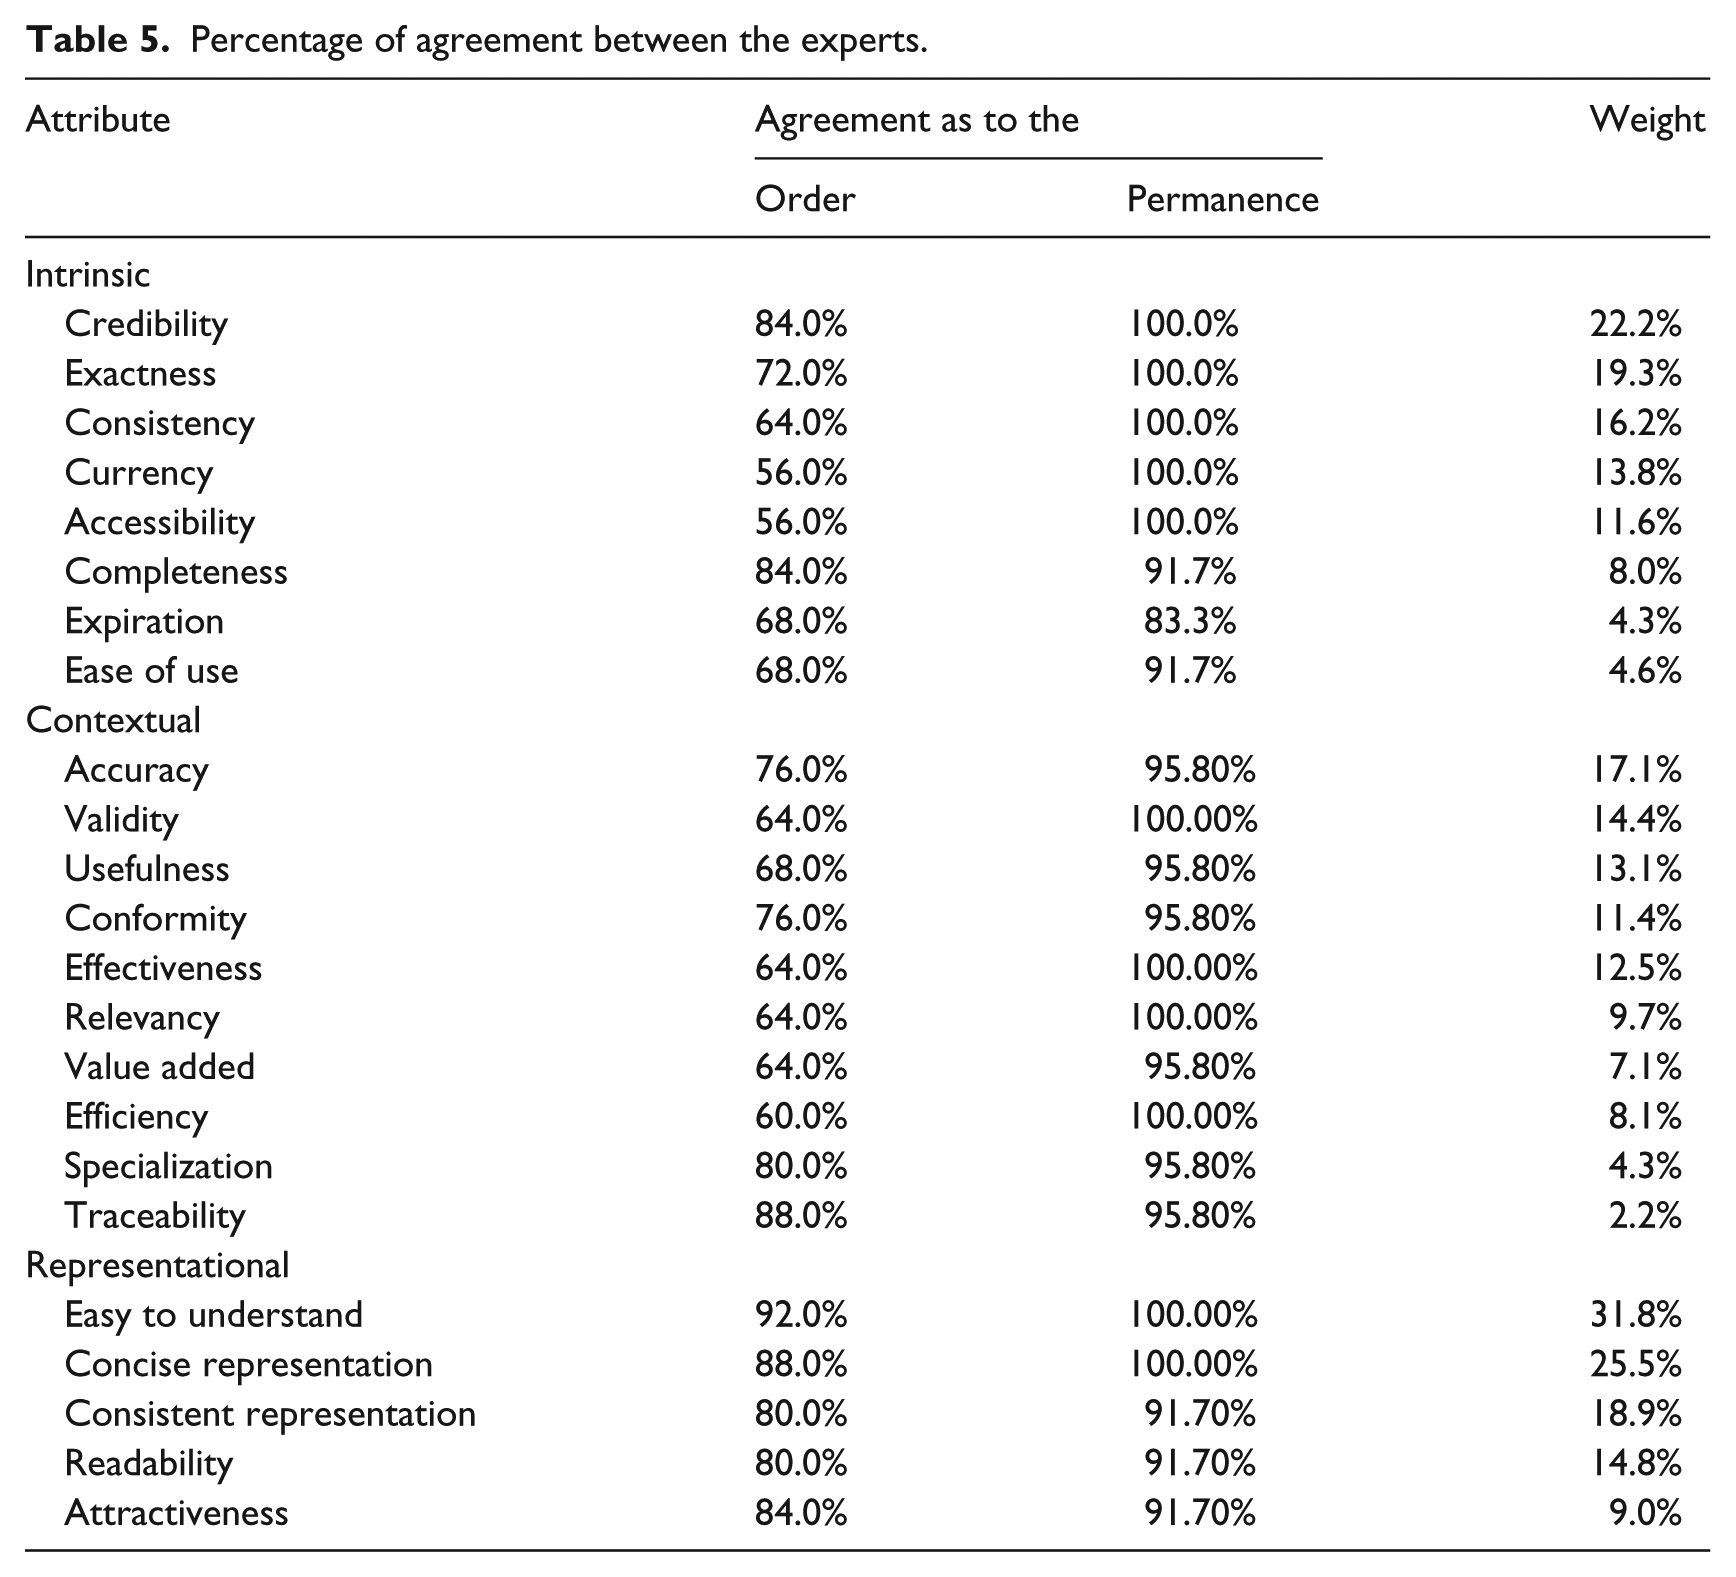
The attributes ‘Currency’ and ‘Accessibility’, in the ‘Intrinsic’ category, emerge as the least consensual in terms of relevance; however, the agreement as to their permanence in the list is complete. In this sense, the attributes ‘Completeness’, ‘Expiration’ and ‘Ease of use’ are not approved by all panel members, although the consensus remains high. The attribute ‘Expiration’ is the only one that does not reach a 90 per cent level of consensus when it comes to permanence, and besides, 33.3 per cent of the participants who agreed with its permanence place it in the bottom of the list. Bearing in mind that this attribute showed a strong correlation with the attribute ‘Relevancy’, which belongs to a different category, and did not gather agreement as to the category it should be included in, it must be removed from the list. In the ‘Contextual’ category, the attribute ‘Efficiency’ collects the smallest percentage of agreement as to its order but the consensus is absolute as to its permanence. As to the remaining elements in this category, consensus concerning the permanence of attributes is extremely high, ranging from 95.8 to 100 per cent. In the ‘Representational’ category, we observe a high level of agreement in all attributes as to their permanence, and as to the order, this is the category that gathers the highest level of consensus all three. Notwithstanding, as to the order, only the attribute ‘Easy to understand’ complies with the requirements defined for the level of consensus, being the only attribute in this situation.
In short, by the end of the second round, we observed that in what concerned the permanence of attributes, the level of consensus was good and allowed us to determine which attributes belonged in which category; however, when confronted with the order they should be placed in, the agreement did not comply with the requirements, to the extent that only one remained within the predefined parameters.
Based on the results of this second round, we estimated the weight of the attributes from their order. We added up the values of the order given to the attributes, in each category, by each member of the panel and determined a value (VAL) for each attribute. We also estimated the maximum (MAX) and minimum (MIN) values that each attribute could have in each category, in order to determine the normalized value of the
The results indicate that in the ‘Intrinsic’ category, the attribute ‘Ease of use’, placed in eighth, switches position with the attribute ‘Expiration’ (which should be removed as was already explained), placed in seventh. In the ‘Contextual’ category, the attribute ‘Effectiveness’ goes from the fifth position to the fourth, switching with the attribute ‘Conformity’, and the attributes ‘Value added’ and ‘Efficiency’ also switch positions, as ‘Efficiency’ moves to the seventh and ‘Value added’ moves to the eighth positions. In the ‘Representational’ category, all the attributes maintain their original position.
The open question, which considered the inclusion of additional attributes to the list, generated one attribute only. The attribute ‘confidentiality’ which had been excluded in the first round was mentioned by 11 (44%) panel members as an important addition to the ‘Intrinsic’ category. Consequently, it was reintroduced in the list.
With the exception of the attributes ‘Ease of use’, which had not been considered in the first round, and ‘Confidentiality’, which had not been considered in the second round, and despite the obtainment of different weights, the organization of the attributes according to their weight was the same in the first and in the second rounds. Therefore, the lists of attributes to be considered in the measurement were settled by the end of the second round of the Delphi process, but we were unable to reach a consensus as to the relative weight of each attribute, which called for an additional round. In this sense, the questionnaire was administered once again, and it is important to mention that one of the members of the 25-panel members of the two previous rounds could not be present during this stage of the process.
To assess the level of consensus, we evaluated the number of switches in the position occupied by the attributes, as indicated by the experts. Total agreement would translate to the absence of switches, and the consensus would decrease as the number of switches increased; it was also important to evaluate the amplitude of the switch, that is, a greater distance between the switched positions impacted the level of consensus to a greater extent.
Therefore, in order to evaluate the level of agreement, we measured, in each category, the distance between the switched positions and we multiplied it by the number of times the switch had been suggested by the experts, thus obtaining a value for each category. Considering, in each category, the worst case scenario (the most distant switch possible), we were able to evaluate the level of consensus, subtracting from 100 per cent the values obtained by the switches. Table 6 shows the results pertaining to the proposals of the experts as to the switching of positions between attributes.
Switches in the position of attributes.
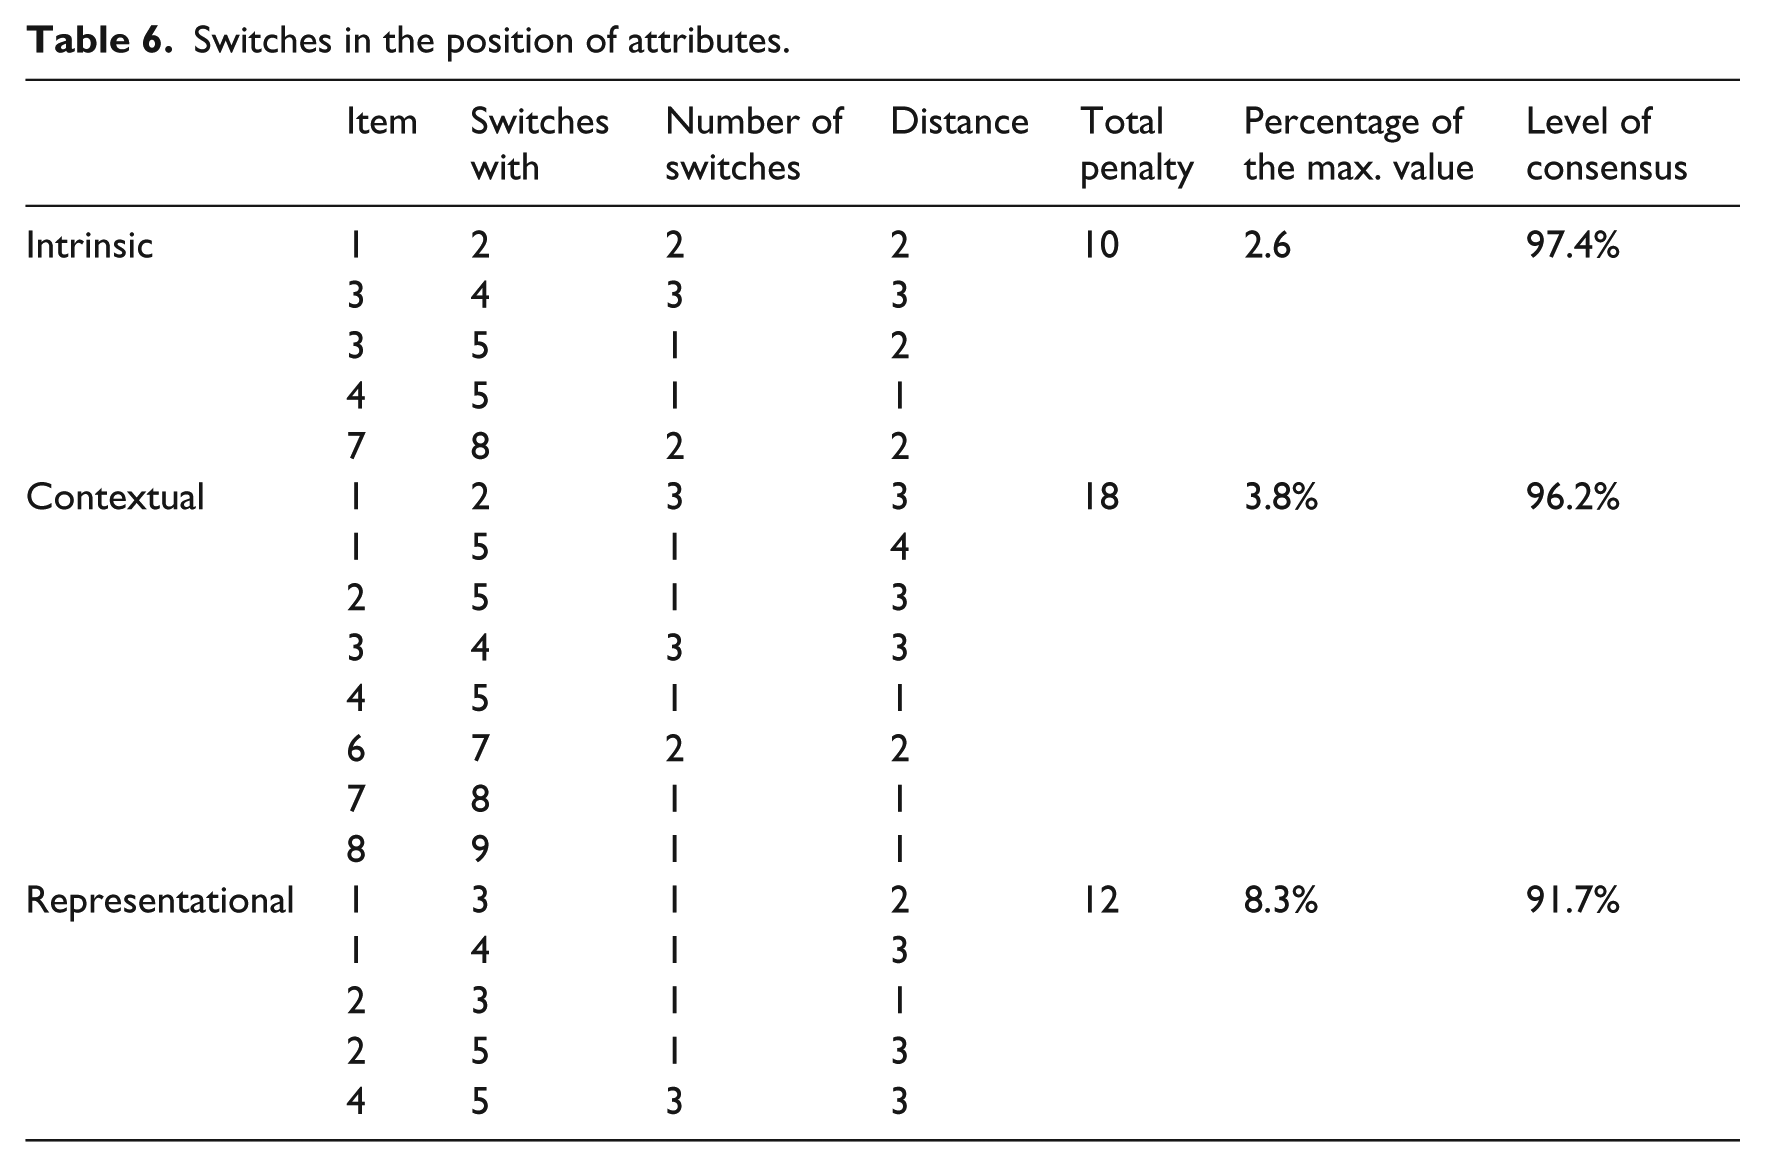
These results allow us to confirm the existence of consensus. The ‘Representational’ category collects the smallest percentage of consensus (91.7%), but this is an admissible value which allows us to bring the Delphi process to its end.
To estimate the relative weight of each attribute we, once more, organized the attributes by the average obtained in the significance score, and we applied the method that was previously used to reach the weight results in the second round of the Delphi process. Table 7 presents the results obtained for the weights ascribed by the experts.
Changes in the attribute position.
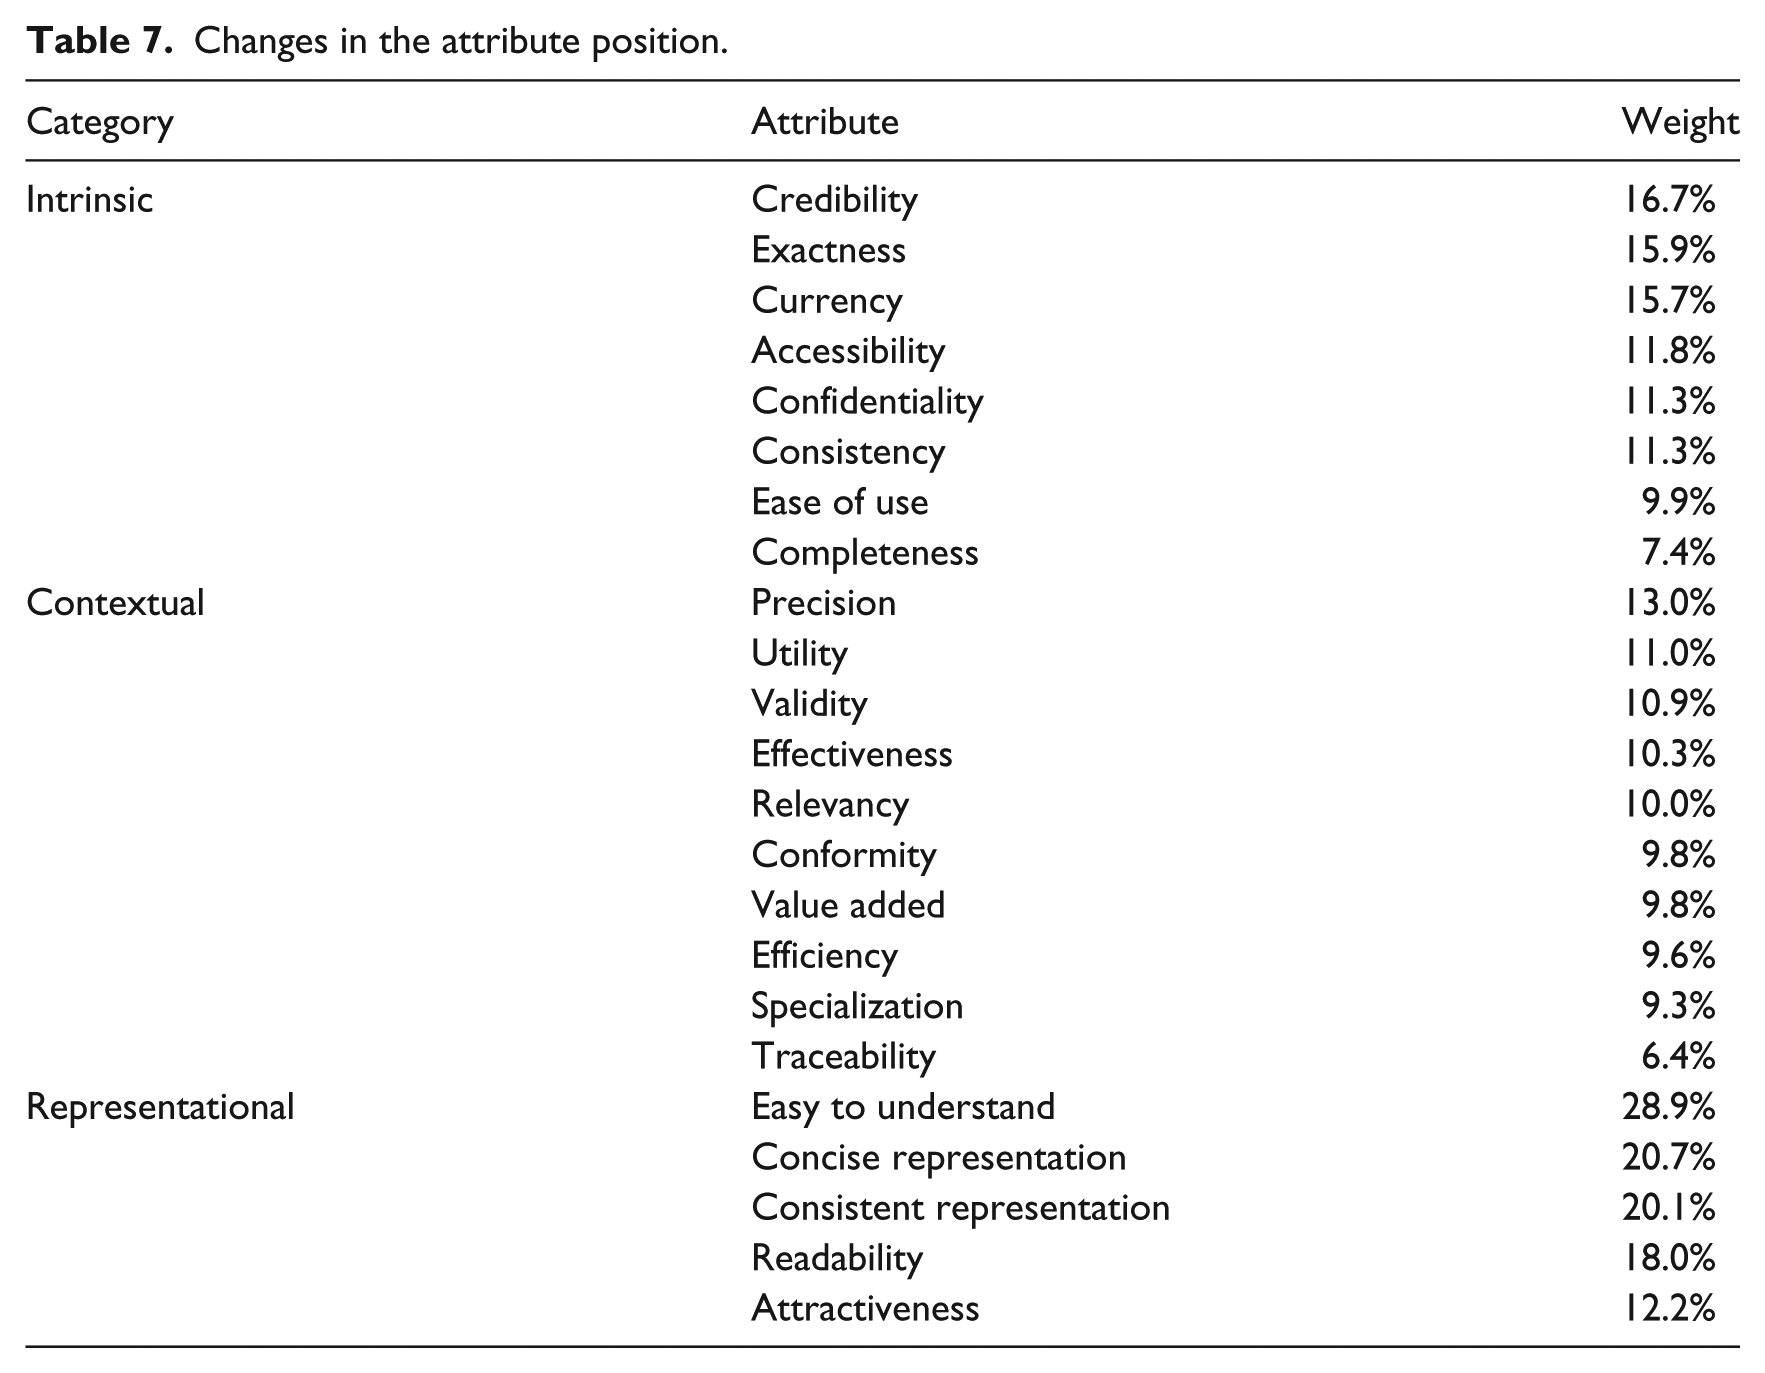
These relative weights were determined within each category, and since each category contains a different number of attributes, according to the calculation formula, this number impacts the relative weight. That is, attributes will assume a greater relative weight in categories with fewer attributes, to the extent that 100 per cent of the weight is distributed among a smaller number of attributes.
In order to eliminate this effect, we adopted as a reference the quartile for weight distribution in each category. Consequently, the weights of the attributes were determined according to the quartile of weight distribution, within each category. This way the weight of the attributes was reduced to four levels. Table 8 presents the weight distribution quartiles in each category.
Quartiles in each category.
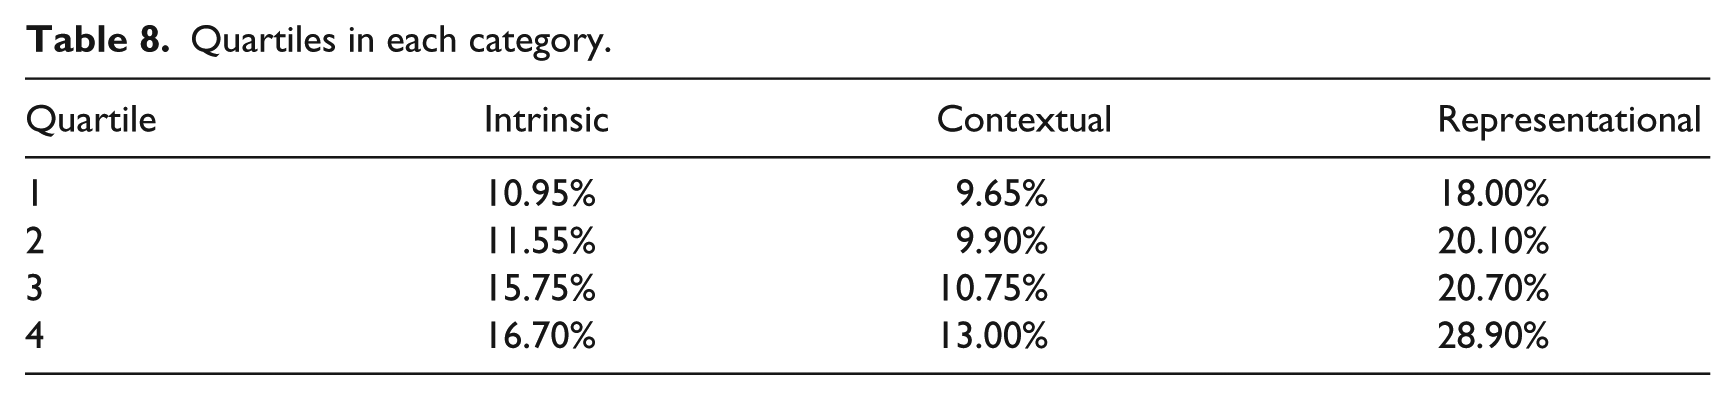
Attaching to each attribute the weight that corresponds to the respective quartile, we obtain the final distribution of relative weights, presented in Table 9.
Weight of the attributes.
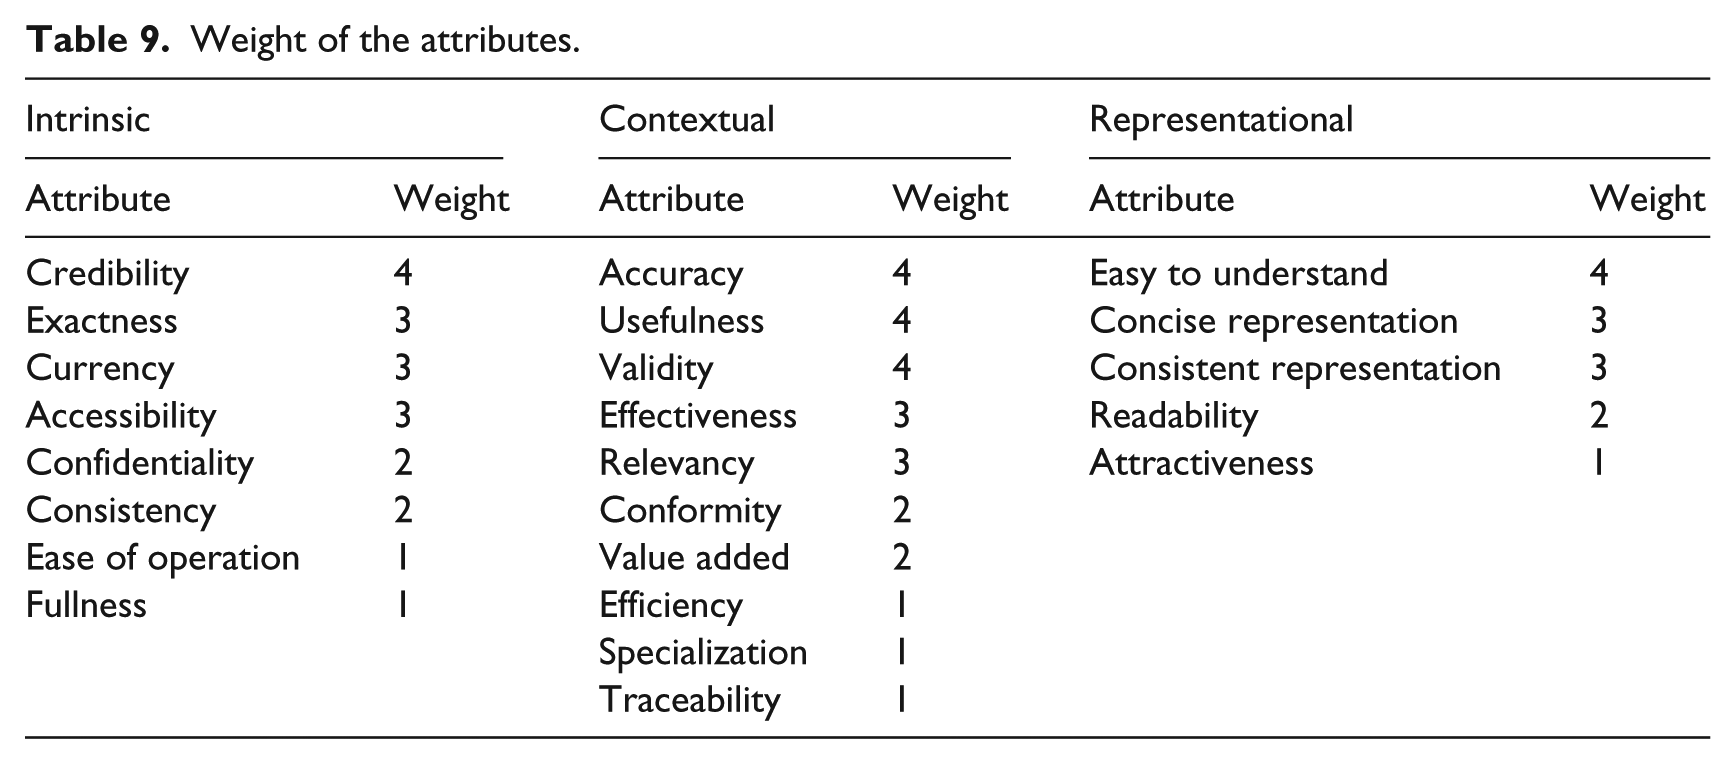
This table illustrates the model/tool that will allow us to measure, in an encompassing and balanced way, the quality of information content in health unit websites, the main contribution of this investigation.
Conclusion
The main goal of the present work, the creation of a tool capable of evaluating the content quality in health unit websites, was reached. The Delphi method, applied to ascertain the relative weight of each attribute, proved effective, as did the creation of a list of categories and attributes based on the literature review, which served as a basis for the first round of the method. Even though the experts were given the chance to add or eliminate attributes, only one new attribute (ease of use) was included and one attribute (expiration) was eliminated from the list. The statistical analysis performed on the results obtained in the different Delphi method rounds testifies the validity of the attribute list that is to be considered in the evaluation tool.
After the first round, the attribute ‘Ease of use’ was introduced and the attribute ‘Confidentiality’ was eliminated; however, the later was reintroduced with the second round, and the attribute ‘Expiration’ time was definitely eliminated.
The third round had to be carried out because we did not reach a consensus as to the significance of the attributes, necessary to ascertain their relative weights. With this round, we were able to reach the consensus and thus define the weight of each attribute in order to create the evaluation measurement that we proposed to develop.
The different statistical analyses and techniques herein implemented are robust and increase confidence to our results, however, the homogeneity of the experts did not allow evaluate the internal consistency of the measure. So, the next stage of our study will involve the application of the evaluation tool to an extended group of health unit websites in order to evaluate the internal consistency of the questionnaire.
The adoption of a similar approach to find a tool that is capable of evaluating content quality, service quality and technical quality, as a whole, in health unit websites is also a goal we intend to pursue in future investigations.
Footnotes
Declaration of conflicting interests
The author(s) declared no potential conflicts of interest with respect to the research, authorship, and/or publication of this article.
Funding
The author(s) disclosed receipt of the following financial support for the research, authorship, and/or publication of this article: This research received financial support of AISTI - Iberian Association for Information Systems and Technologies / Associação Ibérica de Sistemas e Tecnologias de Informação.