
Abstract

In the United States, in 2023, there were 995 railroad related deaths and 6705 injuries. 1 Within our trauma center catchment area, there are four freight railways. As the only trauma center, we are uniquely positioned to receive all pedestrians injured by trains in the region. We sought to compare accidents caused by trains to accidents caused by automobiles to determine whether train-related injuries have a unique injury pattern, injury severity or outcomes compared to automobile-related injuries.
We used our trauma registry data to compare injuries sustained in train-pedestrian accidents (TP) to automobile-pedestrian accidents (AP) for patients 18 years of age or older who presented to our Level II Trauma Center from October, 2015 to April, 2023. Variables included mechanism of injury (AP or TP), intensive care unit (ICU) length of stay (LOS), hospital LOS, Injury Severity Score (ISS), Glasgow Coma Scale (GCS), Abbreviated Injury Scale (AIS) for different body areas, and patient disposition. We obtained Institutional Review Board approval and a waiver of informed consent was deemed appropriate.
We compared the median of variables for TP versus AP populations using a Wilcoxon Rank Sum Test. Univariate logistic regression was used to identify variables that correlated with train injuries. Univariate logistic regression variables with a significant p-value were then used in a multivariate logistic regression model to determine variables that were associated with train injury.
There were 36 TP patients and 1052 AP patients. The average age in both groups was 42 years. There were 30 (83%) males in the TP group and 704 (67%) males in the AP group. Median ISS (21.5 vs 9.0, p = 0.0001) and median AIS extremity (3.0 vs 2.0, p = 0.0006) were significantly higher in TP compared to AP patients. The median presenting Glasgow Coma Scale was significantly lower in TP patients (13.5 vs 15, p = 0.0001). Median AIS for other body areas were not significantly different between groups (Table 1). The median systolic blood pressure on presentation (AP = 136 mm Hg and TP = 135 mm Hg, p = 0.28) and median heart rate on presentation (AP = 94 and TP = 102 p = 0.47) were not different.
Injury severity for train pedestrian and automobile pedestrian patients.
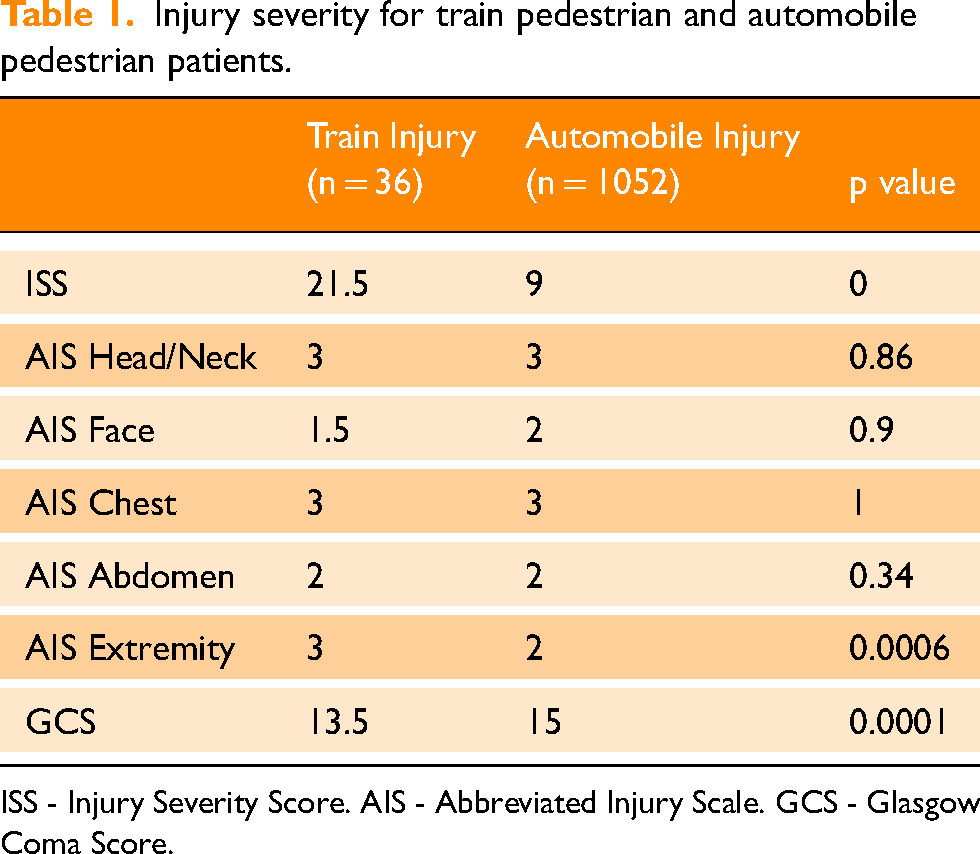
ISS - Injury Severity Score. AIS - Abbreviated Injury Scale. GCS - Glasgow Coma Score.
TP patients experienced a longer median hospital length of stay (LOS) at 9.5 days compared to 5.0 days for AP patients (p = 0.02). The mean ICU LOS was 4.5 days for TP patients and 1 day for AP patients (p = 0.01).
Regarding discharge disposition, 25% (9 of 36) of TP patients were discharged to a skilled nursing or acute rehabilitation facility, while 18.7% (197 of 1052) of AP patients were discharged to a similar level of care. Conversely, 27.8% (10 of 36) of TP patients were discharged home while 33.2% (349 of 1052) of AP patients were discharged home (p = 0.09). Mortality for TP patients was significantly higher at 13.9% (5 of 36) compared to 5.0% (53 of 1052) for AP patients (p = 0.03).
On univariate analysis, ISS (p = 0) and AIS extremity (p = 0.008) were higher, and GCS was lower (p = 0.002) for TP patients. A multivariate logistic regression model showed that a higher ISS, a higher AIS Extremity and a systolic blood pressure less than 105 mm Hg were associated with being injured by a train.
The median ISS in TP patients was 21.5. Other studies have reported an ISS from 13 to 16.8.2–4 The ISS in our patient population is higher which probably reflects the homogeneity of the mechanism. All patients in our study were either struck by a train or jumped from a train.
Extremity injuries are common after both TP and AP collisions; however, in our study extremity injuries resulting from TP collisions were more severe. This has also been noted in previous studies. Byerly et al. 2 found a 15.6% rate of amputation after train pedestrian accidents.
Mortality for TP patients was 13.9% while mortality for AP patients was 5%. In a study using the National Trauma Data Bank (NTDB), Byerly et al. 2 found an in-hospital mortality for TP patients of 9.8% and 7.8% for AP patients. Previous studies using NTDB data have reported TP mortality of 6.4% 4 and 19%. 5
Median hospital LOS was longer for TP patients, at 9.5 days, compared to AP patients. Byerly et al. 2 found that median hospital LOS was 6 days for TP patients and 3 days for AP patients. Moore et al. 3 found the average LOS for patients injured by trains was 30 days. Patients injured by trains may require lengthy hospitalization.
In conclusion, pedestrians injured by trains, compared to pedestrians injured by automobiles, are more severely injured overall and have more severe extremity injuries. Hospital length of stay is longer, and mortality is higher.
Footnotes
Acknowledgements
Everyone who contributed to this study is mentioned above. We have no acknowledgments.
Contributorship
EH, RMA, YF and MH contributed to a literature search, study design and data collection. MH gained institutional review board approval. YF and JK wrote the initial draft of the manuscript. EH, RMA, JK and MH reviewed and edited the final version of the manuscript.
Data Availability Statement
Data available upon request.
Declaration of conflicting interests
The authors declared no potential conflicts of interest with respect to the research, authorship, and/or publication of this article.
Ethical approval
Kern Medical Center Institutional Review Board and ethical approval was obtained on Aug 19, 2023. IRB # 22081.
Funding
The authors received no financial support for the research, authorship, and/or publication of this article.
Guarantor
MH
Informed Consent
This is an IRB-approved retrospective study, all patient information was de-identified and patient consent was not required. Patient data will not be shared with third parties.
Trial Registration
This was a retrospective, registry study. No human subjects were assigned to an intervention; therefore, trial registration was not required.