
Abstract
Background and aims:
The primary aim was to compare disease-free survival (DFS), overall survival (OS), and post relapse survival (PRS) in patients undergoing transplantation for colorectal liver metastases (CRLM) who achieved complete metabolic response (CMR) on pre-transplant [18F]FDG PET/CT after chemotherapy, with patients presenting with low or high metabolic tumor volume (MTV).
Methods:
Pre-operative [18F]FDG PET/CT and diagnostic CT scans from 45 patients included in the Secondary Cancer (SECA) 1 and 2 studies were evaluated. MTV was derived from the [18F]FDG PET/CT, and patients with CMR (MTV = 0) were identified. Patients were stratified into three subgroups: MTV 0, MTV low, and MTV high. DFS, OS, and PRS were compared using the Kaplan–Meier method and the log-rank test. Baseline characteristics and CT reassessment data were analyzed using the Mann–Whitney U test for continuous variables and Fisher′s exact test for categorical variables.
Results:
Thirteen patients with CMR had significantly longer DFS and OS than patients in the MTV high group (p = 0.033 and 0.030), but significantly shorter DFS and OS than those in the MTV low group (p = 0.042 and 0.018). PRS did not differ significantly between patients with CMR and those with low or high MTV (p = 0.121 and 0.130). Imaging findings of extensive growth along the liver capsule and/or possible tumor extension beyond the liver capsule on CT had significantly shorter OS (p = 0.010 and <0.001), including after exclusion of the MTV high group (0.034 and <0.001).
Conclusion:
Patients with CMR on [18F]FDG PET/CT after chemotherapy prior to liver transplantation for CRLM had intermediate DFS, OS, and PRS compared with patients with low and high MTV.
Context and Relevance
Liver transplantation for colorectal liver metastases is gaining increasing interest worldwide. Given the limited availability of donor organs, careful patient selection is essential. Previous studies have shown that liver metabolic tumor volume (MTV) measured by [18F]FDG PET/CT is prognostic; however, the role of complete metabolic response (CMR) prior to transplantation remains unclear. This study investigates whether CMR following chemotherapy predicts improved survival. Among patients included in the SECA 1 and 2 studies, those with CMR had intermediate disease-free, overall, and post-relapse survival compared with patients with low or high residual MTV. This may be due to other negative prognostic factors, such as tumor growth extending into or beyond the liver capsule.
Introduction
Most patients with colorectal cancer (CRC) and liver metastases (CRLM) have unresectable disease, with a 5-year overall survival (OS) of approximately 10% with conventional palliative chemotherapy combined with locoregional disease control. 1 Based on poor results from initial studies, liver transplantation (LT) was previously considered contraindicated for non-resectable colorectal liver metastases (nCRLM). 2 However, with advances in surgical techniques, systemic chemotherapy, and immunosuppressive agents, LT has emerged as a potential curative treatment option for selected patients with CRLM within the field of transplant oncology.3 –6 Due to the limited availability of donor organs, LT can only be offered to highly selected patients.
Pre-transplant metabolic tumor volume (MTV) measured by 2-[18F]-fluoro-2-deoxy-d-glucose ([18F]FDG) positron emission tomography (PET) combined with computed tomography (CT) is highly predictive of survival following LT for nCRLM.7,8 High MTV (>70 cm3) is a negative prognostic parameter, and LT is not recommended for these patients because of poor survival compared with patients with low MTV (<70 cm3). 1
[18F]FDG PET/CT is widely used to evaluate treatment response in oncology by providing semi-quantitative information on tumor glucose metabolism. Complete metabolic response (CMR) is defined as the absence of abnormal metabolic activity within a tumor following treatment. In several malignancies, CMR has been associated with favorable long-term outcomes, including improved OS and disease-free survival (DFS). Lymphoma represent a classic example in which PET-based CMR is strongly prognostic,9,10 and similar findings have been reported in anal, invasive breast, non-small cell lung, esophageal, and cervical cancer.11 –14
Downstaging refers to a reduction in tumor burden, including tumor size, number, or metastatic extent, achieved through systemic therapy, most often chemotherapy. Although neoadjuvant chemotherapy is frequently used for downstaging of CRLM before potential liver surgery, treatment response is currently more often assessed using CT and MRI than [18F]FDG PET/CT.15,16
The primary aim of this study was to compare DFS, OS, and post-relapse survival (PRS) in patients achieving CMR on FDG PET/CT after chemotherapy prior to LT for nCRLM with patients presenting low and high MTV.
Methods
Patient selection
All patients in Norway with CRLM who may be candidates for LT are referred to the hepatobiliary multidisciplinary team meeting at Oslo University Hospital. We analyzed [18F]FDG PET/CT data from 45 patients who underwent LT for nCRLM and were included in the SECA 1 (n = 23) and SECA 2 (n = 22) studies between 2006 and 2020. Thirteen patients with known liver metastases showed no uptake above liver background on the [18F]FDG PET/CT after chemotherapy (MTV = 0), corresponding to CMR. This group was compared with patients with low (n = 18, 0 < MTV < 70 cm3) and high MTV (n = 14, MTV > 70 cm3). The patients did not receive chemotherapy during the last 4–6 weeks before the [18F]FDG PET/CT.
18F-FDG PET imaging procedure
[18F]FDG PET/CT was included in the pre-operative study protocol to exclude extrahepatic disease and was performed using either a Siemens Biograph 64/16 or a GE Healthcare Discovery MI hybrid PET/CT system. Patients fasted for at least 6 h prior to [18F]FDG injection, and serum glucose levels were measured immediately prior to intravenous administration. A standard whole-body PET examination from skull base to the upper thigh was performed, with an acquisition time of 3 min per bed position and 30% overlap. PET images from the Biograph systems were reconstructed according to manufacturer recommendations for routine clinical use, with a matrix size of 168 × 168 pixels (pixel size 4.06 mm), using ordered-subset expectation maximization (OSEM) with four iterations and eight subsets, followed by Gaussian post-reconstruction filtering (full width at half maximum 5 mm). A low-dose CT without intravenous contrast enhancement was performed for anatomical correlation and attenuation correction. CT acquisition parameters were 120 kV, approximately 50 mAs, and 3 mm axial slices. On the Discovery MI system, reconstruction was performed using OSEM (three iterations/16 subsets), 256 × 256 matrix, point-spread-function correction, and time-of-flight technology.
Image assessment
[18F]FDG PET/CT
Each [18F]FDG PET/CT scan was evaluated in consensus by two experienced physicians, both specialists in nuclear medicine and radiology (NMS and HG). MTV of liver metastases was calculated using a Siemens syngo.via workstation (version VB40, Erlangen, Germany). MTV (cm3) was defined as the tumor volume with 18F-FDG uptake segmented using a fixed threshold method at 40% of SUVmax within the volume of interest, as previously described in SECA PET studies. 8 Total MTV represented the sum of the MTV values from all liver metastases for each patient. Liver background was established by placing a 3 cm region of interest in the right liver lobe. 17 Liver metastases were included if SUVmax exceeded the mean liver background uptake × 1.5 plus two standard deviations of the liver background activity. 17
Contrast-enhanced CT
A dedicated abdominal radiologist (TS) reassessed all pre-LT CT scans and registered the size of the largest metastasis and the number of metastases on the last CT before LT, as well as the maximum size and number observed at any CT time point before LT. Presence of possible large-vessel invasion, extensive tumor growth along the liver capsule, and possible extracapsular tumor growth at any CT time point before LT was also registered (NMS and HG). Possible vessel invasion was defined as ⩾90° circumferential encasement, vessel contour irregularity, or focal caliber narrowing. Extensive tumor along the liver capsule was defined as >5-cm total capsular involvement by metastases adjacent to the capsule. Possible extracapsular tumor growth was recorded when metastases extended beyond the natural liver contour and/or presence of perihepatic fat stranding was present adjacent to metastases along the liver capsule.
Statistical analysis
Statistical analyses were performed using SPSS (IBM, version 26, Chicago, IL, USA). DFS, OS, and PRS were estimated and compared using the Kaplan-Meier method and the log-rank test. Differences in baseline characteristics and CT reassessment findings between groups were analyzed using the Mann–Whitney U test for continuous variables and Fisher’s exact test for categorical variables. A p-value <0.05 was considered statistically significant. DFS was defined as the interval from LT to detection of new suspected metastatic lesions or local relapse identified by CT, MRI, or [ 18 F]FDG PET/CT, development of a new CRC primary tumor, or diagnosis of another malignant disease. OS was calculated from the date of LT to death or the end of follow-up. PRS was defined as survival after relapse at any site.
Results
Patient baseline characteristics and CT reassessment
Table 1 presents baseline characteristics of patients with CMR (MTV = 0) compared with patients with low and high MTV. Median age at LT was 58 years (range 29–71), and 24 patients were male and 21 female. A higher proportion of patients in the MTV low group had rectal cancer (10/18) compared with the CMR group (2/13, p = 0.019). In the MTV high group, 12/14 patients had progressive disease at LT compared to 2/13 in the CMR group (p = 0.002). The median size of the largest metastasis was 28 mm in the CMR group compared to 83 mm in the MTV high group (p < 0.001). Median carcinogenic antigen (CEA) level at LT was 2 in the CMR group and 95 in the MTV high group(p = 0.002).
Comparison of baseline characteristics.

Median (range).
LT: Liver transplantation.
“Increased size/number of liver metastases and/or increased carcinoembryonic antigen (CEA) at LT.
MTV: metabolic tumor volume. LOW = 0 < MTV < 70, HIGH = 70 < MTV.
Results of the CT reassessment are shown in Table 2. In the CMR group, 4/13 patients had extensive tumor growth along the liver capsule compared with 13/15 in the MTV high group (p = 0.001). Possible extracapsular tumor growth was observed in 5 of 13 patients with CMR compared to 0 of 18 in the MTV low group (p = 0.008).
Results of CT reassessment and post LT histology.

Median (range).
”Growth outside the liver capsule or into the liver hilum.
MTV: metabolic tumor volume; LOW = 0 < MTV < 70, HIGH = 70 < MTV.
LT: Liver transplantation.
Survival analysis
Disease-free survival, overall survival and post-relapse survival
Patients with CMR had a median DFS of 11 months, compared with 6 months in the MTV high group (p = 0.033) and 24 months in the MTV low group (p = 0.042) (Figure 1). Median OS in the CMR group was 70 months, compared with 32 months in the MTV high group (p = 0.018) and 164 months in the MTV low group (p = 0.030) (Figure 2). Median PRS in the CMR group was 55 months, compared to 24 months in the MTV high group (p = 0.121) and 105 months in the MTV low group (p = 0.130) (Figure 3).
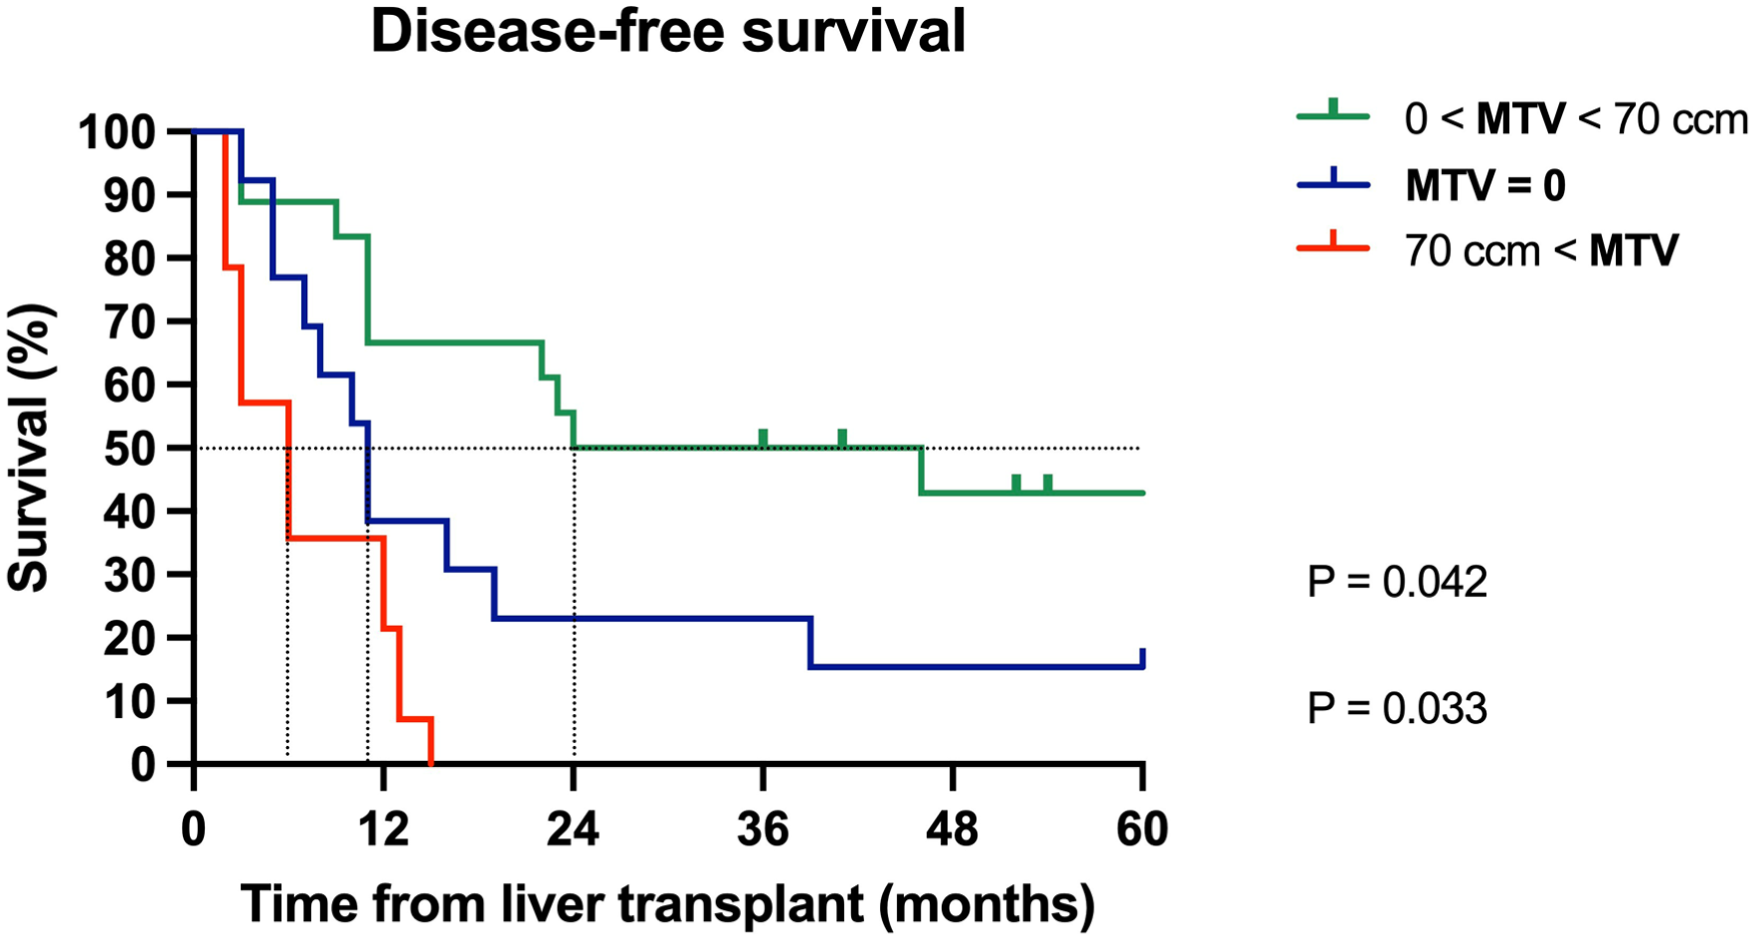
Kaplan-Meier disease-free survival (DFS) curves for MTV low, MTV = 0 (complete metabolic response) and MTV high groups compared by the log-rank test showing significantly better median DFS in the MTV low group compared to MTV = 0 (p = 0.042). MTV = 0 had significantly longer DFS compared to the MTV high group (p = 0.033).

Kaplan-Meier overall survival (OS) curves for MTV low, MTV = 0 (complete metabolic response) and MTV high groups compared by the log-rank test showing significantly better median OS in the MTV low group compared to MTV = 0 (p = 0.030). MTV = 0 had significantly longer OS compared to the MTV high group (p = 0.018).

Kaplan-Meier post-relapse survival (PRS) curves for MTV low, MTV = 0 (complete metabolic response) and MTV high groups curves compared by log-rank test. Median PRS for MTV = 0 was not significantly different compared to the MTV low group (p = 0.121) and MTV high (p = 0.130).
Possible extracapsular growth or extensive growth along the liver capsule
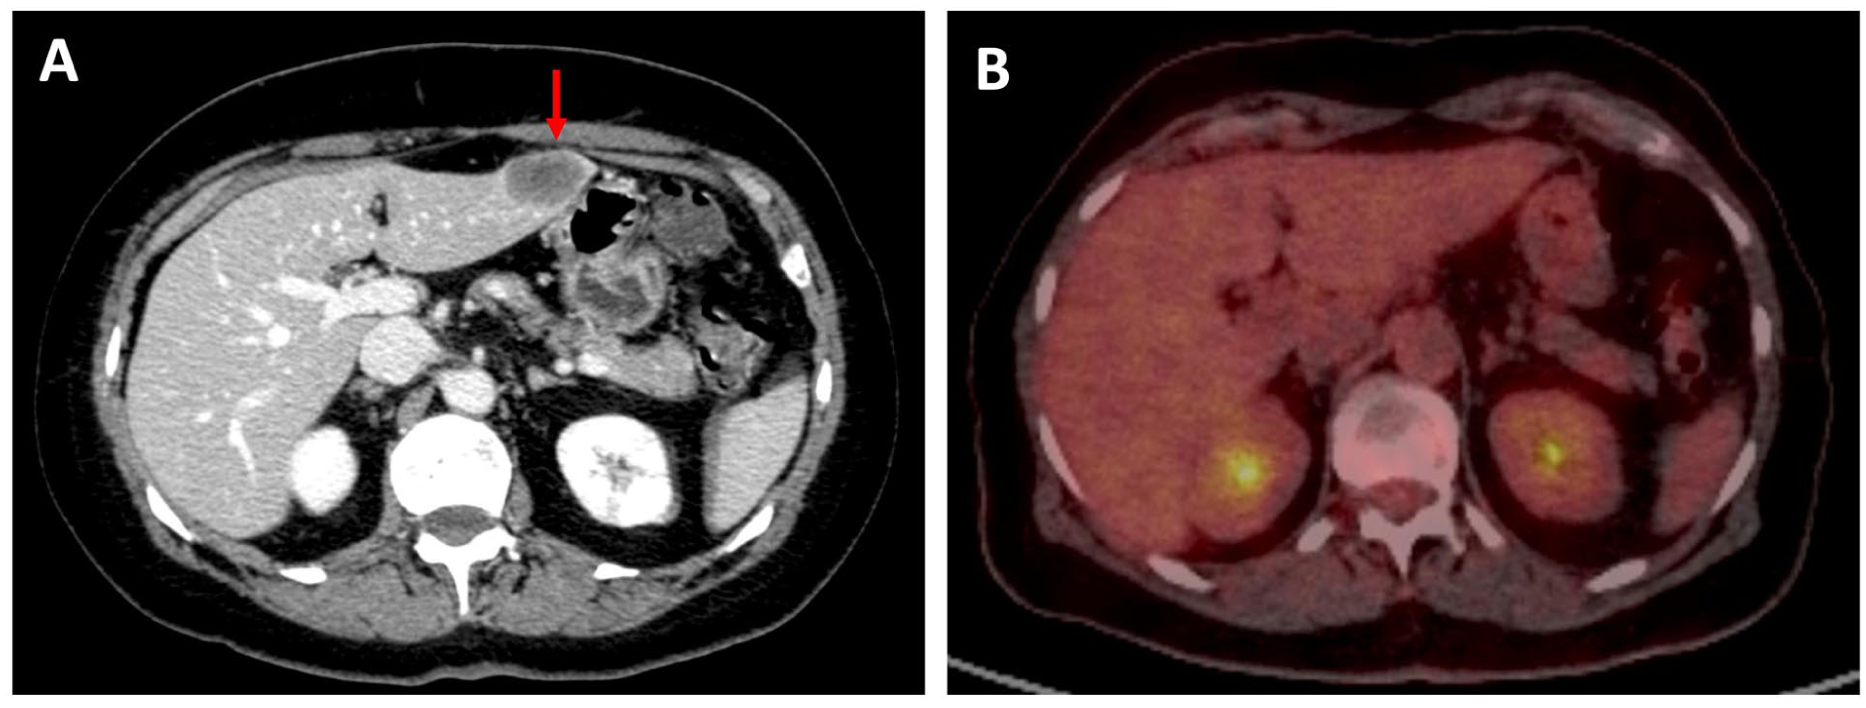
Among patients with CMR, those with possible extracapsular tumor growth (n = 5) had a median OS of 57 months compared with 87 months in patients without such growth (n = 8) (p < 0.001). In the total cohort, the 23 patients with extensive tumor growth along the liver capsule had a median OS of 57 months compared to 151 months in the 22 patients without this finding (p = 0.010). Eleven of 45 patients demonstrated possible extracapsular growth on CT. These patients had a median OS of 57 months compared to 116 months in patients without signs of extracapsular growth (p < 0.001). After exclusion of patients with high MTV (n = 14), the five patients with possible extracapsular growth had a median OS of 57 months compared to 151 months in those without such findings (n = 26) (p < 0.001). Similarly, 12 patients with possible extracapsular growth and/or extensive capsular growth had a median OS of 90 months compared with 151 months in patients without these findings (p = 0.034). Figures 4 and 5 illustrate representative [18F]FDG PET/CT and contrast-enhanced CT findings in patients with possible extracapsular tumor growth and extensive capsular involvement.

Discussion
The main finding in the present study is that patients with CMR on [18F]FDG PET/CT after chemotherapy prior to LT for CRLM had intermediate DFS, OS, and PRS compared with patients with low (0 < MTV < 70 cm3) and high MTV (> 70 cm3). In previous PET-based studies of nCRLM, patients with low MTV (< 70 cm3), including patients with CMR (MTV = 0), have typically been analyzed as a single group and compared with patients with high MTV (> 70 cm3).
It is plausible to expect that patients with CMR would have the most favorable outcomes because PET uptake reflects viable tumor cells. 18 The anatomical distribution of liver metastases, as evaluated by CT at any time from CRLM diagnosis, may influence prognosis. Patients with extensive tumor growth along the liver capsule and/or possible extracapsular growth had significantly shorter OS compared with patients without such findings. In the CMR group, 5/13 patients showed possible extracapsular growth, whereas none in the MTV low group did. When tumor borders approach the liver capsule, microscopic extracapsular invasion may occur despite the absence on imaging findings. Increased density of perihepatic fat adjacent to metastases may represent a radiological indicator of extracapsular disease, potentially contributing to later extrahepatic recurrence despite CMR on PET/CT. However, differentiation between reactive post-chemotherapy changes and true extracapsular tumor growth on CT remains challenging. Previous reports on CRLM has shown that invasion of Glisson’s capsule is associated with R1 resection, and that subcapsular tumor location increases the risk of local tumor progression following radiofrequency ablation.19,20
No difference was observed between groups regarding histologically confirmed extrahepatic growth on post-LT pathology. Pre-transplant chemotherapy may have eradicated extracapsular tumor deposits, resulting in the absence of detectable tumor cells despite radiological features suggestive of extracapsular tumor growth on pre-LT CT imaging.
Some patients with CMR showed progression of disease at the time of LT or had a short interval (<2 years) from primary surgery to LT, factors previously associated with poorer survival. 4 Tumor burden (MTV) may also represent a threshold factor related to micrometastatic disease and/or circulating tumor elements. It is conceivable that the presence of circulating tumor cells increases with higher tumor burden at any time point. 21 Experience from the SECA studies shows that although recurrence is common and DFS is relatively short, PRS remains prolonged, likely because approximately two-thirds of recurrences are indolent and surgically treatable pulmonary metastases. 22
Micrometastases remain below the detection threshold of PET or other imaging modalities. Possible micrometastatic foci unresponsive to chemotherapy might be one of the reasons why MTV = 0 does not necessarily reflect total tumor burden. Circulating tumor elements, including tumor cells, DNA, and RNA, may provide additional prognostic information, as they cannot be visualized by imaging but have been shown to correlate with disease extent.6,23
This study has several limitations that warrant consideration. The partly retrospective, single-center design and relatively small cohort may limit generalizability and introduce selection bias. Older generation PET/CT scanners were used, and technology advances may influence quantitative imaging parameters. While PET demonstrated prognostic value, its limited sensitivity for small residual liver lesions after chemotherapy highlights the need for complementary high-resolution MRI. It may be difficult to determine whether a metastasis has true extracapsular growth on CT due to limited spatial resolution and partial-volume effects. Furthermore, there is no consensus regarding optimal MTV segmentation methodology, and MTV values may vary depending on the chosen approach.24,25 A fixed absolute threshold of 40% of SUVmax was used to maintain consistency with previous SECA studies and because it provides a simple representation of metabolic tumor burden. Molecular biomarkers such as circulating tumor cells or circulating tumor DNA were not included but might have provided additional prognostic information. Finally, some patients had relatively long interval between PET and LT, potentially allowing disease progression; however, ongoing CT and MRI surveillance was performed, and the median interval of approximately 3 months corresponds to common oncological follow-up practice.
Evaluation of patients with CRLM considered for LT is complex and relies on multiple predictive factors that must be interpreted together. The findings should therefore be considered hypothesis-generating rather than practice-changing, and larger prospective multicenter studies are required to confirm their clinical relevance.
Conclusion
Patients with CMR on [18F]FDG PET/CT after chemotherapy prior to LT for CRLM demonstrated intermediate DFS, OS, and PRS compared to patients with low and high MTV.
Footnotes
Author contributions
Conceptualization / study design: NMS and HG. Data acquisition: All authors. Methodology: All authors. Data analysis and interpretation: NMS and HG performed data analysis, and all authors interpreted the results. Statistical analysis: NMS and HG. Project administration / supervision: HG, SD and PDL. Writing original draft: NMS and HG. Writing—review and editing: All authors. Final approval: All authors.
Declaration of conflicting interests
The authors declared no potential conflicts of interest with respect to the research, authorship, and/or publication of this article.
Funding
The authors disclosed receipt of the following financial support for the research, authorship, and/or publication of this article: Supported by Vestre Viken Hospital Trust, Oslo University Hospital and the Norwegian Cancer Society.
Ethical considerations
Informed consent
Informed consent was obtained from all individual participants included in the study.
All procedures performed in studies involving human participants were in accordance with the ethical standards of the institutional and/or national research committee and with the 1964 Declaration of Helsinki and its later amendments or comparable ethical standards.
Data availability statement
Data are available upon reasonable request.