
Abstract
Scientific integrity relies on reproducibility. Reproducible scientific results are essential for advancing clinical practice and improving patient outcomes. However, despite the importance, reproducibility issues are widespread, often arising from inadequate methodologies and a lack of expertise in research design. Methodological shortcomings can lead to unreliable and biased findings, wasted resources, and thus compromised clinical decisions. Recent studies indicate that researchers frequently struggle to replicate findings, emphasizing the need for improvements in quality and transparency.
This review aimed to enhance the understanding of common pitfalls in research methodologies by identifying and describing the common limitations. Ultimately, this review aims to strengthen the quality of surgical research and improve patient care through more reliable and clinically applicable research findings.
Context and Relevance
Reproducible scientific results are essential for advancing clinical practice and improving patient outcomes. However, despite the importance, reproducibility issues are widespread, often arising from inadequate methodologies and a lack of expertise in research design. In this review, we examined prevalent statistical practices in surgical and orthopedic research, including null-hypothesis significance testing, dichotomization of the study results, reporting of negative findings, fishing and HARKing, dichotomization of continuous variables, risk-factor centered research, as well as prediction and explanation in the context of multivariable modeling. In this review, we advocate for a shift toward clinically relevant and well-defined research questions, favoring multivariable predictive models with absolute risk estimates for more accurate decision-making.
Introduction
Reproducibility is a cornerstone of scientific quality.1,2 Reproducibility refers to the ability of another researcher to replicate the results from the prior study using the same materials and methods as the original research.
Treatment decisions should be based on the most recent and reliable research findings in a clinical setting. However, if prior research findings are not reproducible, the risk of making uninformed treatment decisions increases significantly. In other words, for research findings to be reliable and capable of improving patient care, a clinician should be able to replicate the results within their patient cohort, provided it is like the original study population.
Despite the importance, concerns about reproducibility have been raised for decades. Landmark papers by Altman 3 and Chalmers and Glasziou 4 highlighted how inadequate methods and insufficient expertise undermine the reliability of research findings. A recent survey from Nature found that over 70% of studies had failed to reproduce another researcher’s experiment, and over half had failed to replicate their findings. 5 Which further highlights the issue, is the lack of knowledge in research methodologies, which weakens the reliability and robustness of research conclusions. 6 In response, various calls to reform have arisen, including a detailed “manifesto for reproducible science” that urges improvements in research design, transparency, and reporting standards. 7
This narrative review examines common methodological pitfalls that undermine reproducibility in surgical research. By highlighting these challenges, we aim to enhance readers’ awareness of factors that compromise research quality.
Basics of the traditional frequentist methodology in surgical research
Null-hypothesis significance testing (NHST) has been the cornerstone of statistics in clinical research for decades. The concept behind this methodological framework, frequentist statistics, was originally developed in ill-defined combination of the theories of Fisher and the theories of Neyman and Pearson in the 1900s, and the basic principle has since remained the same.8,9 In this approach, statistical deduction begins with formulating the null hypothesis, which most often relies on the (null) assumption that there is no association between the exposure and the outcome. Sample data is then used to calculate a p-value, representing the probability to observe an association as strong as that observed in the sample data if no association exists in the population. In other words, a p-value is a measure of the plausibility of a null hypothesis.
To gain a deeper insight into the meaning of the p-value, a scientist must understand the concept of the NHST. Let’s assume we compare the ages between two groups and achieve a p-value of 0.03. This means that if the same trial was repeated 100 times, we would observe similar or higher differences in age 3 times. Accordingly, when examining the differences in treatment effects, a p-value of 0.05 would mean that if the experiment was repeated 100 times, similar or more extreme differences would be observed in five out of 100 of those experiments.10,11
While NHST is widely used and remains the most common approach in surgery research, it has notable limitations that compromise its ability to provide meaningful and clinically relevant insights.12–15 The fundamental limitation of the NHST is that it is focused solely on the plausibility of the null hypothesis rather than the effect sizes resulting in binary yes/no type conclusions.12,16 In clinical research, where patient outcomes such as recovery times, complication rates, or implant survival can vary in degrees, the magnitude and clinical relevance of the observed treatment effects are critical. Hence, a statistically significant finding may not necessarily be clinically significant.17,18
NHST is also highly sensitive to sample size.19,20 With a large enough sample, even a very small effect can reach statistical significance. Conversely, a study may fail to detect a meaningful effect simply because of a small sample size. This limitation is particularly relevant in surgical research, where conducting large studies can be challenging due to practical constraints, such as limited patient populations. Consequently, researchers may either overstate the importance of minor effects in large datasets or dismiss potentially valuable findings in smaller samples, both of which can skew clinical decision-making.
Dichotomization of the statistical significance
In frequentist statistics, the decision on whether or not the observed association between the exposure and the outcome is regarded as meaningful, that is, statistically significant, is based solely on the interpretation of the p-value. 21 A common threshold for statistical significance is 0.05. 21 If the p-value is below this threshold, that is, the probability of observing as large an effect as in the study sample if the null hypothesis was true is less than 5%, researchers are allowed to conclude against the null hypothesis. The rationale for choosing 0.05 as a threshold for statistical significance is arbitrary although controversial and seemingly scientific explanations have been used, such as basing the threshold on normal distribution, in which observations lying more than two standard deviations from the mean, roughly 5% of the population, may be considered as outliers or otherwise significantly different from average population. 10
Interpreting study results through a binary lens based on p-value so that the observed effect is classified as either “significant” or “non-significant,” is common but highly problematic, both in clinical settings as in the planning phase of the statistical methods (Fig. 1). An effect or an association does not become existent when the p-value changes from 0.06 to 0.04 or vice versa. Indeed, by the definition of the p-value, a change in the p-value from 0.06 to 0.04 represents a two-percentage-point change in the probability of observing such a strong effect or association in the study sample if the effect or association is non-existent in the population. From a clinician’s point of view, some effects may be considered as particularly important, such as insulin treatment in type 1 diabetes whereas others can be neglected in clinical practice due to minimal importance, such as the effect of NSAIDs on fracture healing. Thus, dichotomization of research findings encounters the potential to reduce complex, continuous data to overly simplistic conclusions, thereby leading to critical misinterpretations.1,22
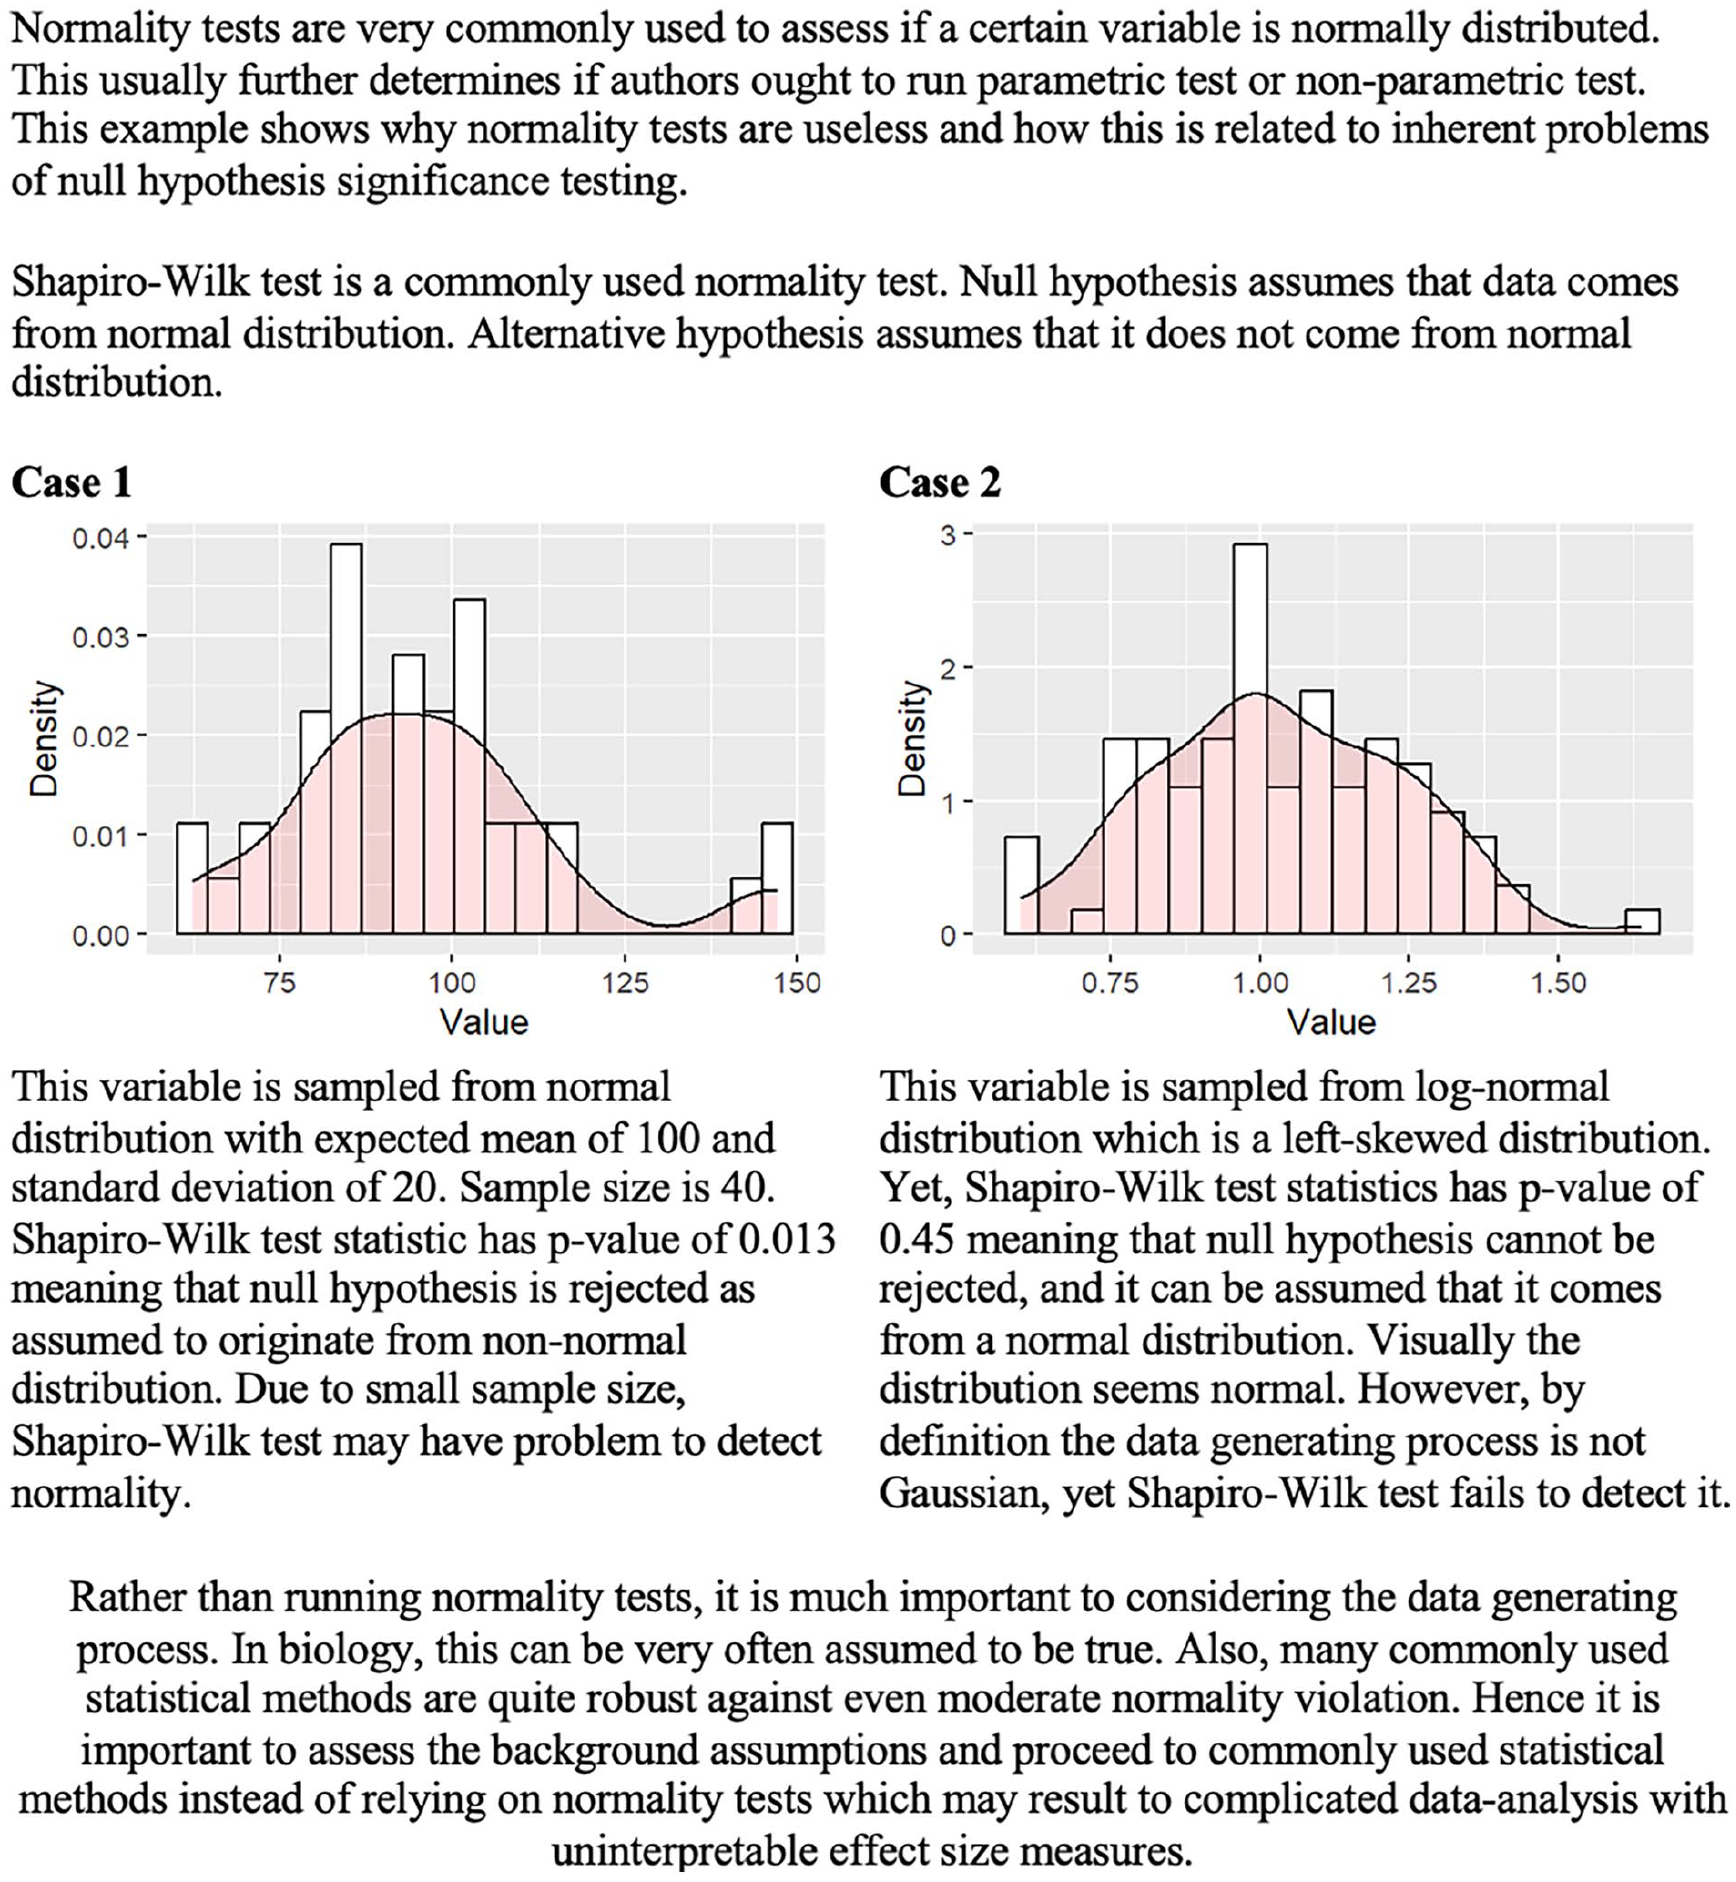
There is a possibility of false interpretations of the normality tests. In addition to the flawed study conclusions, the null-hypothesis significance testing might produce irrelevant and false conclusions to the statistical methods, which further invalidates the statistical analyses.
Further problems that arise from dichotomization are typically called Type I and Type II errors. 23 Type I errors, also known as false positives, occur when researchers incorrectly reject the null hypothesis, potentially leading to the adoption of ineffective or even harmful interventions. 1 An example of a Type I error in surgical research could occur when a study finds a new technique to reduce postoperative pain compared to the standard approach, but this result is due to random chance or inadequate statistical testing rather than a true effect. If this finding leads to the widespread adoption of the new technique, patients might undergo unnecessary changes in care without real benefits. Type I errors are typical in studies that conduct statistical tests without proper adjustments, increasing the likelihood of false positive findings. They are also common in small-sample studies, where random variation is more likely to produce results that appear statistically significant, even though no true effect exists.
Type II errors, or false negatives, occur when researchers fail to reject the null hypothesis despite a true effect, potentially overlooking beneficial treatments. For example, if the study concludes the new technique is no better than the standard method based on p-value, despite being more effective, a Type II error has occurred. Type II errors are common in studies with insufficient statistical power, often due to small sample sizes. Type I and Type II errors can distort clinical decision-making through publication bias. Studies reporting statistically significant findings (often driven by Type I errors) are more likely to be published, whereas studies with negative or null results (potentially reflecting Type II errors) often remain unpublished. This bias skews the overall body of evidence, leading to flawed clinical decision-making.
The ANDROMEDA-SHOCK trial, a study on septic shock management, provides a powerful example of the problems of dichotomizing results.24–26 In this trial, the researchers aimed to compare the capillary-refill time-guided fluid resuscitation and serum lactate-guided fluid resuscitation in patients with septic shock. The trial’s findings indicated that capillary refill time was no better than serum lactate in dictating fluid resuscitation in septic patients treated in the ICU with regards to 28 days mortality. Mortality in the capillary-refill group was 34.9% and 43.4% in the serum lactate-guided group. The estimated risk difference in mortality between the groups was −8.5%, with a 95% confidence interval from -18.2% to 1.2%. The hazard ratio was 0.75 with 95% confidence intervals ranging from 0.55 to 1.02, p-value being 0.06. The conclusion was, due to the p-value exceeding 0.05, that there was “no difference” between the two strategies for direct fluid resuscitation. If the traditional, p-value-centered, and dichotomous approach was to be relied on, the conclusion would have been justified. However, it seems unintuitive that as small as a one percent point decrease would have yielded a whole different conclusion, favoring capillary filling time over serum lactate in dictating fluid resuscitation. Indeed, despite the slightly increased uncertainty suggested by the higher p-value, the observed results were rather indicative of favoring capillary refill targeted fluid resuscitation, although the strict p-value criterion of significance was not fulfilled. By focusing solely on statistical significance, the trial demonstrated how rigid adherence to dichotomization can lead to missed opportunities for advancing patient care and optimizing treatment strategies.
Fishing and HARKing
“If you torture your data long enough, they will tell you whatever you want to hear,” stated Mills in their editorial in 1993. 27 Null-hypothesis significance testing and dichotomization of the study results have led to two additional problems that are especially prevalent in the observational research. These problems are known as “fishing” (also known as data torturing or p-hacking) and HARKing (Hypothesizing After the Results are Known). Both fishing and HARKing involve manipulating the research process to make findings appear more significant or interesting than they are. Both of these practices are prevalent, as due to the dichotomization of the study results, it has been reported that the likelihood of being published is higher for positive results rather than negative results without statistical significance, a problem that further increases the prevalence of publication bias. 28
Fishing refers to the practice of conducting multiple statistical tests or extensively exploring a dataset to identify statistically significant results, even if these findings lack a solid theoretical foundation or clinical relevance. This might refer to conducting analyses on the subsets of data that have not been prespecified or not based on any clinically important factors or modifying statistical models so that they finally achieve a statistically significant p-value. 27 More than hypothesized causal pathways, fishing relies more on random chance; hence, the clinical relevance of the results produced with this method might even be close to zero in an extreme situation. For example, when the significance level is set at p = 0.05, there’s a 5% chance of observing data as extreme as the one we observed if the null hypothesis is true. Now, if 20 independent samples were collected from the same population, the probability that at least one of those samples shows a statistically significant result purely by chance is not zero. Specifically, the probability that none of the 20 samples show statistical significance is 0.952 20 = 36%. This also implies that there’s a 64% chance that at least one of the samples will show statistical significance even if no true effect exists. Similarly, if we collect data from a single sample where the null hypothesis is true and test 20 independent variables, the probability that none of the variables crosses the statistical significance threshold is also 36%. This means there’s a 64% chance that at least one variable will appear to be statistically significant purely by random chance (even though there’s no real effect). Findings generated with this method are often non-replicable and potentially misleading, hence lacking clinical relevance. Given that the treatment should be based on the evidence, the consequences of fishing might extend to affect patients directly.
HARKing, on the other hand, involves formulating or modifying hypotheses after examining the results. 29 This practice can lead to presenting what is a random chance finding (a type I error) as if it were a valid and tested hypothesis. This distortion can lead to overconfident conclusions about surgical practices. In retrospective studies, this issue is particularly concerning because they rely on analyzing existing data, where confounding factors, biases (e.g. selection and recall bias), or random associations may be misinterpreted as genuine causative relationships.
The emphasis on publishing statistically significant findings contributes to both fishing and HARKing. Journals often favor positive results, creating incentives for researchers to use questionable practices to achieve significance. 28 By presenting results in ways that align with desirable narratives or statistical significance, these practices undermine scientific integrity and risk influencing clinical practice based on misleading evidence. To counteract these issues, researchers must appreciate transparent and rigorous methodologies over sensational findings with inadequate methods. A pre-registered analysis plan with predefined hypotheses and statistical models helps maintain integrity and reduce bias. For example, the use of Directed Acyclic Graphs (DAGs) or other theoretical frameworks is recommended to guide the selection of confounders and causal pathways, reducing the risk of data-driven decision-making. 30 In addition, it is important to acknowledge and highlight that these findings are exploratory rather than confirmatory, as would be expected in RCTs.
Statistical significance vs clinical significance
A common issue in surgical research is the tendency to equate statistical significance with clinical importance. This misinterpretation can lead to the adoption of interventions that show marginal but statistically significant benefits without substantial clinical value. 31 However, statistical significance does not necessarily imply that the effect is clinically meaningful or relevant in practice. 32 Clinical significance, on the other hand, refers to whether a result has a tangible, beneficial impact on patient outcomes, decision-making, or healthcare practices. 32
To demonstrate the clinical relevance that the results have, it is essential to predefine the effect that can be considered as relevant. One solution is the concept of the Minimally Clinically Important Difference (MCID). 33 The MCID represents the smallest change in an outcome that patients perceive as beneficial or that influences clinical decision-making. For example, a study might find that an intervention improves the quality of life by 10 points with statistical significance. However, if the MCID for the used measurement was higher than the estimated change, and thereby the patients do not perceive the change in their clinical status, the effect should not be considered as clinically important, although statistically significant. Hence, when interpreting results, MCIDs should be reported alongside statistical outcomes to highlight whether an intervention’s effect is relevant to patient care. 34
As the Type I and II errors were a demonstration of the limitations in interpreting the results solely through the statistical significance, the magnitude error (also known as Type M error) highlights the challenges of distinguishing between statistical and clinical significance. Type M error might occur when dichotomization is utilized without estimation of the effect size in the interpretation of the study results.35,36 Type M errors occur when the estimated effect size is exaggerated, often in studies with small sample sizes, leading to inflated conclusions about clinical relevance. For example, a small clinical study that assesses the effect of a new surgical technique on the operation time might report statistically significant results with a p-value under 0.05, suggesting a mean decrease of 15 min in the operating time. However, a larger follow-up study might demonstrate that the actual improvement was only 3 min, highlighting a Type M error where the initial results exaggerated the clinical significance of the new intervention.
Going beyond statistical significance and dichotomization
As Douglas Altman stated in 1995, “absence of evidence is not evidence of absence.” 20 Recent recommendations advocate for a shift in how p-values are discussed and interpreted in research.37–39 Several alternative or complementary approaches to NHST exist, such as using confidence intervals or Bayesian analysis. These approaches provide estimates of the possible effects that are easier to interpret and, hence, more applicable to clinical decision-making.
Confidence intervals allow clinicians to assess both the size and precision of an effect, making it easier to determine whether a finding has practical relevance in terms of MCID in clinical settings, which is important as the magnitude of an effect can influence clinical decisions.40–42 Unlike p-values, confidence intervals offer more information about the magnitude and precision of the estimated effect.16,43 The exact definition of the 95% confidence interval is that if the experiment is repeated 100 times identically, the observed mean will fall within the range of confidence intervals in 95 out of 100 repetitions. However, this does not mean that 95% of future studies would result in an estimate within the confidence interval. Instead, it has been reported that mathematically, this proportion is around 83%, referring to the probability that a single future study’s point estimate will fall within the previously computed 95% confidence interval. 44 In addition, confidence intervals allow for direct comparison between different studies and interventions.40–42
When comparing two different treatments or groups, the confidence intervals should not be compared as dichotomous based on whether they include or exclude the zero difference. The 95% confidence intervals could include the zero change in the measured outcome, yet the test for difference with traditional NHST would still produce statistically significant results with less than 0.05 p-values. For example, a comparison of groups might result in a hazard ratio of 1.4 with 95% confidence intervals ranging from 0.95 to 1.85, yet the traditional NHST would still produce a <0.05 p-value. If confidence intervals were interpreted as dichotomized, it could be stated that there was no difference. However, instead of the dichotomized interpretation, the entire range of the confidence interval should be considered to assess the precision and clinical relevance of the estimate. In the given example, although the confidence interval includes 1.0, the point estimate suggests a 40% increase in risk, and the upper bound of the confidence interval indicates a potentially substantial effect. Indeed, although the statistical significance threshold of p < 0.05 was not reached, asymmetry of the confidence interval with zero effect estimate is suggestive toward the actual effect with a presence of type II error. Relying solely on whether the confidence interval crosses 1.0 may lead to overlooking meaningful trends or clinically significant differences. A more nuanced interpretation acknowledges the degree of uncertainty, the effect size, and the study context rather than reducing the result to a dichotomized conclusion. 44
Bayesian analysis, on the other hand, enables clinicians to weigh new findings against prior knowledge and evidence. Some researchers have argued for Bayesian approaches in such trials, where probability distributions represent the degree of belief in various outcomes rather than relying on dichotomizing significance threshold.45,46 This approach allows researchers to consider results within a more comprehensive context, accounting for prior knowledge and evidence, rather than relying solely on a strict cutoff. 46
The greatest challenge and focus on debate using the Bayesian approach is the choosing of prior probability distribution against which the observed study data is interpreted. The choice of prior is crucial as it influences the results, especially when the sample size is small. If the prior is too strong or poorly justified, it can bias the conclusions, making the results more reflective of the prior assumptions than the actual data. On the other hand, if the prior is too vague, it may add little value, making the Bayesian analysis resemble traditional frequentist methods. The concept of the Bayesian analysis is further illustrated in Fig. 2.
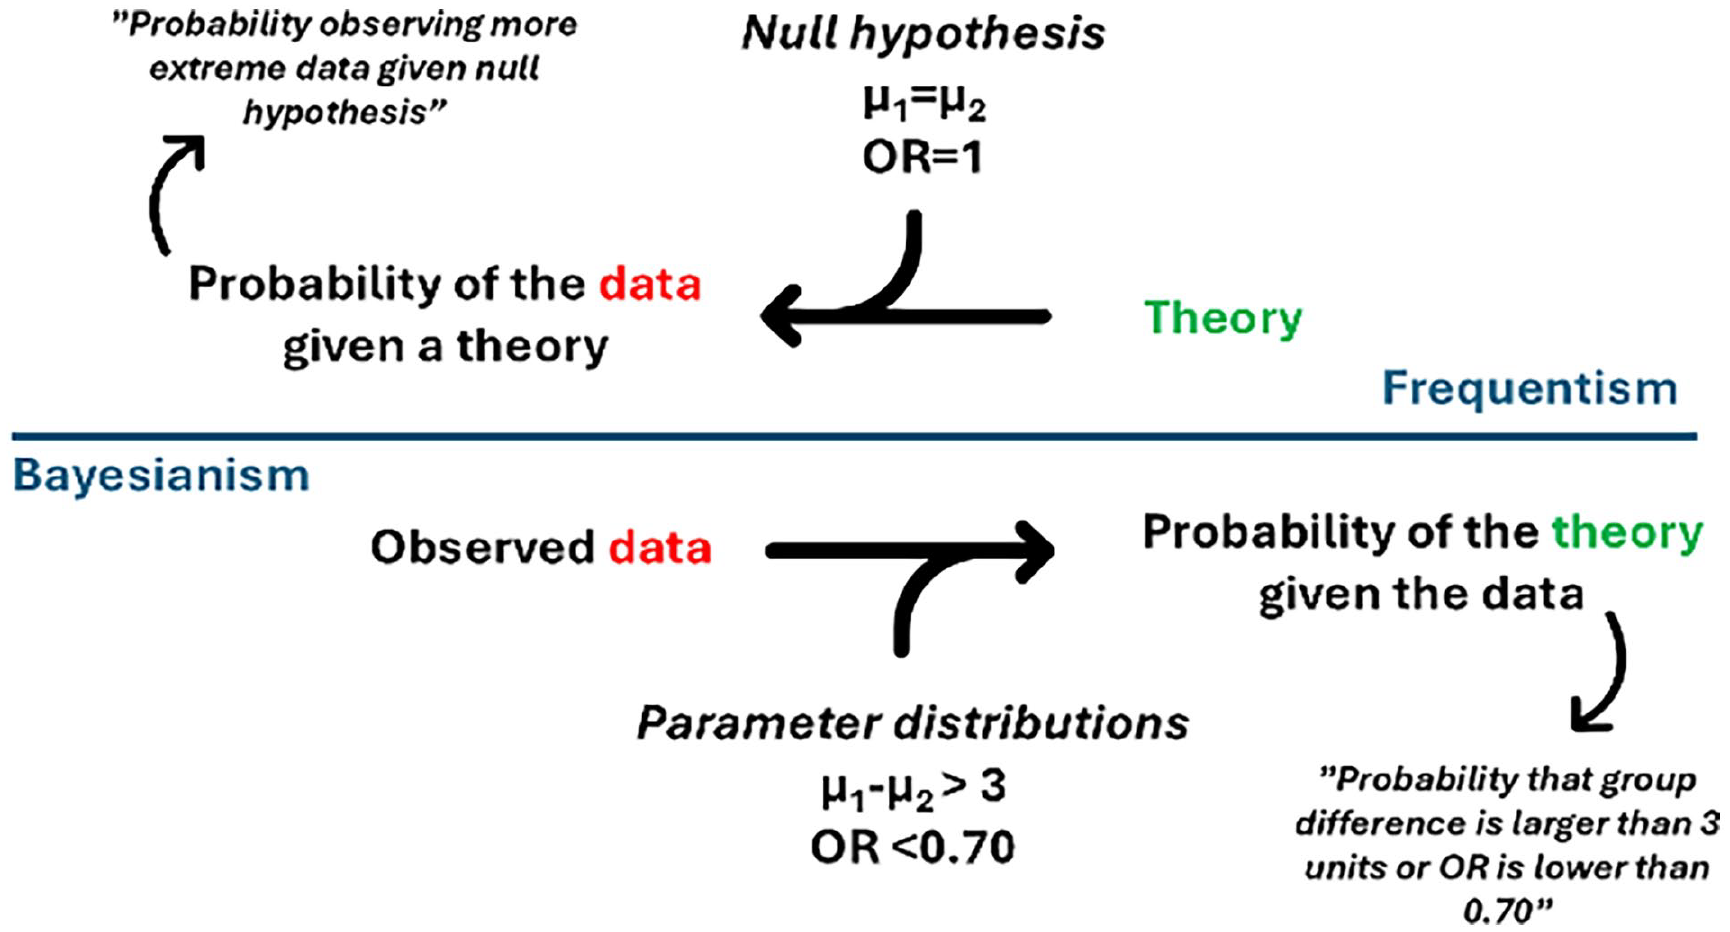
The concept of the Bayesian analysis.
The pitfalls of dichotomizing continuous variables
Along with the continuous nature of biological processes, analyzing continuous variables, such as age, operative time, surgical delay, or body mass index, is a key component in surgical research. However, an unfortunate yet common practice is to dichotomize continuous variables by categorizing them into binary groups, such as “high” versus “low” or “normal” versus “abnormal.” This approach is often chosen because it is thought to simplify data analysis, make results easier to interpret for clinical decision-making, and align with predefined thresholds commonly used in practice, such as diagnostic cut-offs. However, although convenient, dichotomization can lead to a loss of information and introduce potential biases. Despite this approach’s limitations to the results of the analyses, it has been and is still a common approach in clinical research, and some statistical models, such as decision tree methods, require that all variables be dichotomized before or during implementation.47–49
The primary drawback of categorizing continuous variables is the substantial loss of information in which researchers discard much of the variability in the data, making it harder to detect significant associations 50 (Fig. 3). Continuous variables contain a wealth of data, representing a range of values that capture nuances and variations within the population.50,51 When these values are forced into binary categories, this granularity and finer distinctions are lost, which leads to underestimating the effect size by averaging out differences within each category and obscuring meaningful trends by collapsing different values into broad groups.50,51 In addition to the aforementioned, the sample size within each category is effectively reduced, which has a major effect on the statistical power of the analysis. 51 Clinically, this loss of granularity is significant because it can obscure meaningful dose-response relationships, making it difficult to determine at what level an intervention becomes beneficial or when risk factors start to have a clinically relevant impact. Dichotomization may also increase the risk of a positive result being a false positive despite the statistical power lost during the dichotomization process. 52 Also, the relationship between a continuous risk factor and a health outcome might be non-linear with various forms (e.g. exponential, sigmoid, or U-shaped patterns) or involve interactions with other variables, which lead to incorrect inferences about the nature of the relationship when dichotomized. 51 When dichotomizing, it is crucial to consider the possibility of non-linearity; otherwise, the results may be biased and fail to represent the underlying relationship. The possibility of non-linear associations needs to be addressed with adequate statistical methods.53,54
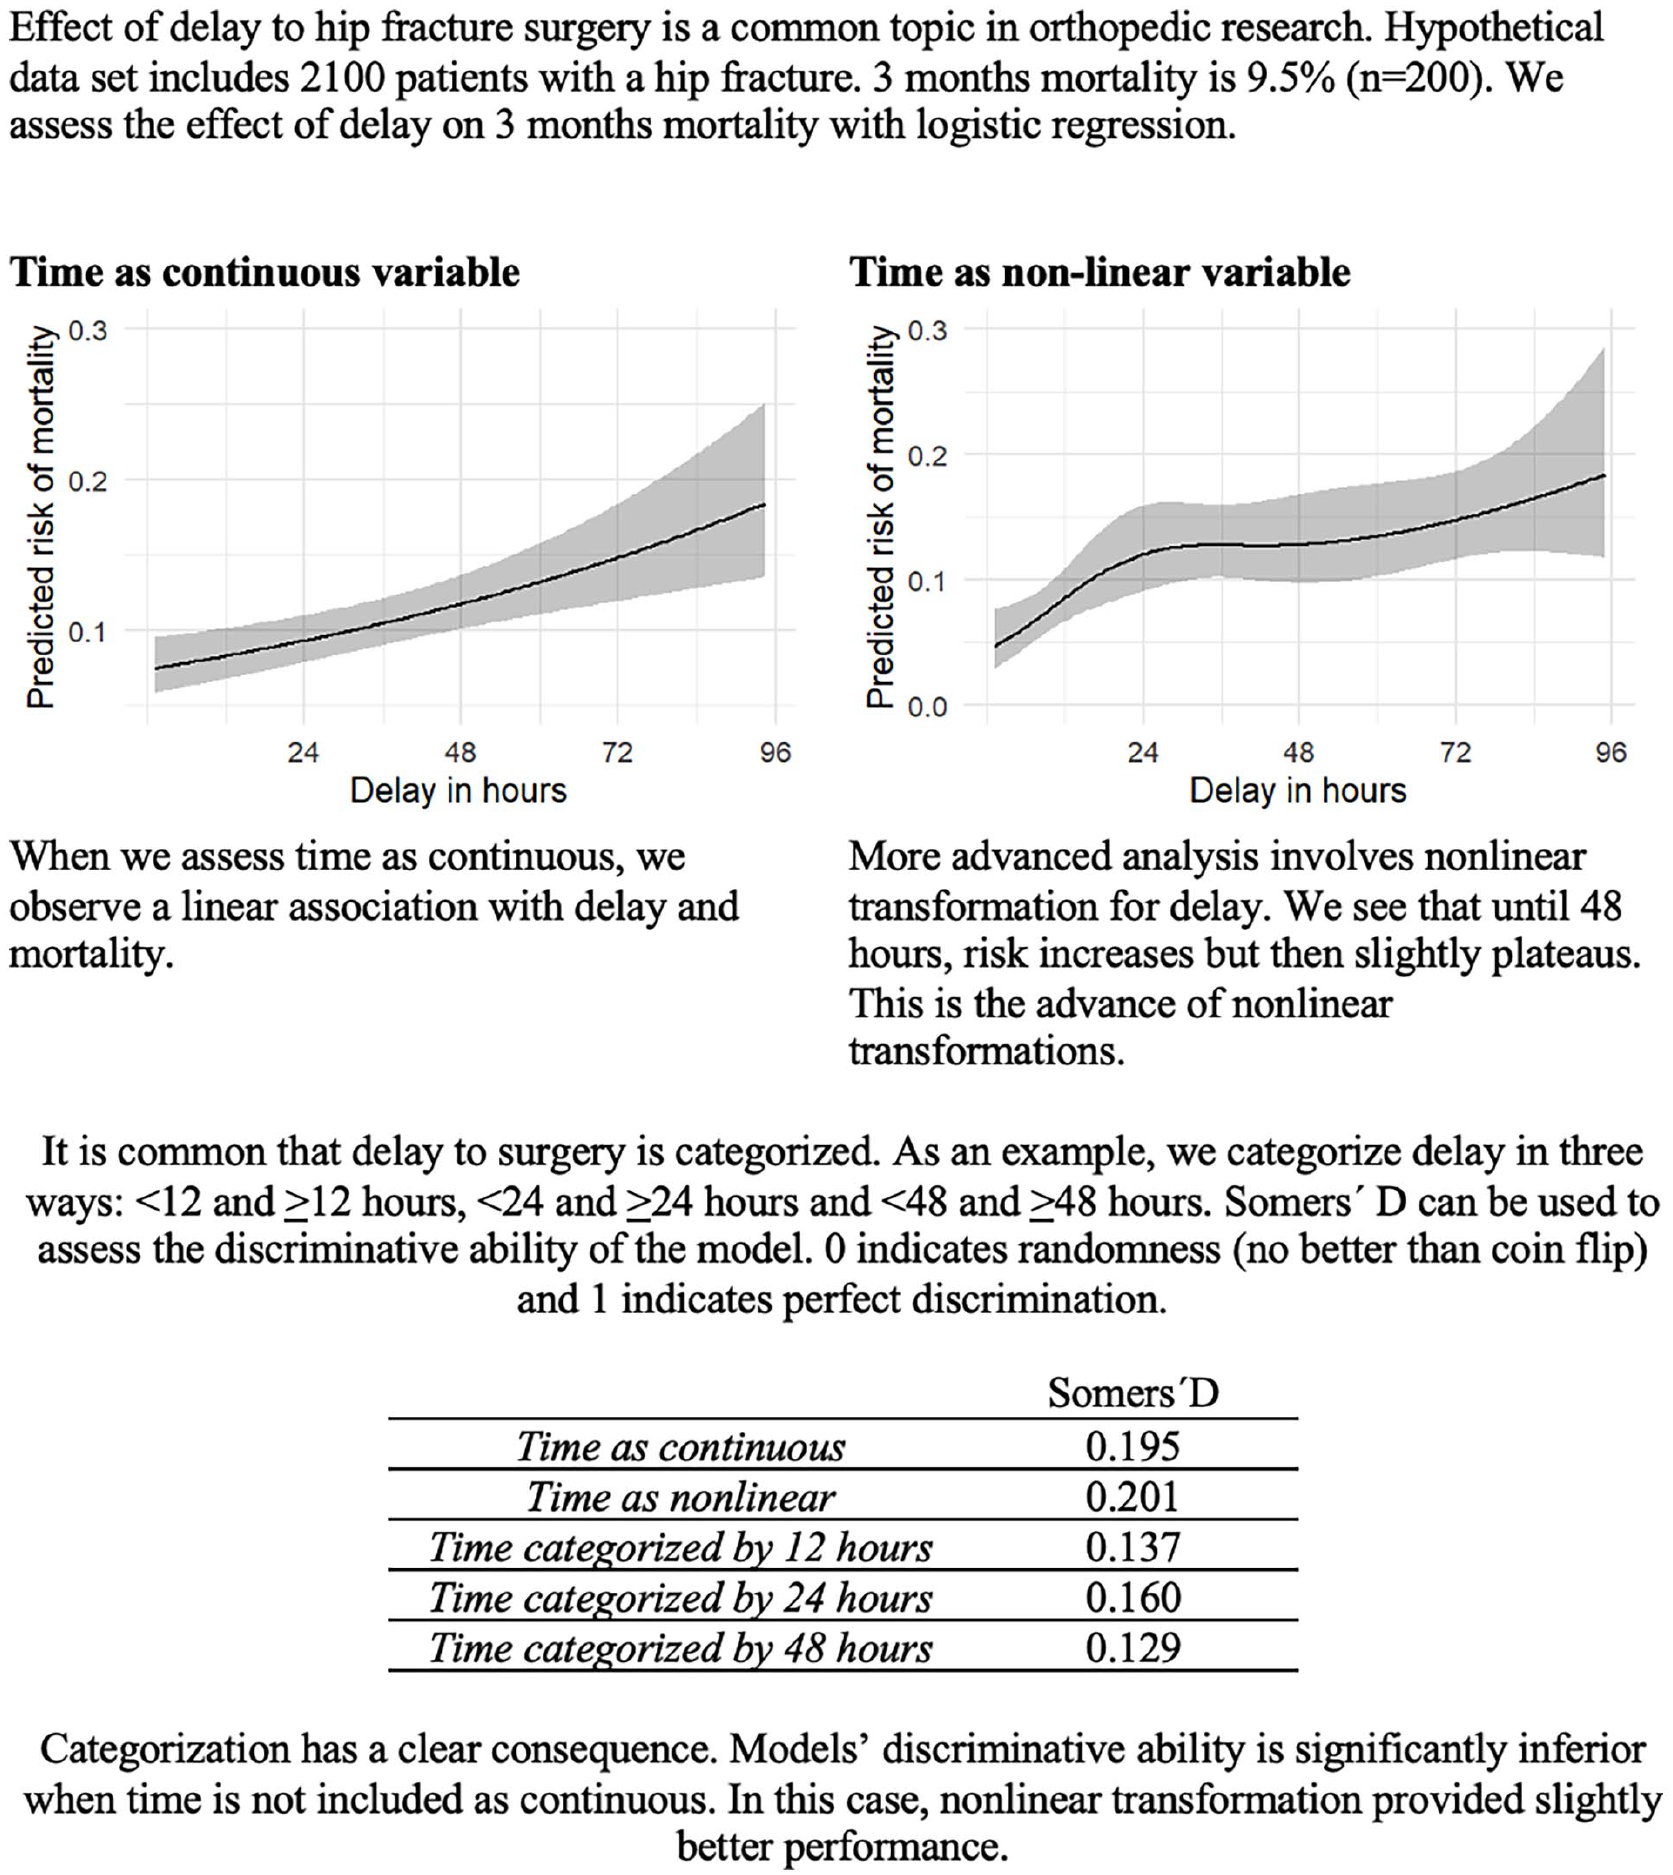
Effect of categorization and nonlinear transformation of the continuous data to the statistical power.
Another problem is that dichotomizing continuous variables always requires selecting a threshold to divide the variable into two categories. This means that all values above a certain threshold are treated equivalently, disregarding the differences between them. This makes it harder to accurately estimate the relationship between the variable and the outcome. For example, if a study finds that higher age (over 65 years) is a risk factor for complication, it means that both patients aged 66 and 92 are considered to have similar age-related risk profiles. Similar challenges occur when dichotomizing continuous variables with e.g. U-shaped association. For example, BMI often follows a U-shaped association with surgical complications, where both underweight and morbidly obese patients have higher risks compared to those with a normal BMI.55,56 Even though there are statistically grounded methods available for determining cut-off points in specific contexts and in some cases the use of cut-off points can be justified, the threshold is often chosen arbitrarily or based on conventions that may not be scientifically justified. 57 However, the choice of this cut-off point can be contentious and may not accurately reflect the underlying biology or risk. Moreover, small changes in the chosen threshold can lead to significantly different results, making the findings highly sensitive to the threshold selection. 57 A binary split – such as dividing at the median – compares groups of individuals with high or low measurement values. However, there is typically no valid reason to assume an underlying dichotomy exists, and if such a dichotomy does exist, there is no justification for it being precisely at the median. 58 In fact, dichotomizing a variable at the median decreases statistical power as much as if one were to discard one-third of the data.58,59
Moving forward from traditional risk factor research
“Field of risk factors is relatively well ploughed” as Kayes and Galea have stated. 60 In surgery, traditional risk factor research focuses on identifying and analyzing patient- and procedure-related factors that contribute to surgical complications, morbidity, and mortality using multivariable models, where all possible or baseline variables of interest are entered into the model and those that achieve statistical significance are declared as risk factors. 61 In real life, however, traditional risk factor studies give very little information about the actual amplitude of the risk effect and the causality. However, this does not mean that all risk factor research should be abandoned. High-quality, methodologically robust studies with clearly defined aims can still play a vital role, particularly in generating hypotheses about new risk factors for more advanced investigations. These studies are essential when they provide a foundation for developing predictive models or addressing clinically meaningful questions.
The definition of risk factors varies depending on the research question. 62 Statistically, a risk factor is simply a variable associated with another variable, usually an outcome variable. 62 It is important to understand that an established risk factor is not necessarily a cause for the outcome of interest. As said, the risk factor merely represents an association without any assumptions about causation. Usually, the research objective is either diagnostic, prognostic, focusing on treatment effect, or etiological. In each type, the risk factor has a different meaning. In prognostic studies, risk factors can be further divided into fixed or modifiable. 63 Without a clear definition in clinical studies, risk factor studies often lead to inefficient research.61,64 If readers are unclear about how a risk factor is defined or its intended use within a study, the findings may lack actionable value or fail to inform clinical practice.61,64
Risk factor estimates are often expressed as relative effects, such as odds ratios or hazard ratios. In isolation, these values have little relevance for everyday clinical decision-making. 65 Certain variables may increase the risk two-fold, but if the baseline absolute risk is 0.3% at 10 years, it is probably of little clinical relevance. Relative effect measures, such as odds ratios measures are only applicable in decision-making if baseline risk is known. The odds ratio is the common risk factor result as it is the primary estimate extracted from logistic regression, one of the most used analytical approaches. 66 Odds ratios can mislead as they cannot be applied to the baseline risk of an outcome. 67 Even in those cases, the applicability becomes complicated if two relative effects should be evaluated. This means that it is most useful to estimate the overall absolute risk of outcome conditioned on the baseline variables. This is best achieved with clinical prediction models. Estimating the overall absolute risk of outcome conditioned on the baseline variables is most valuable. In general, this information is also rarely provided in the risk factor studies.
By 2025, traditional risk factor studies will face increasing limitations in identifying truly novel or clinically impactful factors. While such studies have contributed valuable insights, their analytical approaches often lead to inefficiencies and challenges in bringing the findings into practical applications. Many risk factor studies lack a clear pathway to improving surgical care, reducing their impact on advancing clinical practice. With decades of traditional risk factor research behind us and the growing adoption of predictive analytics and modeling, it is worth considering how the field can evolve. 60 A more refined approach emphasizes the estimation of absolute risk rather than relying solely on relative measures, ensuring whether the findings are clinically important. In addition, risk factor research should focus on distinguishing between explanatory analyses that aim to establish causal relationships and predictive models that provide clinically relevant risk stratification. When conducted with these considerations in mind, risk factor research can continue to play an important role in advancing surgical science while offering insights that are better applicable in clinical decision-making.
Predictive multivariable modeling versus explanatory modeling
A fundamental aspect of any multivariable model is the definition of the proposed approach used in the analysis64,68 as statistical models do not inherently distinguish between correlation and causation. 69 It can be a predictive, explanatory, or estimation. Due to vague definitions, the most common mix-up in risk factor research is the conflation of predictive and explanatory analysis. The predictive approach aims to answer “what will happen in the future” given the baseline variables or risk factors. An explanatory approach aims to establish causal relationships between a predictive factor and an outcome. Estimation, on the other hand, focuses on quantifying the strength of associations, such as measuring the effect size of a risk factor on an outcome or estimating population parameters from sample data. Conflation of these approaches has led to a high number of research without actual clinical benefit. 61
As said, risk factor information alone does not provide insight into whether a relationship is predictive, explanatory, or an estimation. Usually, there is a specific outcome of interest, such as complication, reoperation, or a continuous variable such as a patient-reported outcome measure. The focus is on how precisely a set of predictor or baseline variables predicts the desired outcome. For example, this information can be used in treatment selection if the model is performing well. In this framework, confounding and mediating are not relevant topics. More critical are analytical aspects such as calibration, overfitting, and event per variable ratio, which Steyerberg et al. 70 also discuss. Model performance measures such as AUC (Area Under the Curve), which assesses the model’s ability to distinguish between different outcomes, pseudo-R², which estimates how well the model explains the variability in the data, c-index, which quantifies the concordance between predicted and actual outcomes, and variable importance, which identifies which predictors contribute most to the model, are relevant results in this framework. In contrast, single regression coefficients, which describe individual predictor-outcome relationships but do not reflect overall model performance, are not of significant interest.71,72
Explanatory or causal modeling means that investigators have a specific exposure and an outcome of interest, and the study aims to assess if exposure is causally related to the outcome. In other words, investigators are interested in “what can we do about it.” This approach has a causal or cause-effect relationship embedded in it. In this approach, proper variable selection is a fundamental aspect. This usually requires advanced methodology to be done correctly. Directed acyclic graphs are one possibility, but different methods have also been proposed.73,74 This methodology is very poorly known in orthopedics, as we showed in our recent review. 75 A common flaw is that investigators take all possible available variables and put them into the model without considering any causality or variable relationships. This is called the Table 2 fallacy or the fallacy of mutual adjustment. 30 A single study can become even more complicated if investigators also use study terminology or language related to purely predictive modeling.
Conclusion
In this review, we examined prevalent statistical practices in surgical and orthopedic research, including null-hypothesis significance testing, dichotomization of the study results, reporting of negative findings, fishing and HARKing, dichotomization of continuous variables, risk-factor centered research, as well as prediction and explanation in the context of multivariable modeling.
We highlighted the inherent limitations of p-values, particularly the binary threshold of 0.05, which leads to oversimplified interpretations that can obscure clinical significance. Instead of p-values, we advise the usage of estimation techniques, as confidence intervals offer a more informative alternative, providing insights into the effect size and its precision. Similarly, we discussed the drawbacks of dichotomizing continuous variables, which reduce data richness, risk misinterpretation, and can obscure important patterns, such as U-shaped relationships. Furthermore, we addressed the shortcomings of risk factor-centered research, which often provides little practical clinical utility due to vague definitions, misinterpretation of predictive versus explanatory analyses, and reliance on relative measures.
We advocate for a shift toward clinically relevant and well-defined research questions, favoring multivariable predictive models with absolute risk estimates for more accurate decision-making.
Footnotes
Author contributions
Availability of data and materials
Not applicable.
Declaration of conflicting interests
The authors declared no potential conflicts of interest with respect to the research, authorship, and/or publication of this article.
Funding
The authors received no financial support for the research, authorship, and/or publication of this article.
Ethics approval and consent to participate
Not applicable.