
Abstract
Background and objective:
Assessing surgical outcomes, notably postoperative complications (PCs), is crucial for healthcare systems. However, reliance on International Classification of Diseases, 10th revision (ICD-10) codes, may be suboptimal. This study aims to compare the accuracy of ICD-10 codes against manual curation of electronic healthcare records (EHRs) for identifying 13 individual PCs and evaluate associated resource utilization.
Methods:
EHR data from 11,827 surgical cases across 18 Danish hospitals in November 2021 were analyzed. PCs were identified and extracted through both manual curation and ICD-10 codes. Outcomes such as readmission, admission days, intensive care unit (ICU) stays, reoperations, and radiology procedures were assessed as proxies for resource consumption. Statistical and economic analyses quantified resource utilization and associated costs.
Results:
In total, 1047 PCs were found through manual curation and 439 PCs were found through ICD-10 codings. Only 218 of the PCs found through ICD-10 codes were retrieved during manual curation—corresponding to a correct ICD-10 coding of 20.8% of PCs. Patients with PCs experienced significantly higher resource utilization, including a 6.6 times higher readmission rate, 6 additional admission days, 2 extra ICU days, 7.7 times more reoperations. PCs incurred substantial economic costs, with additional admission days alone accounting for €25.5 million annually, over four times higher than estimates from ICD-10 codes.
Conclusions:
ICD-10 codes inadequately capture early PCs highlighting the need for improved detection strategies. The actual costs associated with PCs far exceed current estimates, emphasizing the necessity for enhanced monitoring for informed decision-making. In the Danish healthcare system, ICD-10 codes only capture approximately 21% of PCs, making it inadequate for surgical quality monitoring. The actual costs related to PCs, based on study assumptions, are more than four times higher than estimated from current standard. This calls for novel strategies for PC detection to improve healthcare as well as political and financial decision-making.
Introduction
Surgical quality surveillance and improvement is important both for achieving optimal outcomes and resource utilization. Therefore, this has been an important scope in the literature over the last decades. Typically, surgical outcomes are assessed through quantity metrics such as hospital length of stay and 30-day mortality rates, with more granular insights gained from analyses of postoperative complications (PCs), used as a proxy-outcome for surgical quality.1–3 Moreover, PCs are the primary indicator of expenses for hospitals with notably higher costs linked to the severity and complexity of PCs.1,4–6 A systematic review of 38 studies across various surgical specialties from 2013 concluded that complications lead to increased use of resources and said costs emerge primarily from prolonged admission. 1 Traditionally, these PCs are evaluated through sources of administrative data. This includes data such as ICD-10-codes or insurance claims—sources which are easily accessible, readily computable, and low in costs. 7 While this is a quick and convenient way of evaluating surgical quality, it may lack accuracy. Several studies comparing sources of administrative data to manual review of PCs found that administrative data severely underreports postoperative outcomes and furthermore, lacks sensitivity and positive predictive value (PPV). 8 In addition, studies have shown particularly low agreement between administrative data and manual reviewed data when classifying PCs.8–11
The lack of consistent quality data on surgical outcomes outside of dedicated surgical registries such as the US National Surgical Quality Improvement Initiative (NSQIP), complicates an evidence-based approach to quality improvement, and low-quality data could even have a negative impact. This issue becomes even more pressing for healthcare systems currently experiencing unprecedented shortages of staffing and dwindling financial resources. 12
While the poor correlation between ICD-10 codes and actual occurrences has been well described in the United States, 8 comparatively little is known of ICD-10 codes versus actual PC rates in European healthcare systems. Furthermore, resource utilization associated with PCs as well as the gap between this when assessed through ICD-10 codes versus actual occurrences, remain unknown.
Analyzing data from the Danish healthcare system,13,14 we hypothesized that ICD-10 codes fail to capture PCs compared with manual curation, and that these PCs are associated with a considerable increase in resource utilization in the form of prolonged hospital admissions, reoperations, and radiology procedures.
Methods
Data source and ethical approvals
The study was approved by the relevant Institutional Review Board for retrospective patient chart review in Denmark, the Danish Patients Safety Board (Styrelsen for patientsikkerhed, approval #31-1521-182). Data access and security was approved by the Danish Capital Region Data Safety Board (Videncenter for dataanmeldelser, approval #P-2020-180). In accordance with Danish law, patient consent is not mandated for retrospective chart studies upon obtaining the above-mentioned permissions. The study was conducted according to the Strengthening the Reporting of Observational Studies in Epidemiology (STROBE) guidelines. 15
This study was based on data from electronic healthcare records (EHRs) from patients admitted to a hospital within two regions of Denmark (the Capital and the Zealand region) within a 30-day period from 1 November to 30 November 2021. The data were obtained through the current EHR system in the two regions, which is based on the EPIC platform. Patients from all 18 hospitals within the two regions were included. The two regions—the Capital and the Zealand region—provides free of charge healthcare to 2.7 million Danish Citizens.16,17 All patients admitted and undergoing a surgical procedure above the ages of 18 were included. This was done to ensure the quality of the dataset as the manual curation was carried out with ACS-NSQIP 2018 PC definitions only applicable to adults. Therefore, the cohort contained patients undergoing a diverse range of procedures encompassing both minor and major surgery as well as elective and emergency interventions. All major surgical subspecialties were included (general, orthopedic, cardiothoracic, vascular, plastic, urology, neurological, otorhinolaryngology, ophthalmic, and oral and maxillofacial surgery, as well as gynecology and obstetrics).
The utilized EHR data included data logged within 30 days of the primary surgical procedure and comprised primarily of medical free text notes such as admission notes, progress notes, procedure notes, and discharge notes. In addition, biochemical values, diagnosis codes, and vital signs were incorporated in the dataset. International Classification of Diseases, 10th revision (ICD-10) codes for both pre-existing diseases as well as occurring complications, procedure codes, start- and end-time for procedure, and demographics information were also included. The ICD-10 codings used for the definition of a PC can be found in Table S1 in Supplementary material.
Postoperative complications
In total, 13 early (within 30 days of primary procedure) PCs were studied: superficial surgical site infection (SSSI), deep surgical site infection (DSSI), organ space surgical site infection (OSSI), wound disruption, pneumonia, pulmonary embolism, urinary tract infection (UTI), stroke, cardiac arrest, myocardial infarction, deep vein thrombosis, sepsis, and septic shock.
Manual curation
We chose manual curation of EHRs as the gold standard relative to ICD-10 codes in assessing a “ground truth.” All cases within the study period were manually curated for the presence of any of the studied 13 PCs. The ACS-NSQIP 2018 PC definitions were applied for the manual curation and are presented in Table S2 in Supplementary data. The manual abstraction was carried out by a team of medical reviewers. In case of disagreement between the reviewers, cases were re-reviewed by a third-party general surgeon.
ICD-10 codes
The ICD-10 codes were defined as all relevant ICD-10 codes describing each of the studied PCs. These are presented in Table S1 in Supplementary data. The ICD-10 codes were documented by a treating physician as part of the daily clinical routine. All codes registered within 30 days postoperatively of the primary procedure were included, regardless of which hospital. This was done to ensure inclusion of patients who might have been operated and treated for a PC at different facilities.
Resource utilization and economic costs
To assess the resource utilization associated with PCs, we chose six different events as proxy outcomes. These events were: admission days (both in total and solely related to the primary procedure), admission days at an intensive care unit, radiology procedures, reoperations, readmission, and mortality. With these six outcomes, we aimed to capture a broad spectrum of resource-consuming events across different dimensions of postoperative care. To estimate the costs associated with PCs, we focused on the costs of one specific outcome: a hospital admission day. While other resource consumption outcomes were assessed, we encountered significant variability and complexity determining costs for the remaining outcomes. Therefore, to ensure the reliability and consistency of our economic analysis, we solely concentrated on the costs of additional admission days. 1 In our calculations, we only utilized the statistically significant results derived from the linear regression models. We obtained data from The Danish Health Data Authority, which establishes diagnosis-related group (DRG) tariffs—standardized rates for healthcare services based on the DRG classification system and used for reimbursement purposes in the Danish healthcare system. As a proxy for the cost of an admission day, we utilized the “per diem rate,” accounting for the cost of one admission day without any additional treatments. This rate covers inpatient hospitalization costs after a certain threshold (trimpoint). 18 The trimpoints are calculated for all DRG-patient group and based on data on admission days and discharge from The National Patient Register (Landspatientregisteret). The per diem rate for patients exceeding the trimpoint was calculated at €310.43 in 2024. 18 Finally, we compared the estimated costs associated with PCs found in manual curation to the estimated costs associated with the PCs found through ICD-10 codes (constituted solely of admission day expenses).
Statistical analysis
Descriptive statistics were performed to present demographics as well as the number of PCs found by ICD-10 codes and manual curation, respectively. Data are presented as medians with interquartile ranges [Q1–Q3] or percentages where suitable. Results for resource consumption outcomes for each PC (Fig. 3A to F) are presented as either means or factor depending on the outcome variable. Diagnostic performance metrics in terms of sensitivity, specificity, PPV, and negative predictive value (NPV) of ICD-10 codes when compared to manual curation were calculated.
Furthermore, several regression models were used to assess the studied PCs’ association with the resource consumption outcomes. For the continuous resource consumption outcomes (admission days, intensive care unit (ICU days, radiology exams, and reoperations), linear regression models were developed for associating these outcomes with the presence or absence of the given complication while controlling for presence or absence of the other registered complications. For the binary resource consumption outcomes, logistic models were developed in a similar manner. The analyses results are presented as either β-coefficient with 95% confidence intervals (CIs) for linear regression models or odds ratio (95% CI) for logistic regression models for each PC along with the respective p-value.
All statistical analysis was performed using Python version 3.8.5 and R version 4.3.2. A p-value < 0.05 was considered statistically significant.
Missing data
To address missing data, several measures were implemented during the preprocessing of the data. Cases with missing start or end time as well as cases with a missing procedure code were all removed prior to any statistical analysis. In addition, only cases with status marked as “completed” within the EHR were included in the study.
Results
Patient demographics
Fig. 1 provides a flowchart overview of patient inclusion and exclusion. In total, 11,827 patients and 85,610 chart notes were available for analyses. An overview of demographic variables and the distribution of cases across various surgical specialties are presented in Table 1. Overall, 55.3% of patients were female, and the median age was 63 years. The median American Society of Anesthesiologists (ASA) score was 2. The largest surgical specialty was orthopedic surgery (23.6%) followed by general surgery (21.9%). Table 1 also displays the distribution of total complications within each surgical specialty.
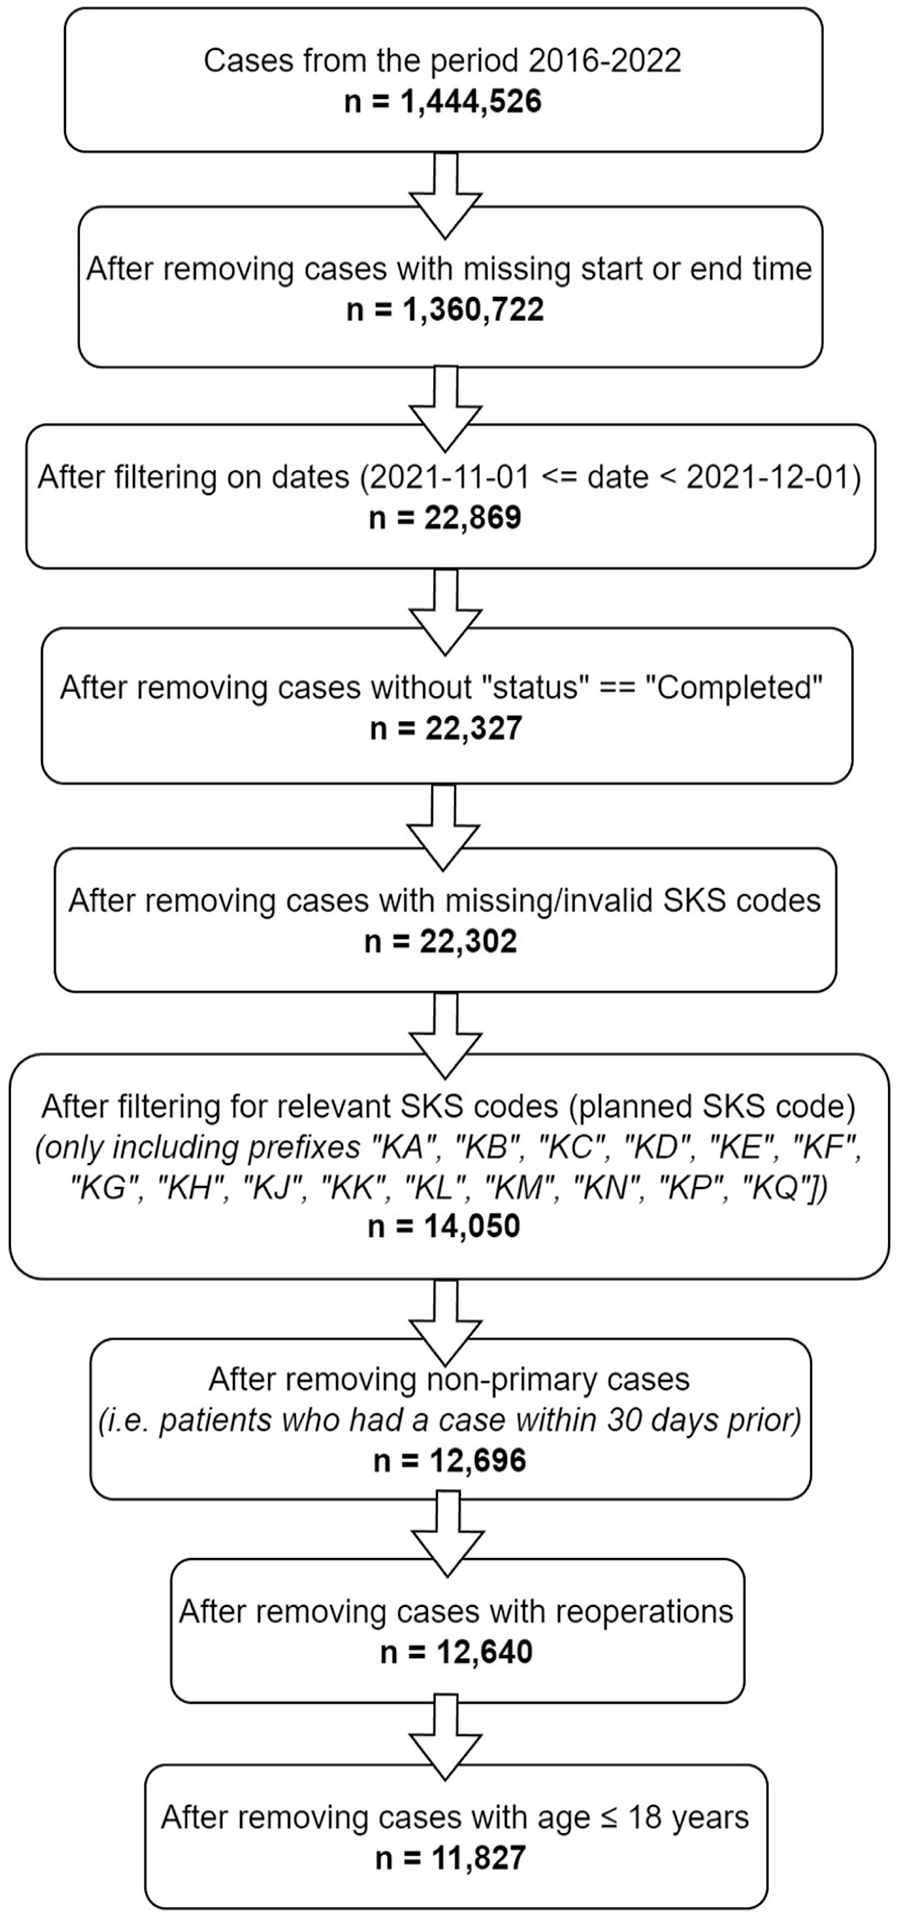
Case flow diagram.
Demographics of the dataset.
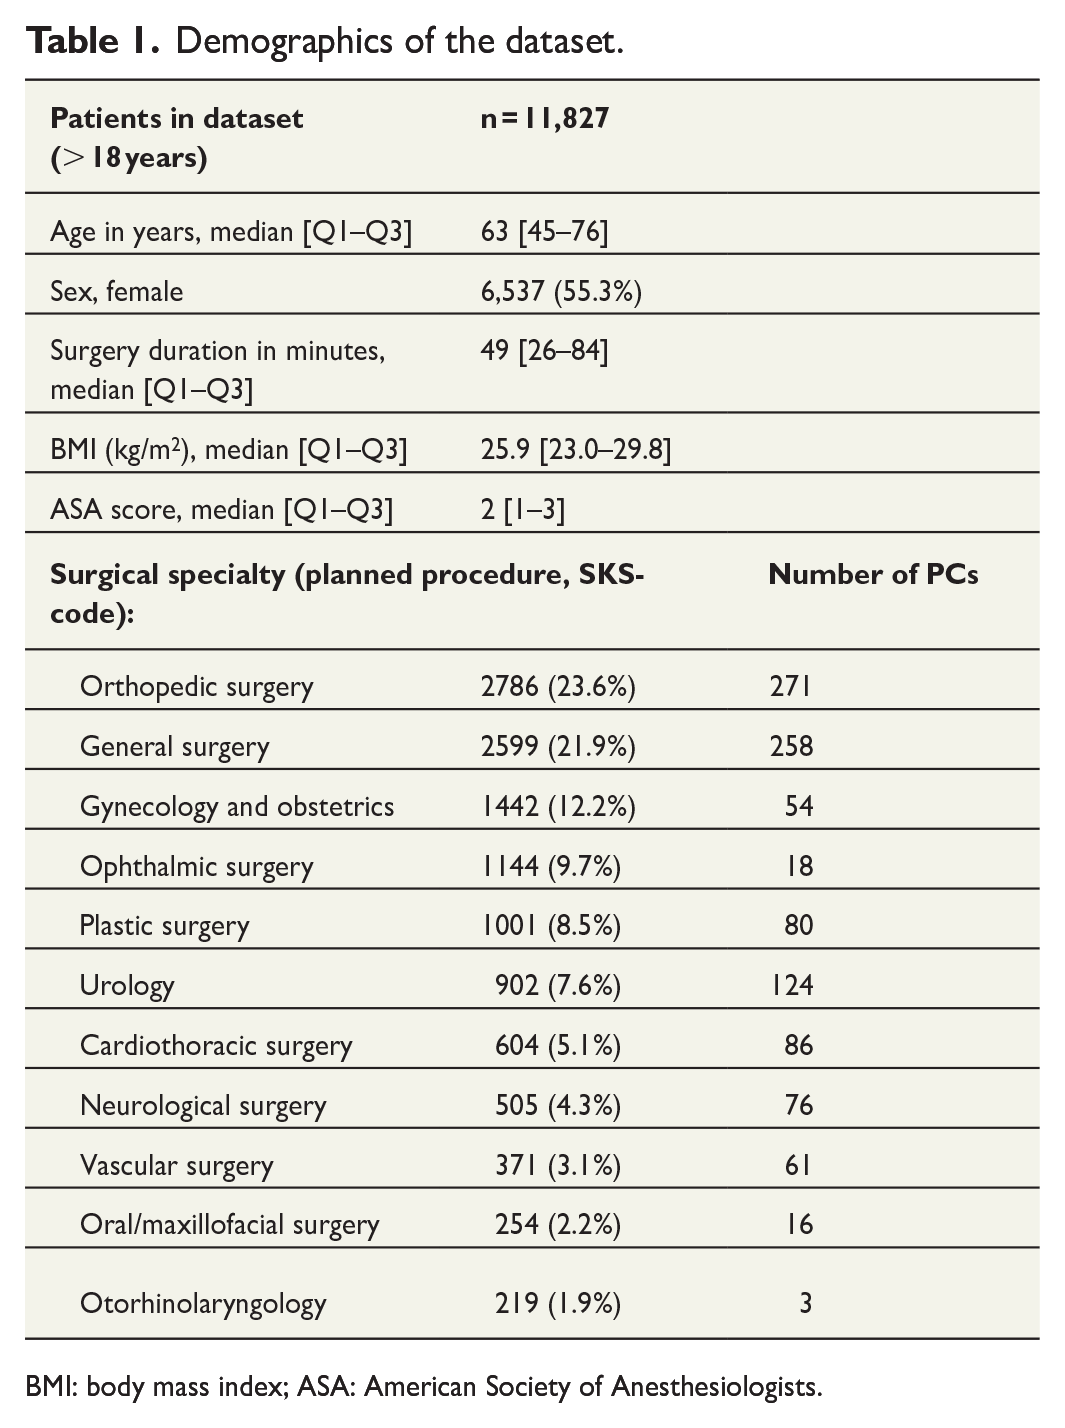
BMI: body mass index; ASA: American Society of Anesthesiologists.
In the total dataset, the number of patients with exactly one complication was 584, the number of patients with two complications was 140, and the number of patients with three or more complications was 53.
Accuracy of PC identification
An overview of PCs as assessed by manual curation and ICD-10 codes is shown in Table 2. Overall, 1047 PCs were found through manual curation, and 439 PCs were found through ICD-10 codes. Of these, only 218 PCs were found both as ICD-10 codes and in manually curated data—corresponding to 20.8% of PCs in the dataset having a correct ICD-10 code. UTI emerged as the predominant PC identified through both ICD-10 codes (n = 81) and manual curation (n = 254). However, only 43 cases were found in both groups—equivalent to only 16.9% of all UTI occurrences correctly registered with an ICD-10 code. Furthermore, 46.9% of UTIs (38 cases) were falsely registered with an ICD-10 code (false positives). Fig. 2 depicts a Venn diagram of all complications found by ICD-10 codes and manual curation both in total and for each specific PC. The overlapping areas represent the cases found in both data extraction methods and thereby represent the percentage of PCs in ICD-10 codes that were correctly identified as a PC.
Postoperative complications in ICD-10 codes versus manual curation.
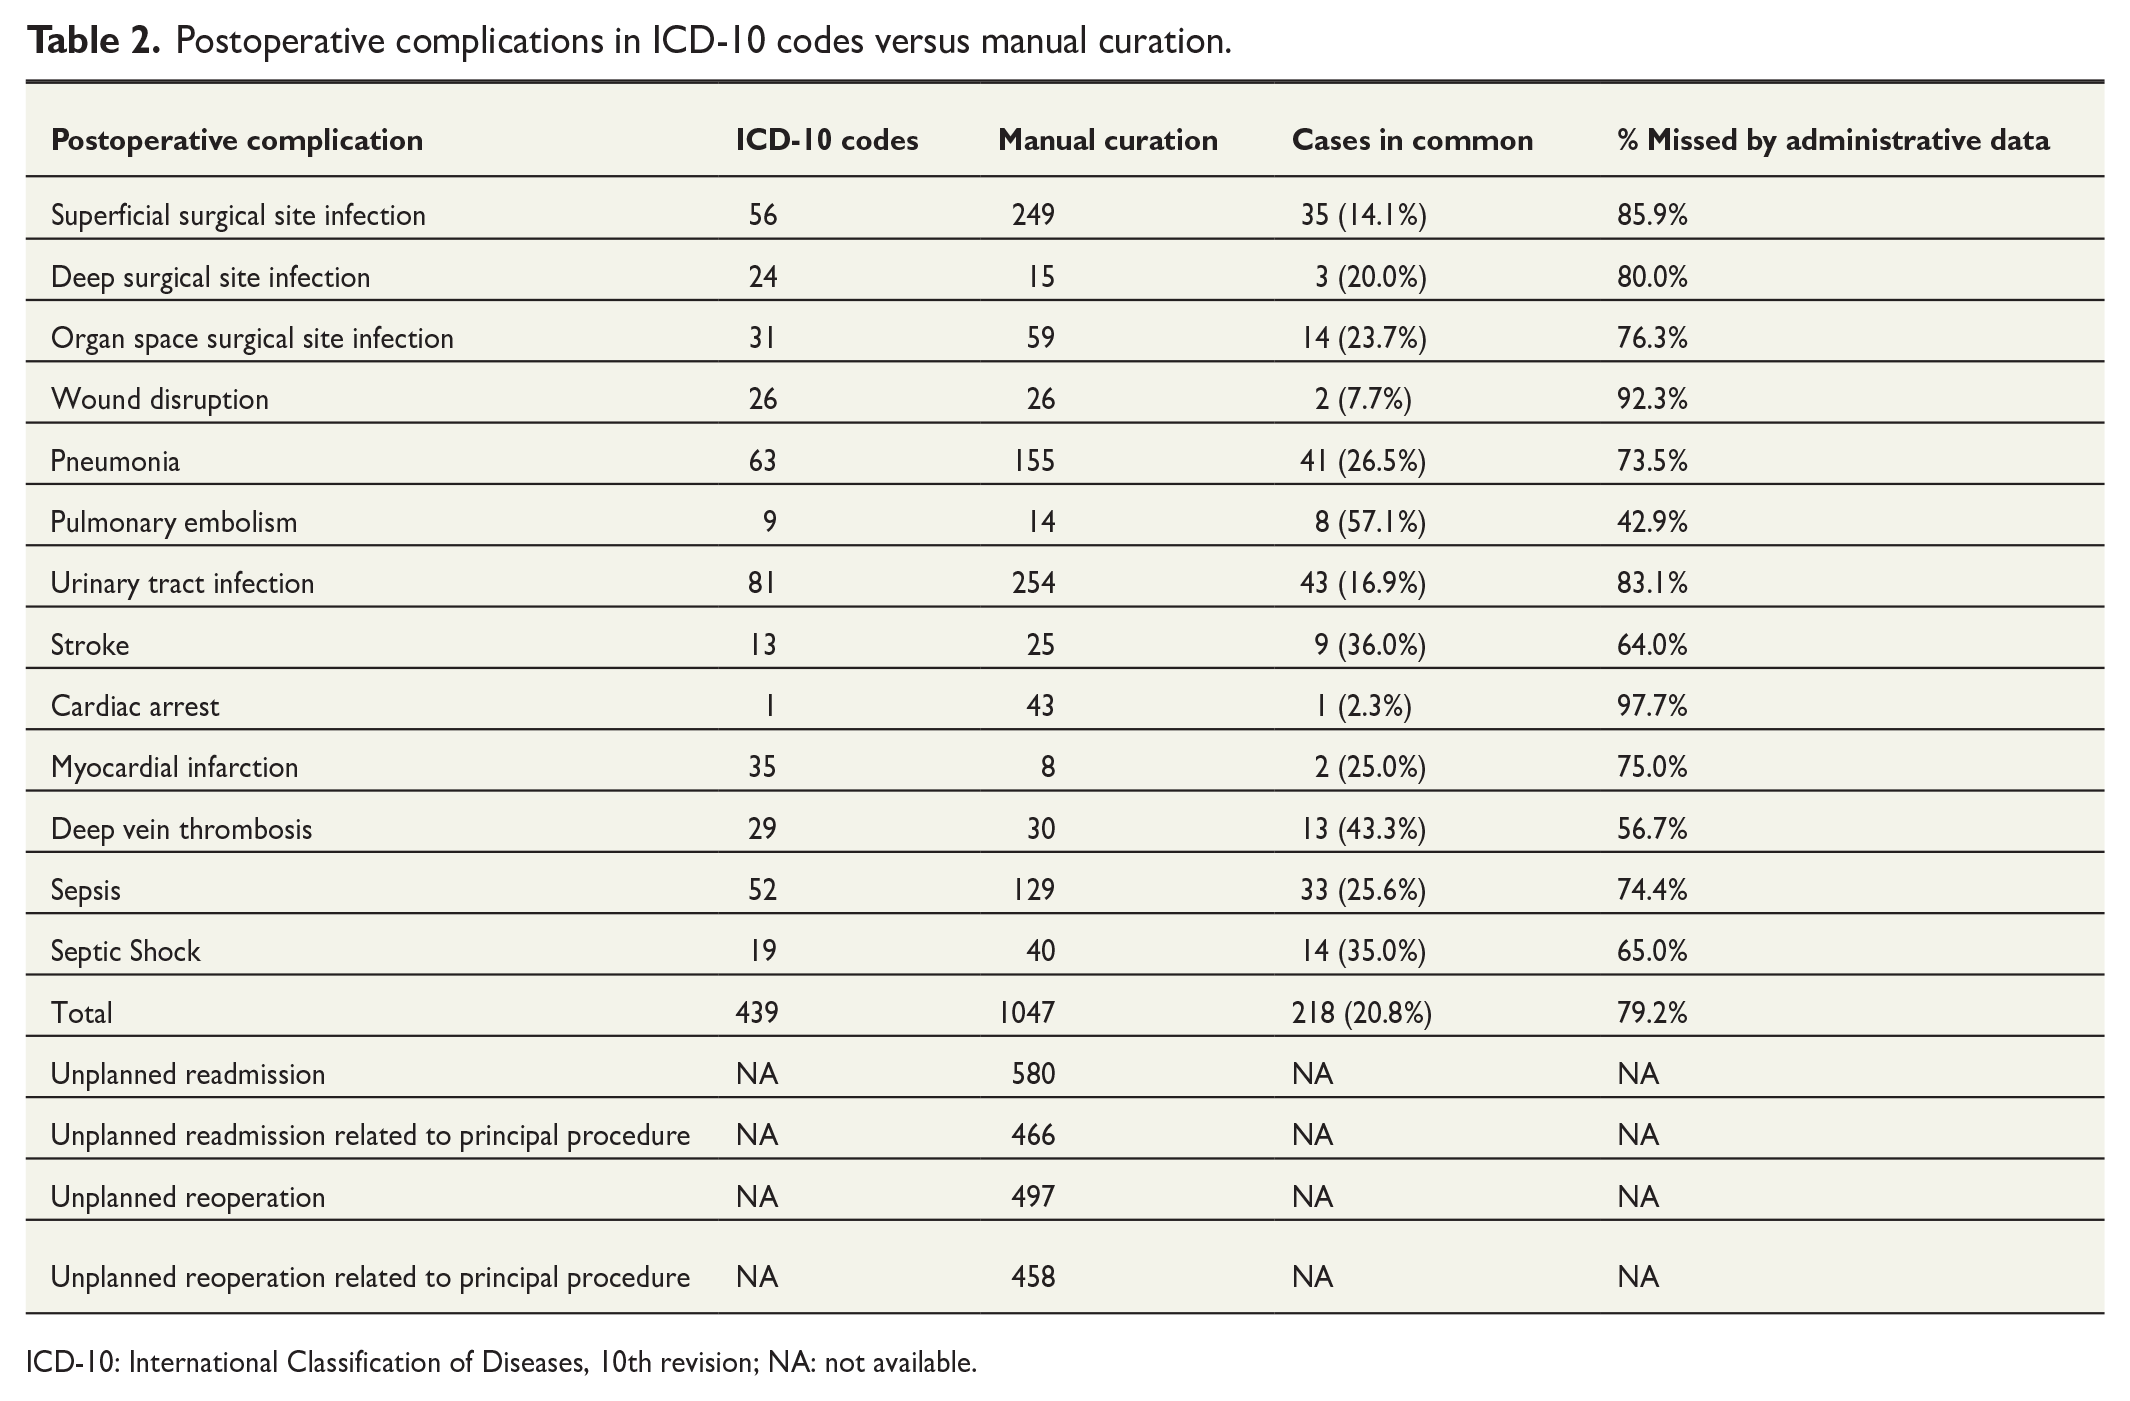
ICD-10: International Classification of Diseases, 10th revision; NA: not available.
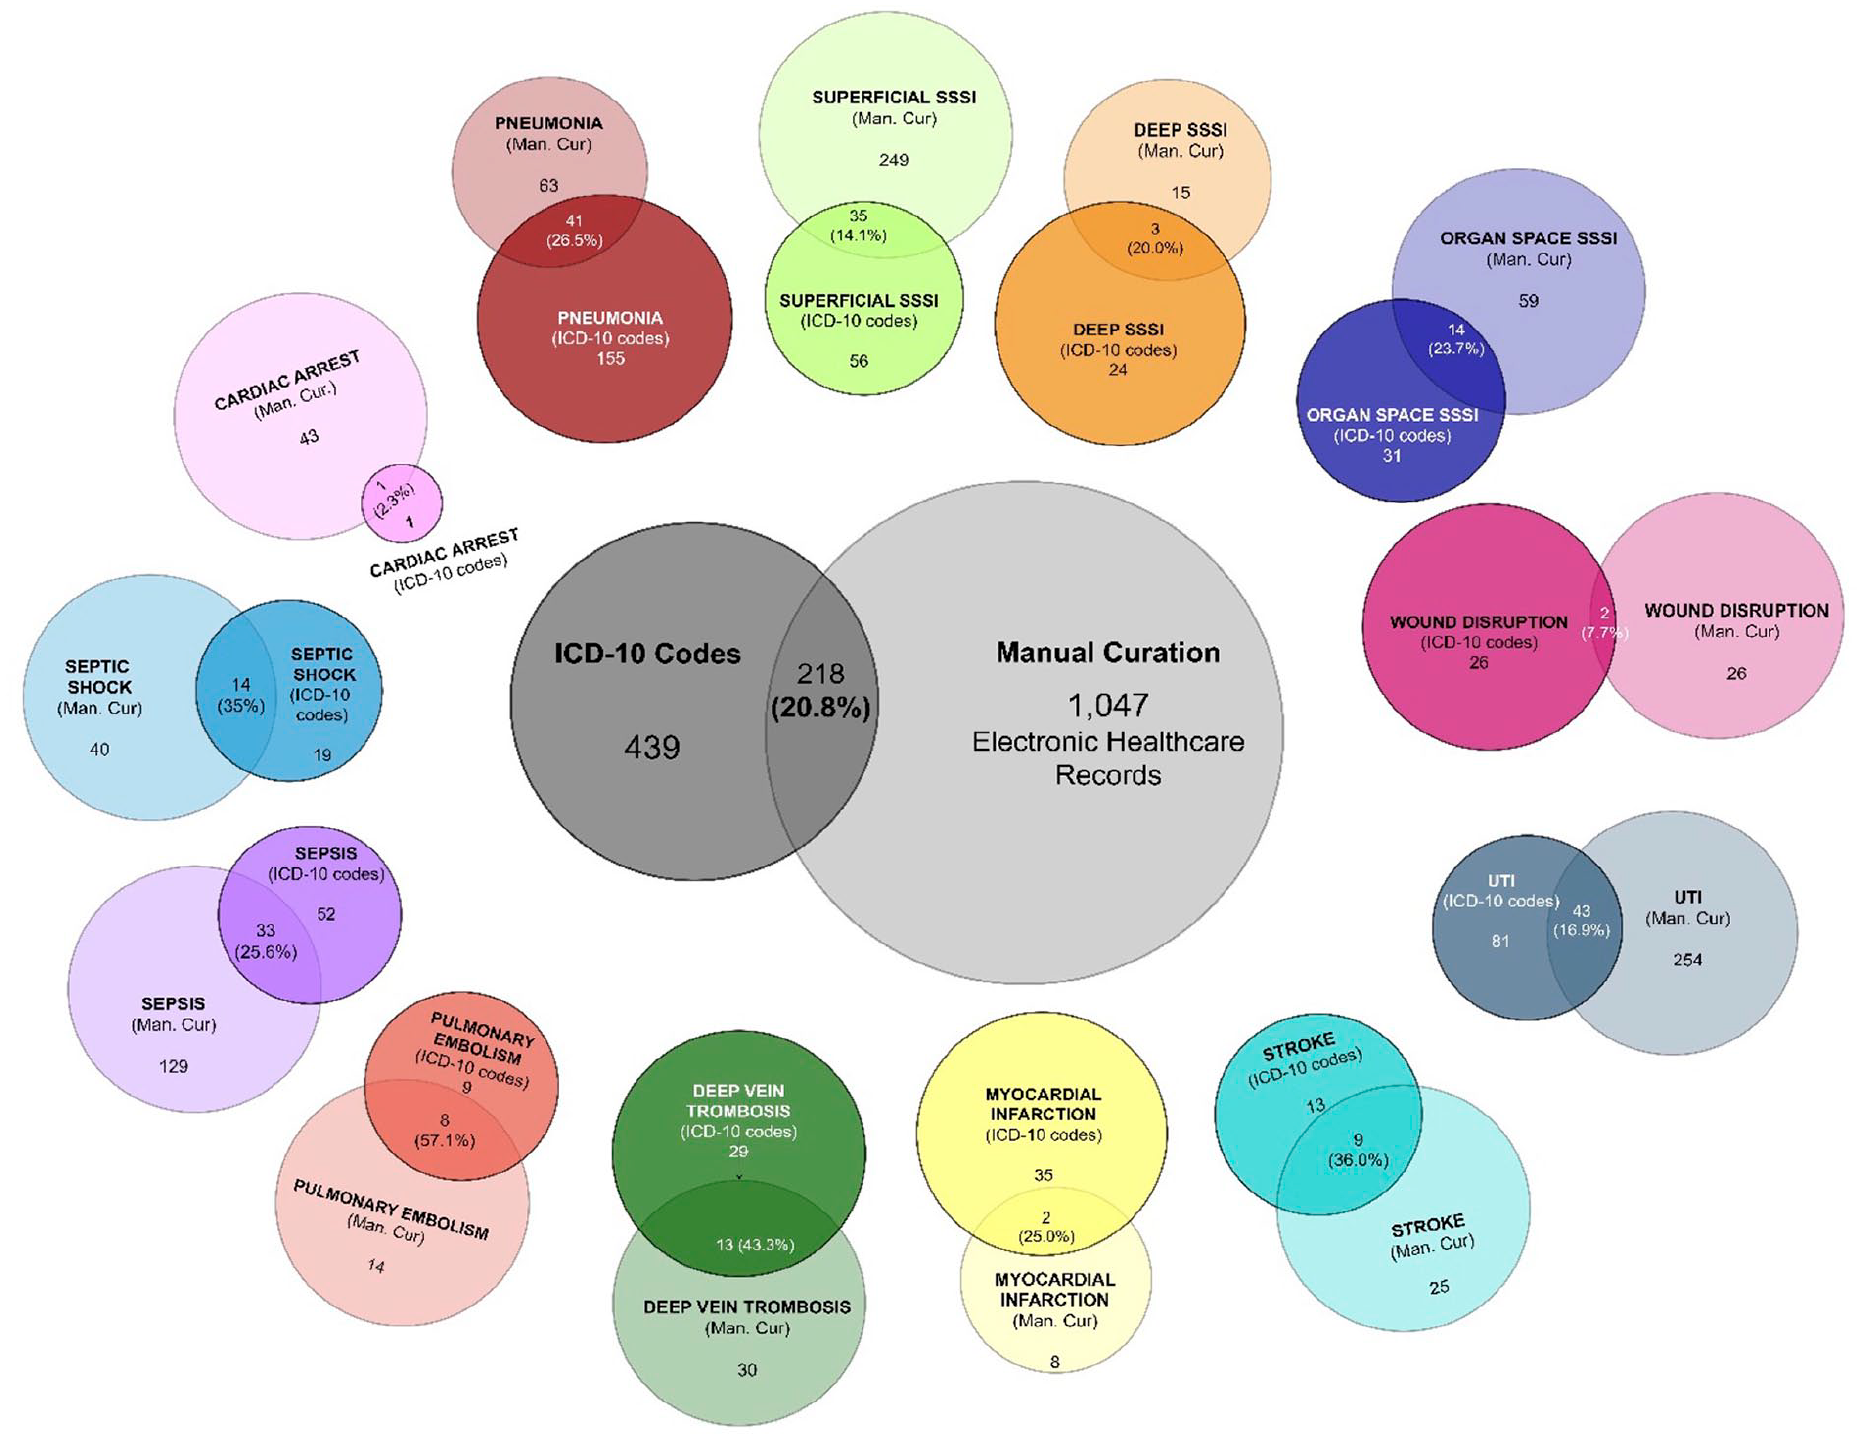
Venn diagram depicting the number of postoperative complications found through ICD-10 codes and manual curation, respectively, as well as the number of PC cases in common. Numbers for both the total amount of PCs and for each specific complication are viewed.
Table 3 lists the sensitivity, specificity, PPV, and NPV for each of the 13 PCs as assessed by ICD-10 codes when manual curation was used as the gold standard. The overall metrics across all PCs were: sensitivity 0.206, specificity 0.980, PPV 0.497, and NPV 0.929. Sensitivity ranged from 0.0233 for cardiac arrest to 0.571 for pulmonary embolism. Specificity ranged from 0.997 for UTI to 1 for cardiac arrest. PPV ranged from 0.077 for wound disruption to 1 for cardiac arrest. Finally, NPV ranged from 0.990 for pneumonia to 0.999 for myocardial infarction and pulmonary embolism.
Diagnostic performance metrics of ICD-10 codes compared to manual curation.
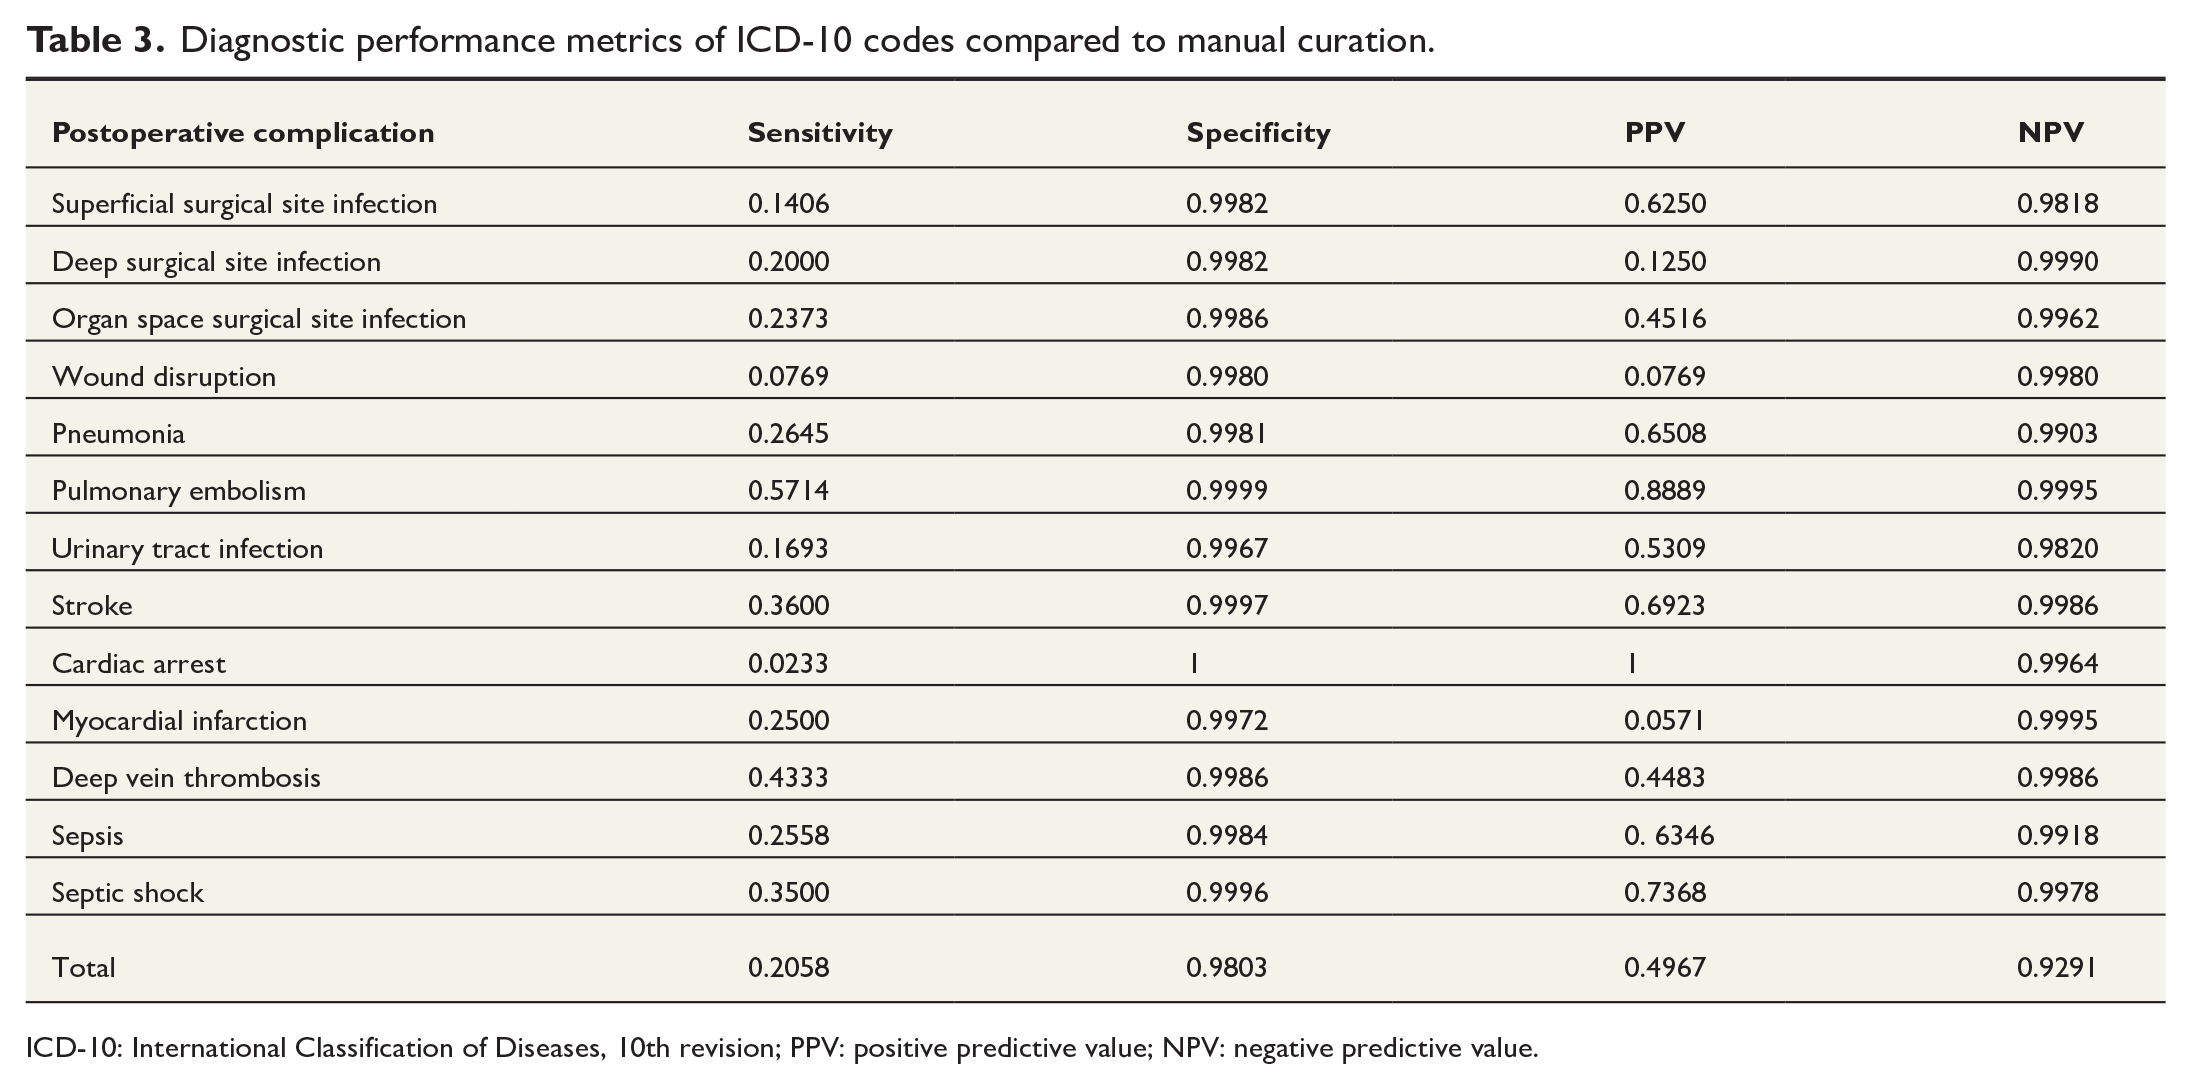
ICD-10: International Classification of Diseases, 10th revision; PPV: positive predictive value; NPV: negative predictive value.
Resource consumption outcomes
Fig. 3 (A to F, respectively) shows histogram plots of the average of the following outcomes: total admission days, admission day count related to primary admission (the primary admission is defined as the patients initial admission, excluding any days of admission related to readmissions), ICU-day count, number of readmissions, reoperation count, and radiology count for every studied PC compared to patients without the specific PC. Overall, patients with any given PC had increased resource consumption on every studied outcome compared to patients without the specific PC.
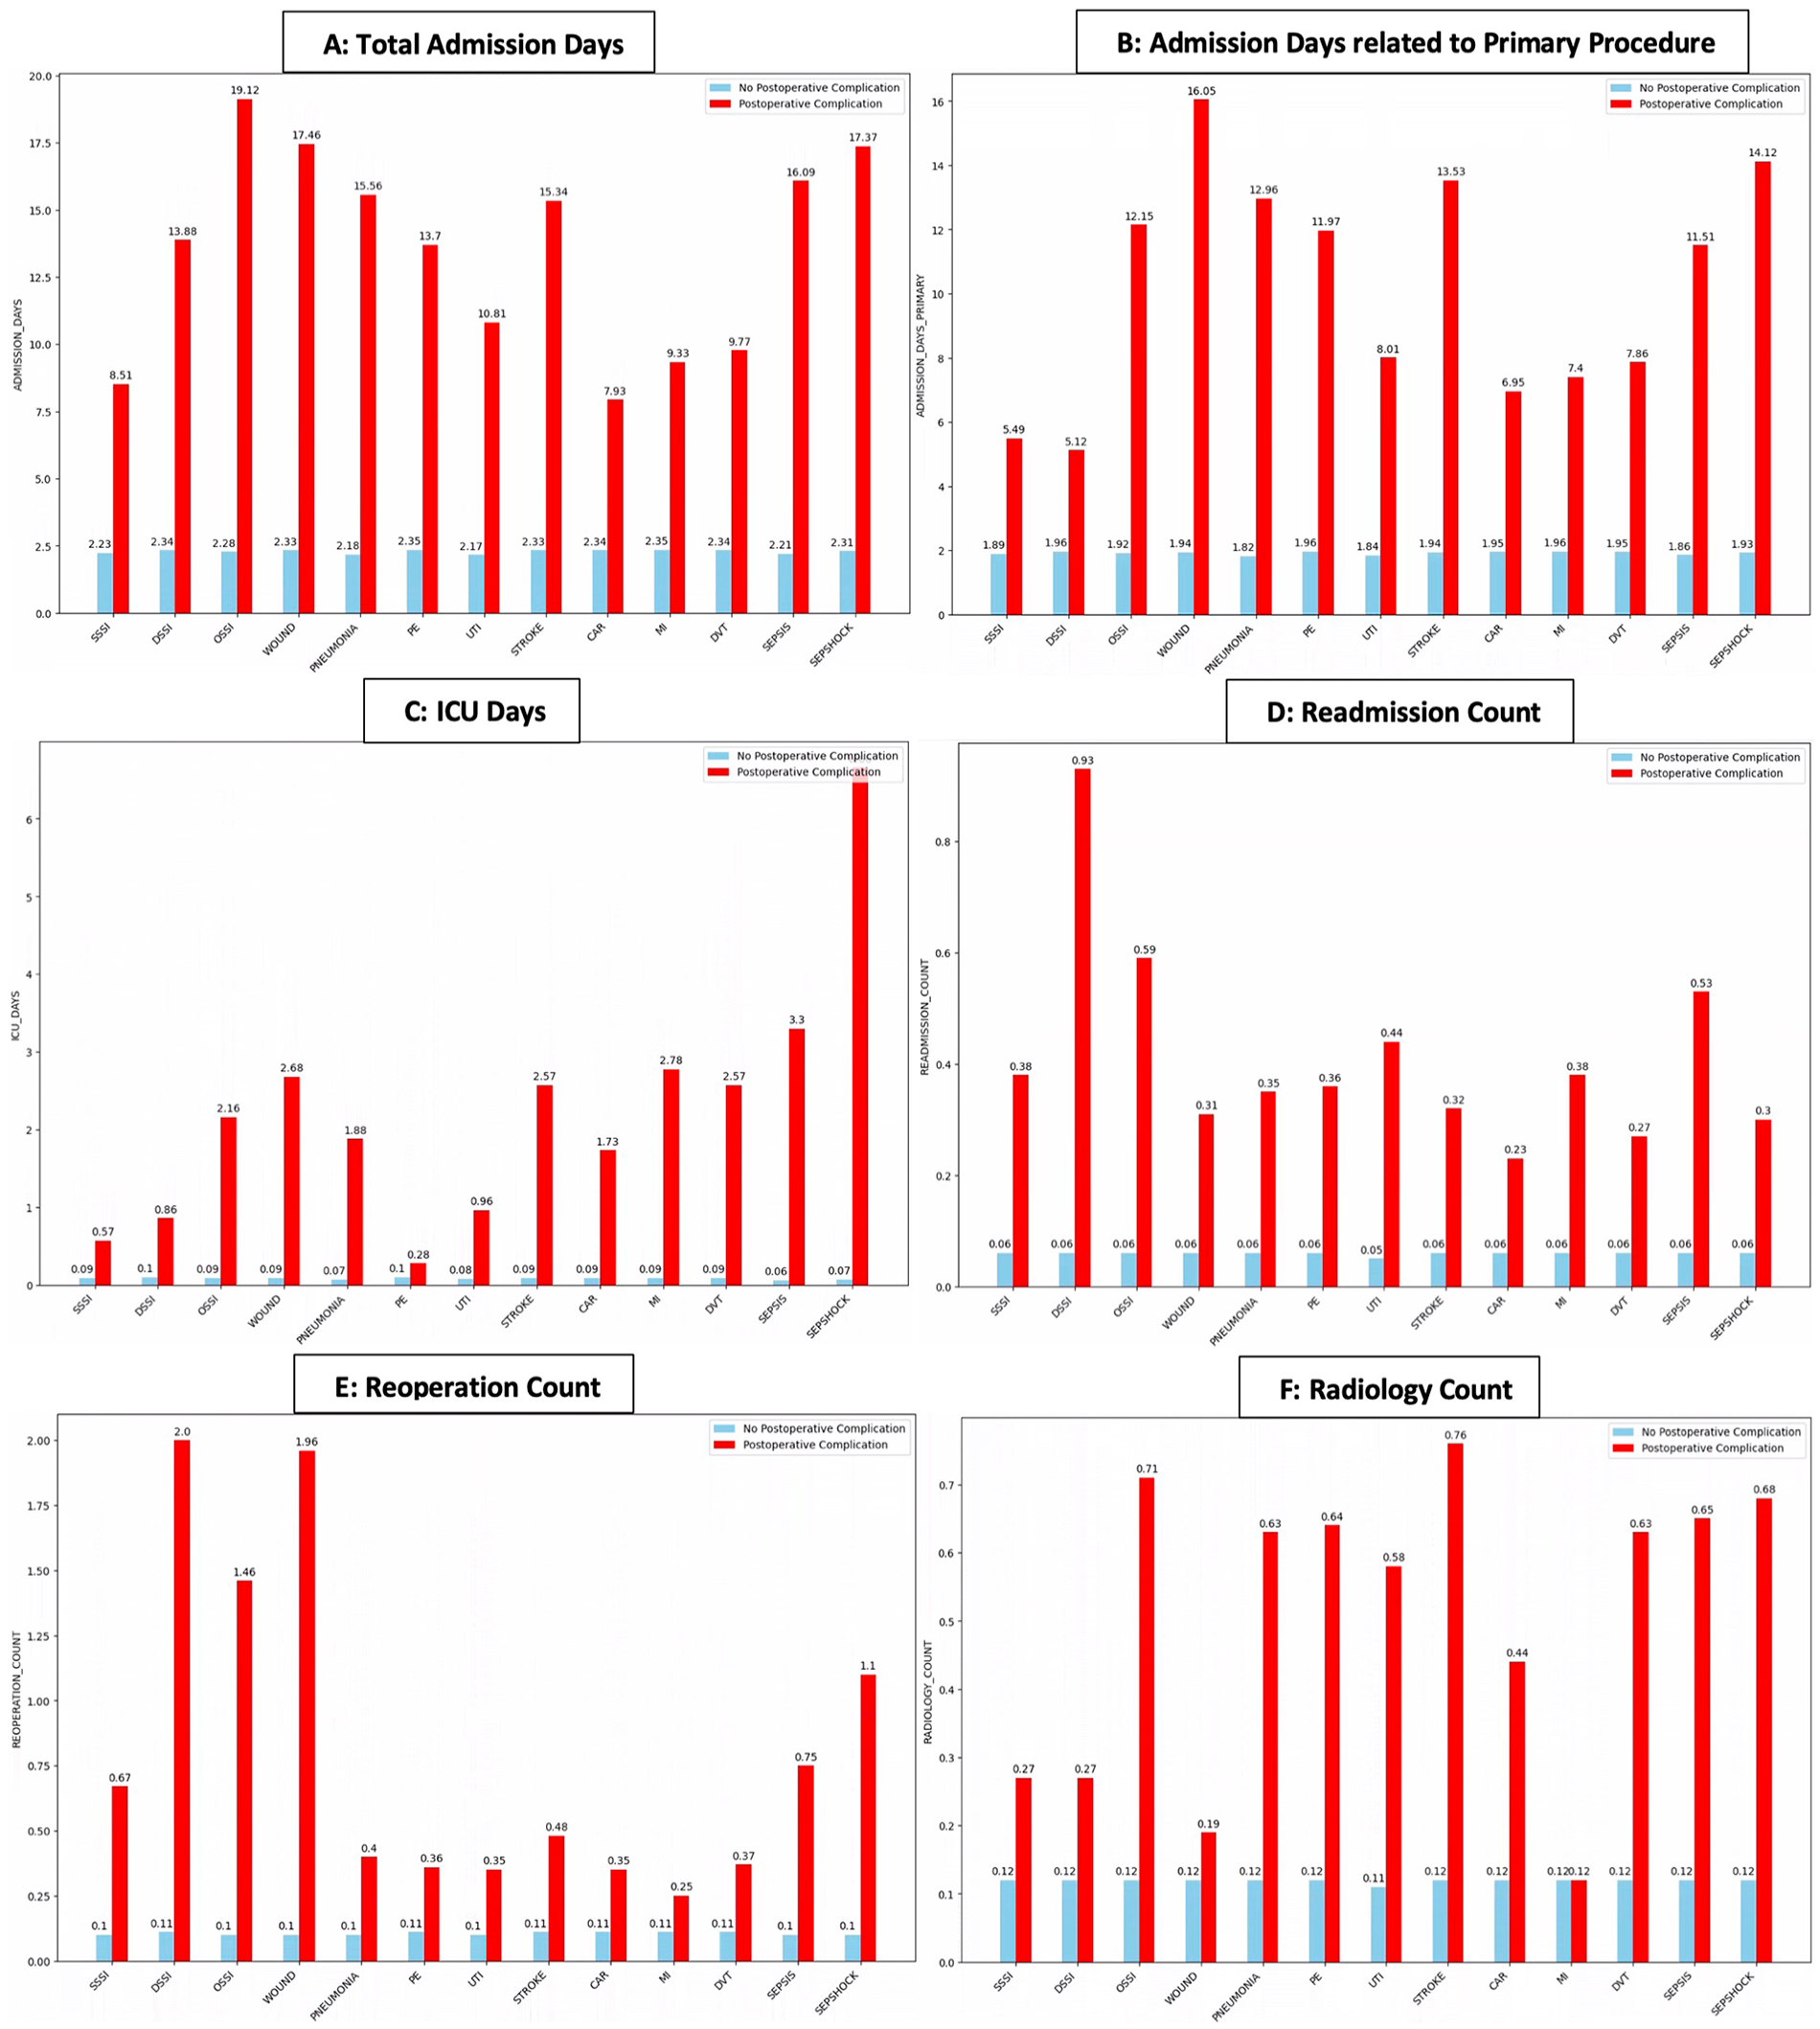
(A to F) Histograms of the studied 13 postoperative complications (x-axis) and the associated resource utilization represented by the six studied outcomes (total admission days, admission days related to primary procedure, ICU-days, readmission count, reoperation count, and radiology count), respectively. The values are presented as means for patients with a PC (red) compared to patients without PC (blue).
Regression models results
Results for the regression models are presented in Table 4 (linear regression for continuous outcomes) and Table 5 (logistic regression for dichotomous outcomes). All regression models were controlled for presence or absence of the other registered complications.
Results of linear regression models assessing the association between studied postoperative complication and four continuous resource consumption outcomes.
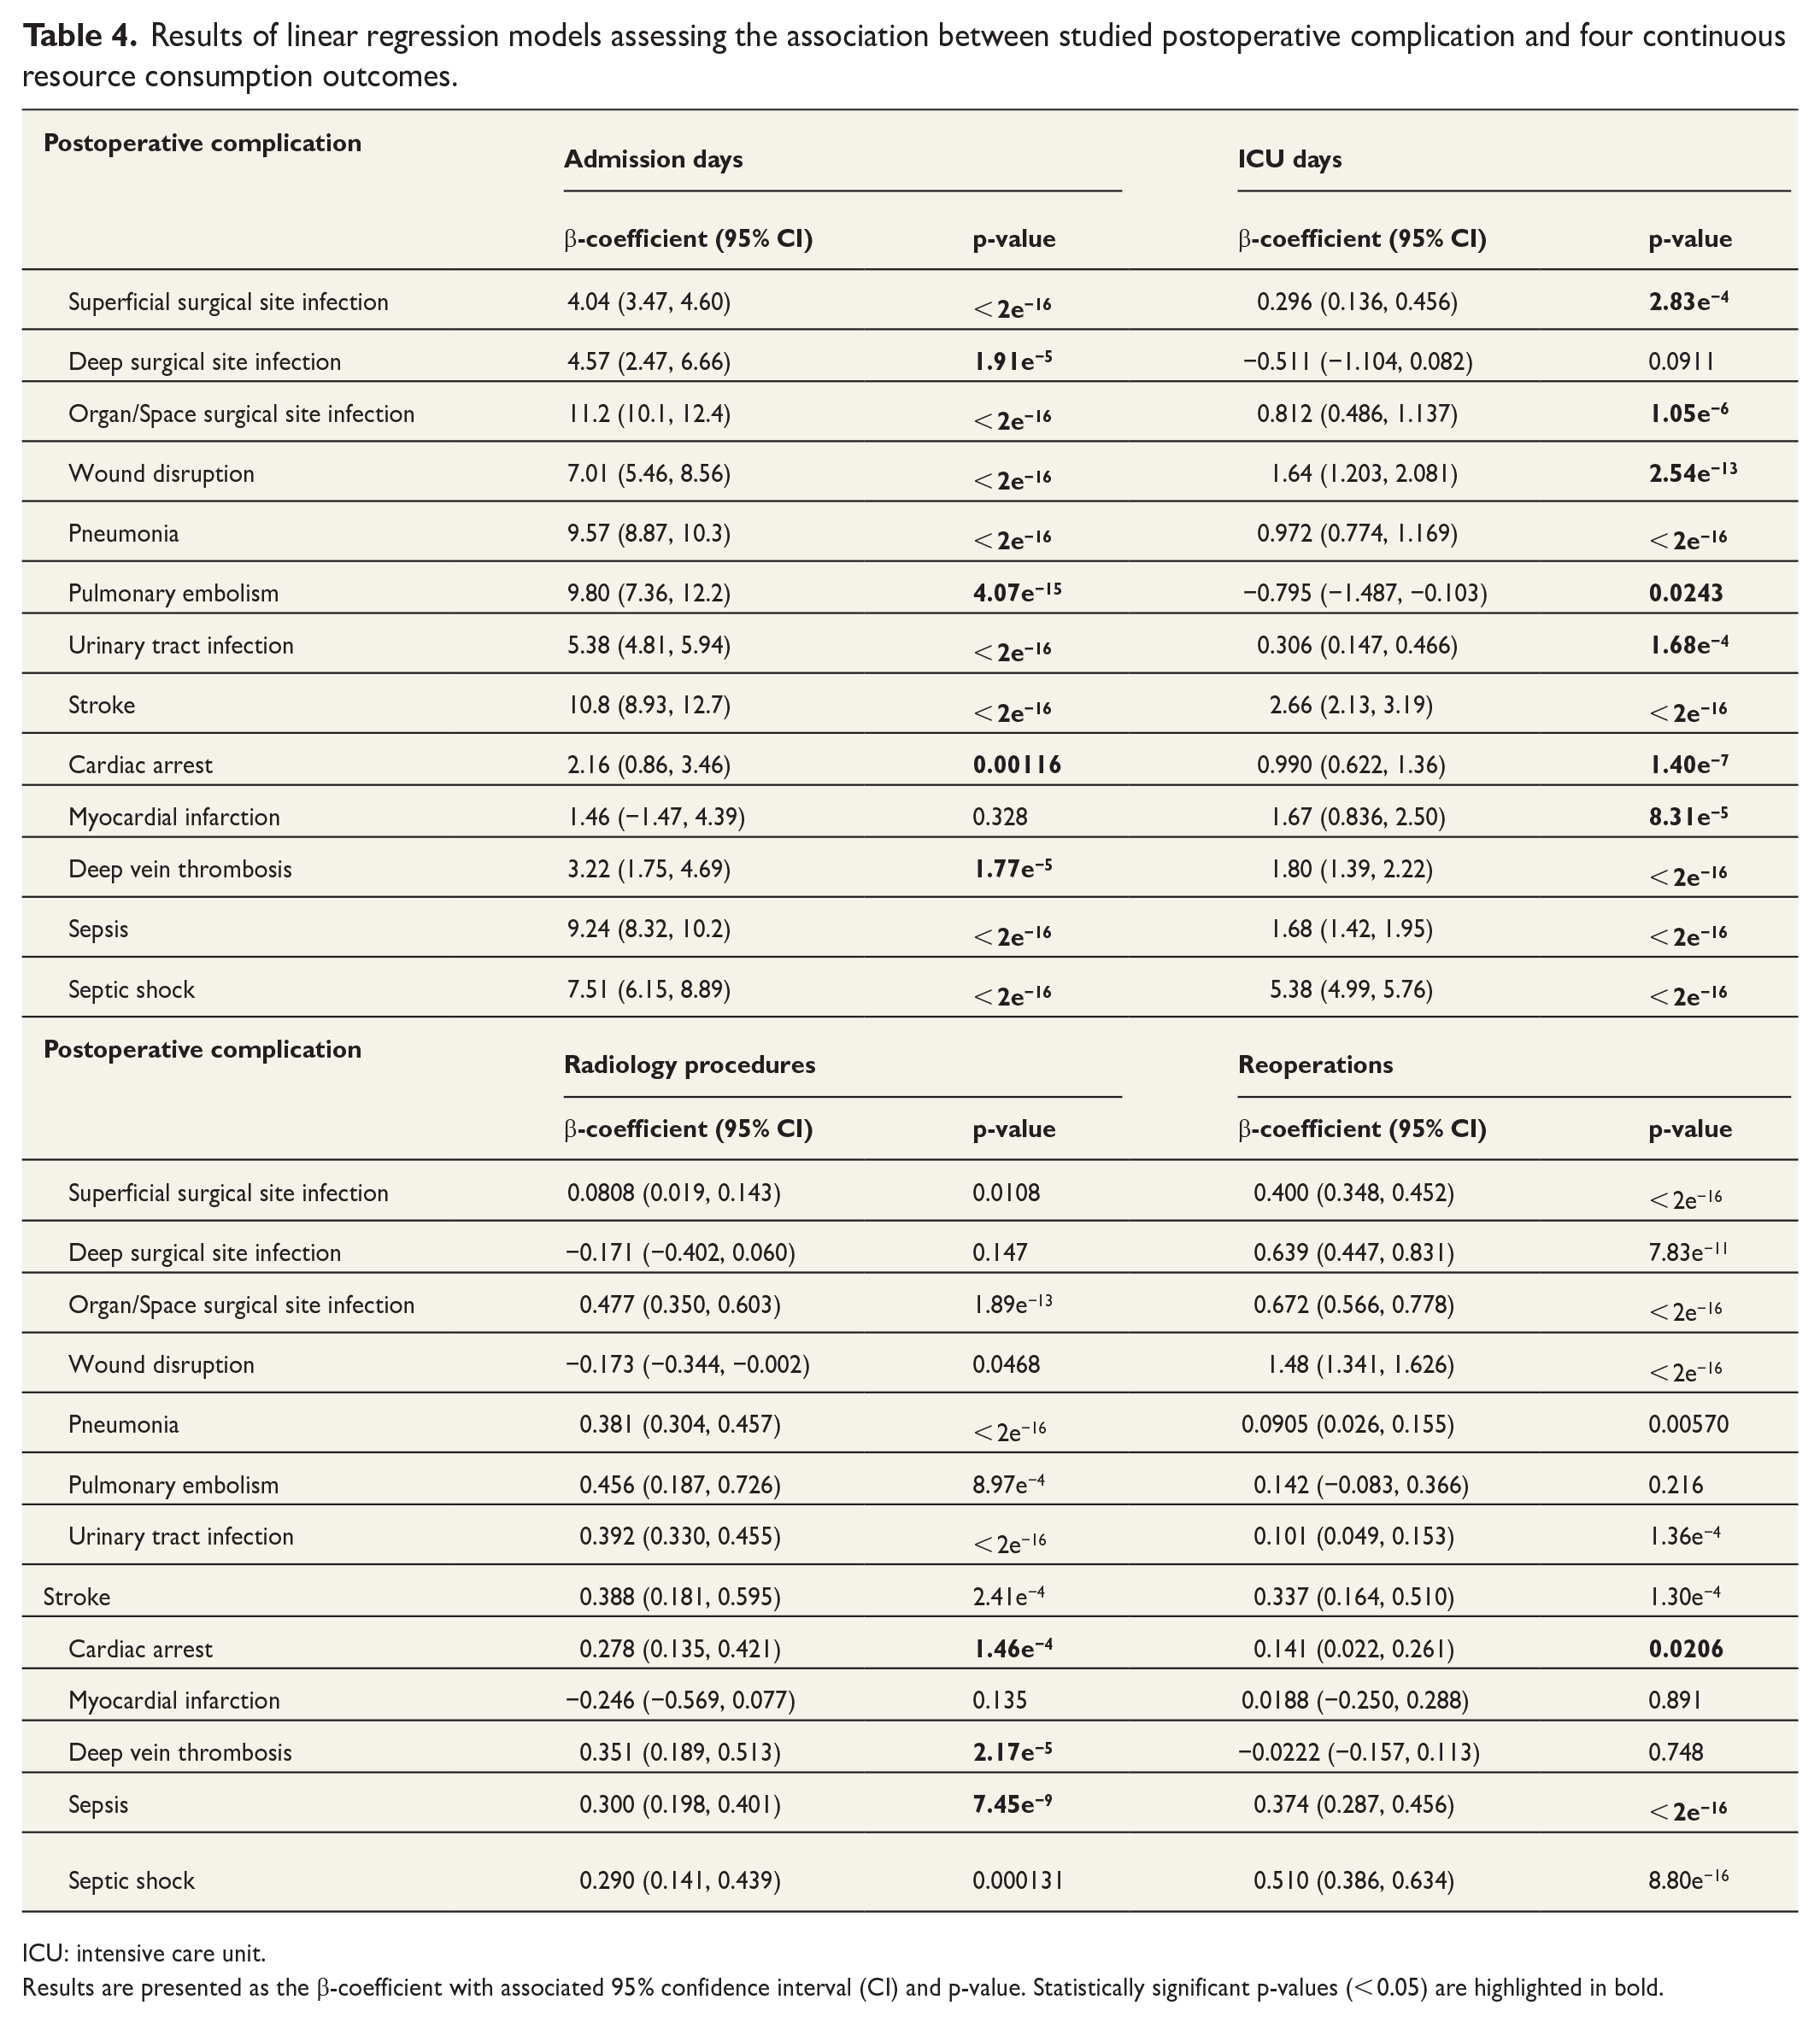
ICU: intensive care unit.
Results are presented as the β-coefficient with associated 95% confidence interval (CI) and p-value. Statistically significant p-values (< 0.05) are highlighted in bold.
Results of logistic regression models assessing the association between studied PCs and two binary resource consumption outcomes.
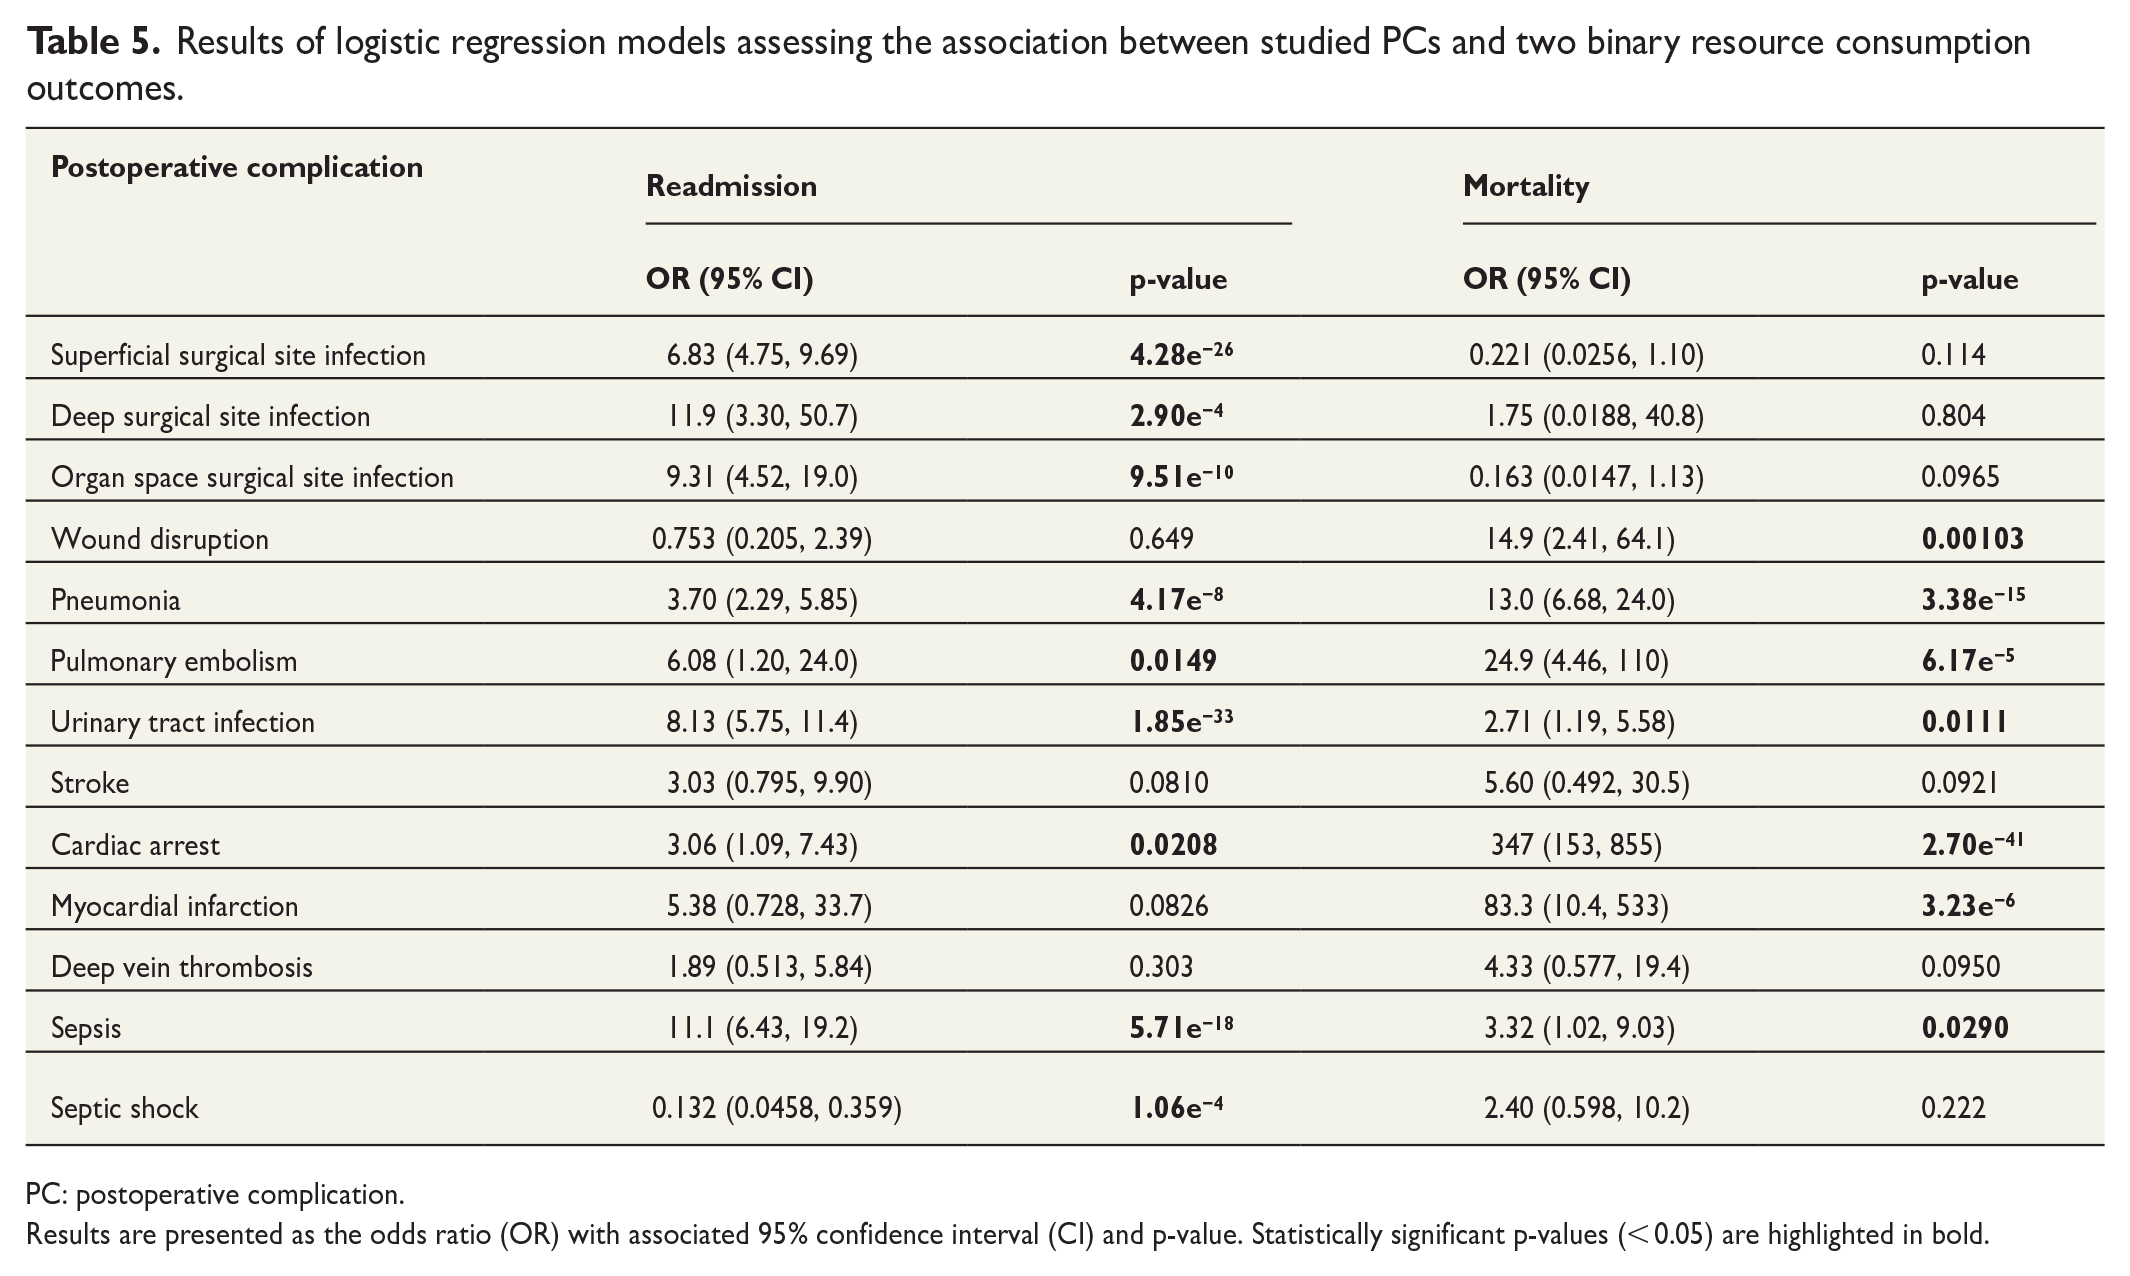
PC: postoperative complication.
Results are presented as the odds ratio (OR) with associated 95% confidence interval (CI) and p-value. Statistically significant p-values (< 0.05) are highlighted in bold.
Total admission days
Twelve out of 13 studied PCs were associated with prolonged admission, ranging from 1.5 to 11.2 days, when compared to patients who did not experience a PC.
The PC associated with the highest number of additional admission days was sepsis (9.2 days), pneumonia (9.5 days), pulmonary embolism (9.8 days), and OSSI (11.2 days) all with p-values < 0.001. Results for myocardial infarction were not statistically significant (p > 0.05).
ICU-days
Twelve PCs were associated with additional days spend in the ICU, ranging from 0.296 to 5.38 additional ICU-days (all p-values < 0.001). In contrast, pulmonary embolism was associated with fewer ICU-days (–0.80) when compared to patients without this PC (p-value = 0.02). Results for deep surgical site infection were not statistically significant (p > 0.05).
Radiology procedures
Ten PCs demonstrated association with an additional number of radiology procedures ranging from 0.0808 to 0.477 additional radiology procedures (all p-values < 0.05). One PC (wound disruption) displayed a negative association (–0.173) suggesting fewer radiology procedures associated with this particular complication (p < 0.05). Results for two PCs (myocardial infarction and DSSI) were not statistically significant (p > 0.05).
Reoperations
Ten PCs were associated with increased occurrence of reoperations ranging from 0.101 (UTI) to 1.48 (wound disruption), all p-values < 0.05. Results for three PCs (pulmonary embolism, myocardial infarction, and deep vein thrombosis) did not show a statistically significant association (p > 0.05).
Readmission
Eight out of the 13 studied PCs were associated with a higher risk of readmission, all p-values < 0.05. For these PCs, odds ratios (ORs) for readmission ranged from 3.06 (cardiac arrest) to 11.9 (deep surgical site infection). Septic shock was associated with an OR for readmission of 0.132. Results for four PCs (wound disruption, stroke, myocardial infarction, and deep vein thrombosis) were not statistically significant (p > 0.05).
Mortality
Seven PCs showed increased odds of mortality: wound disruption, pneumonia, pulmonary embolism, UTI, cardiac arrest, myocardical infarction, and sepsis, all p-values < 0.05. The remaining six PCs did not show statistically significant results (p > 0.05) in terms of mortality.
Economic costs associated with PCs
Calculations on economic costs associated with PCs are presented in Table 6. The table outlines the following details: the count of manually curated events for each specific PC, the corresponding number of additional admission days, the Danish per diem rate for a hospital admission, and finally the aggregated economic costs for each PC and for the dataset in total when only the per diem price of the additional admission days is used for the calculation. Our analysis showed that 12 out of 13 studied PCs demonstrated statistically significant results in the regression models, all of which were associated with an increase in the number of admission days. These 12 PCs collectively accounted for an additional 6857 admission days. Considering the per diem rate, the economic impact of these 11 PCs amounted to €2,128,743 in a 30-day period. This translates to an annual expense of €25,544,912 only due to these specific PCs within these two regions of Denmark (population 2.7 million). When compared to the expenses associated with PCs identified solely through ICD-10 codes, the figure is more than four times higher (€5,882,028; see Table 7).
Economic costs associated with the additional admission days for each PC.
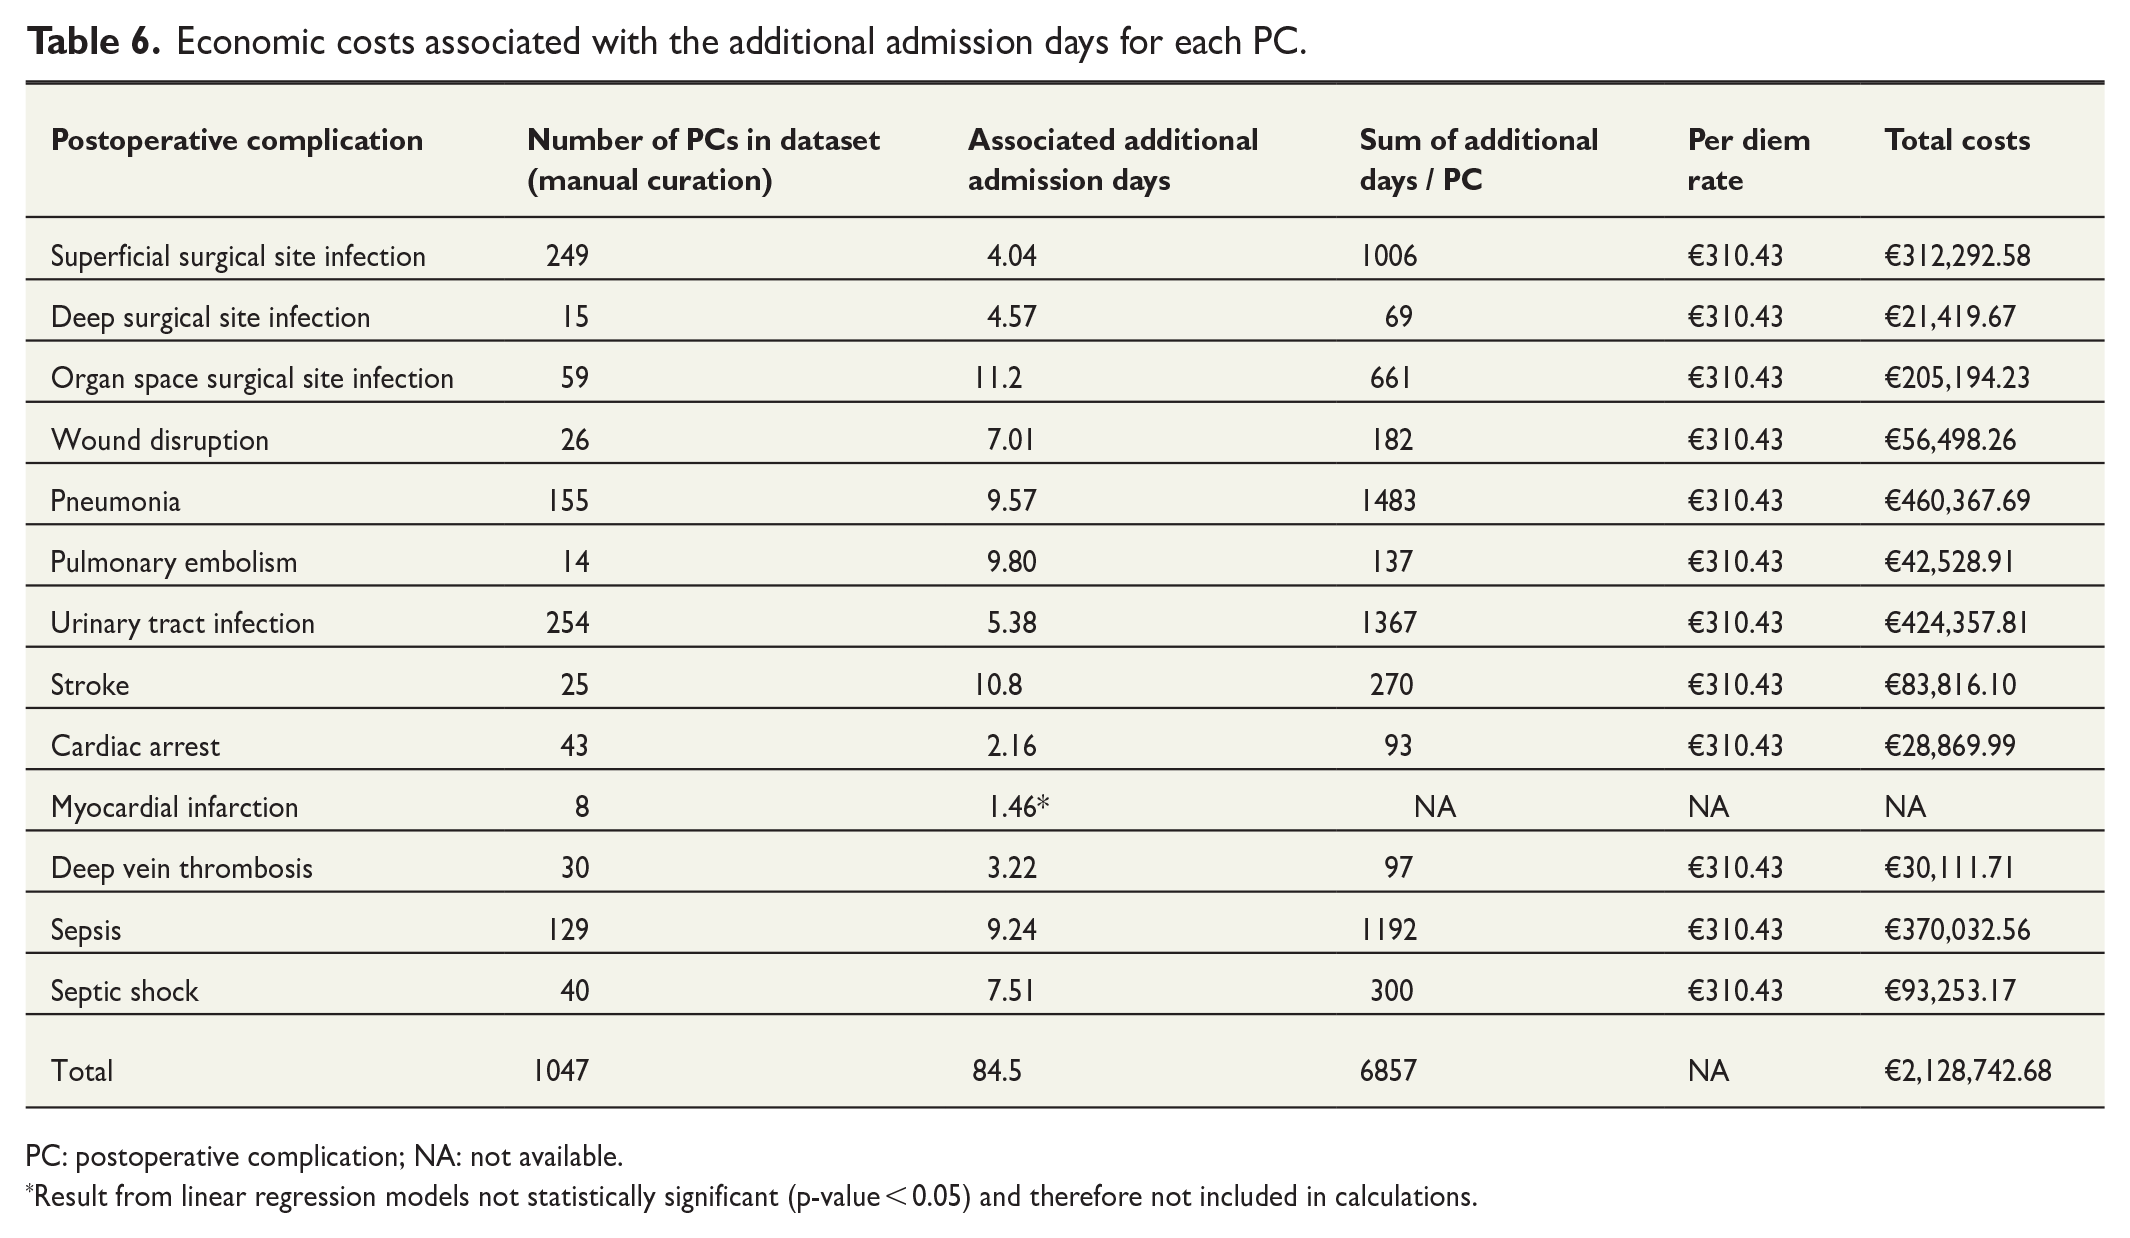
PC: postoperative complication; NA: not available.
Result from linear regression models not statistically significant (p-value < 0.05) and therefore not included in calculations.
Comparing economic costs associated with PCs found through ICD-10 codes versus PCs found through manual curation.
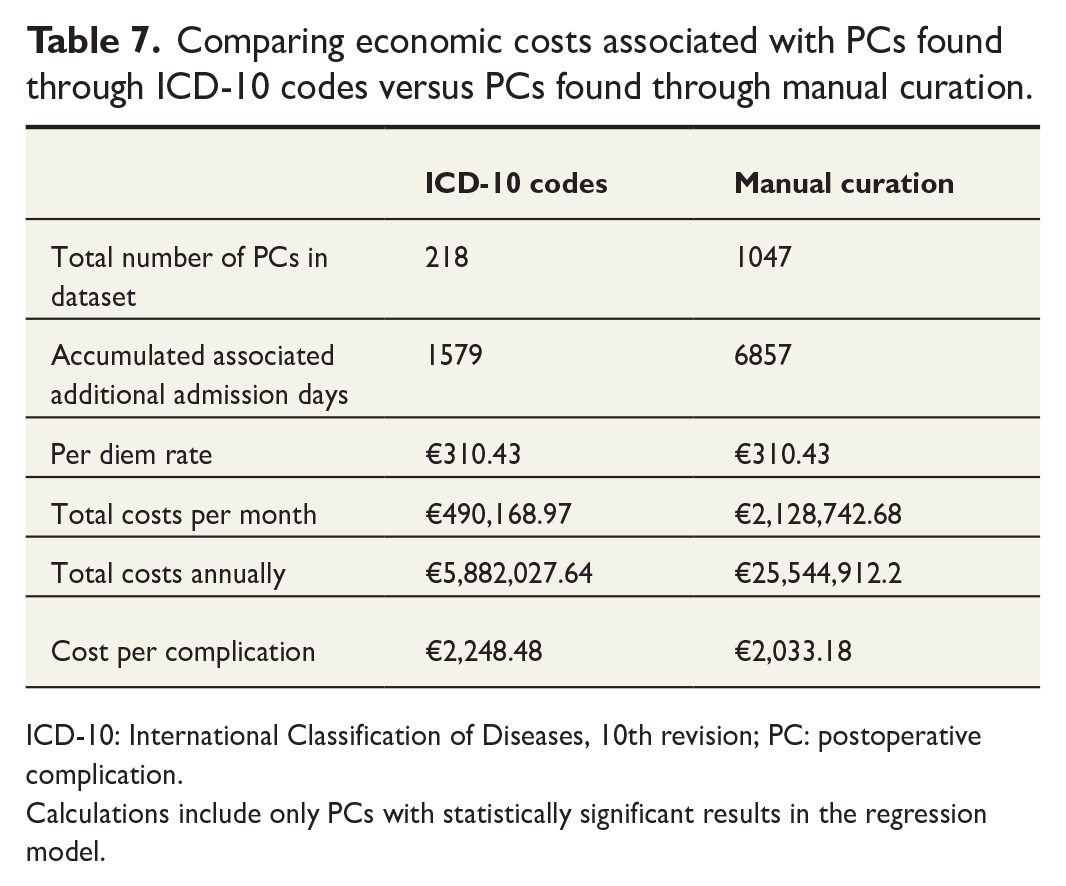
ICD-10: International Classification of Diseases, 10th revision; PC: postoperative complication.
Calculations include only PCs with statistically significant results in the regression model.
Discussion
In this study, we assessed the quality and accuracy of ICD-10 codes compared to manual curation for evaluating PCs. Second, we quantified the resource utilization and associated economic costs, including the gap between costs identified through ICD-10 codes and manual curation, of PCs in context of real-world data.
Overall, ICD-10 codes were inferior to manual curation for detecting PCs with only 20.8% of the PCs present in the data set having a correct ICD-10 code. This shows that using ICD-10 codes for PC surveillance trends will result in 79.2% of complications being overlooked. The sensitivity of ICD-10 coded PCs ranged from 0.57 (pulmonary embolism) to as low as 0.023 (cardiac arrest). In addition, PPV across all PCs was low at 0.4967 (with a large span from 0.057 to 1), whereas both specificity and NPV were relatively high (both > 0.98). Despite the similarity between ICD-10 and ACS-NSQIP criteria for diagnosing PCs, the low PPV and high rate of false positives in our study may reflect problematic documentation practices and a tendency to preliminary coding of some PCs in order to start treatment quickly. This could potentially explain the high rate of false positives in ICD-10 codes for some PCs.
In contrast, the high NPV is likely due to the imbalance in the dataset (low incidence of complications), leading to a situation where a missing code will statistically have a high chance of being correct, regardless of why it is missing.
The quality and utility of ICD-10 codes for PC monitoring has previously been subject to several international studies and the evidence is consistent—sources of administrative data (ICD-10 codes, insurance claims, and so on) are inferior to manual curation for both the sensitivity and PPV.8,9,11,19,20
Lawson et al. 8 examined a total of 117,752 ACS-NSQIP patient records from over 200 hospitals and reported a sensitivity range of administrative data for detecting PCs from 0.27 to 0.78. Similarly, Koch et al. 20 demonstrated poor agreement between an administrative data source and a clinical registry for detecting various PCs. The issue of inconsistent PC reporting thus appears to affect both US and European healthcare systems alike.10,21
Multiple factors may contribute to the poor quality of administrative data sources including differences in definitions, biases in coding practices or actual coding errors. In our study, the poor quality of ICD-10 codes (as the source of administrative data) could likely reflect that coding of a PC in an already admitted and diagnosed patient rarely will have any significant clinical consequences. It may be perceived as an organizational formality and thereby lacking incentive for the treating surgeon to code the PC.
The second objective of this study was to assess the resource utilization and economic costs due to PCs using real-world data. When examining the impact of PCs on resource utilization, we found that PCs overall were associated with increased resource consumption when compared to patients without PCs. Specifically, PCs were associated a higher number of admission days (ranging from 2.16 to 11.2 additional admission days). Eight of the studied PCs showed an increased odds of readmission with OR ranging from 3.06 to 11.9.
Several other studies have examined the resource utilization due to PCs. Dimick et al. found patients suffering from PCs to have both an increased median length of stay (12 versus 8 days, p > 0.001) as well as an increase in median hospital costs (US$16,868 versus US$12,861, p < 0.001). Especially acute renal failure and septicemia were associated with the greatest increase in resource utilization 22 —the latter agreeing with our findings (sepsis was associated with 9.24 additional admission days). In a systematic review, Patel et al. reviewed 38 studies on costs and the drivers of costs of intra- and perioperative complications. The findings were unanimous and showed in all 38 studies that complications lead to increased resource utilization. The costs were depending on type and severity of the complication but were primarily driven by prolonged hospitalization. 1
Similar findings from the Danish Healthcare system demonstrated a higher mean cost of €9505 for patients experiencing a postoperative adverse event. 14
The existing literature agrees that PCs are associated with increased resource consumption, yet only a few studies use a comprehensive approach by simultaneously evaluating the quality of administrative data sources and the resource consumption and economic costs associated with the actual number of PCs within the population. This integrated approach offers valuable insights into real-world data as it theoretically provides a more granular overview of expenditures of PCs. This study indicates that in the Danish Healthcare system, additional admission day costs of PCs are associated with annual costs of approximately €24.4 million. Furthermore, the studied PCs were associated with more than 80,000 additional admission days. This figure is more than four times the expenses associated with PCs identified solely through ICD-10 codes. Consequently, utilizing ICD-10 codes for PC surveillance trends would result in a massive underestimation of economic costs.
Several limitations should be considered when interpreting these results. First, manual curation was used as the gold standard. While this remains the most accurate method for PC identification, it is still dependent on sources such as free medical text. As such, additional PC may have occurred, but not described in the EHR data. Second, PCs occurring and treated solely in the primary health setting may not be recorded in the EHR data, further adding to the problem of under coding of PCs.
Due to the retrospective design of our study, we cannot establish causality but only associations between PCs and resource consumption. There is a possibility that prolonged admissions increase the risk of PCs, rather than the reverse. Nevertheless, our findings still indicate a clear association between PCs and increased resource consumption. Second, our study only included 13 specific PCs, which do not encompass all potential complications. In addition, we did not account for the costs associated with other resource consumption outcomes such as ICU-days, reoperation, readmission, and radiology. Consequently, the total resource utilization and economic costs of PCs are likely underestimated.
Furthermore, in our economic analysis, we chose “the per diem rate,” which represents the expense used for patients who have completed most of their treatment and are admitted beyond a certain threshold (trimpoint). This choice most likely also contributes to underestimating the total resource utilization and costs of PCs.
In conclusion, our findings reveal a dual challenge: significant undercoding of early PCs on one hand, and the substantial resource burden they impose on healthcare systems on the other. This burden remains largely unrecognized because of undercoding of PC and the continued use of ICD-10 codes for monitoring of PCs. Accurately identifying the true rate of PCs, along with their associated resource utilizations, could be pivotal for both quality improvement and cost reduction efforts in modern healthcare systems
Supplemental Material
sj-docx-1-sjs-10.1177_14574969241294263 – Supplemental material for Assessing the accuracy gap in early postoperative complication surveillance: ICD-10 codes versus manual curation—clinical and economic implications
Supplemental material, sj-docx-1-sjs-10.1177_14574969241294263 for Assessing the accuracy gap in early postoperative complication surveillance: ICD-10 codes versus manual curation—clinical and economic implications by Emilie Even Dencker, Alexander Bonde, Stephan Sloth Lorenzen, Anders Troelsen and Martin Sillesen in Scandinavian Journal of Surgery
Footnotes
Author contributions
Authors E.E.D., M.S., A.T., and A.B. conceived the study. E.E.D. and A.B. performed data extraction. E.E.D. and M.S. performed statistical analyses. E.E.D. drafted the article, which was critically revised by M.S., A.T., and A.B.
Declaration of conflicting interest
The author(s) declared the following potential conflicts of interest with respect to the research, authorship, and/or publication of this article: Authors M.S., A.B., and A.T. have founded Aiomic, a company fielding AI models for the healthcare sector. S.S.L. is a part-time employee at Aiomic. This work is for research only and does not relate to commercial activities.
Funding
The author(s) disclosed receipt of the following financial support for the research, authorship, and/or publication of this article: Supported by a grant (grant no. NNF19OC0055183) from the Novo Nordisk Foundation to M.S.
Data sharing
Due to the nature of the patient sensitive data used in this study and GDPR regulations, the authors are not at liberty to share the underlying data externally without authorization. The dataset can be fielded following authorization by the Danish Patients Safety Board (Styrelsen for Patientsikkerhed) and the Danish Capital Region Data Safety board (Videncenter for dataanmeldelser).
Supplemental material
Supplemental material for this article is available online.
References
Supplementary Material
Please find the following supplemental material available below.
For Open Access articles published under a Creative Commons License, all supplemental material carries the same license as the article it is associated with.
For non-Open Access articles published, all supplemental material carries a non-exclusive license, and permission requests for re-use of supplemental material or any part of supplemental material shall be sent directly to the copyright owner as specified in the copyright notice associated with the article.