
Abstract
Background:
Standardized surgery rates for common orthopedic procedures vary across geographical areas in Norway. We explored whether area-level factors related to demand and supply in publicly funded healthcare are associated with geographical variation in surgery rates for six common orthopedic procedures.
Methods:
The present study is a cross-sectional population-based study of hospital referral areas in Norway. We included adult admissions for arthroscopy for degenerative knee disease, arthroplasty for osteoarthritis of the knee and hip, surgical treatment for hip fracture, and decompression with/without fusion for lumbar disk herniation and lumbar spinal stenosis in 2012–2016. Variation in age and sex standardized rates was estimated using extremal quotients, coefficients of variation, and systematic components of variation (SCV). Associations between surgery rates and the socioeconomic factors urbanity, unemployment, low-income, high level of education, mortality, and number of surgeons and hospitals were explored with linear regression analyses.
Results:
Knee arthroscopy showed highest level of variation (SCV 10.3) and decreased in numbers. Variation was considerable for spine surgery (SCV 3.8–4.9), moderate to low for arthroplasty procedures (SCV 0.8–2.6), and small for hip fracture surgery (SCV 0.2). Higher rates of knee arthroscopy were associated with more orthopedic surgeons (adjusted coefficient 24.8, 95% confidence interval (CI): 2.7–47.0), and less urban population (adjusted coefficient −13.3, 95% CI: −25.4 to −1.2). Higher spine surgery rates were associated with more hospitals (adjusted coefficient 22.4, 95% CI: 4.6–40.2), more urban population (adjusted coefficient 2.1, 95% CI: 0.4–3.8), and lower mortality (adjusted coefficient −192.6, 95% CI: −384.2 to −1.1). Rates for arthroplasty and hip fracture surgery were not associated with supply/demand factors included.
Conclusions:
Arthroscopy for degenerative knee disease decreased in line with guidelines, but showed high variation of surgery rates. Socioeconomic factors included in this study did not explain geographical variation in orthopedic surgery.
Context and Relevance
Standardized surgery rates for common orthopedic procedures vary across geographical areas in many countries. Socioeconomic factors impact health and the demand for healthcare, and supply of health services can influence utilization. Rates for knee arthroscopy showed the highest level of geographical variation and decreased in numbers. Geographical variation was considerable for spine surgery, moderate to low for arthroplasty procedures, and small for hip fracture surgery. Factors reflecting supply and demand analyzed did not explain geographical variation in orthopedic surgery. This might reflect the equity of universal health care services, or an inability of area-level factors to detect association.
Introduction
The surgery rate, i.e. the number of procedures per population per year, varies for all common orthopedic procedures in Norway,1–3 and in most other countries.4–6 For some procedures, like hip fracture repair where the efficiency of the treatment and positive outcomes are not disputed, the variation is small and likely to describe differences in incidence. However, surgery rates for several other orthopedic conditions show marked geographic variation.
Norway and other Nordic countries have universal health systems that aim to provide equitable access to healthcare for all inhabitants. The burden of disease does not vary substantially between resident areas in Norway. 7 Nonetheless, surgery rates vary. We know that socioeconomic factors affect health and the demand for healthcare, and that supply of health services can have an influence on utilization. 8 Geographic variation in healthcare can be caused by differences in morbidity or preferences in the patient population, but it can also be unwarranted as a result of differences in medical practice and supply of procedures.9,10 The risk of unwarranted variation is overuse, underuse, or wrong utilization of the services. 11 Since geographic variation can be system dependent, it is necessary to examine factors associated with such variation in Norwegian healthcare.
The aim of this study is to measure the level of geographic variation in six common orthopedic procedures performed in publicly funded healthcare, and identify area-level demand and supply factors associated with geographical variation in surgery rates.
Methods
Setting
The public health care system in Norway has an equal distribution of monetary resources, and uniform training and licensing for healthcare staff. Most patients are treated at the public hospital serving their residential address. Some private hospitals have government funding through contracts with regional health authorities, and are thus part of the public health care system. Patients can opt for treatment at any public hospital or government-funded private provider. Treatments are provided free of cost except for a small patient co-payment with an annual cap of NOK 2185 (year 2016). Around 10% of the population has private health insurance that covers expenses for treatment in private hospitals without public funding. These hospitals do not report activity data to the Norwegian Patient Registry (NPR). The quality of treatment is considered equivalent in public and private hospitals, and the presumption is backed by a recent study showing equivalent effectiveness of spine surgery in public and private hospitals. 12
Non-operative treatment for orthopedic conditions is available in the public health care system, but referral pathways vary and display great inconsistency. Data on the structure of and access to non-operative treatment were not available in this study.
Study design and data sources
This is a cross-sectional population-based study based on data from the NPR. NPR covers all publicly funded specialist healthcare services, including treatment in private institutions and specialists contracted to regional health authorities. The data have high accuracy and completeness (85%–92% for spine surgery and over 95% for hip replacement and hip fracture surgery). 13 The data supplied by the NPR included all admissions in the years 2012–2016 for defined orthopedic diagnoses and procedures. We retrieved online available data on socioeconomic variables, possibly associated with geographic variation, from the Statistics Norway (SSB) national register. The variables retrieved from SSB were area-level data on income, education, unemployment, urbanization, mortality, amount of paid benefits, and proportion of foreign-born population. We retrieved online data on the number of public and private hospitals in geographical areas from three national medical quality registers (the Norwegian Arthroplasty Registry, the Norwegian Hip Fracture Registry and the Norwegian Registry for Spine Surgery). The Norwegian Medical Association provided data on the numbers of surgeons according to area of residence.
Patient selection
We included cases that underwent one of the following surgical procedures: arthroscopy for degenerative knee disease, arthroplasty for osteoarthritis of the knee, arthroplasty for osteoarthritis of the hip, surgical treatment for hip fracture, decompression with or without fusion for lumbar disk herniation, and decompression with or without fusion for lumbar spinal stenosis. The procedures were chosen based on their prevalence and clinical relevance, and hip fracture surgery was included as a reference expected to display little variation. Supplement 1 shows the inclusion criteria in terms of the International Classification of Diseases (ICD-10) and NOMESKO Classification of Surgical Procedures (NCSP) codes. All cases 18 years and older were included for all the above-mentioned procedures, with the exception of arthroscopy for degenerative knee disease, for which all cases aged 50 years and older were included. We chose this age group to maximize inclusion of those with complaints related to osteoarthritis, who are not expected to benefit from arthroscopic procedures. 3 Bilateral arthroplasties operated on the same day were counted as one procedure, and up to two primary total knee arthroplasties and two primary total hip arthroplasties operated on different days were included for all patients. Patients where municipality of residence was not available or registered as “abroad” were excluded (less than 1% of admissions). The 19 geographical areas correspond to hospital referral areas (HRAs) of health trusts in Norway. Treatment was recorded according to patients’ area of residence (postal code), and not based on which hospital or health trust delivered the treatment.
Statistics
For each of the six procedures we calculated surgery rates per 100,000 adult population (relevant age group), per year, and hospital referral area. Rates were directly standardized for age and gender using the relevant age group of the population of Norway on 1 January 2016 as the standard population. We extracted population data from SSB tables 07459 and 10826.
The extent of variation in standardized surgery rates for each procedure across areas was estimated using the extremal quotient (EQ; maximum rate divided by minimum rate), the coefficient of variation (CV; standard deviation of rates divided by mean of rates), and the systematic component of variation (SCV).14,15
To quantify supply-related factors we analyzed the impact of the numbers of hospitals and surgeons. We calculated the number of hospitals per 100,000 population for each hospital referral area and procedure. Private hospitals included both hospitals with partial public funding and hospitals with no public funding. We performed the main analyses using data for the total number of hospitals per area, including both public and private hospitals. In addition, we performed sensitivity analyses to detect the possible effect of the number of public and private hospitals separately. We calculated the number of surgeons per 100,000 population for each hospital referral area. For knee and hip procedures, we used data on orthopedic surgeons listed according to their residential address in 2016. For spine procedures, the number of surgeons was the sum of orthopedic surgeons and neurosurgeons listed according to their residential address in 2016. We also performed sensitivity analyses to detect possible effects of the numbers of orthopedic surgeons and neurosurgeons separately.
To quantify demand-related factors we calculated proportions and rates per hospital referral area for socioeconomic variables. Based on a correlation analysis and an assessment of relevance, we chose to include the following factors to quantify demand; the proportion of population in urban areas (SSB table 05212), the unemployment rate (SSB table 10594), the proportion of persons living in low-income households (SSB table 06947), the proportion of persons with a high level of education (SSB tables 09429 and 09434), and the mortality rate (SSB table 12983).
We performed multivariable linear regression to analyze associations between area-level factors and the likelihood of surgery for each procedure. For knee arthroplasty rates a logarithmic transformation was made. Model performance was evaluated using adjusted R-squared, and a p value < 0.05 was considered statistically significant.
We used R version 4.03, a free software program for statistical computing, for all statistical analysis.
Ethics, funding, and potential conflicts of interest
Patients were not involved in the conception, design, or conduct of this research. Helse Førde health trust holds a license from the Norwegian Data Protection Authority to process health data for the national healthcare atlas service from 2016. Since 20 July 2018, the basis for the processing of data has been the General Data Protection Regulation. One of the authors (M.H.) received support from Helse Førde health trust in Norway through Grant Number 38595/2019. No conflicts of interest were declared.
Results
The number of knee arthroscopies decreased during the period from 8857 arthroscopies in 2013 to 4172 in 2016. The yearly extremal quotients for knee arthroscopies fluctuated between 7.1 and 3.4, with no consistent trend of increase or decrease in variability. The annual numbers were stable for the other procedures. Table 1 shows the national numbers of procedures, the surgical rates and their extremal quotients, and the measures of variation.
Numbers of procedures, surgical rates, and variation statistics.
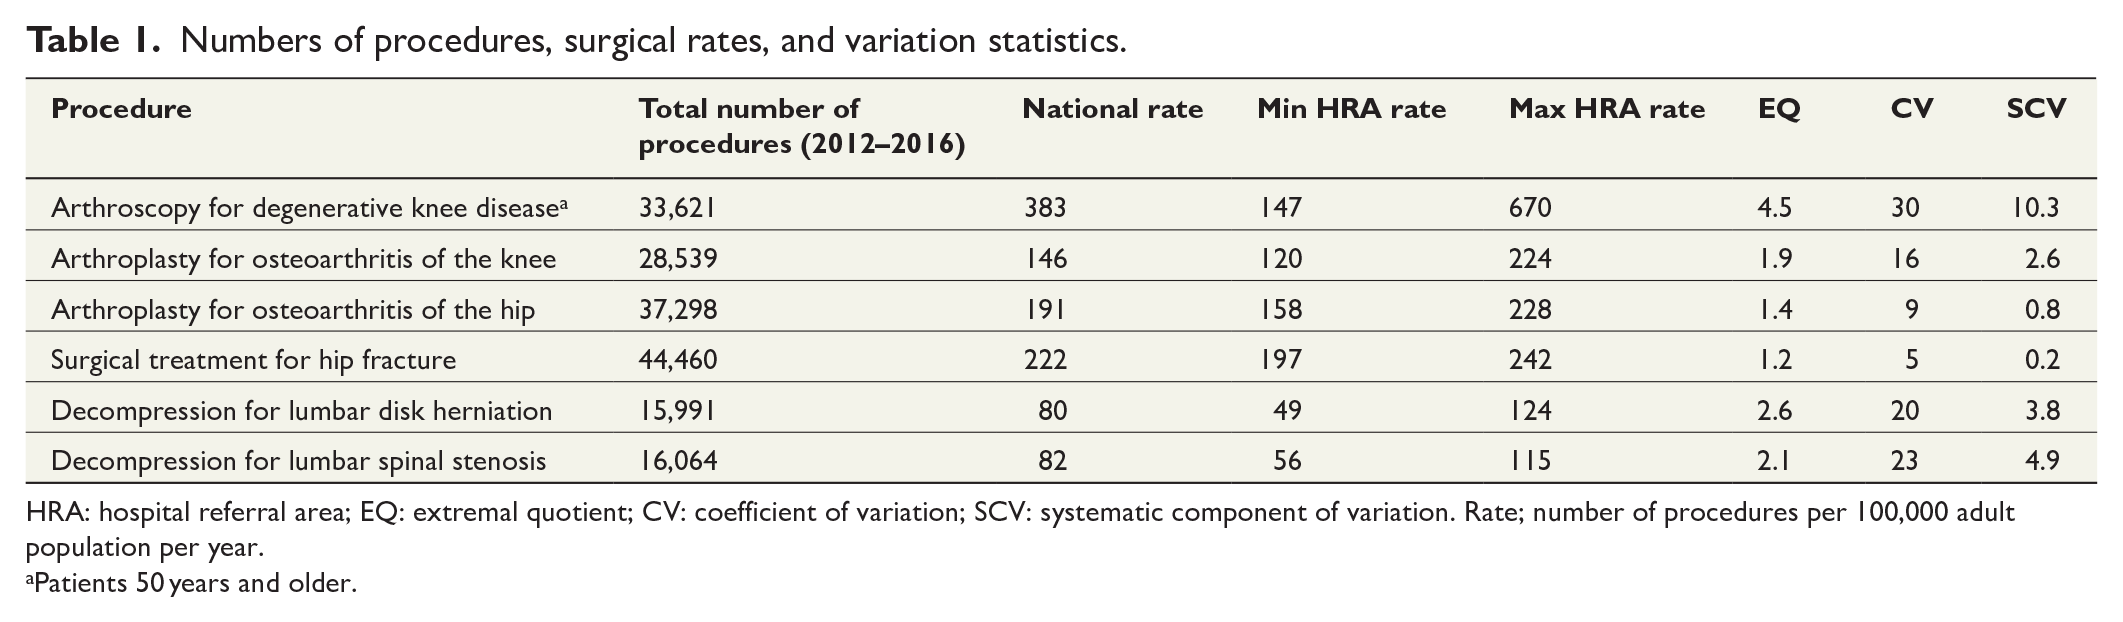
HRA: hospital referral area; EQ: extremal quotient; CV: coefficient of variation; SCV: systematic component of variation. Rate; number of procedures per 100,000 adult population per year.
Patients 50 years and older.
For the capital region, rates were lower than national rates for all procedures; for arthroscopy for degenerative knee disease 261, arthroplasty for osteoarthritis of the knee 120, arthroplasty for osteoarthritis of the hip 167, surgical treatment for hip fracture 209, decompression for lumbar disk herniation 79, and decompression for lumbar spinal stenosis 65 per 100,000 adult population per year.
Arthroscopy for degenerative knee disease was the procedure with the highest level of variation (SCV 10.3, 4.5-fold) and the highest standardized rate among the eligible population. There was also considerable variation of the rates for decompression for lumbar spinal stenosis (SCV 4.9, 2.1-fold) and lumbar disk herniation (SCV 3.8, 2.6-fold). Arthroplasty for osteoarthritis of the knee showed moderate variation (SCV 2.6, 1.9-fold), while the variation was relatively low for arthroplasty for osteoarthritis of the hip (SCV 0.8, 1.4-fold). Surgical treatment for hip fracture showed least variation in surgery rates (SCV 0.2, 1.2-fold). Fig. 1 illustrates the geographical variation in standardized surgery rates for the included procedures.
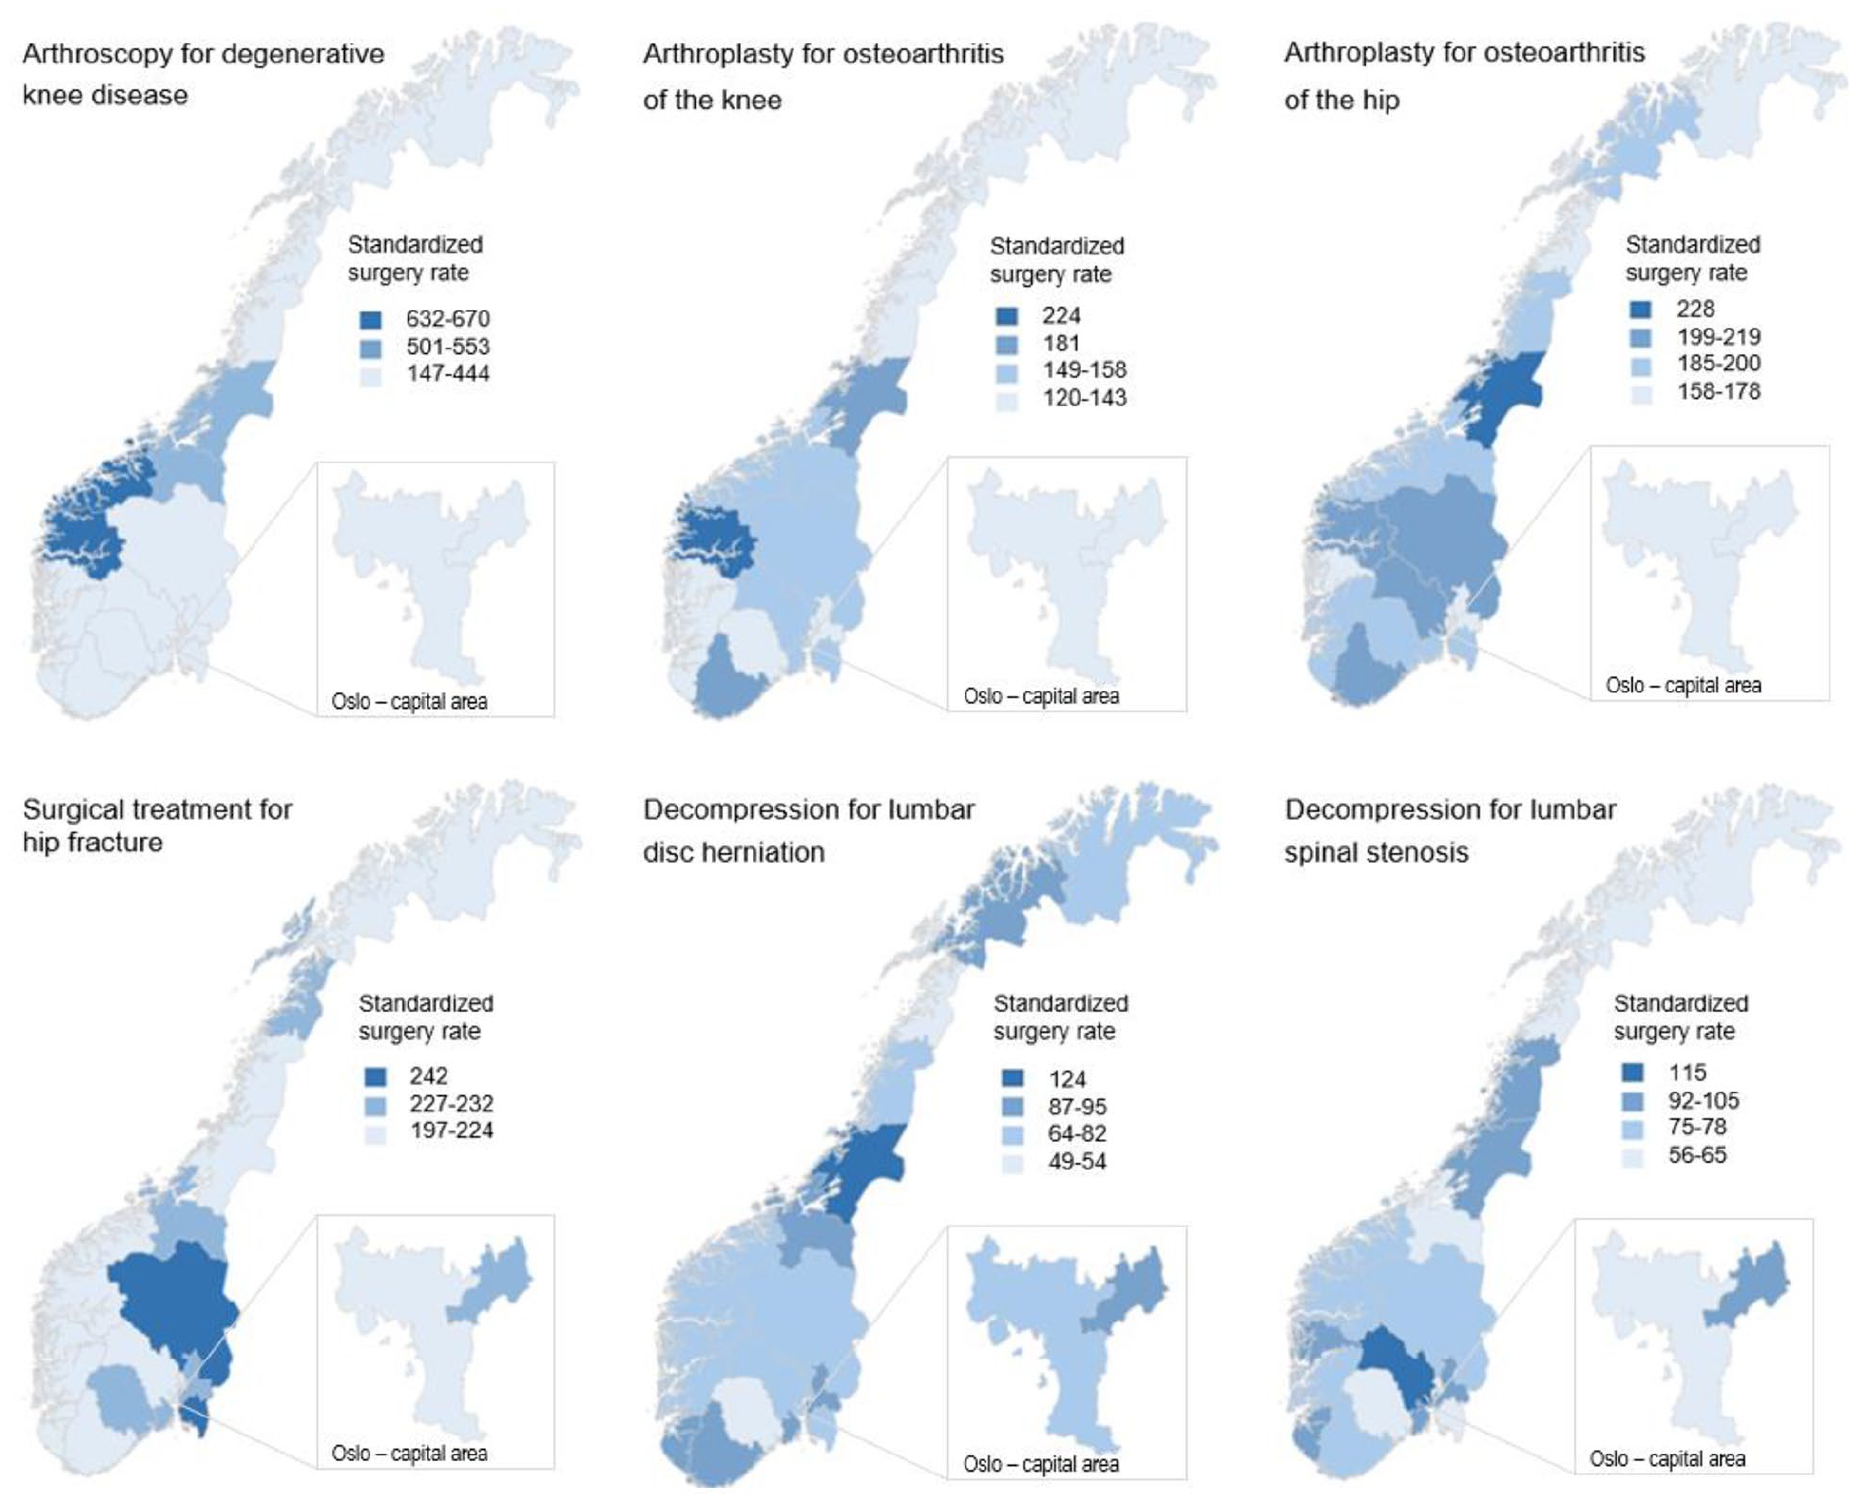
Geographical variation in standardized surgery rates. The square in the lower right-hand corner of each map shows the enlarged map of the capital area.
Table 2 shows the national mean, lowest, and highest values per hospital referral area for factors associated with variation. The association between surgery rates and socioeconomic and supply factors were weak for arthroscopy for degenerative knee disease and decompression for lumbar disk herniation and spinal stenosis. Higher rates of arthroscopy for degenerative knee disease were associated with more orthopedic surgeons (adjusted coefficient 24.8, 95% CI: 2.7–47.0), and a smaller proportion of the population living in urban areas (adjusted coefficient −13.3, 95% CI: −25.4 to −1.2). For decompression for lumbar spinal stenosis, higher rates were associated with more hospitals (adjusted coefficient 22.4, 95% CI: 4.6–40.2), and a larger proportion of the population living in urban areas (adjusted coefficient 2.1, 95% CI: 0.4–3.8). For decompression for lumbar disk herniation, higher rates were associated with lower mortality (adjusted coefficient −192.6, 95% CI: −384.2 to −1.1). For lumbar spine procedures, a sensitivity analysis including the number of neurosurgeons and orthopedic surgeons as separate variables did not change the association.
National mean, lowest, and highest values per HRA for factors associated with variation.
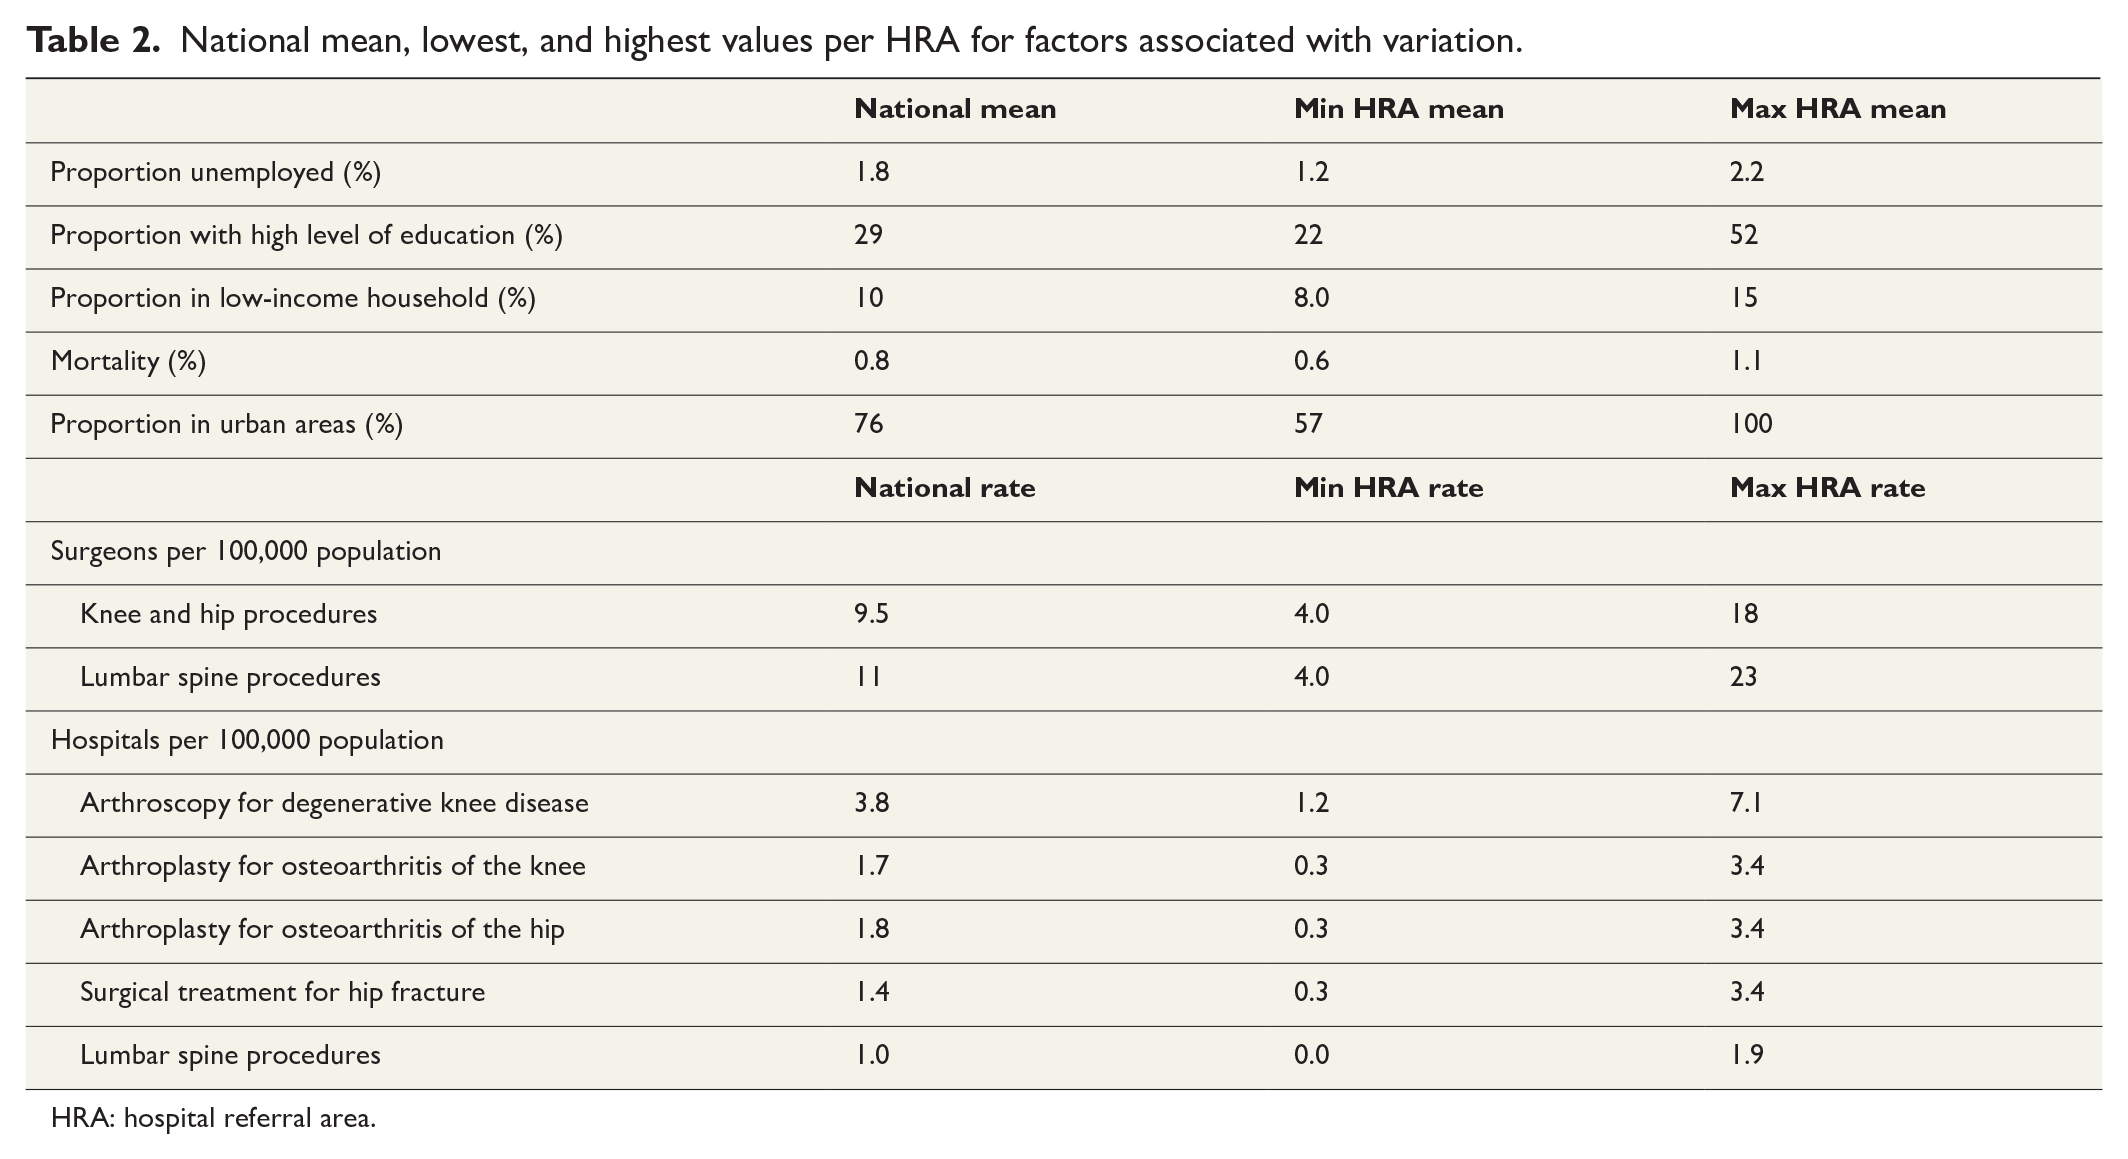
HRA: hospital referral area.
Surgery rates for knee and hip arthroplasty, and surgical treatment for hip fracture were not associated with the supply and demand factors included in this study.
A sensitivity analysis of public and private hospitals included as separate variables did not render notable associations for any of the procedures.
Supplement 2 includes full univariable and multivariable models of the linear regression analysis with standardized surgery rates as outcome.
Discussion
The main finding in this study was that variation in standardized surgery rates ranged from almost none to tenfold across the six orthopedic procedures in publicly funded Norwegian hospitals between 2012 and 2016. The variation was very high (SCV > 10) for arthroscopy for degenerative knee disease for patients 50 years and older, moderate (SCV 3–5) for the decompression procedures for lumbar disk herniation and lumbar spinal stenosis, and low (SCV < 3) for arthroplasty for osteoarthritis of the knee or hip, and surgical treatment for hip fracture.
The rates for arthroscopy for degenerative knee disease decreased markedly in all hospital referral areas. This indicates that practice is being adapted to recommendations in new guidelines. 16 Persisting variation in arthroscopy rates might suggests, however, that different areas are adapting asynchronously. Other European countries and the United States report similar patterns of decrease.4,17,18
We observed that higher rates of arthroscopy for degenerative knee disease had a weak association with more orthopedic surgeons and a larger proportion of the population living in rural areas. The reason for this could not be further explored in this study, but may relate to local practice differences, availability of services, or specific lifestyle demands.
Studies from Ireland, Korea, and the United Kingdom4,5,19 report an increase in knee arthroplasty with deprivation. Rates for knee and hip arthroplasty have also been associated with numbers of surgeons, hospital capacity,5,19,20 and socioeconomic factors.20,21 Our findings align with those reported by De Pina et al. 6 and Mäkelä et al., 22 who found no association with supply or socioeconomic factors. The relatively low variation in arthroplasty for osteoarthritis of the hip is similar to that seen in Finland, where variation decreased from threefold in 1998 to 1.9-fold in 2005. 22
As surgical treatment of a hip fracture is considered both effective and necessary, we did not expect to find any association with supply or demand-related factors. The small amount of variation in hip fracture surgery is in line with other reports4,23 and variation is generally considered to reflect the relatively small differences in incidence.
Variation in spine surgery procedures, similar to that found in the current study, has been observed both internationally and in Norway,2,4,24 and is related to more uncertainty about the effectiveness of the procedures. 25 Bederman et al. 24 found that higher rates were associated with lower income, but found no association with supply of physicians. The number of hospitals was negatively associated with spine surgery rates in Ireland. 4 We found no notable association between spine surgery rates and the area-level supply or demand-related factors analyzed in our study.
Strengths and limitations
The main strength of this study is the availability of nationwide individual-level data on orthopedic procedures performed at publicly funded hospitals, which gives a comprehensive picture of variation in publicly funded healthcare.
Absence of data on privately funded activity is a limitation in our analysis. However, the aim of the study was to analyze differences in access to publicly funded treatment. We did not have data to analyze how privately funded activity influences rates for publicly funded treatment. Furthermore, the number of hospitals is a crude measure, as it does not account for differences in hospital capacity.
Non-operative treatment is an important option for many orthopedic conditions. While this is generally acknowledged, the lack of uniformity in conservative care in the Norwegian public health care system might be a driver of variation in surgery rates. We consider it a limitation that we could not account for this, due to the availability of data.
The number of surgeons includes practicing surgeons nationwide, but remains a rough estimate as the surgeons’ area of residence might not always coincide with the area of work, especially in the larger capital area. Furthermore, we have not included the varying number of surgeons in training, who independently perform some of the included procedures in many hospitals. The proportion of surgeons in training varies between geographical areas, but we did not have access to these data. Finally, some surgeons are not permanently employed, but contracted through staffing agencies, and data quantifying this are not available. Waiting times and theater capacity are other supply factors that probably vary between hospitals, and could cause variation in patients’ access. We did not have data for this, and could not evaluate such factors as possible causes for variation in surgical rates.
It is a limitation of the study design that data on demand-related factors were available on area, and not individual, level. This precludes us from exploring variation in surgery rates in light of demand in the patient groups involved. Hence, the analysis of associations between surgery rates and demand-related factors only gives rough estimates of this relationship. Nevertheless, geographic variation research conducted at a national level, using area-level units of analysis while crude, is important for signaling potential inequality and treatment underuse or overuse. 26
Interpretation
The associations found in our study between area-level demand and supply-related factors and surgery rates were weak. We might assume that the included orthopedic surgery rates are not notably associated with regional numbers of hospitals or surgeons, or with income, education, unemployment, health level (estimated by mortality as a proxy), or with urbanization. This may be a result of long-standing efforts in Scandinavia to facilitate equity by universal health care and tax paid education.
On the contrary, one could argue that area-level factors reflecting demand are not detailed enough to detect the associations that may exist between socioeconomic factors and surgery rates. Qualitative analyses and more detailed multilevel analyses, that include individual-level data of factors known to influence surgery rates, are needed to further explore this. This is being done in two ongoing Norwegian studies on geographic variation in hip and knee arthroplasty and lumbar spine surgery, using a mixed-methods design consisting of multilevel analyses of registry data and qualitative data collection from focus groups (general practitioners) and individual interviews (patients and surgeons).
While sociodemographics and healthcare supply do not seem to explain variation in common orthopedic procedures based on our findings, we acknowledge that there are more factors known to impact utilization of health care. These include differences in preferences among surgeons, the effect of shared decision-making, as well as capacity and structural aspects of the healthcare system.8,27
Conclusion
Variation in surgery rates was particularly high for arthroscopy for degenerative knee disease, such as meniscal tears and osteoarthritis, in Norway between 2012 and 2016, and these rates decreased considerably during the 5-year period, in line with guidelines and international practice. The socioeconomic factors analyzed did not explain geographical variation in orthopedic surgery. Whether this reflects the equity of universal health care services, or whether area-level factors are not detailed enough to detect an existing association is being explored in two ongoing Norwegian studies.
Supplemental Material
sj-xlsx-1-sjs-10.1177_14574969221118488 – Supplemental material for Geographical variation in orthopedic procedures in Norway: Cross-sectional population-based study
Supplemental material, sj-xlsx-1-sjs-10.1177_14574969221118488 for Geographical variation in orthopedic procedures in Norway: Cross-sectional population-based study by Maria Holsen, Veronica Hovind, Haji K. Bedane, Knut I. Osvoll, Jan-Erik Gjertsen, Ove N. Furnes, Mary E. Walsh and Tor Ingebrigtsen in Scandinavian Journal of Surgery
Supplemental Material
sj-xlsx-2-sjs-10.1177_14574969221118488 – Supplemental material for Geographical variation in orthopedic procedures in Norway: Cross-sectional population-based study
Supplemental material, sj-xlsx-2-sjs-10.1177_14574969221118488 for Geographical variation in orthopedic procedures in Norway: Cross-sectional population-based study by Maria Holsen, Veronica Hovind, Haji K. Bedane, Knut I. Osvoll, Jan-Erik Gjertsen, Ove N. Furnes, Mary E. Walsh and Tor Ingebrigtsen in Scandinavian Journal of Surgery
Footnotes
Acknowledgements
The authors acknowledge the assistance of Frank Olsen and Bård Uleberg at the Center for Clinical Documentation and Evaluation (SKDE) for support in the analysis process.
Author contributions
M.H., V.H., H.K.B., and T.I. conceptualized the study. H.K.B. and K.I.O. analyzed the data and M.H., V.H., H.K.B., M.E.W., and T.I. interpreted the results. M.H. wrote the original draft and V.H., M.E.W., J.E.G., O.N.F., and T.I. contributed to the editing and reviewing of the paper. All authors read and approved the manuscript.
Declaration of conflicting interests
The author(s) declared no potential conflicts of interest with respect to the research, authorship, and/or publication of this article.
Disclaimer
Data from the Norwegian Patient Register have been used in this publication. The interpretation and reporting of these data are the sole responsibility of the authors, and no endorsement by the Norwegian Patient Register is intended nor should be inferred.
Ethics approval and consent to participate
All protocols were carried out in accordance with relevant guidelines and regulations. The basis for the processing of data has been the General Data Protection Regulation. Approval by an ethics committee and consent to participate was not required for this registered study.
Funding
The author(s) disclosed receipt of the following financial support for the research, authorship, and/or publication of this article: Support was received from Helse Førde health trust in Norway through grant number 38595/2019 (M.H.).
Supplemental material
Supplemental material for this article is available online.
References
Supplementary Material
Please find the following supplemental material available below.
For Open Access articles published under a Creative Commons License, all supplemental material carries the same license as the article it is associated with.
For non-Open Access articles published, all supplemental material carries a non-exclusive license, and permission requests for re-use of supplemental material or any part of supplemental material shall be sent directly to the copyright owner as specified in the copyright notice associated with the article.