
Abstract
Background:
The recent substantial increase in the number of obese surgeries performed in Sweden has raised concerns about the budget impact.
Objective:
Our aim in this paper is to present an assessment of the budgetary impact of different policies for surgical intervention for obese and overweight subjects from a healthcare perspective in Sweden.
Methods:
The model simulates the annual expected treatment costs of obesity related diseases and surgery in patients of different sex, age and Body Mass Index (BMIMI). Costs evaluated are costs of surgery plus the excess treatment costs that an obese patient has over and above the treatment costs of a normal-weight patient. The diagnoses that are included for costs assessment are diabetes and cardiovascular disease since these diagnoses are the principal diagnoses associated with obesity. Four different scenarios over the number of surgical operations performed each year are simulated and compared: (1) no surgical operation, (2) 3 000 surgical operations in persons with BMI > 40, (3) 4000 (BMI > 40), and (4) 5000 (expanded to BMI > 38).
Results:
Comparing Scenario 2 with Scenario 1 results in a net budget impact of on average SEK 121 million per annum or SEK 40 000 per patient. This implies that 55 percent of the cost of surgery, set equal to SEK 90 000 for each patient, has been offset by a reduction in the excess treatment costs of obesity related diseases. Expanding annual surgery from 3000 to 4000 the cost-offset increased to 58%. By expanding annual surgery further from 4000 to 5000 and at the same time expanding the indication for surgery from BMI > 40 to BMI > 38, no cost-offset is obtained.
Conclusion:
A cost-minimization strategy for bariatric surgery in Sweden should not expand indication, but rather increase the number of surgeries within the currently accepted indication.
INTRODUCTION
The rising trend in obesity has become a heavy cost burden for the health care delivery system in many countries. A frequent used marker for obesity is the Body Mass Index (BMI), defined as the ratio of the weight of a person in kilo to the length of the person in meter squared (kg/m2). The WHO uses this marker and defines a person as obese when BMI is greater than or equal to 30 (1). Persson U et al estimates the health care costs and the indirect costs, i.e. cost for short term sick leave, early retirement and death before retirement, attributable to overweight and obesity in Sweden to SEK 3 575 million and SEK 12 516 million for the year 2003 representing about 2% and 4% respectively of the total health care costs and the total indirect costs for the country (2,–3). Similar costs estimates have been presented for a number of other countries (4,–6). In the US with a much higher prevalence of overweight and obesity, the health care costs associated with overweight and obesity is estimated to account for as much as some 6% of total health care costs (7).
There are basically three different treatment options for obesity: diet and exercise therapy, pharmacological therapy and surgery.
Following great improvement in safety and efficacy of surgery as an alternative for obesity treatment, the demand for surgery has in recent years increased rapidly. Obese surgery is, however, quite expensive and this has raised concern in Sweden about budgetary impacts of an increased demand for surgical treatment of obesity. A Swedish weekly medical paper, recently reported that to offer surgical treatment to all Swedes with BMI > 35 would cost some SEK 18 000 million an amount equal to cost of the annual supplies of pharmaceutical products to the national health care delivery system (8). This estimate, however, overestimates the budgetary impact because it only counts the costs and not the monetary value of the benefits that can be expected to accrue with surgical intervention for obesity.
Budget impact analysis (BIA) has become an essential part of a comprehensive economic assessment of a health care technology along with cost-effectiveness analysis (CEA), prior to formulary approval or reimbursement. BIA is not a substitute for CEA but should be viewed as a complementary analysis. Whereas CEA evaluates the costs and outcomes of alternative therapies over a specified time horizon, a BIA addresses the financial stream of consequences related to the uptake and diffusion of new therapies to assess their affordability over time (5).
OBJECTIVE
Our aim in this paper is to present an assessment of the budgetary impact of different programmes for surgical intervention for obese and overweight subjects in Sweden.
METHODS
In Fig. 1 we illustrate our approach for measuring and assessing the monetary benefit of surgical treatment of obesity. In panel 1 we have drawn in two curves showing the distribution of the obese population before and after surgery and one curve showing the expected cost of treatment per patient for obesity related diseases. Note that the latter curve has a sharply exponential shape that increases with the severity of obesity. The shape of this curve is in accordance with the finding reported by Persson U et al (2). With surgery there will be fewer severely obese people with higher BMI values and as result the total treatment costs of obesity related diseases illustrated in panel 2 will twist and become shifted to a new position which is likely to result in a net monetary benefit with area B smaller than area A. We will examine the potential monetary benefit illustrated in Fig. 1, using a budget impact model (BIM).
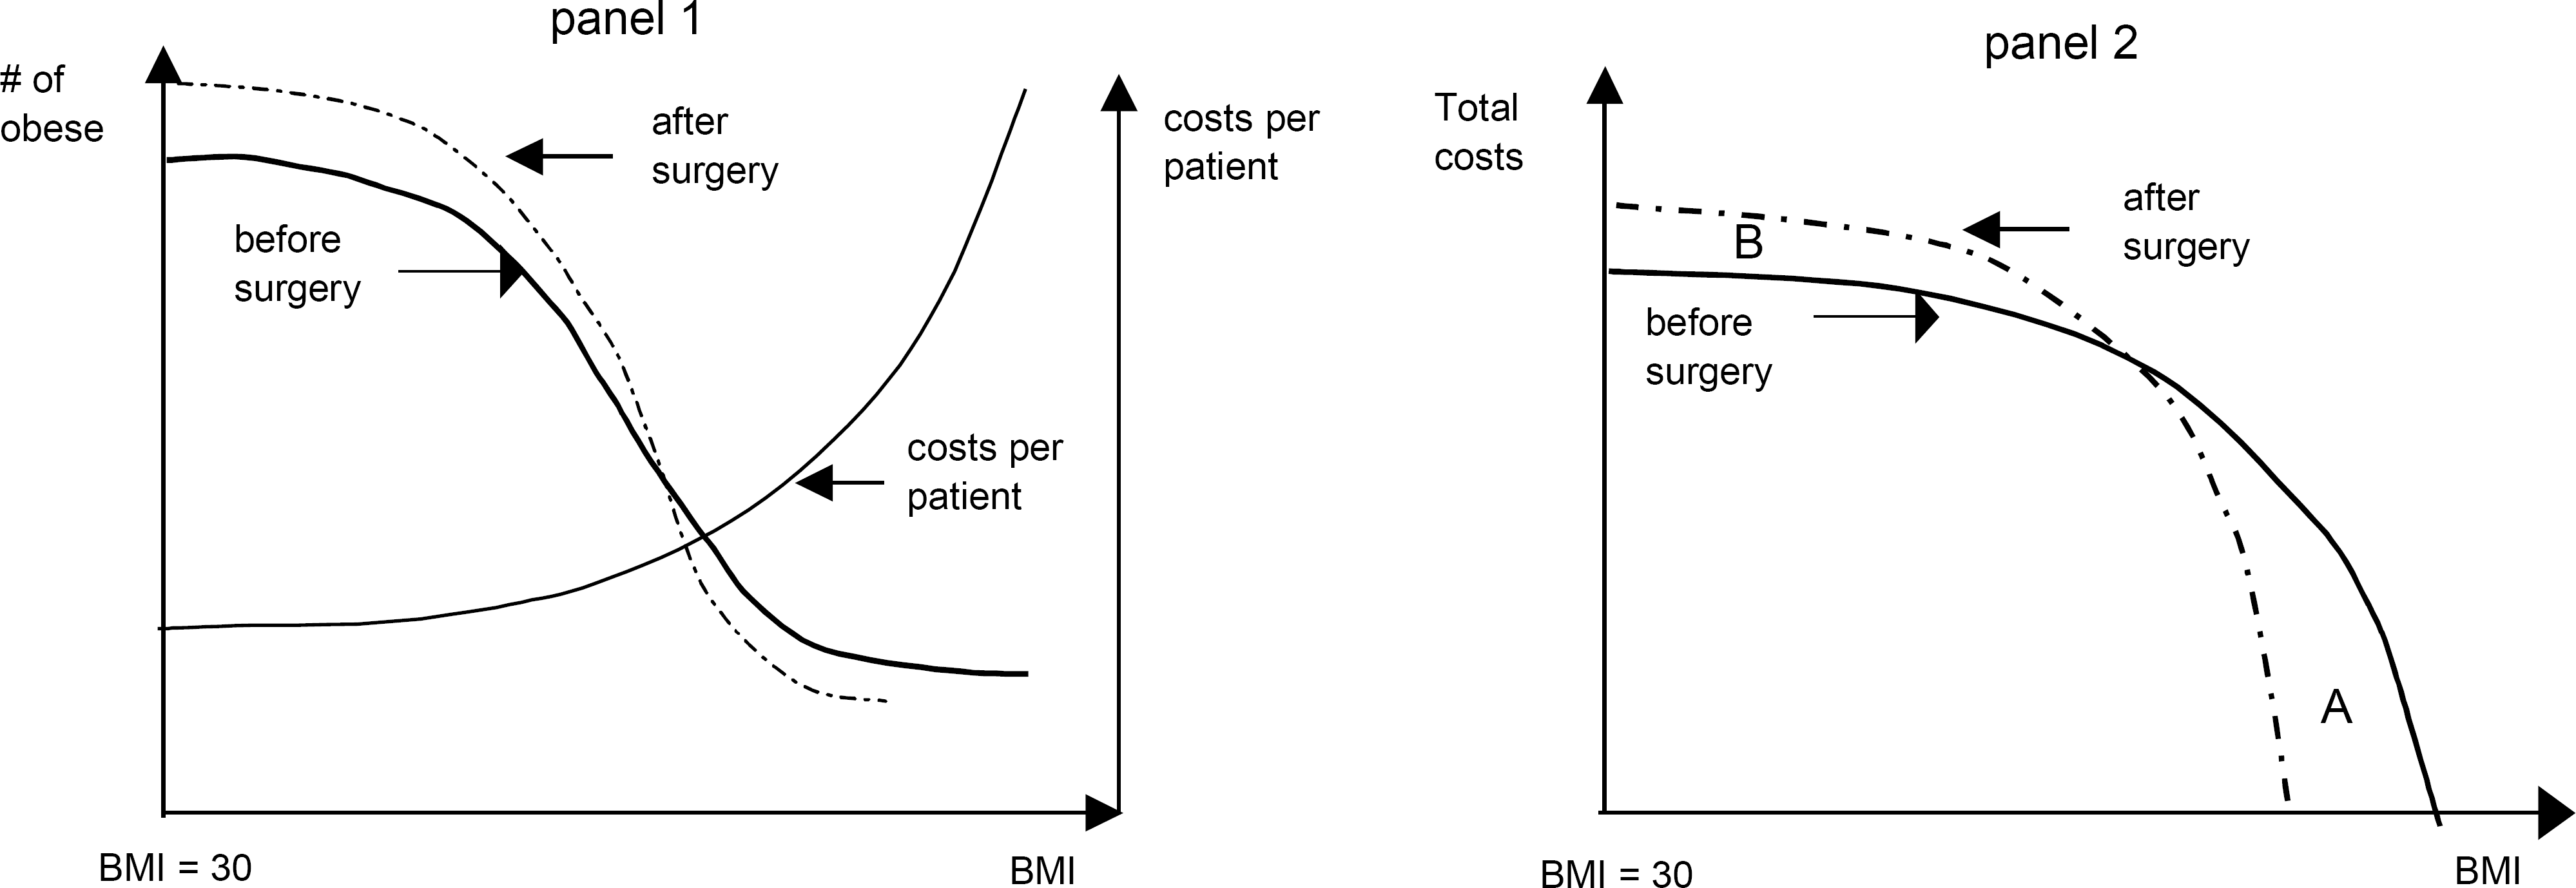
Principal illustration of the distribution of BMI in the obese population before and after surgery (panel 1), and the cost of treatment of obesity related diseases per patient as a function of BMI (panel 1), and a principal illustration of the source of total costs from obese persons with different BMI values, before and after surgery (panel 2).
BIM
A BIM is commonly presented as either an open model or closed model. The two models differ in how they define and measure the size of the target population for which they seek to estimate the budgetary impact of an intervention. In a closed model the budget impact is estimated for a given group of people/a cohort with given set of characteristics. For this group the model simulates the outcomes in terms of the events and the consequent budgetary impacts that the group will generate in the course of the simulation run. A major shortcoming of a closed model is that it fails to account for new cases of diseases in persons that were not members of the group at the start of the simulation run. An open model does not have this shortcoming. The incidence of new cases that will occur over the time horizon of the simulation and for which the intervention will take place, are accounted for. Drawing on the general guidelines for budget impact analysis as presented in a working paper from International Society for Pharmacoeconomics and Outcomes Research (ISPOR) (9), we have developed an open model.
Our model is a micro-simulation model that simulates the budgetary impact with surgical treatment of an obese patient. The underlying methodology is that of a Markov model. At the start of the simulation run, a population of overweight and obese persons (BMI > 25) is sampled from a data set representing the adult Swedish population (defined as ≥ 15 years old). These values are subsequently updated each year as follows:
Each person's BMI value is updated to account for an • annual change/up-drift in BMI Parameters specify the number of surgical operations to • be done each year, and the model will randomly draw eligible candidates in the population for surgery, eligibility criteria BMI above a given threshold (see below), and no prior surgery received. The BMI value is subsequently adjusted for the effect of surgery. New overweight persons enter the model, by moving • from having normal weight to become overweight. It is assumed that all new cases of overweight persons just pass the threshold value of BMI = 25, and their age and gender are randomly sampled from the corresponding Swedish subpopulation. New 15-year old persons enter the model, to represent • children than become adult. They are randomly sampled from the population of 15-year old Swedes, with regards to gender and BMI. Each person's survival is evaluated based on a risk of death determined from age, gender and BMI, and in addition, a one-time risk of death in connection to surgery in those given surgery. The costs accrued by each person is derived from two different sources: (1) surgery procedure costs and (2) expected excess costs of treatment of obesity related diseases. The excess cost for a person with a BMI value greater than 25 is defined as the difference in cost of treatment for obesity related diseases between a person with that BMI value and a normal weight patient (20 ≤ BMI < 25). With surgery a patient's BMI is reduced and consequently the excess treatment costs also decline.
For budget impact analysis we used a 10 year time horizon and ran 4 different simulation scenarios using Monte-Carlo simulation techniques, of the annual number of surgical interventions performed: 1) no surgical interventions; 2) 3000 surgical interventions; 3) 4000 surgical interventions and 4) 5000 surgical interventions, and at the same time expanding the BMI range for being eligible for surgery, from BMI > 40 to BMI > 38.
MODEL INPUT DATA
Population characteristics
The characteristics of each patient are drawn from the adult (age 15–84) Swedish population. In Fig. 2 we report the distribution of the overweight and obese population by age, gender and BMI (10). The initial number of persons with obesity (prevalence) is 785 thousand (74% mild, 19% moderate and 7% severe obese). We apply WHO's classification and define mild obese to be those with BMI in the range 30 to 35, moderate obese to be those with BMI in the range 35 to 40 and severe obese for those with BMI greater or equal to 40. Overweight persons are those with BMI in the range 25 to 30. The model is set to draw candidates for surgery as 80% women and 20% men to reflect current practice (11).
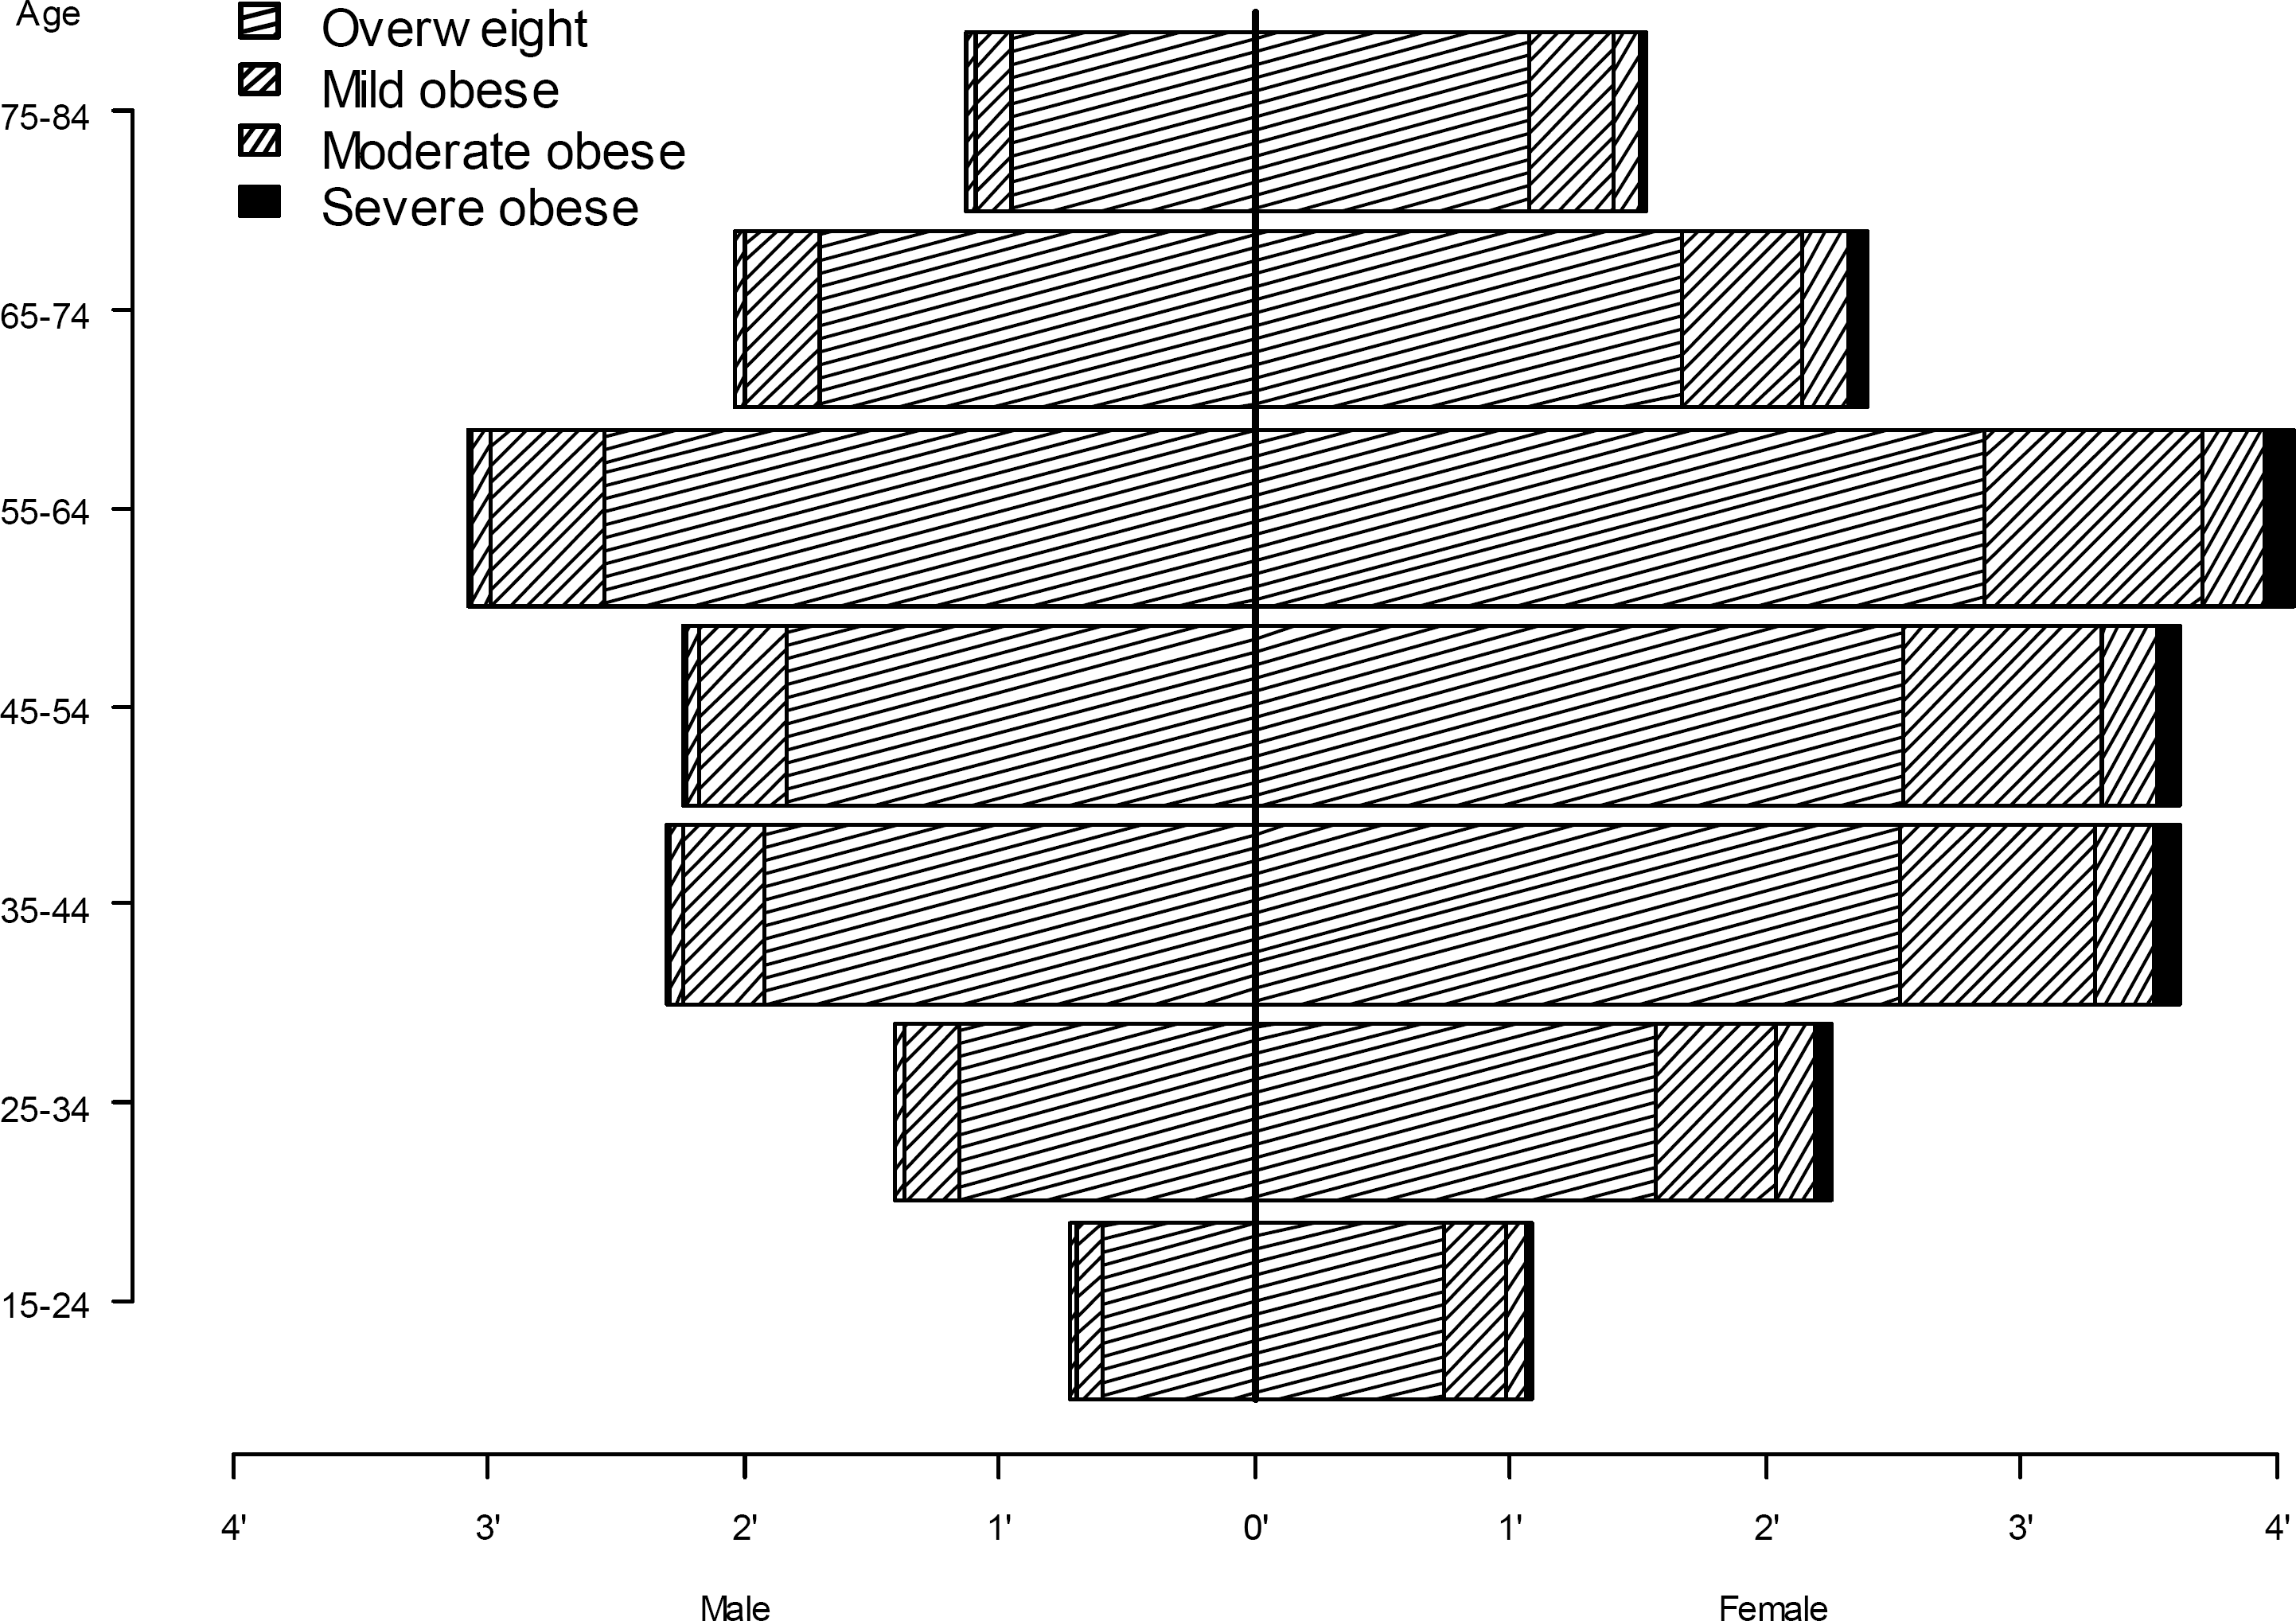
The model's initial population pyramid, showing the number of overweight, mild, moderate and severe obese persons by age group (15–24, 25–34, et c.) and gender.
Obesity-related mortality
In the medical literature the mortality rate of the obese population is reported to be about twice as high as for the general population of corresponding age and gender (12,–14).
To account for the risk of death we use the age and gender specific general mortality risk in the Swedish general population, and in order to account for excess mortality due to obesity, we accelerate the general mortality using gender and BMI in accordance with published data from the Prospective Studies Collaboration (13).
In addition to these mortality risks, a patient undergoing surgery faces an additional risk of death. From the Swedish Obesity Study (SOS) it has been reported that 1 person died for every 500 surgeries performed (15). For our model estimate we apply this mortality risk for patients undergoing obese surgery.
Obesity drift
Obesity drift is a measurement of how a persons weight changes with age. Drawing on the finding from a large study of socioeconomic status and obesity growth by Baum CL and Ruhm AI (16), we set the drift equal to +0.12 BMI per annum for age < 45. Unfortunately the study only reports BMI growth for age below 40, but they report that the growth curve has a concave shape. Using prevalence data of obesity of different age group and corresponding mortality data from Flegal KM et al (14), we estimate the BMI drift to be +0.07 BMI per annum for people in the age group 45–65, and −0.17 BMI per annum (i.e. negative) for people with age > 65.
Obesity surgery efficacy
For our model estimate we use the efficacy as reported by gastric by-pass technique from the Swedish obesity study (SOS) (17). In the first year following gastric-bypass surgery on 265 patients the average weight loss was 32%. A gradual increase in weight gain was, however, observed after the initial year. During a 15-year period the average weight loss remained between 20–30%. For our model estimate we assume an average weight loss of 27%. In order to avoid overestimation of the benefit from a BMI reduction in terms of survival and costs, we adjusted the reduction above according to a maximum fraction of benefit, i.e. the modelled patient has an actual BMI value, reduced by 27% by surgery. This value is used for describing the patient's level of obesity. In addition, the patient has an adjusted BMI value which is gradually reduced over three years time from the point of surgery, to reflect 75% of the actual weight reduction by the end of the three years. After this point, the adjusted BMI value, as well as the actual BMI value, are updated annually using the Obesity drift presented above. The patient's costs (reflecting the need for healthcare) and mortality are determined from the adjusted BMI value. The maximum fraction and the time period were estimated from the economic outcome seen in the Swedish Obesity Study (SOS).
Treatment cost of obesity-related diseases
To capture the costs as experience by Swedish health care providers, we use data from a study that have analysed the development in costs of treatment of obesity related diseases (2). The diseases covered in this study included diabetes, hypertension, angina, myocardial infarction and stroke caused by hypertension. Using the so-called population attributed risk approach, this study reports the excess cost attributed to overweight and obesity for the health care providers to SEK 1,369 million for men and SEK 1,598 million for women in 2003 years prices (2, Table 4.3). In Table 1 we have converted these cost estimates to per capita estimates and updated them to the 2006 price level. For our purpose the important point to note in Table 1 is that the excess cost per capita increase rapidly with the severity of obesity.
Per capita excess treatment costs obesity related diseases, SEK per year.
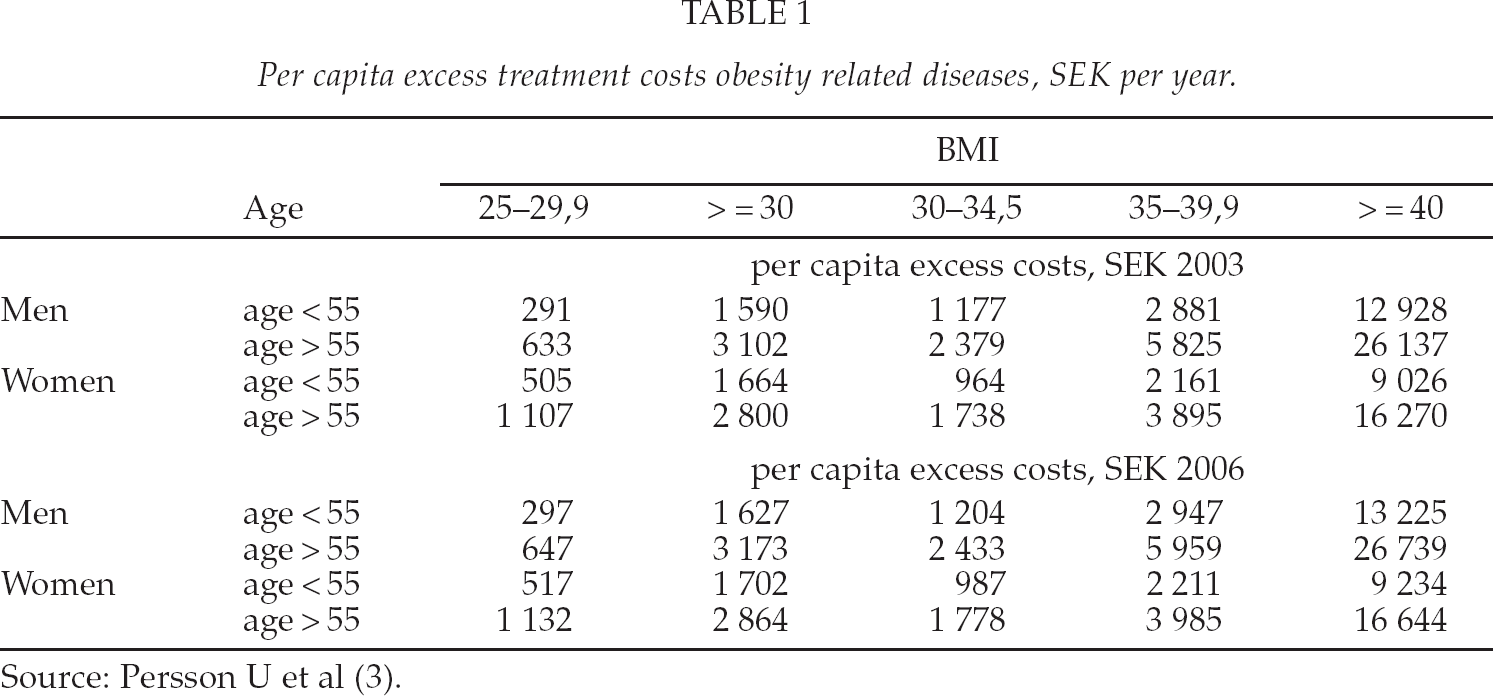
The model assigns annual excess costs to patients according to their current BMI, age group and gender. For persons with normal weight, the excess cost is by our definition zero, and for persons with overweight (25 ≤ BMI < 30) we use the average costs estimates as reported in Table 1. For obese patients (BMI ≥ 30) we fitted the following equation using the data in Table 1 to obtain an excess cost for each BMI value, for men and women, with age < 55 and age ≥ 55: Excess cost = α + β(BMI-30)2. The values of α for men and women, with age < 55 and age ≥ 55, respectively, are found in Table 1 in the column for BMI 25–29.9 (e.g. 297 for men age < 55). The β coefficient for men aged < 55 is 80, and 162 for age ≥ 55. The corresponding β values for women are 45 and 79.
Surgical treatment costs
Cost of surgical treatment varies among Swedish hospitals. Our model uses the findings from a Swedish study that report the cost to be SEK 70 000 (18). As an assumption, we increased this cost to SEK 90 000 to account for costs for follow-up plastic surgery that may be needed.
RESULTS
The number of surgical interventions reported in Table 2, reflect the aim to enrol 20% men and 80% women for surgery, and that aim was met with Scenario 2 and Scenario 4. For Scenario 3 at the end of the simulation run, nearly all severe obese men had received surgery so that less than 20% men could be found to be eligible for surgery. Instead a higher percentage of women were selected for surgery.
Total number of surgical operations over ten years in Sweden, initial and resulting number of obese persons after ten years (thousand persons), with each of the four scenarios.
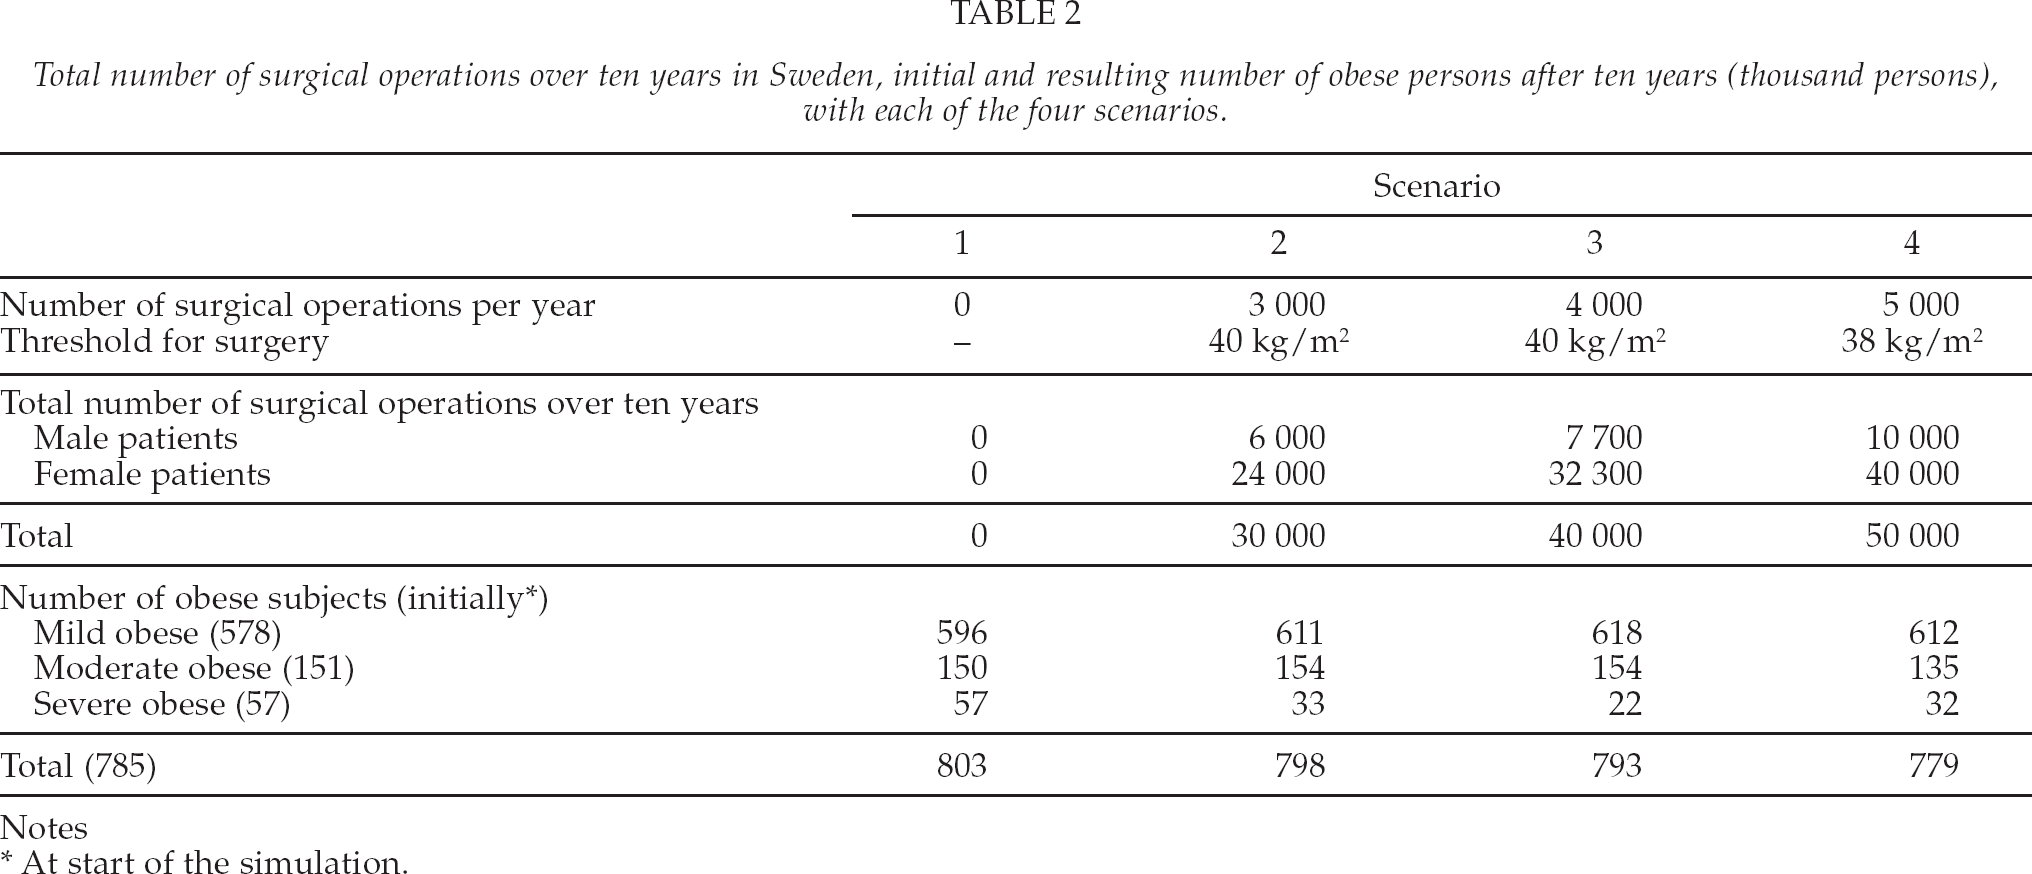
Notes
At start of the simulation.
The effect of surgery, in terms of resulting number of obese persons after ten years, is shown in Fig. 3 along with the initial state of the population. All surgery scenarios reduced the number of severe obese subjects (Table 2). With all scenarios, the number of mild obese persons increased, but more so in the ones with surgery because some patients with reduced BMI are transferred into the mild obese group. With scenario four, which has an extended indication (BMI 38 as threshold), the reduction in severe obese was less than with the other strategies. This was because a number of moderate obese was selected for surgery which reduced the number of severe obese selected for surgery. Another important point to note in Fig. 3 is that the number of obese persons increased over ten years time with all scenarios except the fourth. The reason for this result is that we let new obese subjects enter the model each year, as we are using an open model.
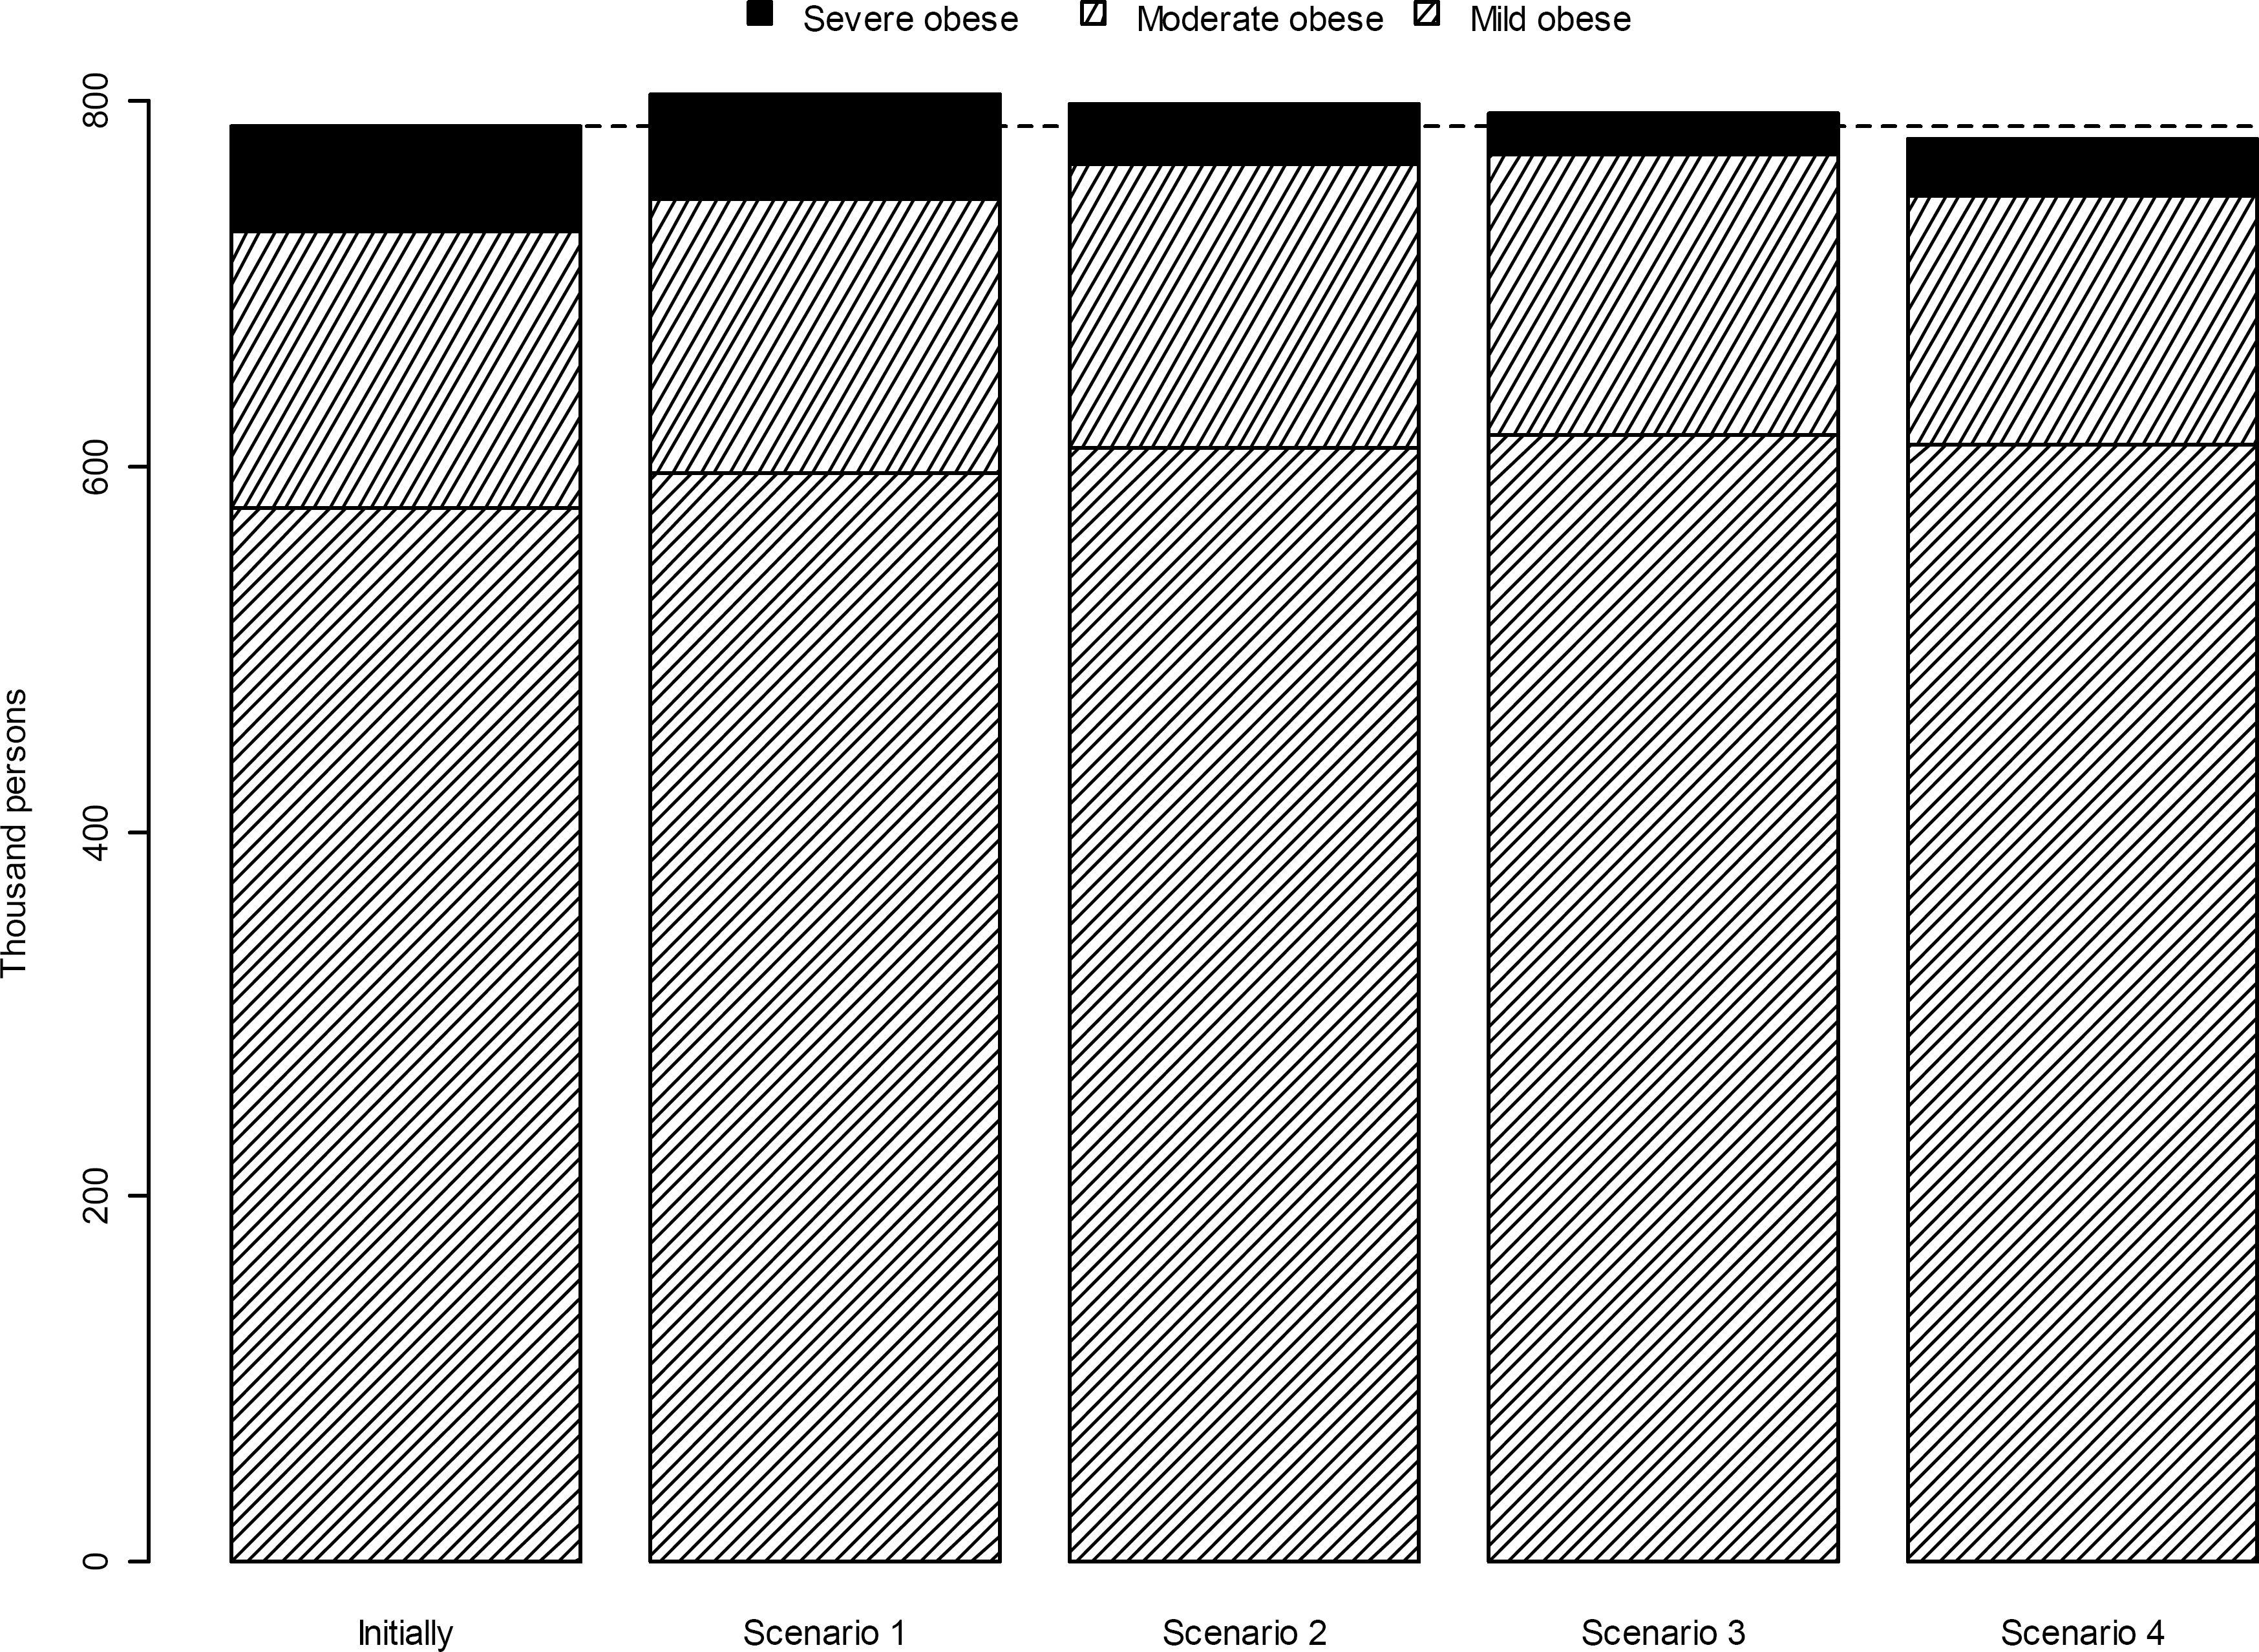
The total number of mild, moderate and severely obese persons initially in the model (leftmost), and after ten years according to each of the scenarios 1 to 4.
We measure the net cost/budget impact per annum which we define as the difference in average annual costs between Scenario 1 and Scenarios 2, 3 and 4 respectively. For Scenario 2 we estimate the net cost/budget impact to SEK 121.3 million, The corresponding net cost/budget impact for Scenario 3 and 4 we estimate to SEK 152.6 million and SEK 247.5 million respectively.
Another important point to note is that with surgery more than half the cost of a surgical treatment per patient, SEK 90 000, is offset by a change/reduction in excess healthcare costs for treatment of obesity related diseases (Table 3). The cost offset we defined as the difference in cost of surgery per patient and the total costs per patient. For Scenario 2 the simulation result gave a total cost per patients of SEK 40 410 implying a cost-offset of SEK 49 590. Expressed as a percentage of the cost of surgery, this corresponds to a cost offset of 55.1%. The corresponding percentage cost offset with Scenario 3 and 4 is 57.6% and 45.0% respectively. The reason for the decline with Scenario 4 is that in this scenario we have also expanded the indication for surgery to include non-severe obese patients. This is a consequence of how the excess costs of obesity related diseases increase with higher BMI values, implemented in our model as annual excess cost functions described above. For less severe obese patients the excess cost of obesity related diseases is less than for more severe obese persons, and hence there is less potential to reduce the excess cost of treatment of obesity related diseases.
Total expenditure for surgery, total excess costs due to overweight and obesity and total costs in Sweden (million SEK), and total cost per patient (SEK), by cost component, over ten years, according to each of the four scenarios.
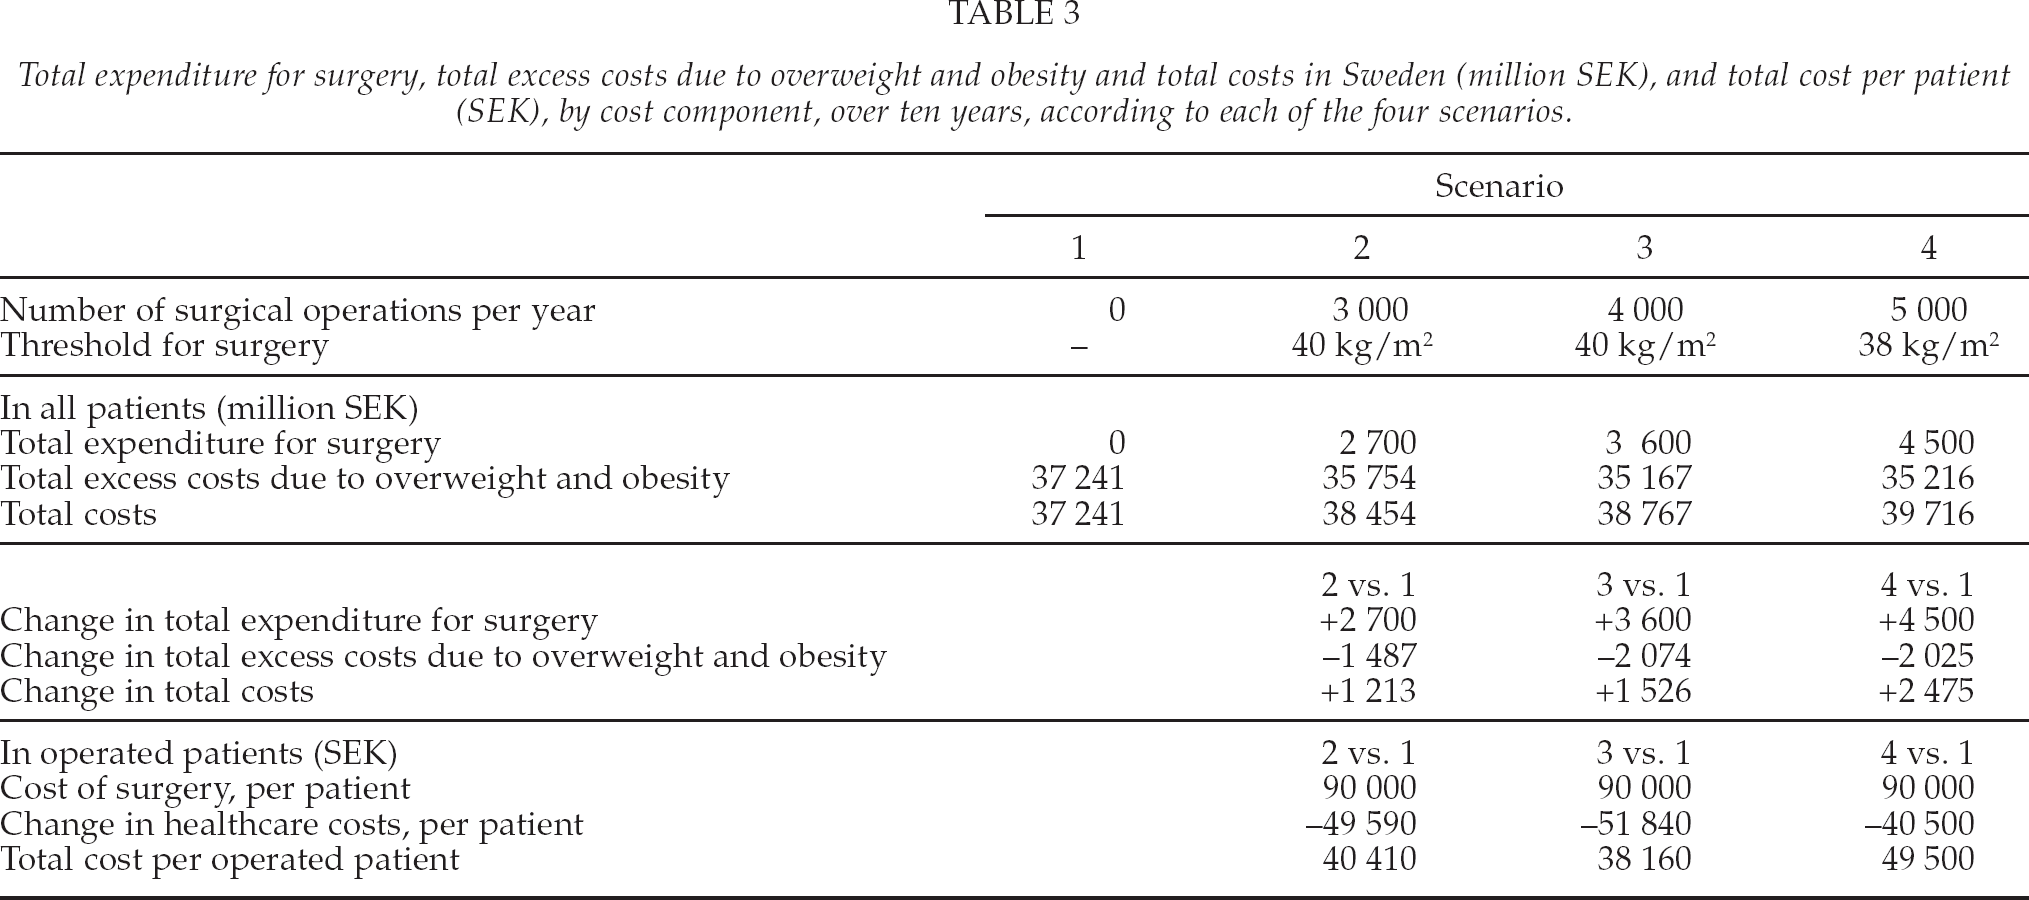
Also an interesting point to note is the development in the incremental cost-offset ratio. Comparing Scenario 3 with Scenario 2 that is an increase in the number of annual surgeries from 3 000 to 4 000, showed a net cost-offset of 65.2%, but expanding further from 4 000 surgeries to 5 000 surgeries and a wider BMI range, no further cost-offset is obtained. In fact it becomes slightly negative, as the net cost per patient becomes larger than the cost of a surgical procedure.
DISCUSSION
Our comparison of different surgery scenarios shows that performing 4 000 surgeries per year or less will not reduce the number of obese in the Swedish population, but 5 000 surgeries per year will. With 4 000 surgeries per year, we saw that after ten years, all obese male persons with BMI > 40 had been operated, and a higher proportion of women had to be operated in order to maintain the annual rate of 4 000 surgeries. Our scenario with 5 000 surgeries per year also used an expanded BMI range, so that anyone with BMI > 38 kg/m2 was eligible for surgery. This increased the number of potential candidates by some 70%, and consequently there were enough male candidates throughout the entire time frame.
Our estimates of the budget impact per annum in Scenarios 2, 3 and 4 respectively, compared to Scenario 1 range from SEK 121 million to SEK 248 million. These estimates are in stark contrast to the budget impact of SEK 18 000 million that we have reported on in the introduction (8). The reason is that the latter estimate did not count the monetary benefit of surgeries and also used a lower BMI threshold value for surgery, BMI > 35, had been used. Thus, the latter estimate neglected the cost offset from reduced morbidity, and it was also based on a much larger patient population, both inflating the estimate.
It was recently estimated that 7 300 surgeries will be performed in Sweden in 2010, a 50% increase compared to 2009, and it was indicated that the increase will continue (19). This may be the case, but this rate of surgery cannot be maintained unless the BMI threshold is lowered as well (e.g. from today's BMI > 40 to BMI > 38). However, if the threshold is lowered, the cost offset seems to be declining beyond 4 000 surgeries per year. To defend such an expanded inclusion policy, other values must be demonstrated, such as the benefit for the patients. Our model takes the impact of surgery on risk factors into account, in the sense that reduced mortailty and reduced morbidity affects the costs of patients and hence the budget impact of surgery. There would also be an impact on the patients' quality of life (20). However, evaluating this aspect is not within the scope of the current budget impact study. Increasing the number of surgeries within current indication (BMI > 40), requires that a higher proportion of women is given surgery.
We believe we have captured some of the major features of obesity and bariatric surgery in our model. Our effort to model bariatric surgery was with the purpose to estimate the budget impact in Sweden. To our knowledge, two other models have been developed for this purpose. A model by Ackroyd et al was developed and used in the settings of Germany, UK and France (21). Their model was subsequently used by Anselmino et al in Austria, Italy and Spain(22). A model by Chevalier et al was developed for the French setting (23). Although neither of these models have been used in the Swedish setting, it may be of interest to contrast our model to theirs, as there are some important differences. Ackroyd's model is limited to a cohort (closed model) of obese Type 2 Diabetes Mellitus patients (BMI > 35 kg/m2), and thus they cannot estimate the full burden of overweight and obesity. Chevalier's model is based on a cohort of 1 000 patients given surgery, so it too is a closed model. We have an open model that has an annual inflow of new 15 year old persons coming into age (overweight as well as obese), corresponding to nativity. We also have an annual inflow of persons in all ages becoming overweight, i.e. the incidence of overweight. Another central feature of our model is that we can select different eligibility criteria (the BMI threshold) for bariatric surgery, and the annual number of surgeries (by gender). None of the other two models appears to have this feature. Furthermore, we use an age-dependent BMI drift to update each person's BMI, age, gender, and BMI specific mortality, QALY weights etc, as explicit efforts to model patient heterogeneity, whereas Ackroyd's model simulates a homogeneous cohort of obese patients, and they do not incorporate mortality in their model. While Chevalier et al based BMI change on data from five years of follow-up. With all these difference together, we therefore believe we have made significant contributions to this field of modeling.
However, there are also weaknesses in our study. The amount of data for patients with very high BMI values are scarce, and one might have concerns that our fitted equations for the excess costs, which grow with the BMI squared, might have too high impact. On the other hand, the number of persons with such high BMI values are relatively low, so this impact is very limited. Another uncertainty is with the dynamic model in terms of how population strata of age, gender and degree of obesity change over time (see Fig. 2), given our submodels of mortality, patient inflow and BMI drift. Inspection of how the population transforms over time reveals a slow transformation mainly due to the surgery scenario, but also due to a growing population with increasing proportion of overweight. Overall, however, it retains the shape in Fig. 2. Furthermore, we believe the available Swedish data indicate a continuing growth of the number of overweight and obese persons. However, the peak of the epidemic of obesity may have been reached in nearby Finland (20). If this is true also in Sweden, the need to increase the number of bariatric surgery operations may be exaggerated and this supports our finding that the indication for surgery should not be expanded. However, for such a change in the obesity epidemic to be analysed in our model, we would have to determine its causes and adjust relevant parameters, which could be incidence, obesity drift, and obesity related mortality. Therefore, the incidence and prevalence of obesity should be carefully followed up.
CONCLUSIONS
A cost-minimization strategy for bariatric surgery in Sweden should not expand indication, but rather increase the number of surgeries within the currently accepted indication.
Footnotes
ACKNOWLEDGEMENTS
Research relating to this study was funded by an unrestricted grant from Bariatric Edge, Johnson & Johnson Nordic AB, Sollentuna, Sweden