
Abstract
Keywords
There is a long tradition of estimating population-level illicit drug use by using general population surveys. However, decreasing response rates, a relatively rare phenomenon under study as well as an often hard-to-reach population are well-known limitations in this method, complicating estimations and increasing uncertainty (Johnson, 2014). Therefore, new methods for population-based estimates of illicit drug use have been searched for.
One of these newer methods is wastewater-based epidemiology (WBE), which allows direct calculation of amounts of drugs used by a certain population from actual drug residues excreted in municipal wastewater by drug users residing in the area (van Nuijs et al., 2011). A growing body of literature exists where wastewater analyses are compared to other data sources to assess the level and trends in illicit drug use (Been et al., 2015; González-Mariño et al., 2020; Goulding et al., 2020; Kankaanpää et al., 2016; van Wel et al., 2016; Zuccato et al., 2016). The results have suggested that WBE can be used to estimate drug use in the population irrespective of some discrepancies between different data sources in some studies (Baz-Lomba et al., 2016). However, WBE on its own cannot provide information on all aspects of the drug situation, and, indeed, the strength of reporting has shown to be enhanced when WBE is added to other monitoring tools (Goulding et al., 2020; Tscharke et al., 2015).
With data triangulation (Denzin, 1970), different methods can be used to investigate a certain domain of social reality from different viewpoints or angles, as Erzberger and Kelle (2003) put it. These viewpoints provide different pictures of that reality that might not validate each other but that might yield a fuller and more complete picture of the phenomenon concerned if brought together (Erzberger & Kelle, 2003). In the case of illicit drug use, this could be achieved by combining traditional survey data with WBE and online surveys targeted at people who use illicit drugs, another example of the newer methods in the field of illicit drug research (Matias et al., 2019). The advantage and importance of triangulating data to seek complementary information have increasingly been noted in the field of substance use (Rehm et al., 2021; Reuter et al., 2021).
The purpose of this study was to illuminate different aspects and thus reach a more complete understanding of illicit stimulant use (particularly amphetamine use) in Finland. In contrast to an earlier study comparing WBE with driving-under-the-influence-of-drugs statistics and seizure data (Kankaanpää et al., 2016), here we aimed to diversify the picture towards the general population. We were able to triangulate from three separate but complementary data, which were based on the same population and gathered at the same time. The data used were wastewater data covering the Helsinki metropolitan area (HMA; representing approximately one-fourth of the Finnish population in 2018) as well as 12 other Finnish cities and surroundings, a general population survey on drugs and the European Web Survey on Drugs (Finnish data). The first two datasets represent the general Finnish population, whereas the latter is directed to the population using illicit drugs. More specifically, the aims were (1) to analyse the changes in stimulant use between 2014 and 2018, (2) to provide information on the correlates of stimulant use (especially amphetamine use), and (3) to compare the frequency of use and the routes of administration among people using amphetamine.
We did not strive for validation, i.e., confirming the results derived from one method. The aim was rather to put the findings from different methods into dialogue to extend the knowledge potential (Flick et al., 2012). The findings of different data are compared, contrasted and synthesised to further develop the knowledge base of this phenomenon in Finland. As complete a picture as possible is important, since bringing all the information together enables the development of different measures to be used more effectively, for example in prevention, harm reduction or treatment.
Material and methods
This study was based on the integration of three different quantitative datasets—the wastewater analysis data (WBE), general population surveys on drugs (GPS) and a web survey targeted at people using illicit drugs (EWSD).
Wastewater analysis (2014 and 2018)
Samples of untreated wastewater were collected from the inlets at 15 wastewater treatment plants (WWTPs) located in 14 cities in Finland (Supplementary Figure 1). These WWTPs covered approximately 49% of the Finnish population in 2018. All of the WWTPs serve more than 20,000 inhabitants, with the Helsinki Viikinmäki being the largest WWTP in the Nordic countries with 855,000 inhabitants served. Using the equipment available at each WWTP, seven consecutive 24-h wastewater influent composite samples were collected in either a volume- or time-proportional mode during two yearly sampling periods in March and November 2014 and 2018.
Wastewater samples were analysed using in-house developed methodologies in the THL forensic toxicological laboratory. Drugs were extracted from 40-mL aliquots of the acidified wastewater samples using solid-phase extraction, and instrumental analyses were performed with an ultra-high performance liquid chromatography coupled to a triple quadrupole mass spectrometer (Kankaanpää et al., 2014; Kankaanpää et al., 2016).
Measured concentrations (in ng/L) of illicit drugs or their metabolites in wastewater were used to calculate the daily consumption of drugs in a given community. The measured concentrations were multiplied by the measured flow rate of the wastewater stream (L/day) to transform the drug concentrations into mass loads. Then, a correction factor for urinary drug excretion was applied to back-calculate from mass loads (in mg/day) into the amount of an illicit drug that was being consumed (in mg/day). Finally, daily consumption rates were further divided by the population being served by the respective WWTP to express the results as mg/day per 1000 inhabitants. For comparisons between different geographical areas, average drug consumption was calculated for the HMA (Helsinki and Espoo wastewater treatment plants, approximately 1.25 million inhabitants in 2018) and the rest of the country (Joensuu, Jyväskylä, Kotka, Kuopio, Lahti, Lappeenranta, Oulu, Rovaniemi, Savonlinna, Tampere, Turku and Vaasa, approximately 1.45 million inhabitants). A thorough description of the methods is served elsewhere (Kankaanpää et al., 2014; Kankaanpää et al., 2016).
General population survey (2014 and 2018)
GPSs conducted in Finland in 2014 and 2018 served as population-based data. They were collected by Statistics Finland following the same protocol: representative-stratified random samples of the population aged 15–69 years—excluding the institutionalised population, those without a permanent address and residents of the Åland Islands—were drawn from the Finnish Population Information System. The samples were stratified by age (15–39 and 40–69 years) and region (those living in and outside of HMA). In addition, younger age groups (15–39 years) were oversampled to increase the analytical power in the age group most actively using drugs. Thus, the data include a representative population of the same area (HMA) where the wastewater samples are collected from and the timing of the data collection (from 4 September to 12 December in 2014 and from 7 September to 27 December in 2018) was overlapping with the latter wastewater sampling periods (from 25 November to 2 December in 2014 and from 28 November to 5 December in 2018) in both years. Respondents were contacted by mail, and data were collected by self-administered anonymous questionnaires with responses possible either via the internet or by mail. The size of the random samples was 7000 persons in both data collections, and there were 6714 respondents in total (3485 in 2014 and 3229 in 2018) reaching response rates of 50% and 46%, respectively. Data and their collection are described more thoroughly elsewhere (Karjalainen et al., 2020).
Stimulant use was measured with the question: “Have you during the last 12 months tried or used (a) amphetamine, (b) methamphetamine, (c) cocaine or crack, (d) ecstasy?” (yes, no). In addition to examining each of these substances separately, a variable “past-year stimulant use” (yes, no) was formed where stimulant use during the last 12 months was described as the use of at least one of the stimulants (a–d) mentioned above.
Covariates used were geographical area, age, gender, education, employment status, living arrangements, underage children, income subject to state taxation, hazardous alcohol use (AUDIT-C points ≥ 5 for women, ≥ 6 for men), simultaneous polydrug use during the last 12 months and the year of the survey. Education, living arrangements and income subject to state taxation were based on register data linked to the survey data by Statistics Finland.
Web survey (2018)
EWSD is an online survey targeted at people who use illicit drugs managed by the European Monitoring Centre for Drugs and Drug Addiction. During its two waves (2016 and 2017/2018), data were collected in 14 European countries with the LimeSurvey online survey tool. The survey project is described more thoroughly elsewhere (Matias et al., 2019). In this study, we used the Finnish data collected in 2018. The respondents were recruited via a press release reposted on online media, posts on social media, paid advertisements on Facebook and YouTube, and sharing information about the survey through low-threshold drug services, non-governmental organisations and students’ electronic mailing lists. For the response to be accepted in the data, the respondent needed to have consented to participate, was aged 18 years or over, had used one of the drugs covered in the last 12 months and gave a response of adequate quality. The total number of the respondents in the Finnish data was n = 3952, but we included only residents of Finland (n = 3851) in the analysis.
A dependent variable used was “frequency of amphetamine use”, based on the question: “On how many days have you used amphetamine during the last 12 months?” (n = 1109). Based on the previous literature (Trautmann et al., 2013), the use of amphetamine among respondents was divided into infrequent (<11 days/year), occasional (11–50 days/year) and frequent (51–365 days/year).
Independent variables used were age, gender, education, employment status and living arrangements.
Data triangulation
The changes in stimulant use between 2014 and 2018 among the Finnish population were analysed by comparing WBE and the GPS (aim 1). As WBE does not offer direct information to describe actual users, the GPS was used to examine the correlates of the stimulant use among those living in HMA (thus contributing to the amounts of drug findings in wastewater) and examine whether these correlates differ among stimulant users in HMA and the rest of the country. Furthermore, as the number of drug users was quite low in the GPS, and some drug users may be underrepresented in it due to sampling methods, background variables of amphetamine users were compared between the GPS and EWSD, which had a notably larger number of respondents reporting amphetamine use (aim 2). To further enrich the information on people using amphetamine, frequency of use and routes of administration were analysed with EWSD (aim 3).
Statistical analysis
Frequencies and cross-tabulations were used to analyse the proportions, prevalence levels and changes in stimulant use. A chi-square (χ2) test was performed to compare the distribution of socio-demographic variables among amphetamine users in the GPS and EWSD.
With GPS data, logistic regression was used to examine the correlates of stimulant use, with past-year stimulant use as an outcome measure (0 = no (ref), 1 = yes). Interactions between geographical area and other covariates were tested to study whether there were differences in the socio-demographics of stimulant use owing to the geographical area. For the logistic regression analyses, 2014 and 2018 data were pooled together to increase the statistical power.
With EWSD data, multinomial logistic regression was used to examine the association of socio-demographics as well as routes of administration and frequency of amphetamine use. Frequency of amphetamine use was used as an outcome measure (0 = infrequent use (ref), 1 = occasional use, 2 = frequent use).
The results of the regression models were presented as odds ratios (OR) with 95% confidence intervals (CI), and all the covariates were controlled for in the adjusted models. With GPS data, SAS Enterprise Guide 7.1 was used, and analyses were computed using the survey procedures provided in the software package. Stratified sampling was taken into account using the strata option. To compensate for the oversampling of the younger age groups and participant non-response, weighting coefficients calculated by Statistics Finland were used so that the data were representative of the Finnish adult population in terms of age, gender, education and level of urbanisation. With EWSD data, SPSS version 27 was used.
Research ethics
The study protocols of both the GPS and EWSD were approved by the Ethical Review Board of the Finnish Institute for Health and Welfare. WBE data were not collected on individuals or from small areas and were concentrated on a population of at least 20,000 inhabitants. The ethical research guidelines proposed for WBE were followed (Sewage Analysis CORe group Europe, 2016).
Results
Changes in stimulant use 2014–2018 (WBE and GPS)
Figure 1 shows the changes in stimulant use in Finland from 2014 to 2018. According to the WBE, the use of different stimulants (measured by milligrams consumed) has increased in HMA as well as in other parts of the country, except for MDMA. According to the GPS, the prevalence of those reporting past-year stimulant use has increased as well, except for amphetamine and ecstasy in HMA. The figure also shows that the use of different stimulants was more prevalent in HMA than in other parts of Finland.
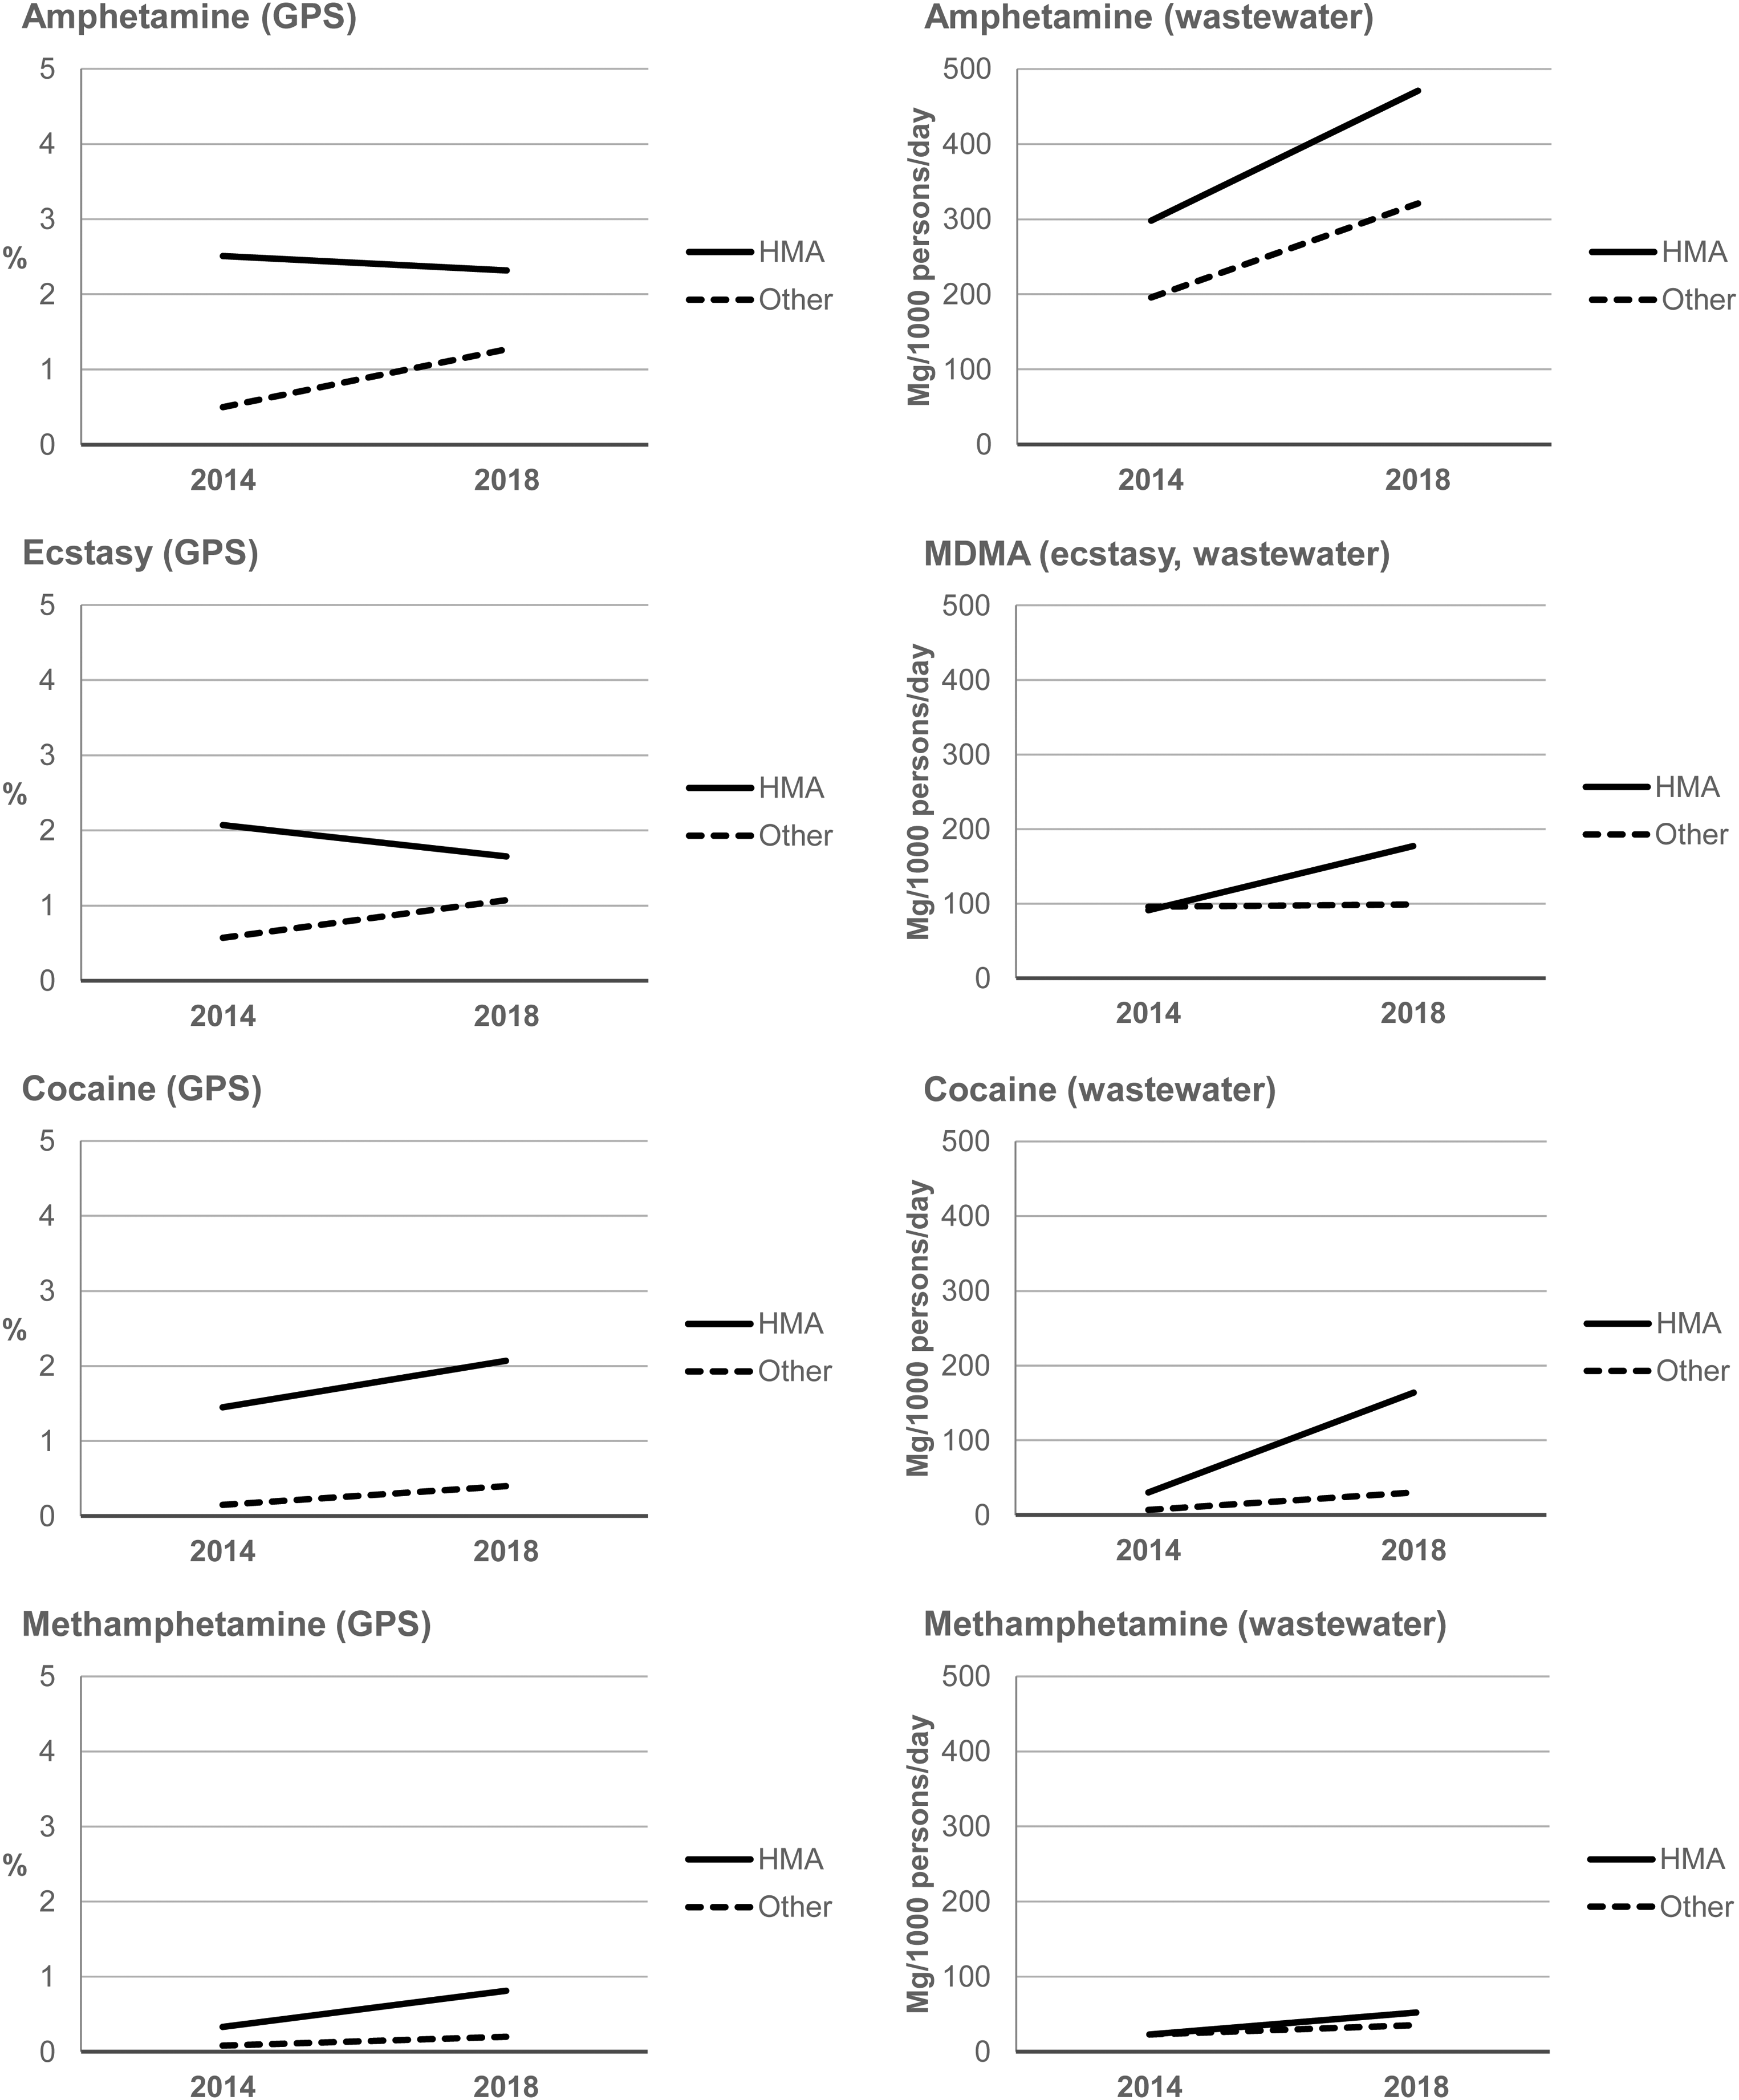
Changes in the use of stimulants according to a general population survey on drugs (GPS; left column) and wastewater analyses (consumed use, right column) in Finland between 2014 and 2018.
These findings concerning the GPS were confirmed to be statistically significant in the regression model as the OR for stimulant use was 2.901 (adjusted model) in HMA compared to other parts of Finland and 1.786 in 2018 compared to 2014 (Table 1).
The associations between socio-demographics and past-year stimulant use in the general Finnish population (general population survey, n = 6714), logistic regression.
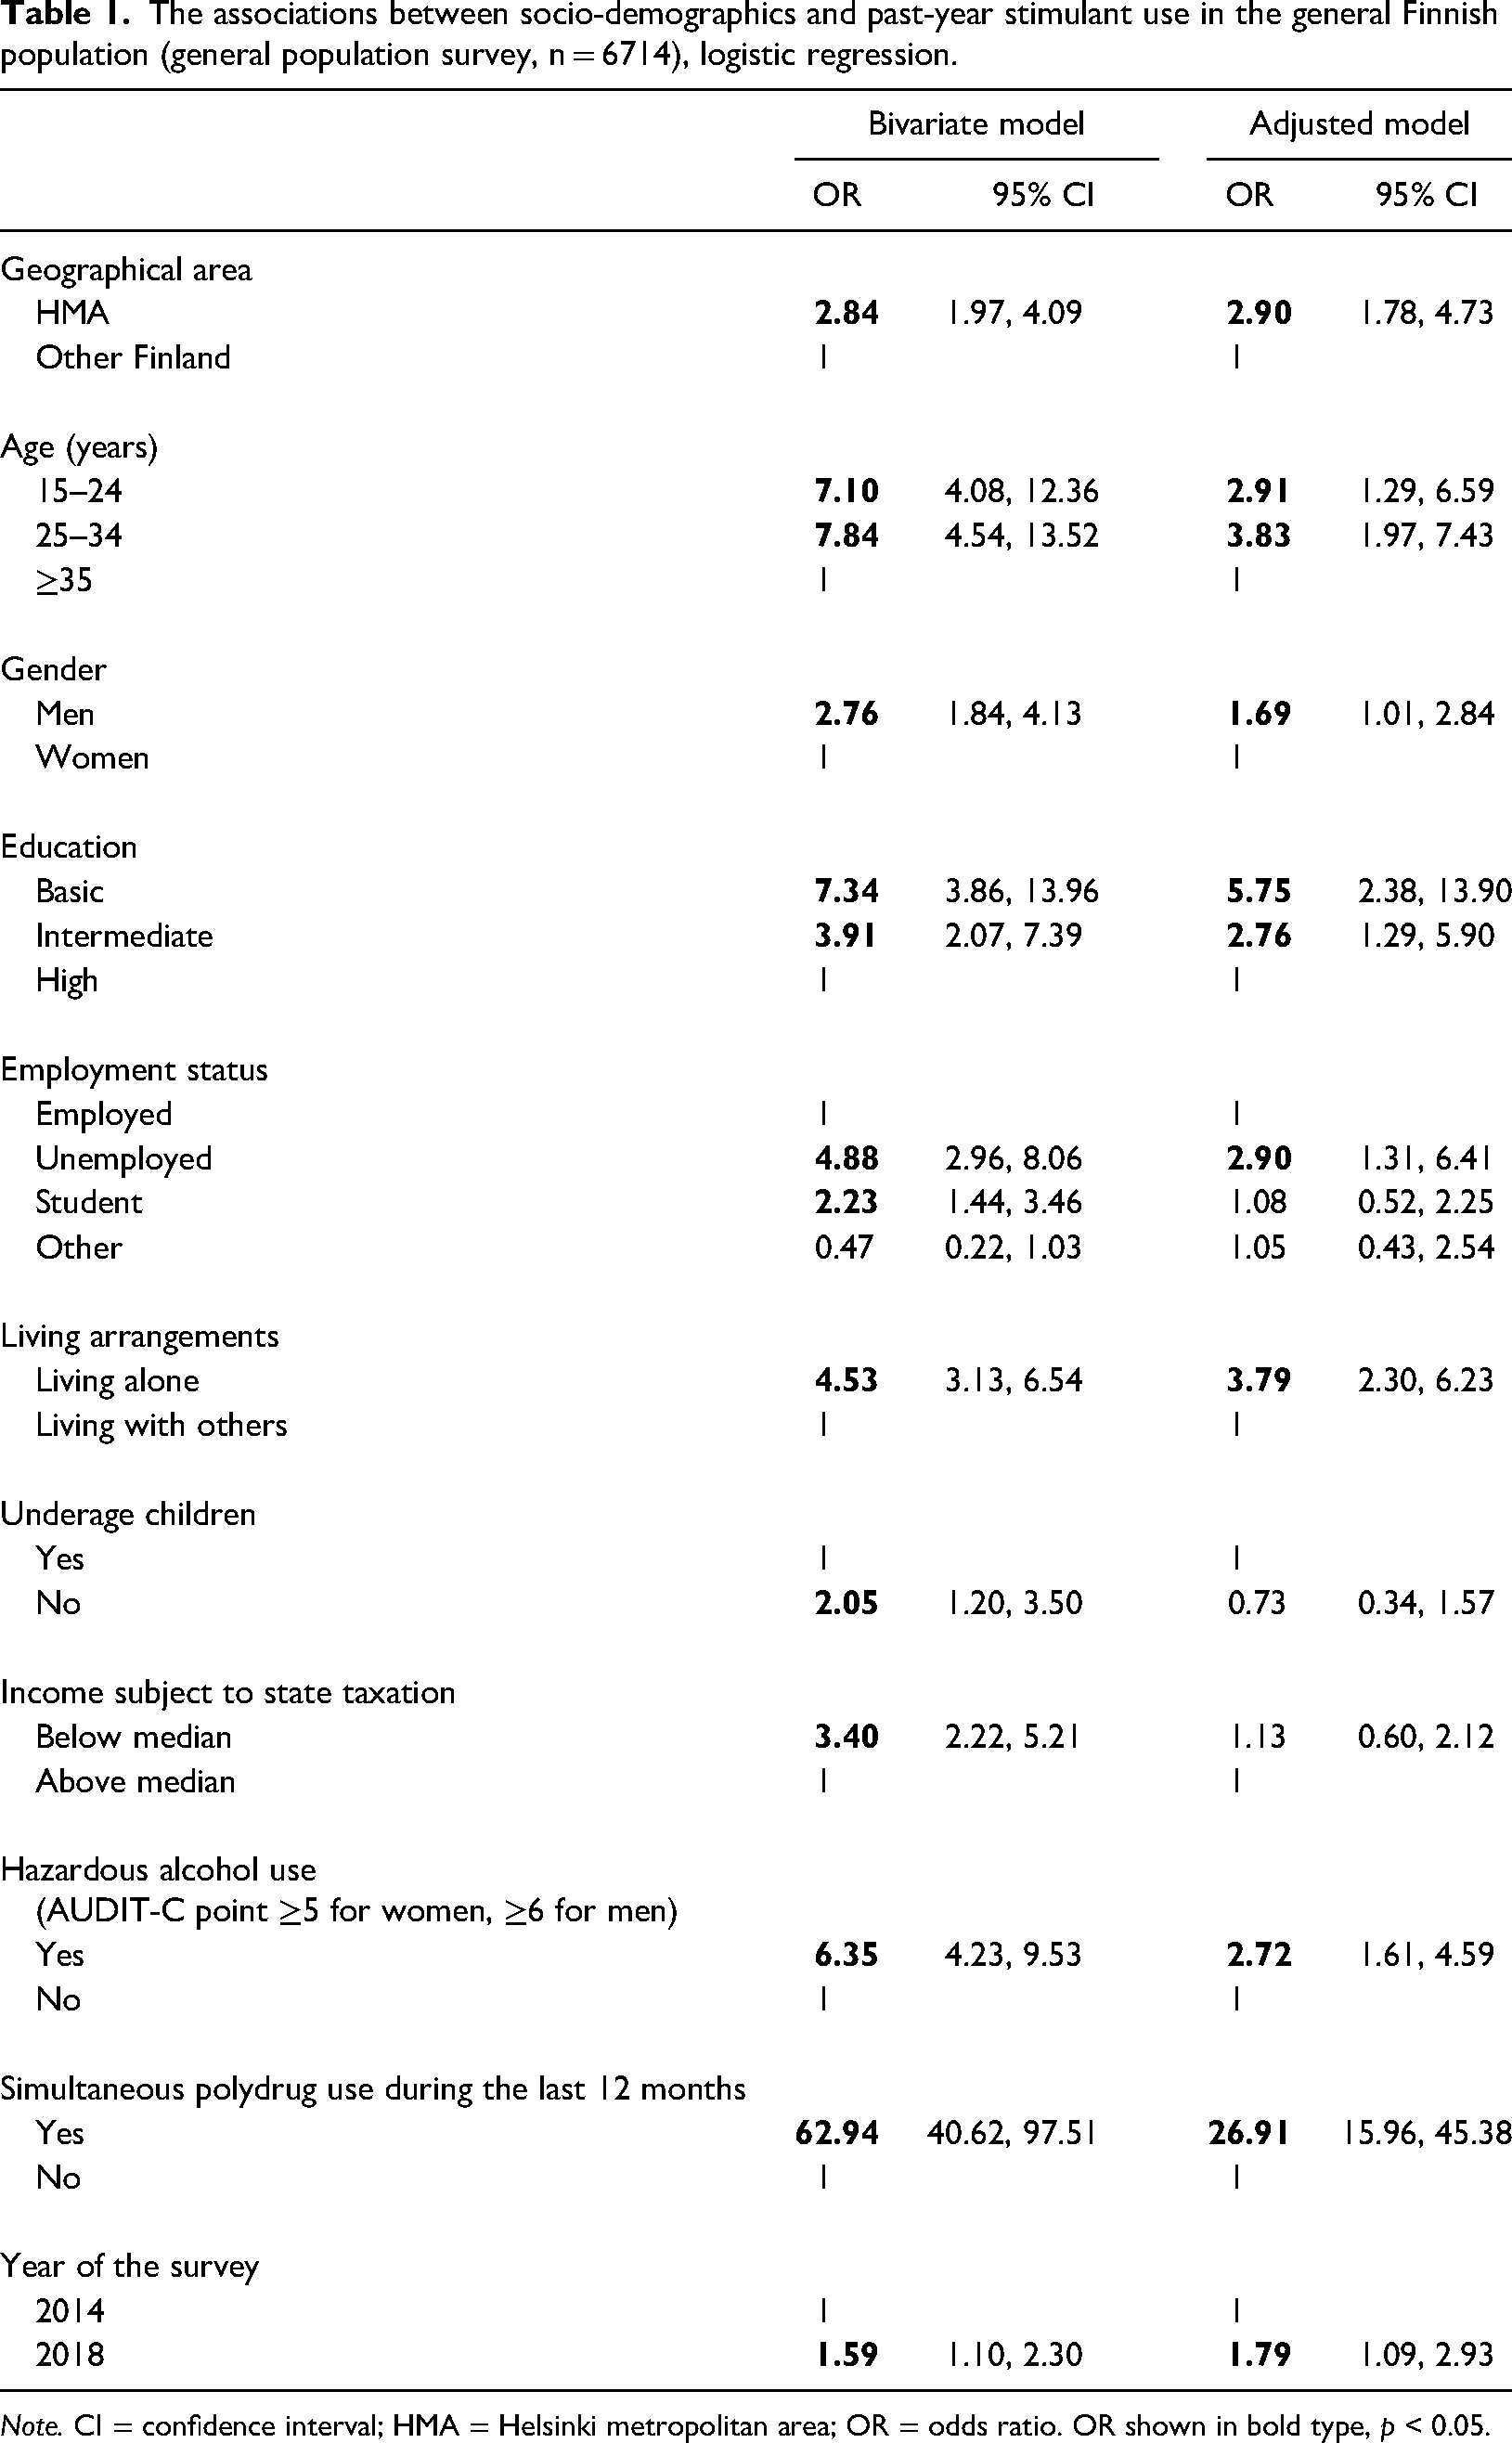
Note. CI = confidence interval; HMA = Helsinki metropolitan area; OR = odds ratio. OR shown in bold type, p < 0.05.
Correlates of stimulant use (GPS)
To describe the population that has consumed the stimulants found in the wastewater analyses, socio-demographics associated with stimulant use were examined using the GPS. Past-year stimulant use was independently associated with younger age, male gender, lower education, unemployment and living alone as well as hazardous alcohol use and simultaneous polydrug use (Table 1). Although a lower income or not having underage children was associated with past-year stimulant use in the bivariate models, the associations did not remain statistically significant when adjusted for other variables.
Interactions between geographical area (HMA, other) and other variables were tested (not shown in the table), but none of them reached statistical significance, indicating that correlates of stimulant use are similar throughout the country.
Descriptions of amphetamine use (WBE, GPS and EWSD)
Next, the focus turns solely on the use and the users of amphetamine. From the WBE, it can be derived that 210 kg of pure amphetamine was used in HMA during 2018, and according to the GPS, 2.3% of the population living in HMA had used amphetamine in 2018.
To examine whether and how socio-demographics of those reporting past-year amphetamine use differ among the respondents of the GPS and the EWSD, these two data were compared. The distribution of socio-demographics differed statistically significantly in all other variables except for gender and living arrangements (Table 2). The proportion of young, those with intermediate/high education and those employed or a student seemed to be higher among past-year amphetamine users in the EWSD compared to the GPS.
The distribution of socio-demographic variables among amphetamine users in the GPS and EWSD, both conducted in Finland in 2018.
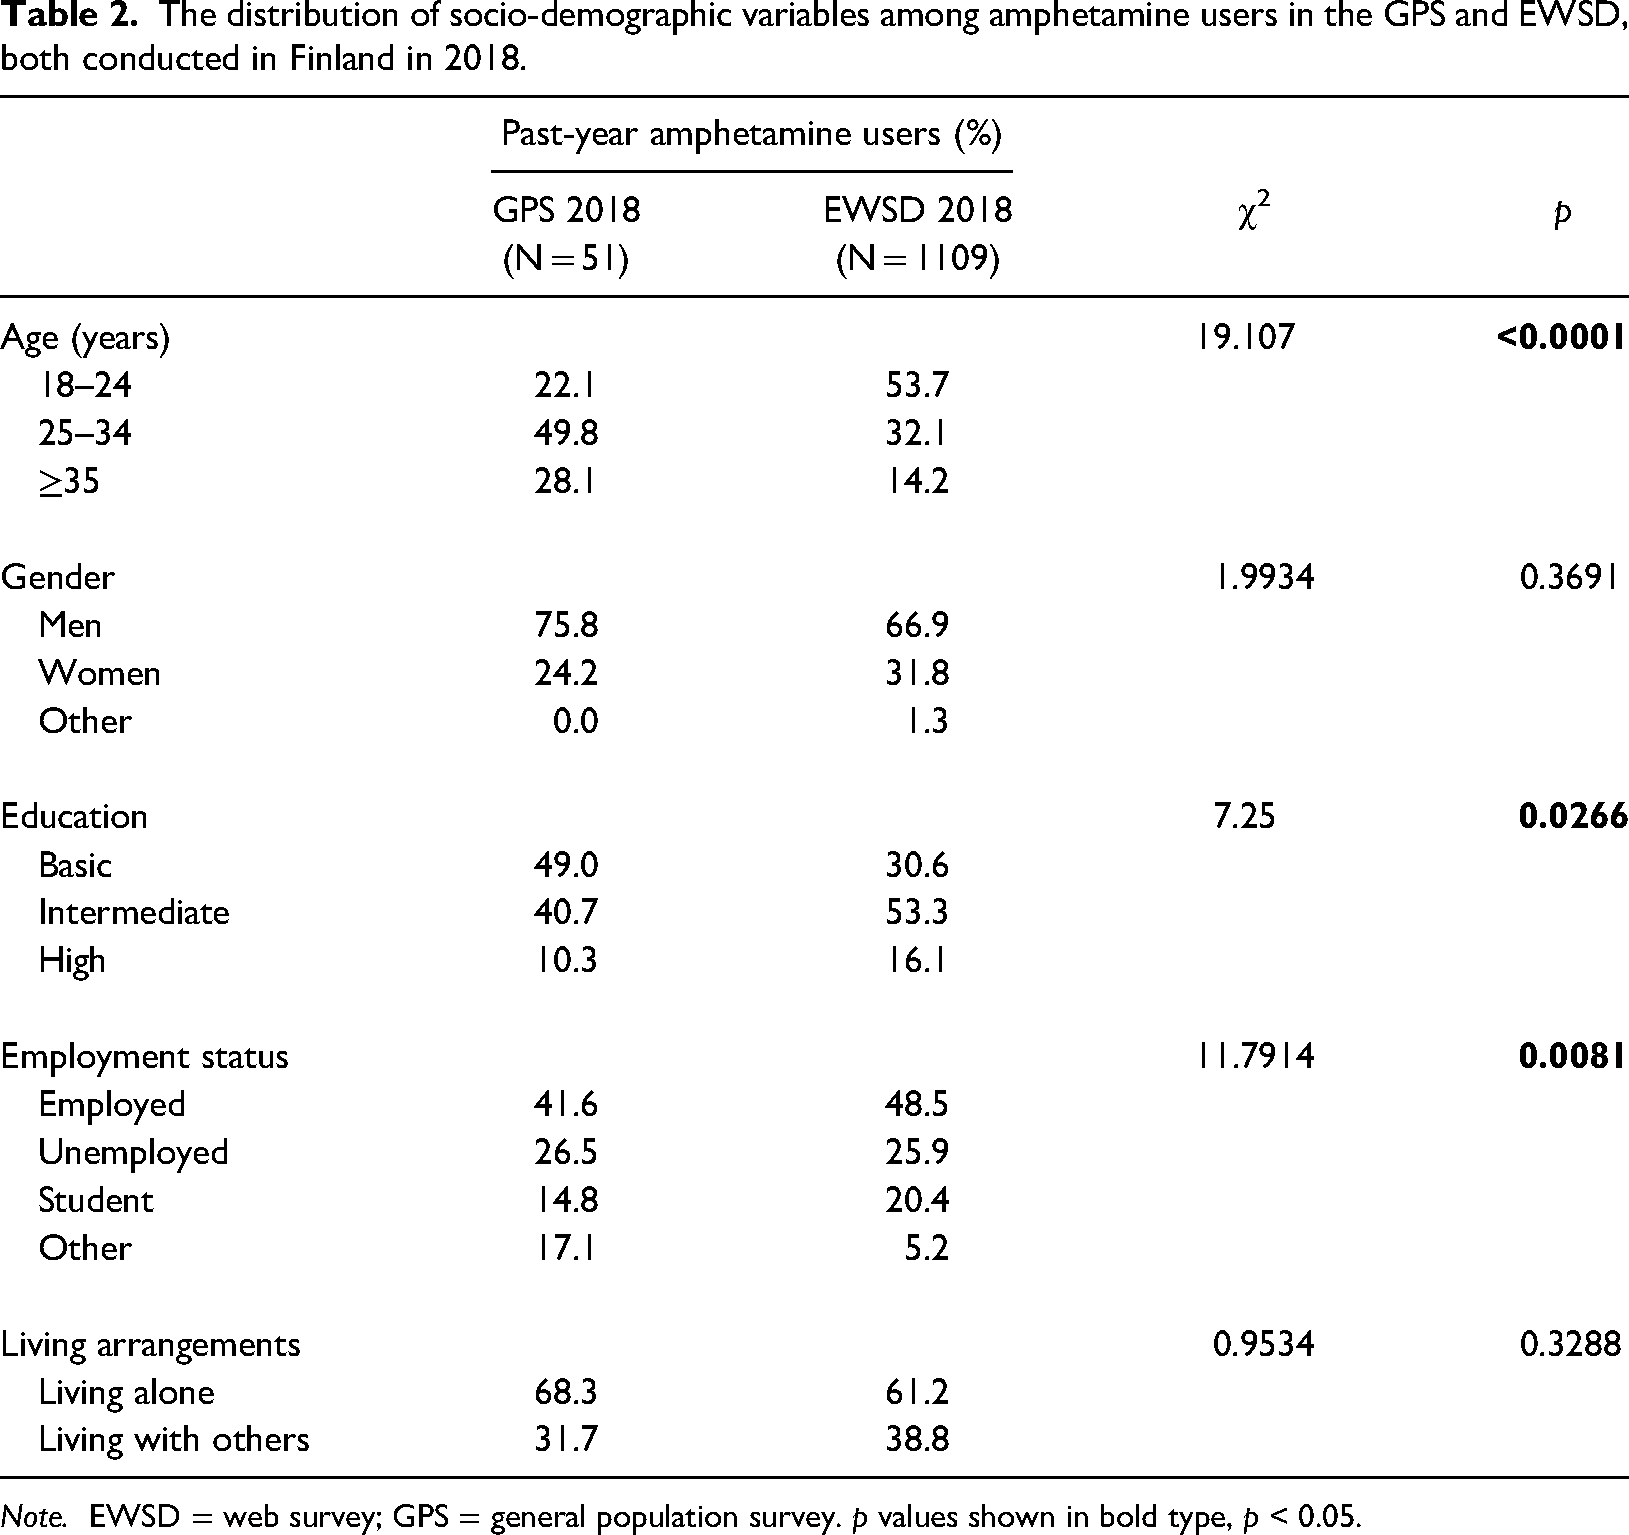
Note. EWSD = web survey; GPS = general population survey. p values shown in bold type, p < 0.05.
In the EWSD data, 59% of amphetamine users were infrequent users, 24% occasional users and 17% frequent users. Socio-demographic variables were distributed quite similarly, especially for occasional and infrequent users of amphetamine (Table 3). The proportion of those aged 18–24 years, women, those with basic education and the unemployed appeared to be somewhat higher among frequent users compared to the other two user groups. In the multinomial regression models, there were no statistically significant associations when occasional users were compared to infrequent users. Frequent users were more likely to be young, female, with basic education and unemployed when compared to infrequent users in the bivariate model, whereas in the adjusted model only the association concerning unemployment remained statistically significant.
The distributions of socio-demographic variables and their association with past-year amphetamine use frequency, multinomial logistic regression, EWSD conducted in Finland in 2018.
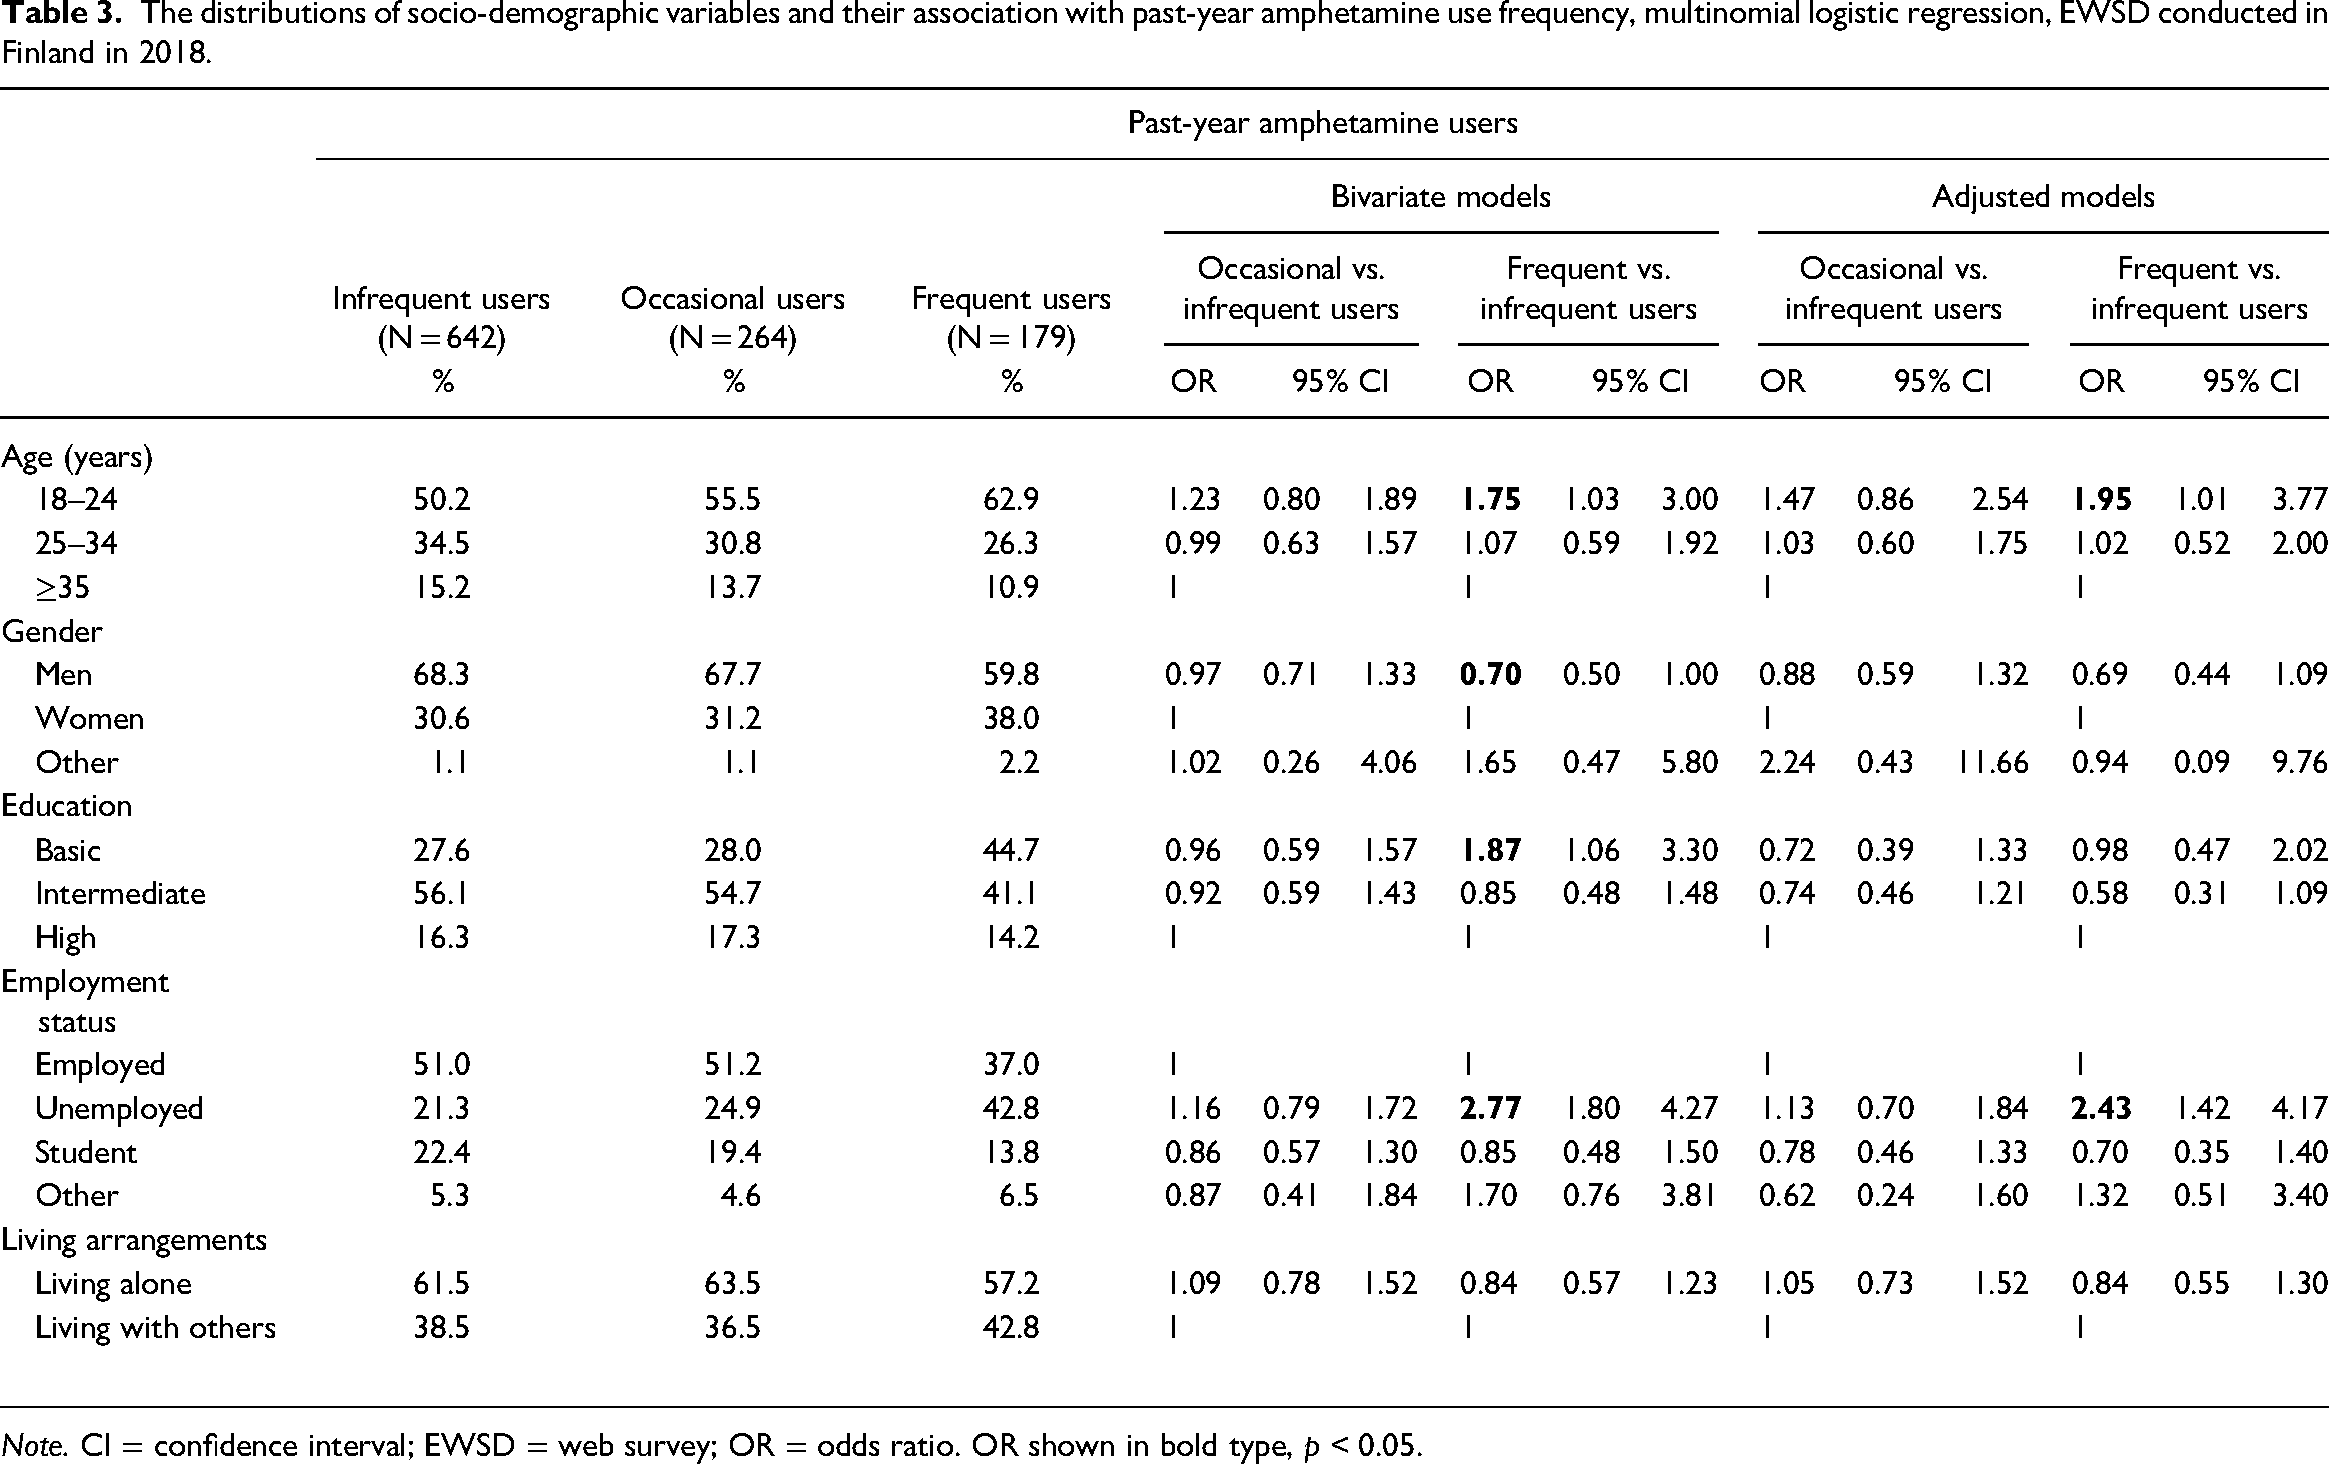
Note. CI = confidence interval; EWSD = web survey; OR = odds ratio. OR shown in bold type, p < 0.05.
Routes of administration of amphetamine (EWSD)
Amphetamine was consumed mostly by snorting, and the second common route of administration was swallowing in all user groups (Table 4). Almost half of the frequent users reported injecting amphetamine, whereas only one-tenth of infrequent or occasional users consumed amphetamine by injection. Compared to infrequent users, occasional users were more likely to use amphetamine by swallowing or by dissolving it into the mouth. Frequent users were more likely to use amphetamine by swallowing, by injection or by smoking, but less likely by snorting compared to infrequent users.
Routes of administration and their association with past-year amphetamine use frequency, multinomial logistic regression, EWSD conducted in Finland in 2018.
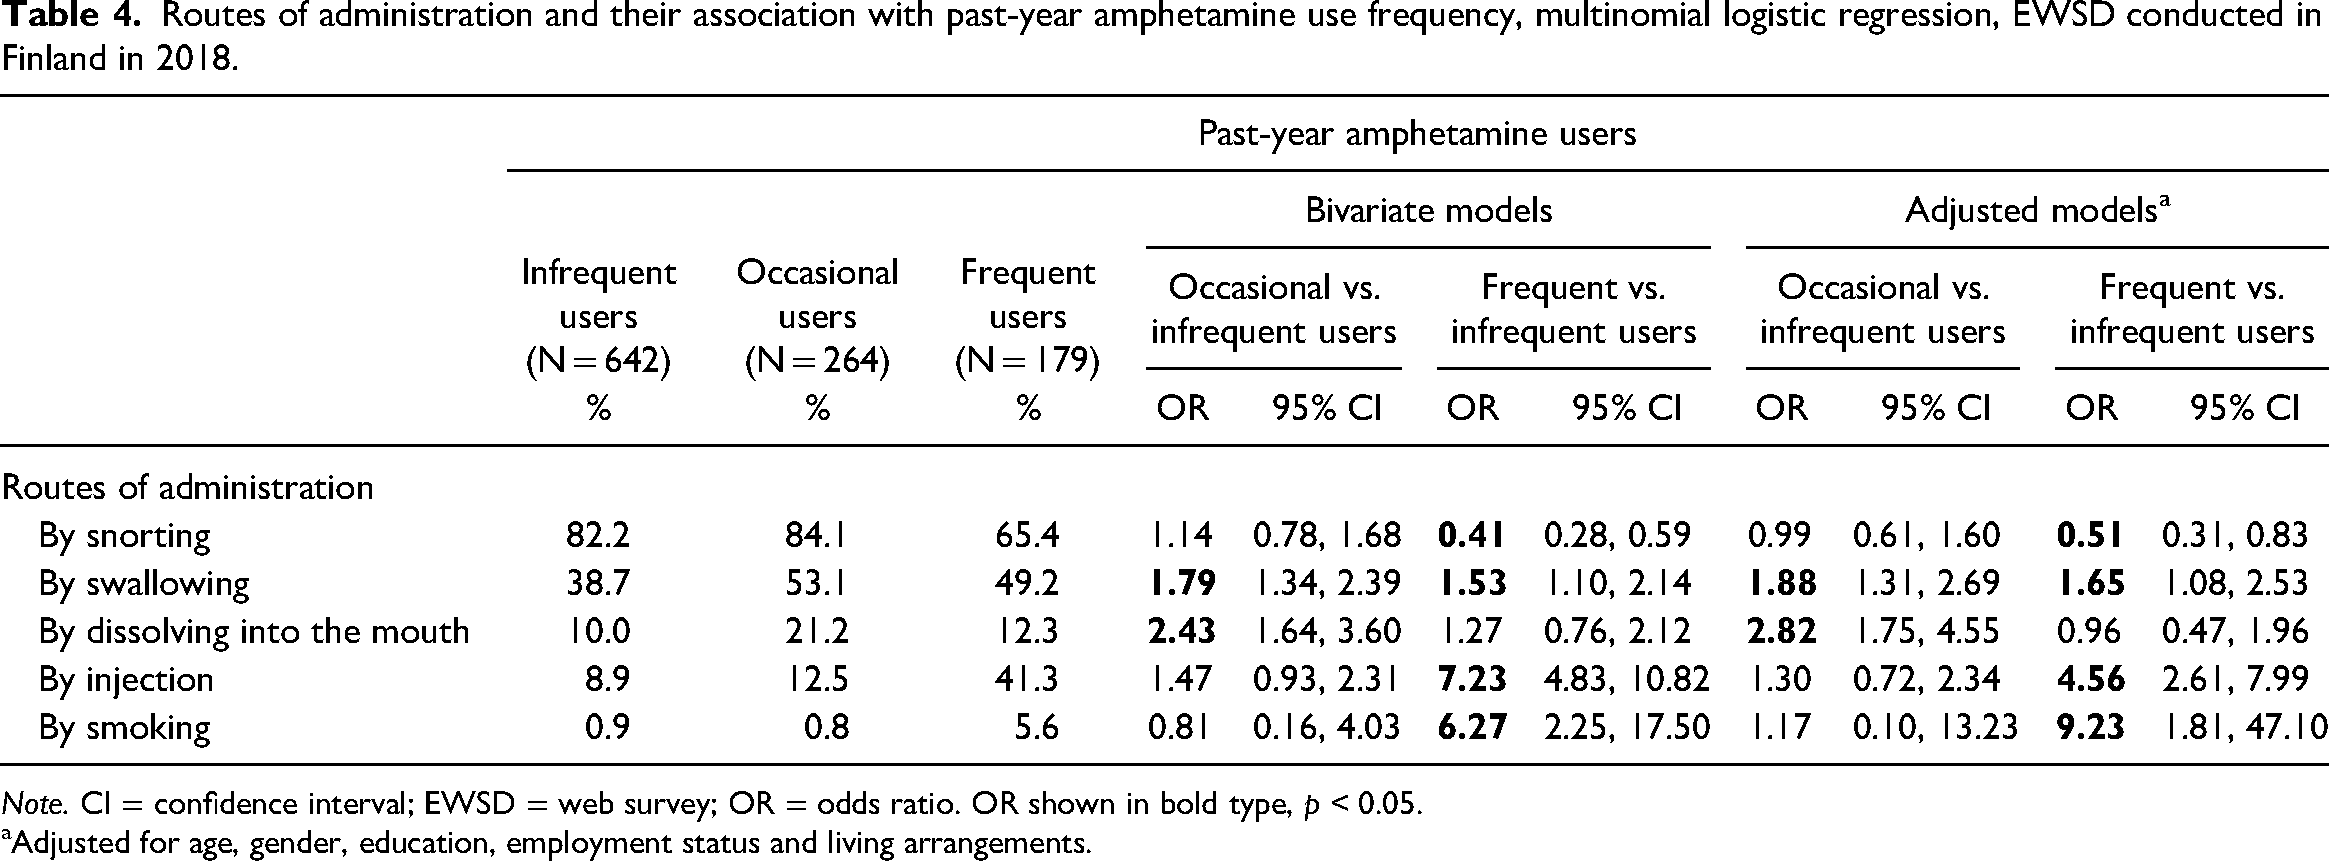
Note. CI = confidence interval; EWSD = web survey; OR = odds ratio. OR shown in bold type, p < 0.05.
Adjusted for age, gender, education, employment status and living arrangements.
Discussion
Main findings and their interpretation
Both the GPS and WBE showed that stimulant use has increased in Finland between 2014 and 2018. Well-known associations of socio-demographics and other substance use with past-year stimulant use were found, with no geographical variation between HMA and other parts of Finland. The socio-demographics of those reporting amphetamine use differed between the respondents of the GPS and EWSD. Among EWSD respondents, infrequent and occasional users of amphetamine were more alike, whereas frequent users differed from infrequent users, especially in terms of employment status and routes of administration.
According to the WBE, the consumption of amphetamine, MDMA (ecstasy), cocaine as well as methamphetamine has increased in Finland during 2014 and 2018, especially in HMA. Similar findings were achieved from the GPS, except for amphetamine and ecstasy in HMA. The possibility to compare these two datasets revealed this interesting inconsistency. One explanation could be that the frequency of use or the amounts consumed have increased more than the actual number of people using these substances in HMA, whereas in other parts of Finland, the number of users also seems to have increased. However, based on other sources, the harm associated with amphetamine and ecstasy use has also increased in HMA (Rönkä et al., 2020), likely indicating the increase in the number of users, too. Another explanation could be that the use of amphetamine among high-risk users in HMA is even more problematic than in other parts of the country, and hence the GPS has not been able to reach them, as underrepresentation of high-risk users is a well-known limitation of population surveys (Johnson, 2014). Thus, the observed no change in the GPS data might actually indicate a worsening situation. Nevertheless, regional variation may call for attention when planning appropriate strategies for drug policy.
Socio-demographics among stimulant users, on the other hand, did not vary geographically. Based on the GPS, younger age and disadvantaged social background were associated with past-year stimulant use, which is already established in the existing literature (Butterworth et al., 2018; Compton et al., 2007; Kraus et al., 2007; Vreeker et al., 2020). Thus, the findings suggest that people using stimulants are a rather coherent group in terms of socio-demographics throughout the entire country, at least among the same data.
Knowledge about socio-demographics based on the GPS was supplemented with the EWSD, and it was found that the distributions of socio-demographics of amphetamine users differed between these two datasets. The EWSD respondents seemed to be socially somewhat better off since although being younger, the proportion of those employed or with high education was higher compared to the GPS respondents. Although this probably reflects a selection bias known to be associated with web surveys with non-probability sampling (Miller & Sønderlund, 2010), it also highlights the versatility of socio-demographics indicating that people using amphetamine are not a homogeneous group.
Based on all three datasets, the following overall view of amphetamine use in HMA could be synthesised: according to the GPS, 2.3% of the population in HMA reported past-year amphetamine use, which equals approximately 22,000 persons. If these 22,000 were to be distributed similarly to the amphetamine users in the EWSD data, there were 12,980 infrequent (59%), 5280 occasional (24%) and 3740 frequent (17%) users of amphetamine. However, it should be noted that these numbers are only indicative due to the uncertainty of how well these surveys are able to reach frequent users. All those using amphetamine in the HMA region altogether consumed approximately 210 kg of pure amphetamine during 2018 (taking into account that some methamphetamine is converted to amphetamine in human metabolism).
As we do not have exact data on the dose/amount used per day or the number of days when amphetamine was consumed, it is very difficult to estimate how many kilos of amphetamine were consumed by each user group. However, although the number of frequent users is smaller than that of infrequent or occasional users, they most likely have consumed the largest proportion of amphetamine totally consumed due to higher doses and more frequent use. This has been shown elsewhere concerning amphetamine (Trautmann et al., 2013) as well as cannabis (Hakkarainen et al., 2008), alcohol (Livingston & Callinan, 2019; Mäkelä, 2018) and gambling (Salonen et al., 2020).
Taking further into consideration the routes of administration, frequent users of amphetamine probably are high-risk users facing greater risk and harm compared to infrequent and occasional users. Injecting drug use, which has shown to be associated with infectious diseases (hepatitis and HIV) and an elevated risk of death (Degenhardt & Hall, 2012), has a long history among frequent users of amphetamine in Finland. A high prevalence of injecting amphetamine in Finland, often combined with other illicit drug use such as opioids, is also supported by current chemical studies of used syringes (Brunt et al., 2021). As the number of amphetamine users and consumed amounts of amphetamine are increasing, it is important to take into consideration high-risk amphetamine users’ need for social and healthcare services by providing drug treatment, treatment of hepatitis C and low-threshold services including needle and syringe exchange, testing of infectious diseases, vaccinations and promotion of safe injecting. Opening drug consumption rooms and drug-checking services could be a big help in the reduction of harms of amphetamine, as well as other substance use, in Finland. Furthermore, if the number of frequent users could be lowered, that would lead to a considerable reduction of the demand in the amphetamine market.
As referred elsewhere (Babor et al., 2018; Lancaster et al., 2019), our results from this analysis of stimulant use in Finland confirm that diverse measures are needed in drug policy, which should be knowledge-based, realistic and coordinated. As our results show, the overall picture of stimulant use is not homogenous, and the total consumption is divided unevenly in the population. Thus, the basis of knowledge of drug policy should be wide and versatile enough. In achieving this, systematic research based on diverse longitudinal and cross-sectional data is crucial.
Strengths and limitations
Each data collection method has its own limitations; for example, WBE does not provide information about the characteristics or the amounts of drugs used by each user. The typically used one week of sampling may not be sufficient in assessing drug consumption (Goulding et al., 2020), which is why two sampling periods per year were used in this study. The GPS excludes the institutionalised population and those without a permanent address, and thus high-risk users are likely to remain underrepresented. This may especially affect HMA, since high-risk drug use is most common in southern Finland, especially in the capital region where, due to geographical reasons, the availability of drugs probably is the greatest (Rönkä et al., 2020). EWSD is based on non-probability sampling leaving the target population and its representativeness unknown, and, for example, high-risk or frequent users may well be underrepresented. Furthermore, unfortunately, due to a technical error during the data collection of the Finnish EWSD, the amount of amphetamine used by each respondent was not available for the analysis.
In the GPS, the proportion of missing values was low, in the range of 0%–1.5%. As for EWSD, the proportion of missing information increased towards the end of the questionnaire. For past-year amphetamine users, gender was missing for 0% and age for 1% (asked at the beginning of the questionnaire), whereas employment status (17%), education (19%) and living conditions (20%) had a notably higher proportion since these were asked at the end of the questionnaire. This should be taken into consideration when interpreting the results.
Irrespective of all the limitations, the strength of the study was the possibility to compare, contrast and synthesise three different datasets, each collected within the same year and each complementing the other. Thus, a more versatile picture of stimulant use in Finland could be reached, with the inconsistencies between the data and the findings forcing to dig deeper and point out the need for further research.
Conclusion
Analysis of three different datasets revealed findings that would have been missed and conclusions that could have not been made by using just one dataset. Putting findings from different methods into dialogue raises new questions to be considered and opens new interpretations. By integrating data, a more comprehensive view of the situation can be reached, which is crucial in developing knowledge-based drug policies. The findings of this analysis emphasise the importance of the prevention of frequent use and associated harm, as well as the impact of versatile drug treatment and harm reduction services on it.
Supplemental Material
sj-docx-1-nad-10.1177_14550725221122150 - Supplemental material for Analysis of illicit stimulant use triangulating wastewater, general population survey and web survey data
Supplemental material, sj-docx-1-nad-10.1177_14550725221122150 for Analysis of illicit stimulant use triangulating wastewater, general population survey and web survey data by Karoliina Karjalainen, Teemu Gunnar, Pekka Hakkarainen, Aino Kankaanpää and Sanna Rönkä in Nordic Studies on Alcohol and Drugs
Footnotes
Declaration of conflicting interests
The authors declared no potential conflicts of interest with respect to the research, authorship, and/or publication of this article.
Funding
The author(s) received no financial support for the research, authorship, and/or publication of this article.
Supplemental material
Supplemental material for this article is available online.
References
Supplementary Material
Please find the following supplemental material available below.
For Open Access articles published under a Creative Commons License, all supplemental material carries the same license as the article it is associated with.
For non-Open Access articles published, all supplemental material carries a non-exclusive license, and permission requests for re-use of supplemental material or any part of supplemental material shall be sent directly to the copyright owner as specified in the copyright notice associated with the article.