
Abstract
Aims:
This article assesses the efficiency of six Nordic state-controlled gambling companies in raising revenue for their host societies, and the terms under which they operate. Finland, Sweden, Denmark and Norway have established gambling monopolies on the grounds that they help to prevent fraud and money laundering, and channel proceeds to their host societies. Within the last decade, Denmark (2012) and Sweden (2019) have opened substantial parts of their gambling markets to competition, whereas Finland and Norway continue to uphold monopolies.
Design:
The analysis is based on publicly disclosed income statements and financial reporting concerning Nordic gambling operators for the year 2017. We calculated how much they contribute to societies, what are the costs, and how these figures compare among the companies.
Results:
We found that Veikkaus raises the highest amounts of surplus to society both in absolute terms and in relative numbers, and that, overall, the companies vary in efficiency. We discuss the reasons for these differences, focusing on their respective product portfolios, institutional frameworks and competitive market positions.
Conclusions:
The results problematise the measurement of efficiency in gambling companies in monetary terms. Efficiency depends on high total consumption with little regard to the principles of responsible gambling and the prevention of gambling problems. Nordic countries have a strong commitment to the protection of health, but in the case of gambling, protecting the monopoly seems to outweigh harm prevention.
Following significant drops in corporate tax revenue since the 1980s, the burden of taxation has increasingly shifted to the individual (OECD, 2016, see also Nikkinen et al., 2018). This also increases interest in excise duty, including (implicit) taxes on gambling (Clotfelter, 2005). Given the tendency in governments nowadays to locate the gambling agency in the Ministry of Finance (instead of the Ministry of Health, for example), the focus may be more on the revenue from gambling than on the inevitable costs (Room & Nicoll, 2020).
Much of the damage caused by gambling (in terms of treatment, family problems and inequalities, for example) is hidden and easily overlooked in economic cost-benefit analyses (and impact studies are not cost-benefit studies, Grinols, 2011). Intangible costs are not easily shown, and incontrovertible proof is not always possible in public health research which works in a complex environment (Cassidy, 2020). It has therefore been easy for governments not to focus on harm prevention, and to expand gambling opportunities rather than to raise income taxes (Adams, 2008, 2016; Orford, 2011). Moreover, revenue growth does not seem to depend on other economic trends, but rather reflects the availability and promotion of gambling opportunities (Cassidy, 2020; Orford, 2019; Sulkunen et al., 2019).
Gambling companies tend to make significant profits related to their pricing practices (Levitt, 2004), although some comparative studies have shown that monopolistic concerns may make less profit than businesses operating in more loosely regulated markets (Chambers, 2011; Paldam, 2008). However, this could relate to the understanding of profit as private gain rather than as something to be transferred to societies (see Nikkinen & Marionneau, 2014 for a more detailed discussion about the public and common good in this context). Raising funds for society has been one of the main justifications for the existence of national gambling operations and monopolies (e.g., Marionneau et al., 2018).
This justification for upholding a monopoly over public gambling, to channel the proceeds to the host society, has been often challenged in forums such as the EU courts (European Commission, 2012; Rydman & Tukia, 2019). The channelling of gambling proceeds creates a situation in which the monopoly promotes and markets its services to its own populace but limits access to other gambling offerings. This, in itself, incurs costs in that it increases the need for control, and the enforcement of online gambling regulations in particular (for more information about such measures in the EU, see Hörnle et al., 2019).
Given the costs involved in the collection of gambling proceeds, one might wonder whether gambling companies are efficient in this respect. Efficiency in the field of economics is usually defined as attaining organisational goals at minimal cost. As such, it can be evaluated quantitatively by calculating the net benefit, when costs are deducted from income/revenue. This (prevalent) approach has been criticised on the grounds that all efficiency calculations are relative rather than absolute, given that the presumption of unique causes and effects is based on determinist ontology (Wolff, 2002). In the realm of healthcare, for example, economic efficiency cannot be the sole basis on which optional functionality is evaluated. Questions related to issues such as priorities have ideological elements and cannot be resolved solely with reference to health economics (Nikkinen, 2011). This also applies to gambling, in that “efficiency” cannot be measured simply in terms of operational efficiency.
The term efficiency is used in at least three different contexts in studies on gambling. First, a body of research has focused on measuring and testing the market efficiency of different games (e.g., Even & Noble, 1992; Paul & Weinbach, 2002; Zuber et al., 1983). The theoretical basis of this is the efficient market hypothesis (EMH), which was originally developed in the context of stock markets and investment to analyse how well prizing reflects available information, and whether it is possible to “beat the market” (Fama, 1991). Second, the efficiency of gambling provision has been assessed from the perspective of raising tax revenue (e.g., Farrell & Walker, 1999; Gulley & Scott, 1989; Rodgers & Stuart, 1995; Smith, 2000). Third, and related to the previous point, gambling products have been priced to maximise revenue as a measure of efficiency. It has been shown that the demand for such products is price-elastic (see, e.g., Gallet, 2015; Swiss Institute of Comparative Law, 2006), meaning that players are sensitive to prices and this limits the possibilities for both governments and operators to use gambling as a revenue source (Gallet, 2015; Landers, 2008).
It is clear from the aforementioned sources that the efficiency of gambling companies tend to be assessed in financial terms. An additional premise in the Nordic countries is that gambling is an effective source of revenue for public spending. An additional premise in the Nordic countries is that gambling is an efficient source of revenue for public spending. It is this assertion that we evaluate here. Our starting point is to analyse the financial statements of Nordic state-operated gambling companies in terms of their economic performance and/or “efficiency” in an economic sense. Our reason for focusing on these companies is that the Nordic countries generally levy high income taxes, combined with value-added taxation (VAT), but they also use excise taxation to fund the provision of public services. The levels of gambling taxation on these operations and the dividends paid to owners (such as governments, trotting associations and various non-governmental organisations (NGOs)) are therefore likely to be high, whereas the operators’ share is likely to be minimal. Monopolistic structures and barriers to entry alongside systemic efficiency have been shown to create economic surplus, or monopoly rent (Harvey, 2002; Kaplinsky, 2000). More specifically with regard to the gambling sector, additional profit is also generated by significant producer surplus arising from low production costs in relation to bets, and what Young and Markham (2017) call the addiction surplus, i.e., the overconsumption of gambling by those who gamble at harmful levels (see, e.g., Fiedler et al., 2019; Schull, 2012).
Data and methods
The companies in question
The analysis covers six state-controlled operators in the Nordic countries, as described in Table 1. Four of the companies are under full state ownership; ATG is owned by Swedish horse-racing associations, but is nevertheless a special-purpose company, under state-control through its board of directors (the Swedish state appoints half of the directors, including the chair).
Companies included in the analysis.
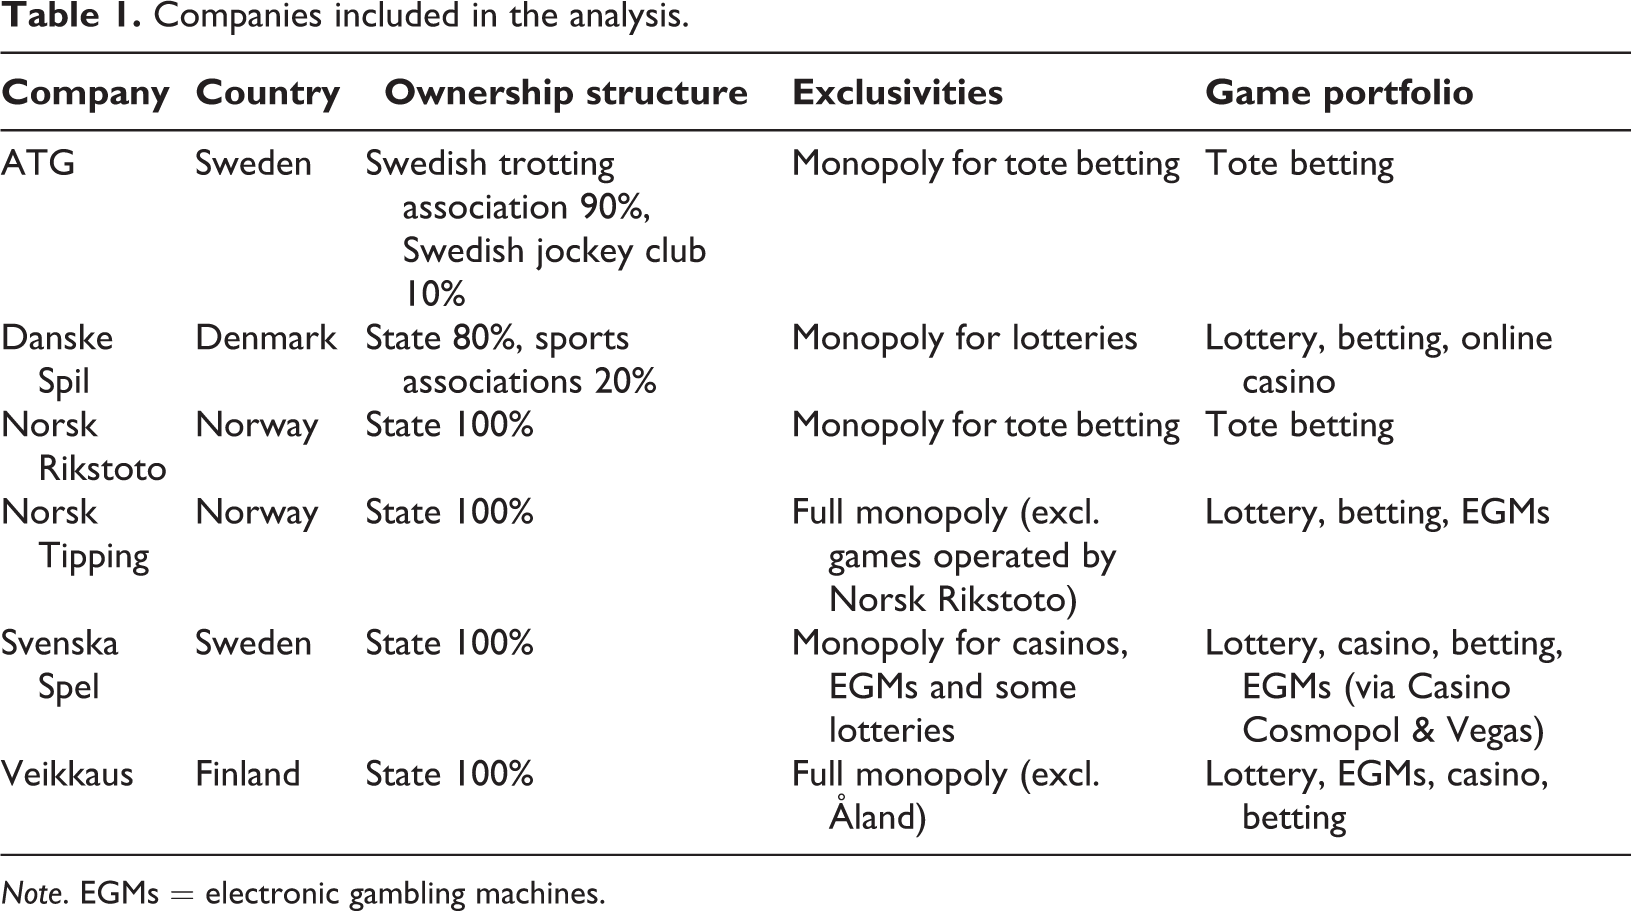
Note. EGMs = electronic gambling machines.
The analysed companies differ in their product portfolios and the relative importance of different games in their financial results. Electronic gambling machines (EGMs) are the most profitable for Veikkaus, the total revenue obtained from them being remarkably high, as explained in detail below. The share of EGM revenue is lower in the case of Svenska Spel and Norsk Tipping. The removal in 2007 of EGMs from public places in Norway, and their subsequent replacement gradually in 2008-2009 with less addictive Multix and Belago machines, caused a substantial drop in EGM and overall gambling revenue (Hamar, 2017). Lottery games produce a relatively large share of the total profits of Danske Spil and Norsk Tipping. Danske Spil has a monopoly status in providing lotteries, and most of its revenue derives from this privilege. In the case of Svenska Spel, scratch cards (especially a game called Triss) constitute a comparably significant revenue source, up to one-third.
The companies also differ in terms of market share. Although only Denmark and Sweden have licensed their gambling sectors to outside providers, each country faces competition from offshore operators. Veikkaus has the highest overall market share, at approximately 85% (H2 estimate also used in its annual reporting, Veikkaus, 2019). Ålands Penningautomatförening (Paf), operating from the Finnish autonomous region of Åland, facilitates much of the “unauthorised” gambling in mainland Finland, but there are also offshore operators. Norsk Tipping and Norsk Rikstoto combined control about 84% of the overall market in Norway, but the online figure is much lower: only an estimated 45% (SEB, 2018). Svenska Spel and ATG combined controlled only 57% of Sweden’s total gambling market in 2017, before it was opened to licensing in 2019. The rest was shared among NGO-operated lotteries and bingo and unlicensed gambling operators (Swedish Gambling Authority, 2018). The market share of Svenska Spel may continue to diminish with increasing competition: 98 gambling licences have been issued (as of August 2020), of which most are for online only and include Paf. However, there is another route available to monopoly operators in the form of a licensing system: Danske Spil in Denmark controls about 60% of the overall market, and its share has been steadily growing since the introduction of licensing (Danske Spil/Gambling Compliance profile).
Companies that we excluded from the analysis, for methodological reasons, included operators functioning in licensed or charity markets in Denmark and Sweden, small-scale lottery and raffle providers, as well as the above-mentioned Paf, which operates all gambling in Åland. Many charities, especially in Sweden, for instance, do not have a legal obligation to publish detailed annual reports, and may choose merely to issue a report of annual activities containing selected fiscal data. In the case of licensed operations, many are run by companies owned by multinational corporations that do not necessarily provide financial information in each and every country in which they operate. The same also applies to Paf, which resulted in incomparable differences in reported data. Moreover, the analysis concerned the year 2017 and therefore does not take into account licensed companies operating in Swedish online markets in 2019.
Data
The data consist of the financial reporting of the six companies in their income statements (IS) that are required by the Acts related to bookkeeping and which are published annually by each gambling operator. These statements reveal how much of the total gambling revenue (R) is paid out as winnings, how much is levied in the form of tax, direct contributions, dividends to public shareholders (SS) and, in more or less detail, the operational costs of the companies, the remaining profit and its allocation. When we found gaps in the IS reporting we looked through the rest of the report for additional data.
If there was a lack of adequate data to suit our study purposes, we contacted gambling-operator representatives and regulators in the spring of 2019. However, only Norsk Rikstoto and Veikkaus provided somewhat detailed information about their game portfolios and gross gambling revenue (GGR) that we were able to check against market data provided by Gambling Compliance. Because of this, and the otherwise differing reporting detail, certain data are missing that would have provided further explanation of why some companies are more efficient at collecting gambling revenue for public use than others. Notably with regard to this article, we could not analyse the financial figures and return percentages on the product level.
The data collected are from the year 2017. Because they are cross-sectional, we controlled for the robustness of the figures by checking the previous three years’ EBITDA figures (earnings before interest, tax, depreciation and amortisation). These figures show how much money gambling operators can generate from their operations, excluding non-operational variables such as earlier investments, financial costs or revenues, and taxation. As such, they eliminate the effects of financial and capital expenditure and allow control for whether 2017 was in any way exceptional. However, this situation did not arise even in the case of Veikkaus, which had gone through a merger of three national operators (The Finnish Slot Machine Association RAY, the national lottery Veikkaus, and the national tote betting company FinToto) in 2017. The gambling situation in Sweden, Norway and Denmark was relatively stable in 2017 (Denmark changed to licensing in 2012, and Sweden after 2017, in 2019).
Analytical methods
The main categories in IS reporting are total revenue, taxes, direct contributions (applying mainly to Veikkaus, ATG, Norsk Tipping and Norsk Rikstoto), operating costs, financial revenue and costs, and accounting profit. We calculated a sum figure based on these items, which we call gambling surplus to society (Sg): it is the sum of all taxes, licence costs (not applicable to Nordic government-controlled operators), dividends to public shareholders and earmarked contributions. Not all companies contribute to public funds through each channel. The main types of Sg also differ in Nordic operations. In the cases of Veikkaus, Norsk Tipping, Norsk Rikstoto and ATG it is mostly earmarked contributions, whereas for Svenska Spel and Danske Spil, the main channel for allocating proceeds is in the form of dividends to public shareholders. All companies (except Norsk Tipping) also pay varying levels of taxes (employer taxes not accounted for in this context).
The gambling surplus to society (Sg) depends on the total operating costs (C), including marketing, personnel and distribution costs. We chose these cost elements on the basis of our initial scan of the income statements, which showed that they were the most significant individual categories, and because they have been identified as the major cost items for gambling companies (Marionneau & Nikkinen, 2020). Costs here refer only to the operating costs of gambling companies, and do not include social costs generated by gambling, for example.
We compared the figures to the companies’ gross total revenue (GTR), meaning the revenue that remains after winnings have been paid out, and includes other non-gambling revenue (such as food and beverages in casinos operated by the companies). This revenue was marginal in the analysed companies, which reflects the situation in the Nordic countries with its few brick-and-mortar casinos and total lack of casino hotels as in Las Vegas, for example. GTR is preferred to total turnover (R), which is more sensitive to variations in return percentages and differences in game portfolios that could not be accounted for. The indicators (and their usage) are explained in more detail below: Sg/GTR (%) shows the proportion of gross total revenue (GTR) that is allocated to society, either states or other beneficiaries. C/GTR (%) shows the proportion of gross total revenue (GTR) that is consumed in operating costs (not including taxes and financial investment costs). This enables the comparison of companies in terms of efficiency in that it shows how much it costs for them to collect gambling proceeds. Marketing/GTR (%) shows the proportion of gross total revenue (GTR) that is directed to marketing and advertising costs, excluding sponsorships and game organisation because these data were not available for most companies. Personnel/GTR (%) shows the proportion of gross total revenue (GTR) that is directed to employment costs. Distribution/GTR (%) shows the proportion of gross total revenue (GTR) that is directed to distribution costs, i.e., the re-sale network. C/Sg shows how much it costs to produce a certain amount of gambling revenue for the host society, by comparing the cost of gambling surplus to society.
The monetary figures in the analysis are given in euro using the currency exchange rate of 31 December 2017. We have also converted all the sums into PPP (purchasing power parity) euros based on the 2017 rates provided by the World Bank and the OECD (Organisation for Economic Co-operation and Development). The PPP figures are adjusted for the differences in price levels between the countries.
Results
Efficiency in raising the surplus to society
Table 2 shows the main financial returns (gross total revenue, surplus to society and Sg/GTR (%)) of the companies, ranked from highest to lowest in terms of Sg/GTR percentage. The highest percentage means that the company contributes the largest share of its GTR to society and is in these terms the most efficient.
GTR and Sg raised by Nordic government-controlled gambling companies (in millions or as percentages).
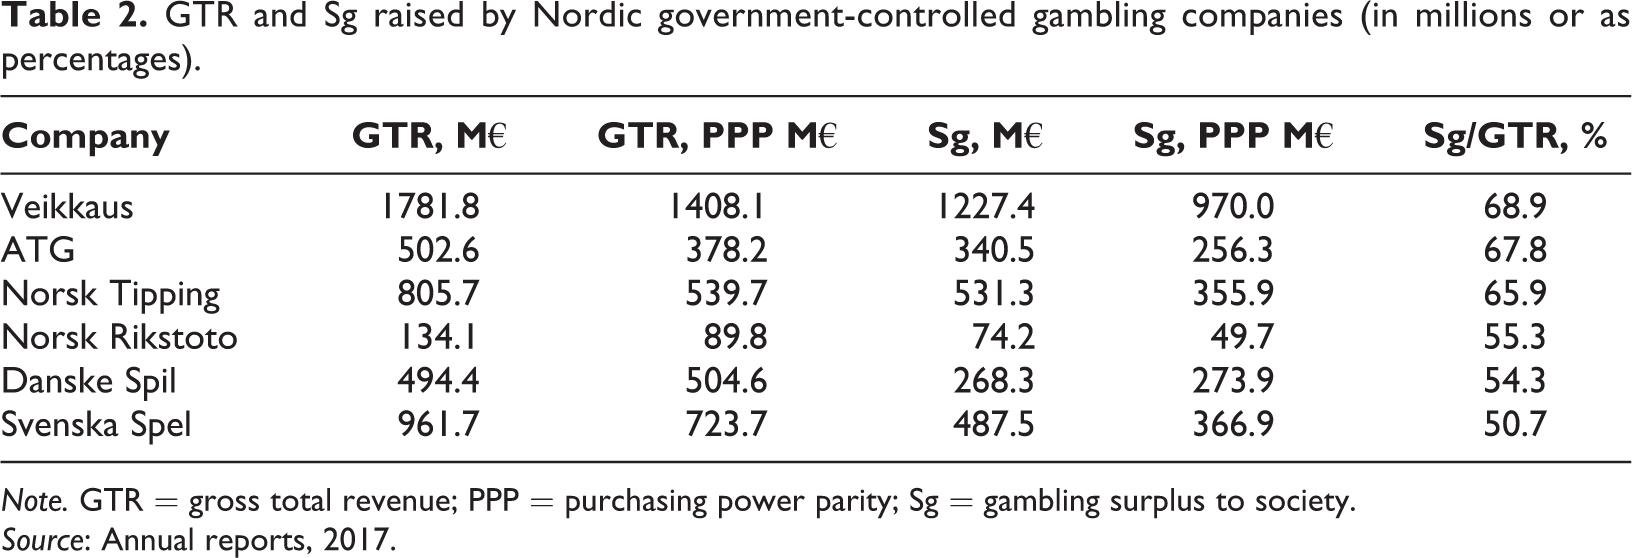
Note. GTR = gross total revenue; PPP = purchasing power parity; Sg = gambling surplus to society.
Source: Annual reports, 2017.
The figures presented in Table 2 call for at least two observations. First, in general, the companies that produce the most GTR also produce more Sg in absolute monetary terms. This is not attributable to overall market size. Although Sweden is the most populous of the Nordic countries with ten million inhabitants, the gross gambling revenue of Svenska Spel and ATG combined does not reach the level reported by Veikkaus, which operates in Finland with a population of 5.5 million. This may be attributable in part, but not entirely, to the lower market share of the Swedish state-operated gambling companies (only 57% in comparison to 85% for Veikkaus). Danske Spil has a similar market share to that of Svenska Spel and ATG (60%), but it nevertheless produces even less GTR and Sg. At the same time, the Norwegian government-controlled gambling companies (Norsk Tipping and Norsk Rikstoto) have about the same market share as Veikkaus (84%), and yet the GGR (and subsequently Sg produced in Norway) is notably lower than in Finland.
It should be noted that we are comparing companies and not countries, and that the overall contribution of gambling to the host countries of these companies in the cases of Sweden and Denmark is higher than the figures for Danske Spil, Svenska Spel and ATG alone. Society also benefits from operators in charity-based (mostly NGO-operated lotteries) and licensed markets in both of these countries. Moreover, some winnings channelled to operators in Denmark other than Danske Spil are subject to income taxation, producing additional revenue that is not analysed here.
Our second observation relates to the fact that the Sg share of company GTR varies quite significantly. Veikkaus provides the highest amount of surplus to society in absolute numbers, and also proportionally, and both ATG and Norsk Tipping come relatively close. On the other hand, Svenska Spel, Danske Spil and Norsk Rikstoto produce less surplus to their host societies in proportion to their GTR. We consider the reasons for this in the second part of the Results section.
Factors influencing efficiency in the raising of Sg
There appear to be at least three possible reasons why some companies are proportionately more efficient in producing surplus to society than others. These reasons relate to return percentages and product portfolios, institutional differences in terms of levies on gambling operations, and operating costs. We do not evaluate the impact of return percentages here because this was not possible on the product level. We also removed their effect from the analysis by comparing the figures to GTR rather than total revenue.
The impact of product portfolios and return percentages has been explored in a previous study comparing Finnish and Norwegian markets (Marionneau & Lähteenmaa, 2020). According to the findings, differences in terms of efficiency in producing surplus to society could be attributable to the absolute gambling volumes: Norwegian operators rely more heavily on slow games with low return percentages (lotteries, as well as sports betting), whereas Finnish Veikkaus relies on fast EGMs with high return percentages. Nevertheless, Finnish EGMs generate high volumes of gambling (due to the fast pace and high addictive consumption), which translate into high profits and thereby contributions to society. This observation is confirmed here, too.
By way of comparison, Finland has one EGM per approx. 200 adult inhabitants, cf. 1 EGM/1,600 in Sweden and 1 EGM/1,400 in Norway (note: the year used in here is 2017, in Finland the amount has changed). Veikkaus generates 46.2% of its GTR from EGMs, as opposed to only about 10% for Svenska Spel and nine per cent for Norsk Tipping (Norsk Tipping, 2018). Furthermore, Norsk Tipping EGMs (Multix and Belago terminals), with a number of “safe-play” features built into their design, have much lower addictive potential than Veikkaus-operated EGMs.
The impact of institutional differences in terms of taxation and levies is minor, given that all six companies are state-operated or controlled and distribute their profits back to the state as earmarked contributions or dividends, in addition to taxation. None of them had substantial residual leftover profit, and none of them paid dividends to investors or other private shareholders. Despite their differing market shares in the respective jurisdictions, they are all able to generate large amounts of gambling revenue for their host governments (and beneficiaries) on account of their monopolistic or semi-monopolistic status. Unusually high profits or surplus raised in a monopolistic or restricted market situation have also been reported in previous literature on monopoly rent (Harvey, 2002).
The impact of operating costs becomes apparent when comparing Sg and total costs to GTR. Overall, when considering all the included companies, those operators with the highest volumes also have the highest costs. However, the total share of Sg grows faster than the total share of costs. whereas Sg grows by 0.7:1 in terms of GTR, costs only grow by 0.3:1. In other words, the surplus to society grows more quickly than operating costs as GTR grows, but taken together Sg and C explain where the total amount of growth in GTR is spent. This finding is in line with Young and Markham’s (2017) suggestion that surplus from gambling results partly from the fact that the level of production costs is not dependent on the size of the bets.
Bet size refers to the average for each bet, whereas the figure shows the cost relative to the total volume of operations = GTR. Because of economies of scale, unit costs grow less than the total volume in almost any line of industrial production. However, this cannot be the only explanation in here, since definition of “unit” is difficult as gambling is more of immaterial service with addictive potential. The question is, where do economies of scale come from in this field? The answer is that EGMs are cheaper to run than low-percentage RTP games, hence Veikkaus is relatively more cost-efficient than the others.
Table 3 shows the operational costs of the companies in relation to their GTR. High operating costs appear to explain the low efficiency in raising surplus to society, and vice versa: the order of companies in terms of costs is a mirror image of that in terms of Sg. In other words, although costs grow in absolute numbers, their share of GTR drops when volumes grow.
The main costs of Nordic gambling companies relative to GTR (%).
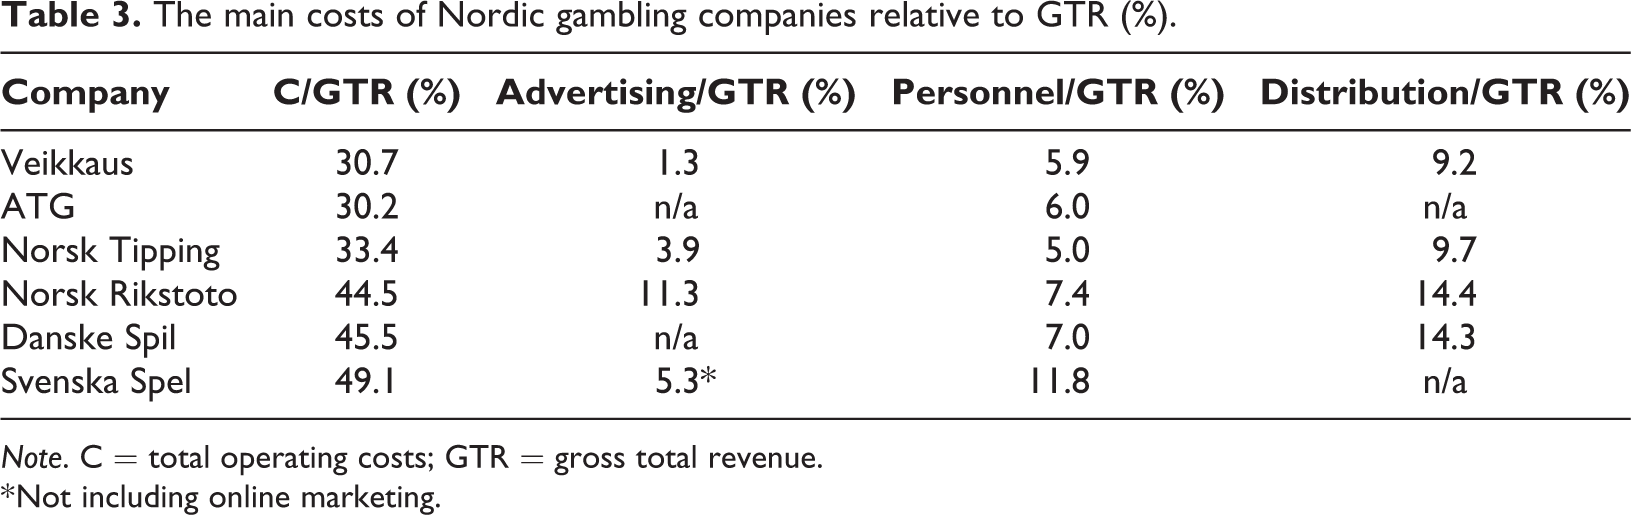
Note. C = total operating costs; GTR = gross total revenue.
* Not including online marketing.
Some of the specific cost items, which are also shown in Table 3, could partly explain the differences between the companies. Of particular interest is why Svenska Spel seems to perform poorly in terms of efficiency, even though in 2017 it (theoretically) controlled much of the land-based and online gambling, as Veikkaus and Norsk Tipping did. Danske Spil made a major IT investment in 2017, thus its position was somewhat lower than it perhaps would have been in a normal year. However, this should be verified in a longitudinal analysis.
The cost items selected for this analysis relate to each other and could explain some of the differences. First, companies with high operating costs also have high marketing costs, probably because of market competition. Although market share does not appear to be the main explanatory factor in terms of how efficient companies are in producing Sg and GTR, it seems to affect how much they have to spend to stay afloat. In 2017, whereas Denmark had already introduced a licensing system, Svenska Spel faced competition from both domestic charity-based and foreign offshore operators. It does not have a monopoly of lotteries in Sweden, and it had to compete with various NGOs that also provide lotteries. Moreover, it faced stronger offshore competition in the online market than Veikkaus or Norsk Tipping. The Svenska Spel online market share was only 34.5% in 2017 (Lotteriinspektionen, 2018), whereas Norsk Tipping controlled 45% and Veikkaus controlled 67% (H2 / Borenius, 2019; 2018 figure used instead of 2017). This competitive situation is likely to be reflected in the high marketing costs for Svenska Spel compared to Norsk Tipping or Veikkaus.
Unfortunately, no figures for Danske Spil are available, but it is likely that its marketing costs were significant. The Danish lottery market did not grow in 2012–2017 due to market saturation, thus the only opportunity for Danske Spil to increase its market share was in the highly competitive online market (Spillemyndigheden, 2019, Gambling Compliance, 2020). The Finnish and Norwegian lottery markets are not growing either. However, reliance on EGMs and other fast games for growth in Finland may also mean lower marketing costs, particularly given the prohibition of marketing these types of games according to the Finnish Lotteries Act (apart from in online environments among customers who are registered users of the Veikkaus website). Brick-and-mortar operators with multiple sales outlets and EGMs do not need a high marketing budget, either. Furthermore, many NGOs and other actors in Finland that partake in Veikkaus proceeds carry the logo on their websites and in their own materials in acknowledgement of the support provided by gambling proceeds. This further decreases the need in Veikkaus for a high marketing and advertising budget, albeit it is currently among the largest in Finland.
Second, some companies are more labour-intensive than others. Labour costs grow alongside the increasing proportional share of total GTR costs, which may reflect differences in product portfolios. Electronic gambling machines and (licensed) online gambling require a minimal workforce. ATG and Norsk Rikstoto do not offer EGM gambling but they do operate strongly in the online environment, where they need few personnel. Norsk Tipping relies heavily on lotteries, which are relatively cheap to organise given that only a few draws are held weekly and the results are reported via online channels. Tote betting, on the other hand, is more expensive to operate in that games are sold both on and off the track. The high personnel costs for Svenska Spel could perhaps be attributed to its casino and venue-based operations: casinos are known to require a substantial labour force, and this has even been used as a policy option to increase local employment (e.g., Richard, 2010).
Third, companies with high total operating costs also have high distribution costs, which consist of commissions paid to agents for selling their products and contribute significantly to total costs. Agency fees paid by Veikkaus for selling gambling products to businesses in 2017, for example, were worth as much as the Finnish Government paid in financial support for all three major merchant shipping companies operating in Finland (i.e., Viking Line, Tallink Silja and Finnlines) in a three-year period of 2015–2017 (Kauppalehti, 2019).
It was also found in a previous study on the magnitude of commissions to agents given by European gambling operators (Marionneau & Nikkinen, 2020) that such costs could be as high as 30% of the company’s gross gambling revenue. Figures for the Nordic companies are moderate by comparison, but they nevertheless show some variation that could reflect the importance of online channel and product portfolios. Although full figures for Sweden are not available, it is likely that the re-sale of popular scratch tickets requires significant commissions to agents whereas online games require none. In 2017, for example, 41.9% of Veikkaus sales were on the digital channel, and 59% of ATG’s sales were online.
In conclusion, it appears that costs play a major role in accounting for the differences in efficiency among Nordic state-controlled gambling companies with regard to raising surplus to society. Table 4 shows the relationship between total operating costs and gambling surplus to society.
Costs relative to gambling surplus to society, C/Sg.
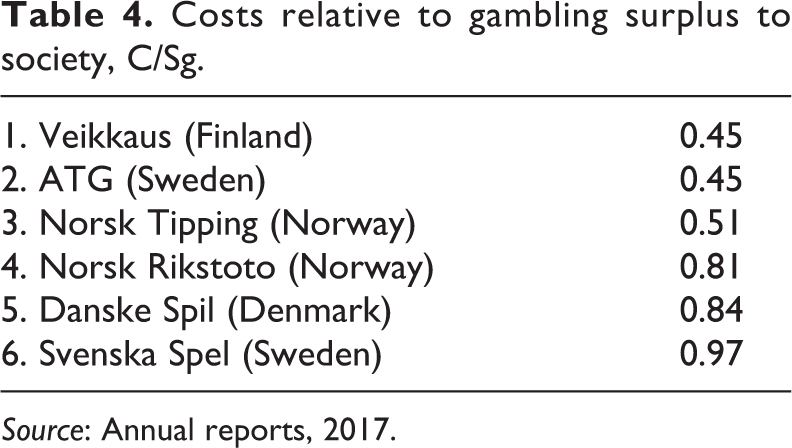
Source: Annual reports, 2017.
In terms of efficiency, the lower the figures, the better. However, although Veikkaus does outperform the other companies, proportionately it is not very exceptional, and not much more efficient than ATG or Norsk Tipping. Figure 1 shows the societal contribution of gambling operators relative to total costs in graphic form. Companies operating in the competitive market (Svenska Spel and Danske Spil) are clearly above the regression line, whereas those with a relatively high market share in their domestic markets are below it. This indicates that market competition, alongside the product portfolio, is significant in terms of explaining differences in the share of total operating costs, as we suggest above in our detailed analysis of some of the cost items.
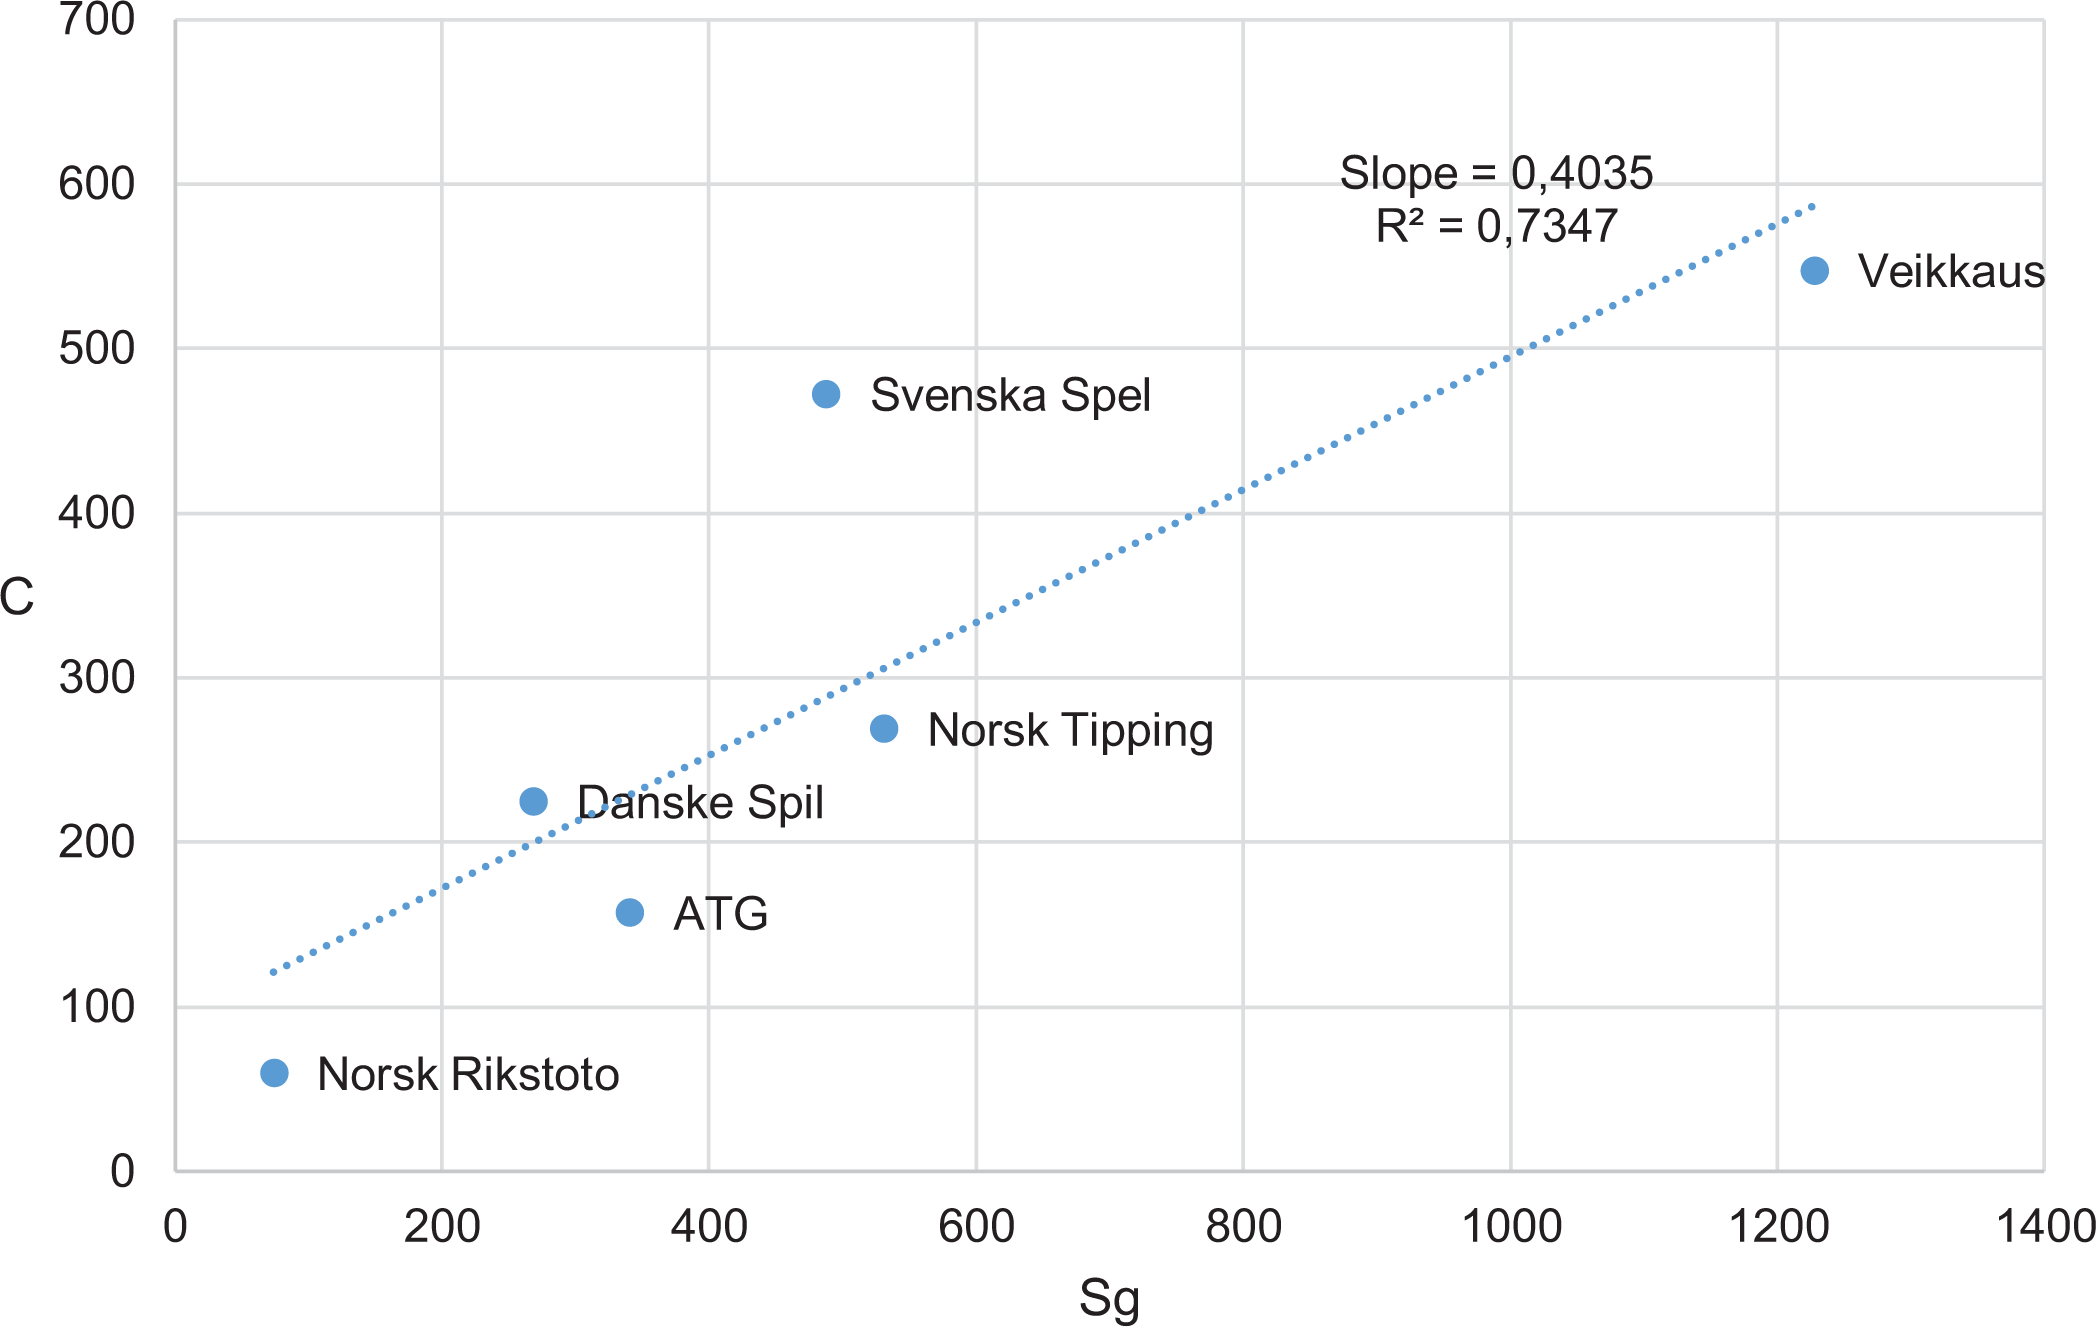
Surplus to society (Sg) relative to total operating costs (C), in millions of PPP euros.
Discussion
The results reported in this article show that the amount of public revenue received from gambling companies depends largely on the volume of operations, market share, and total operating costs. Differences in operating costs are attributable to the different product portfolios and varying market shares of operators, but also to differences in personnel costs, marketing expenses and retail commissions. Market competition is most relevant in determining marketing expenses. Based on our material, we are able both to draw conclusions from the results, but, perhaps even importantly, also to point out what cannot be stated based on currently available research evidence, and most notably financial reporting.
First, our results explain why some companies, notably Finnish Veikkaus, seem at first glance to be doing better than other Nordic state-controlled gambling enterprises. However, from another perspective, the large surplus to society collected by Veikkaus does not necessarily reflect a much more efficient business model. Instead, it is indicative of reliance on fast EGM games and its privileged position in the Finnish market that shields it from competition. Electronic gambling machines enable rapid, repetitive and continuous play in the process of collecting money from Finnish players. This also promotes addiction, since high availability combined with more gambling often means more harm (Rossow, 2019) and EGMs inarguably being among most harmful forms of gambling (Livingstone et al., 2019; Schull, 2012; Selin et al., 2017). They also serve to normalise gambling given their placement in everyday environments (shops, kiosks and cafes).
In terms of addressing EGM harm, Finland lags behind Sweden (which removed most of its EGMs from public spaces in the 1970s) and Norway (which reduced the numbers of EGMs dramatically in 2007–2009 and introduced mandatory identification of players). The removal of EGMs from public spaces in Finland was also proposed in a report by the National Institute for Health and Welfare (THL) given to then-Minister of Family Affairs and Social Services in 2017 (Selin et al., 2017), and in a citizens’ initiative in 2019, but without much effect so far. However, the situation may change since several political parties have recently indicated their willingness to remove EGMs from the public sphere as well as following the temporary closures of EGMs during the COVID-19 crisis.
Second, the decline in market share among authorised Nordic gambling operators forces them not only to compete by means of aggressive marketing but also to expand their product ranges and increase the proportion of fast games in their portfolios (Marionneau et al., 2018). As gambling moves increasingly online, customers have more choice of games that are rapid and more rewarding in terms of bonuses, prizes and return percentages. If the Nordic government-controlled gambling companies wish to retain their market positions, they must increase their return percentages and bonuses, or create more addictive game portfolios. In so doing, however, they would dilute their responsibility stance (Sulkunen, 2019).
Importantly, what our results do not show is the relevancy of “responsible gambling” policies which are also emphasised by Nordic government-owned monopolies. Since the focus here is on monetary allocations, it appears that the more competitive the market environment is, the less able gambling operators are to channel the monies to their host societies. In the international (online) market environment, being a “responsible” operator does not pay. Sweden has not able to gather exceptional revenue since it does not control an increasing and competitive online market environment, through its government-owned gambling operators. Danske Spil in Denmark has been able to rely its lottery operations, but this market in Europe is mostly saturated, compared to online gambling and fast games. Veikkaus in Finland has been able to collect much of its proceeds via land-based operations (EGMs), but in case it has to remove the EGMs from shops and grocery stores in the (near) future, this revenue stream most likely cannot be upheld. In Norway, revenue from lotteries and other slow-paced games creates a situation in which much of the online gambling is conducted with foreign-based operators, raising the question whether a market share of less than 50% still constitutes a monopoly.
Conclusion
In this article, we embarked in a research effort to find out whether Nordic gambling operators are “efficient”. These findings call into question the justification of state-operated gambling. While the Nordic countries are strongly committed to advancing public health, in the case of gambling the proceeds seem to outweigh the harm to the population. The Finnish Lotteries Act (23.11.2001/1047, updated 21.12.2016/1286) states that a gambling monopoly is justifiable to prevent and reduce gambling-related harm, but such legal justification does not appear to be in line with the economic realities of raising profit for society. The proceeds from gambling in Finland do not necessarily benefit the geographical areas from which they are collected (Roukka & Salonen, 2019). Moreover, Finnish EGMs are disproportionally placed in poor neighbourhoods (Raisamo et al., 2019). Thus, it is questionable whether Nordic ideals of equal and fair society are been advanced through gambling, even though the proceeds are in many cases allocated to “good causes”.
Much of the Nordic gambling profit also derives either from a very small number of gamblers (Salonen et al., 2019) or from highly addictive gambling forms such as EGMs and players who have issues with their gambling (Public Health Agency of Sweden, 2019). The case of Norway shows that effective limits on the government’s ability to target its own citizens for public revenue collection (i.e., obligatory pre-commitment) leads operators to rely on less addictive game forms that are, subsequently, also able to gather less profit and/or lose market shares in the online environment. However, this approach does protect the land-based gamblers efficiently, since only a few helpline calls emanate from use of gambling machines. In such a situation, issuing personal gambling licences (cf. driving licences and permits to carry weapons) might be a better option than responsible gambling campaigns in terms of further enhancing player protection (Nikkinen, 2019).
What was not shown in this kind of efficiency analysis is that responsible gambling policies would otherwise have any impact on revenue collection. Other commentators before us have claimed that “responsible gambling” practices appear to be ineffective and to serve the fiscal interests of governments (Adams, 2020; Cassidy et al., 2013; Hancock & Smith, 2017; Livingstone, 2020). A profit or efficiency-driven approach to gambling is not in line with decreasing gambling harm within populations. Instead, the efficiency of any company is, of necessity, measured in such a manner that the role of responsible gambling offer is either negligible or cannot be shown at all.
Footnotes
Acknowledgements
The authors wish to thank Pekka Sulkunen, Emmi Kauppila, Juho Lähteenmaa and Sébastien Berret for their assistance with conceptual and methodological development, in addition to the data collection.
Declaration of conflicting interests
The authors declare the following potential conflict of interest with respect to the research, authorship, and/or publication of this article: The Academy of Finland is partially financed from funds that emanate from the Finnish gambling monopoly (through the Ministry of Culture and Education).
Funding
The author(s) disclosed receipt of the following financial support for the research, authorship, and/or publication of this article: This research was supported by the Academy of Finland (decision 318341), through the project “Political economy of gambling: Circulation of value and vested interests” under the leadership of Prof. Pekka Sulkunen.