
Abstract
Aim:
To analyse to what extent the gradual relaxation of traveller allowances for alcoholic beverages 2001–2004 changed consumer behaviours and subsequent alcohol consumption patterns within a longitudinal panel data population study in Southern Sweden.
Methods:
General population random sample panel data study with repeated measurements were collected in 1999, in 2005, and in 2010 in the county of Scania. The study analyses answers from 9770 individuals, who in 1999 were 18–80 years old. A fixed-effects modelling was applied to assess the association between consumer behaviour and change in alcohol use across the study period.
Results:
Cross-border shopping for alcoholic beverages was associated, on average, with a 3.1% (p < 0.001) increase in alcohol use. Buying imported alcohol from a private person was associated with a mean increase of 2.6% (p < 0.001), with a total additive effect of 5.7%. Furthermore, when stratified for gender, age, and location, significant fixed effects were found. The magnitude was greater among women, younger and older ages, and in particular in the Northeast and Central regions. Both consumer behaviours – cross-border trading (OR 1.6, CI 95% 1.28–1.92) and buying alcohol from a private person (OR 1.4, CI 95% 1.12–1.73) – were significantly associated with heavy alcohol use.
Conclusion:
The fixed-effects analyses identified significant associations between consumer behaviours and alcohol consumption. The uptake of behaviours that developed because of a relaxation of the Swedish alcohol policy has contributed to an overall long-term increase in alcohol use and higher prevalence of heavy alcohol use within this general population study sample.
Keywords
For the last century, alcohol policy has been considered a vital part of Swedish social policy. In Sweden, alcohol use contributes to 4% of the total burden of disease (Allebeck, Moradi, & Jacobsson, 2006; Statistics Sweden, 1996) and about 2000 Swedes died of alcohol-related causes in 2010 (Swedish National Board of Health and Welfare, 2011). Historically, control of sales of alcoholic beverages has been anchored in research in international studies and on aggregate national alcohol use and harm (Andréasson, 1998; Babor et al., 2010; Rosén, 1989), applying three, seemingly effective supply control measures: price control, minimum legal age to purchase alcohol, and retail monopoly.
In 1995 Sweden joined the EU. Initially, not much changed regarding the abovementioned measures. The minimum drinking age remained at 20, the retail monopoly stores were open from 9 am to 6 pm Monday to Friday. However, there was an increase in alcoholic beverage specific traveller allowances on beer (from 2 litres to 15), wine (from 1 litre to 5), and intermediate products such as fortified wine (from 1 litre to 3). In 1999 the EU demanded Sweden to harmonise its traveller allowances for alcoholic beverages with those of other EU countries, which practically meant that they would be removed. As a result, a gradual process to increase the traveller allowances was implemented, ending in their complete removal in January 2004 (for a more detailed description of this process see Österberg & Karlsson, 2002). In 2003, Denmark lowered their tax on distilled spirits by 45%, increasing the already substantial price gap for alcoholic beverages between Sweden and Denmark even further.
There have been several studies, applying different methodologies, analysing the effects of the changes mentioned above, i.e., changes in traveller allowances and tax changes. At Stockholm University a series of analyses, using cross-sectional data, identified a general increase of about 30% in alcohol use in Sweden generally from 1996 until 2004, which was predominantly explained by private imports, mainly from Denmark and Germany. Since then, consumption, as well as private imports of alcohol, has levelled off and decreased (Trolldal & Leifman, 2017).
As there was a widespread fear among politicians, pundits and researchers that the abovementioned Danish tax cut on spirits would lead to a substantial increase in private imports – together with other alcohol tax changes in Scandinavian countries – the so-called Nordic tax study was funded by the Nordic Council. The studies applied a longitudinal panel data design detecting only marginal effects (Bloomfield, Wicki, Gustafsson, Mäkelä, & Room, 2010; Gustafsson, 2010; Mäkelä, Bloomfield, Gustafsson, Huhtanen, & Room, 2008). Simultaneously, a different longitudinal cohort study on consumption in Southern Sweden from 1999 to 2005 also observed small changes (Stafström & Östergren, 2014). These findings contradict economic theory on price elasticity and alcohol (Berggren, 1997; Chaloupka, Grossman, & Saffer, 2002), as well as those on the effects of physical availability (Babor et al., 2010), which postulate an increase in consumption if physical and economic availability increase.
An important but often disregarded notion is that the main link between the abovementioned policies and alcohol consumption are consumer behaviours. Changes in private import quotas will not affect consumption levels if they are not followed by a modification of how alcoholic beverages are purchased. Instead of going to the local retail monopoly store, the consumer needs to buy their products abroad or from an illegal vendor within the borders of Sweden if one wants to capitalise on this new regiment. Thus, in order to grasp the effect of policy changes it is instrumental to also understand how consumer behaviours have affected consumption overall.
Yet, studies that have analysed how consumption would change with an elimination of traveller allowances have done that exclusively from a price elasticity perspective. One such example is a study by Holder et al. (1995), where different potential alcohol policy change scenarios in the wake of Swedish EU membership were simulated. One scenario that was analysed was that the taxes and the retail monopoly would remain in their current state, which eventually remained the case. However, the above analysis assumed that this would result in unchanged consumption levels – not a 30% increase.
As the example of Sweden has demonstrated, consumption patterns of alcoholic beverages are dependent on things other than price. In marketing research, the term “marketing mix” is often used to describe the complexity of consumers’ decision-making processes. The basic marketing mix contains four key elements: product, price, place and promotion (Peter & Olson, 2010). The policy changes that affected Sweden were not direct changes in price. It was rather that place became expanded, to potentially – but not necessarily – include vending points outside Sweden. The questions that then emerge are, who chooses to access this expanded place, to what extent is it done, and what is the overall impact on alcohol consumption patterns? Ultimately, considering marketing theory, there is a relationship between price and place. This implies that a change in place may affect consumption, but only if the consumer accepts the change. In this particular case this would include accepting that one needs to allow for more time to purchase alcohol, travel long distances, cross borders, and buy somewhat different products.
How consumer behaviours affect alcohol consumption patterns are still not very well described, especially regarding traveller allowances, though one study has addressed the issue. The study by Stafström & Östergren (2014) came to the conclusion that there is an association between consumer behaviour and consumption, but it did not assess the magnitude of the contribution to consumption patterns.
Thus, there is an evident need to model the impact of consumer behaviours – not only price elasticity – in order to understand how demand for alcoholic beverages is influenced by environmental changes. The aim of this study was to model how different consumer behaviours – here, private cross-border shopping and purchasing alcohol from a private person in Sweden – affect overall consumption at large, and also to what extent these behaviours are associated with heavy alcohol use.
Methods
Population and setting
In the autumn months of 1999 (T1) a prospective cohort study– the Scania Public Health Cohort – conducted its first wave of data collection, with the second wave collected in the autumn months of 2005 (T2), and a third wave of data collected in the autumn months of 2010 (T3). The panel was constructed from a non-proportional geographically stratified sample of individuals born 1919–1981 (aged 18–80 years) living in the county of Scania. In total, 24,922 subjects were asked to participate, of these 13,604 responded (55% response rate), before or after receiving two reminders. All communication with the participants was conducted through the postal services. To participate the respondents had to sign an informed consent form and return it to those responsible for the data collection. In 2005, an identical questionnaire was mailed to those responding at T1 who were still alive and living in Scania, in total 13,020 individuals. Of these, 10,485 responded within two reminders, amounting to a 77% response rate. In 2010, all respondents from the 1999 sample were approached with an identical questionnaire. This time 8968 participated in the survey, resulting in a participation rate of 66%. However, for the purpose of this study two criteria were included. First, the respondents had to respond to all three surveys. Second, the respondents had to have answered the quantity/frequency (see Table 1) measure relating to alcohol use at all of these occasions. When analysing the alcohol consumption data, a total of 152 cases were detected in which the data processing had faulted, likely when the questionnaires were scanned. As a consequence, these were omitted. Finally, 16 cases where the estimated annual consumption, either at T1, T2 or T3, exceeded 200 litres of pure alcohol were excluded as this was considered to be an unlikely consumption level across a full year based on the assumption that this would exceed a standard bottle of spirits per day. This resulted in a final sample of 4910 individuals included in a balanced panel dataset.
Definition of dependent and independent variables.
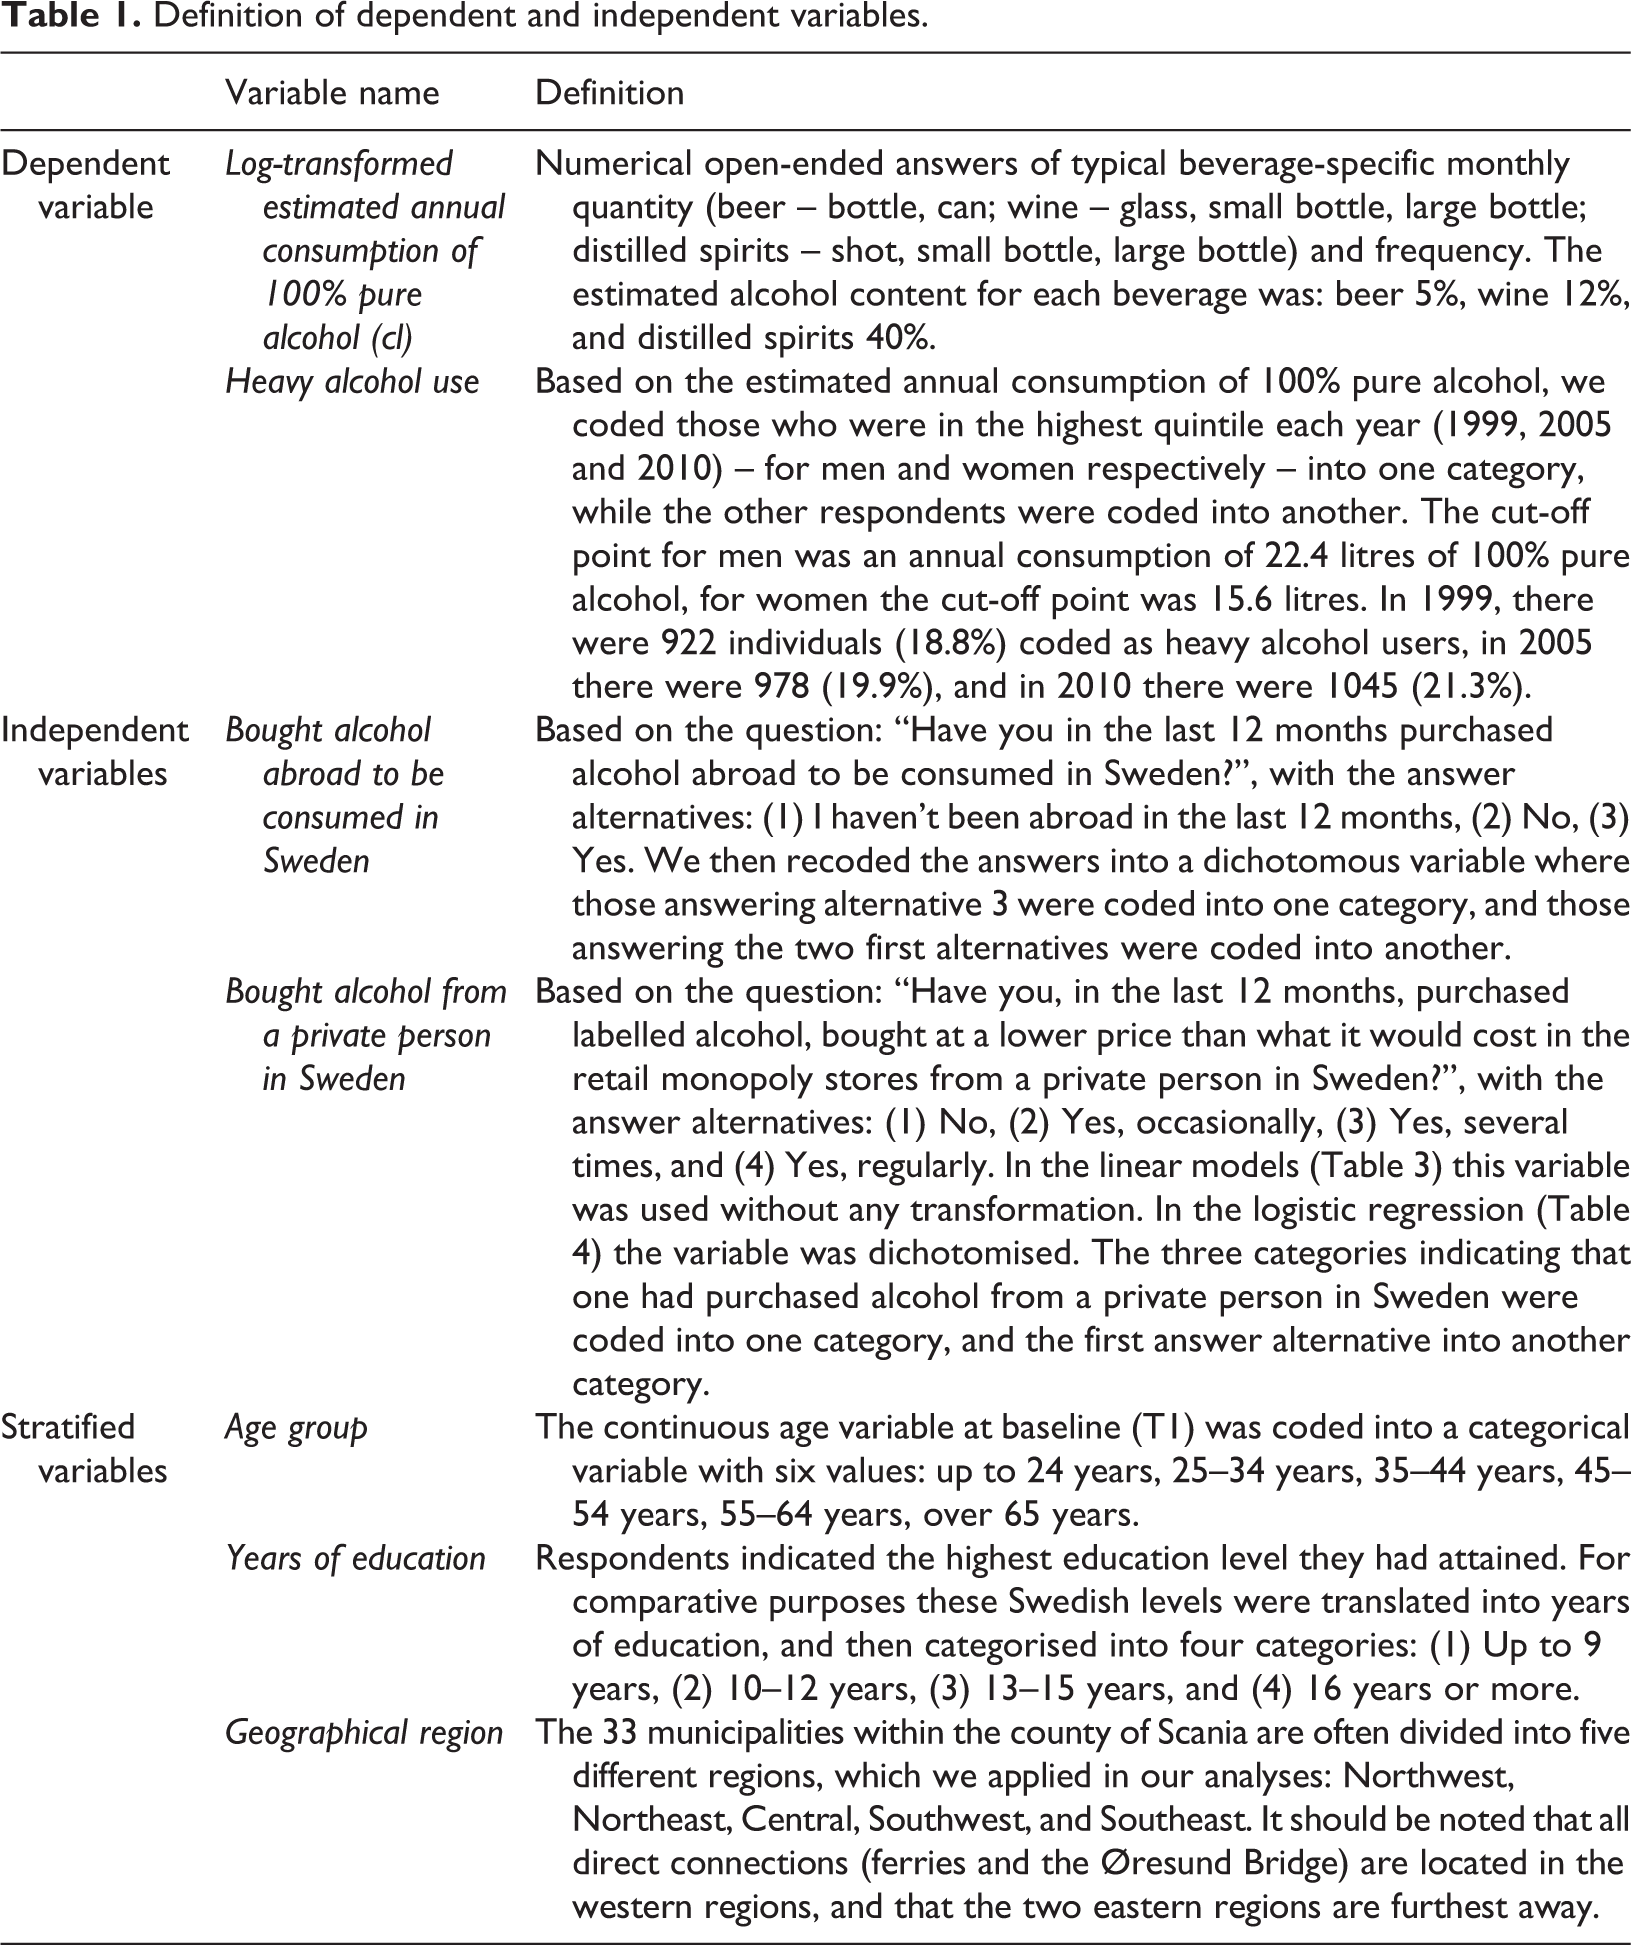
The questionnaire contained 105 questions and covered a wide range of health issues, including self-rated health, work-related health, and health-related lifestyles (including alcohol use), healthcare consumption and a wide range of socioeconomic background information.
There were a number of items regarding alcohol use in the questionnaire. First, a set of beverage-specific quantity frequency questions on alcohol use (Midanik & Clark, 1994); second, two items relating to the indirect erosion of the Swedish measures to control alcohol consumption, so-called unregistered consumption.
Measurements
In Table 1 the measurements applied in this study are described in detail. Estimated alcohol use, and subsequently the change between 1999 and 2010, of 100% pure alcohol in centilitres was the main outcome variable, which was measured by self-reported alcohol consumption on a beverage-specific quantity-frequency scale referring to the last 30 days reported in cl. In one analysis (see Table 4) the outcome variable was heavy alcohol use. This variable was defined according to the description in Table 1.
Statistical methods
For all statistical analyses Stata version 12 was used, mainly applying the xtreg and xtlogit commands. Initially we tested whether there were any changes across time among the included time-variant variables. For the continuous variable we applied an ANOVA test and for the categorical variables a chi-square test.
We then applied fixed-effects modelling to estimate change over time. The fixed-effects method is a simple subtracting procedure: a mean value for each time-variant variable per person is calculated and then these means are subtracted from each of persons’ variables’ values. Thus, the transformed values are not absolute, as they reflect the differences to the mean. These person-specific mean deviations are then conditional maximum likelihood regressed (Allison, 2009).
Multivariable linear regression analyses for panel data using a fixed-effects model (Baltagi, 2005) were performed. The model can be determined as follows:

In the model, individuals (i) were observed over time (t). All variables (independent, dependent and covariates) had a double subscript since they assumed a value in individuali, at timet. The other two terms of the model account for the unobserved time-invariant characteristics in individuali (αi) and for the time-varying characteristics in individuali at timet (u it) that could have affected the log-transformed estimated annual alcohol use (error term).
We also applied multivariable logistic regression for panel data using a fixed-effects model (Allison, 2009). Here, ORs were calculated for the effect of consumer behaviours on developing heavy alcohol use.
Both the linear and the logistic regressions were then stratified for different time-invariant variables (gender, age, socioeconomic position, and geographical region) in order to estimate the fixed effects in different substrata.
The estimators in a panel data model could be either random or fixed, depending on the independence between the error term and the independent variable. The fixed effect assumption is that the error term is correlated with the independent variable. The Hausman test was used to verify that assumption and if the null hypothesis was rejected, fixed-effects models were used. The F-test, if statistically significant, indicates the use of panel data models rather than OLS models, considering that there is variance across entities, i.e., individuals (Baltagi, 2005).
In order to assess the statistical significance in the fixed-effects models, robust standard errors were calculated in the linear fixed-effects regression models and bootstrapped standard errors in the logistic fixed-effects regression ones. In the linear fixed-effects analysis we illustrate the change across time in percentages. To obtain these percentages, we divided the estimate for the independent variables by the estimate for the constant.
Results
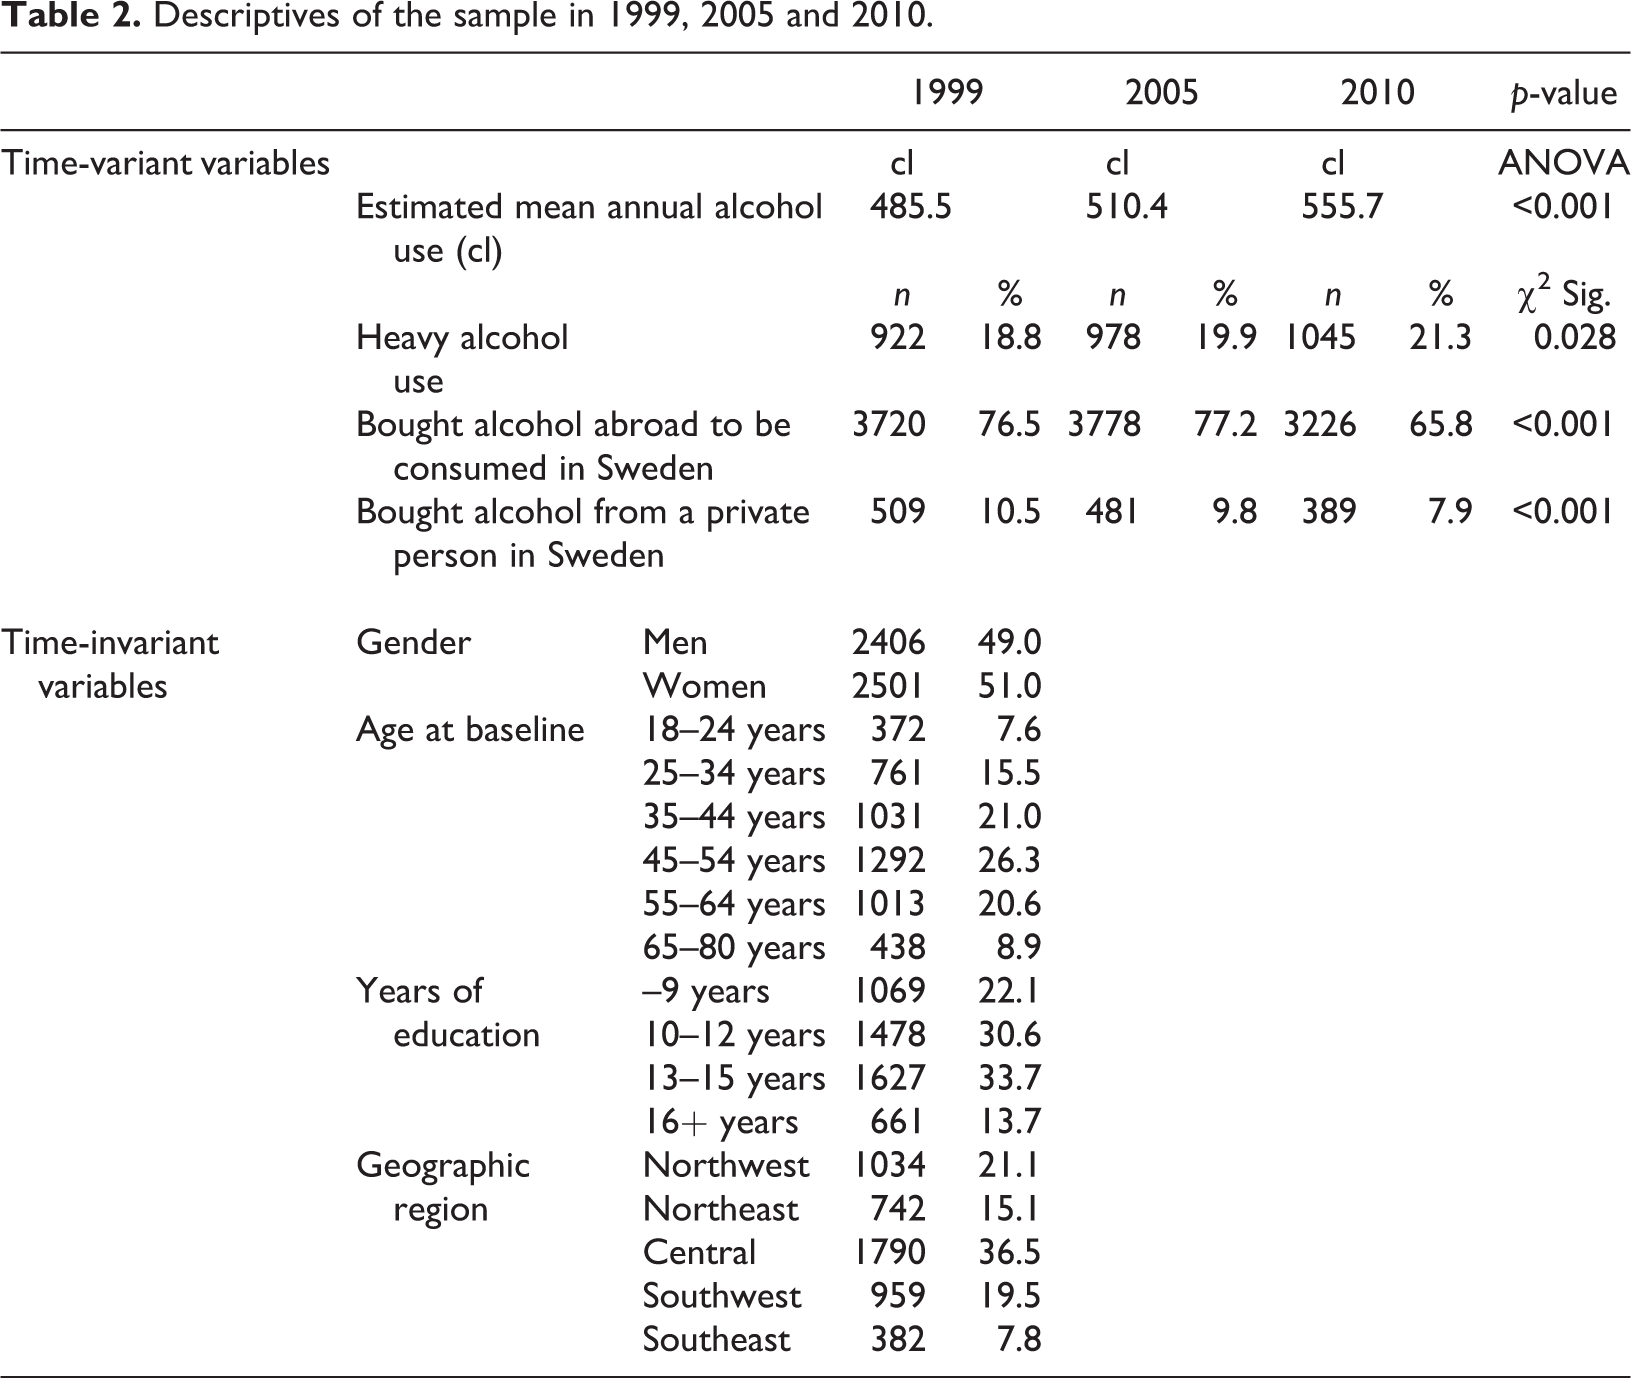
In Table 2 we present the descriptive results within the sample. As shown, the vast majority of the sample had engaged in importing alcohol from abroad, though this behaviour declined significantly from 1999 onwards. Having bought alcohol from a private person in Sweden was rather rare and also decreased significantly in prevalence from 1999 onwards. The overall estimated alcohol use increased significantly from 1999 to 2010, in total by 14.4% (from 4.85 litres/year/capita in 1999 to 5.55 litres/year/capita in 2010). The sample was evenly distributed between the genders, with a small majority of women. Apart from the youngest and oldest groups, the age distribution was also even. The Central geographical area was more represented than the others, even though the Southwest and Northwest areas are populated to the same degree.
Descriptives of the sample in 1999, 2005 and 2010.
In Table 3 we assessed the independent fixed effect of the consumer behaviours “Purchased alcohol abroad to be consumed in Sweden” and “Purchased alcohol from a private person in Sweden”. As shown, both were associated with a significant increase in estimated annual alcohol use, rather similar in magnitude. The total additive effect was 5.7%. In the stratified analyses, with a single exception, buying alcohol abroad was associated with higher alcohol use. The greatest effect was found among the youngest strata in the sample of 6.3%. Buying alcohol from a private person was also generally significantly associated with an increase in estimated alcohol use, though with more exceptions. The magnitude of the fixed effect was in general, with some aberrations, higher for buying alcohol abroad than buying from a private person in Sweden. For all analyses, the Hausman test and the F-test suggested that fixed effects was the appropriate method of analysis.
Fixed effect coefficients of consumer behaviours in relation to change in total alcohol consumption in different substrata.
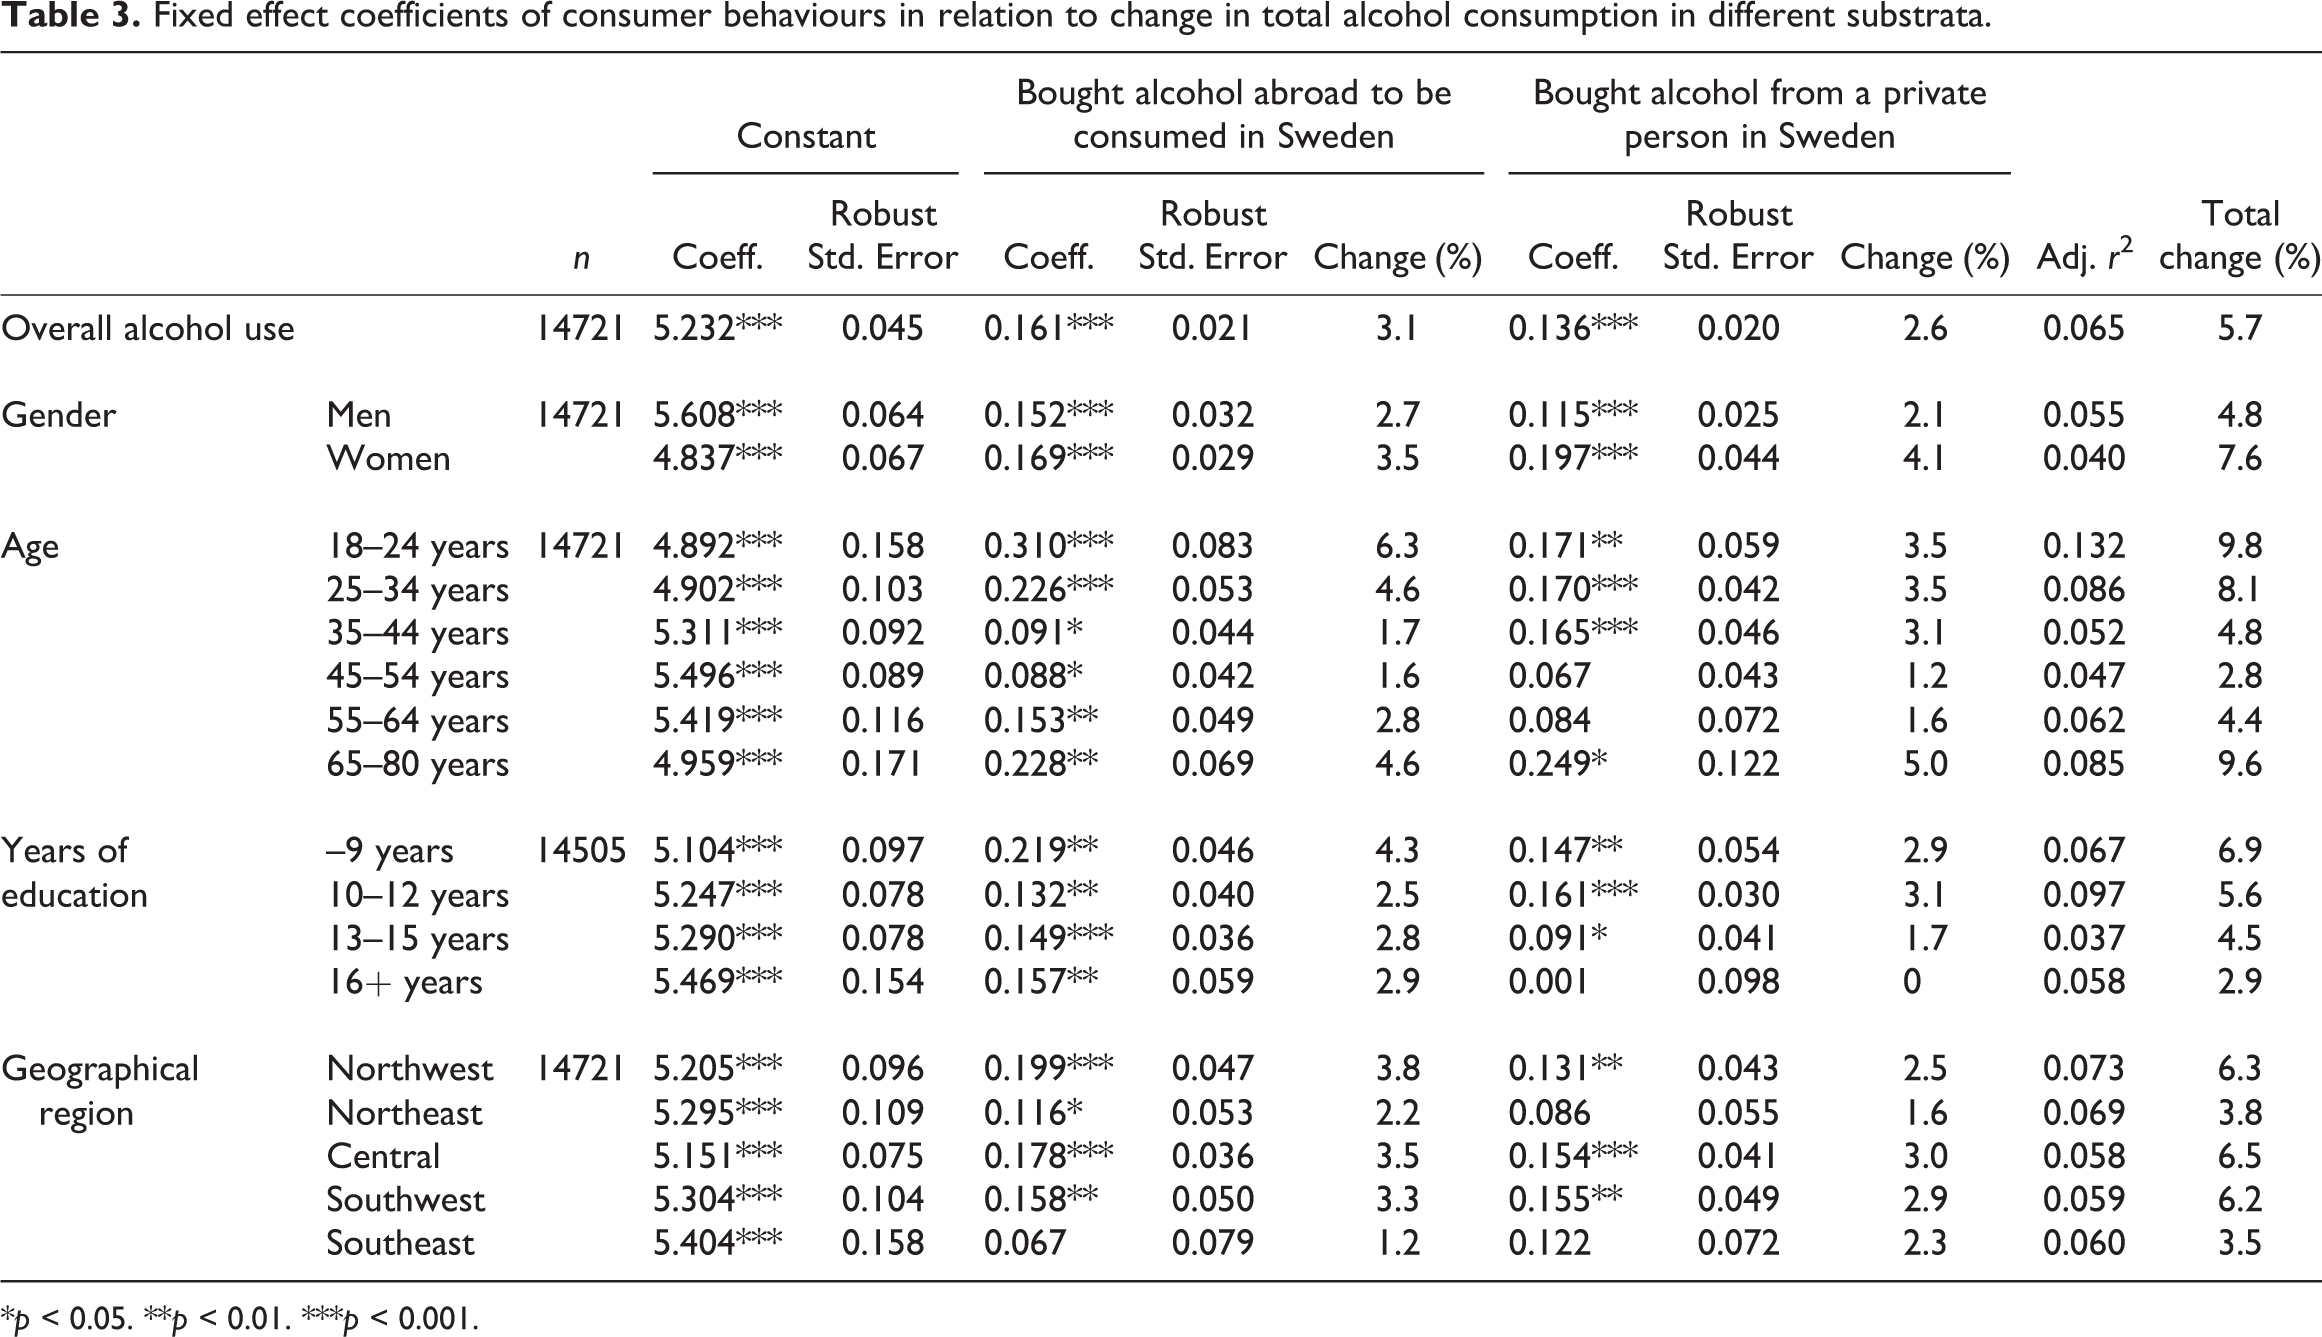
*p < 0.05. **p < 0.01. ***p < 0.001.
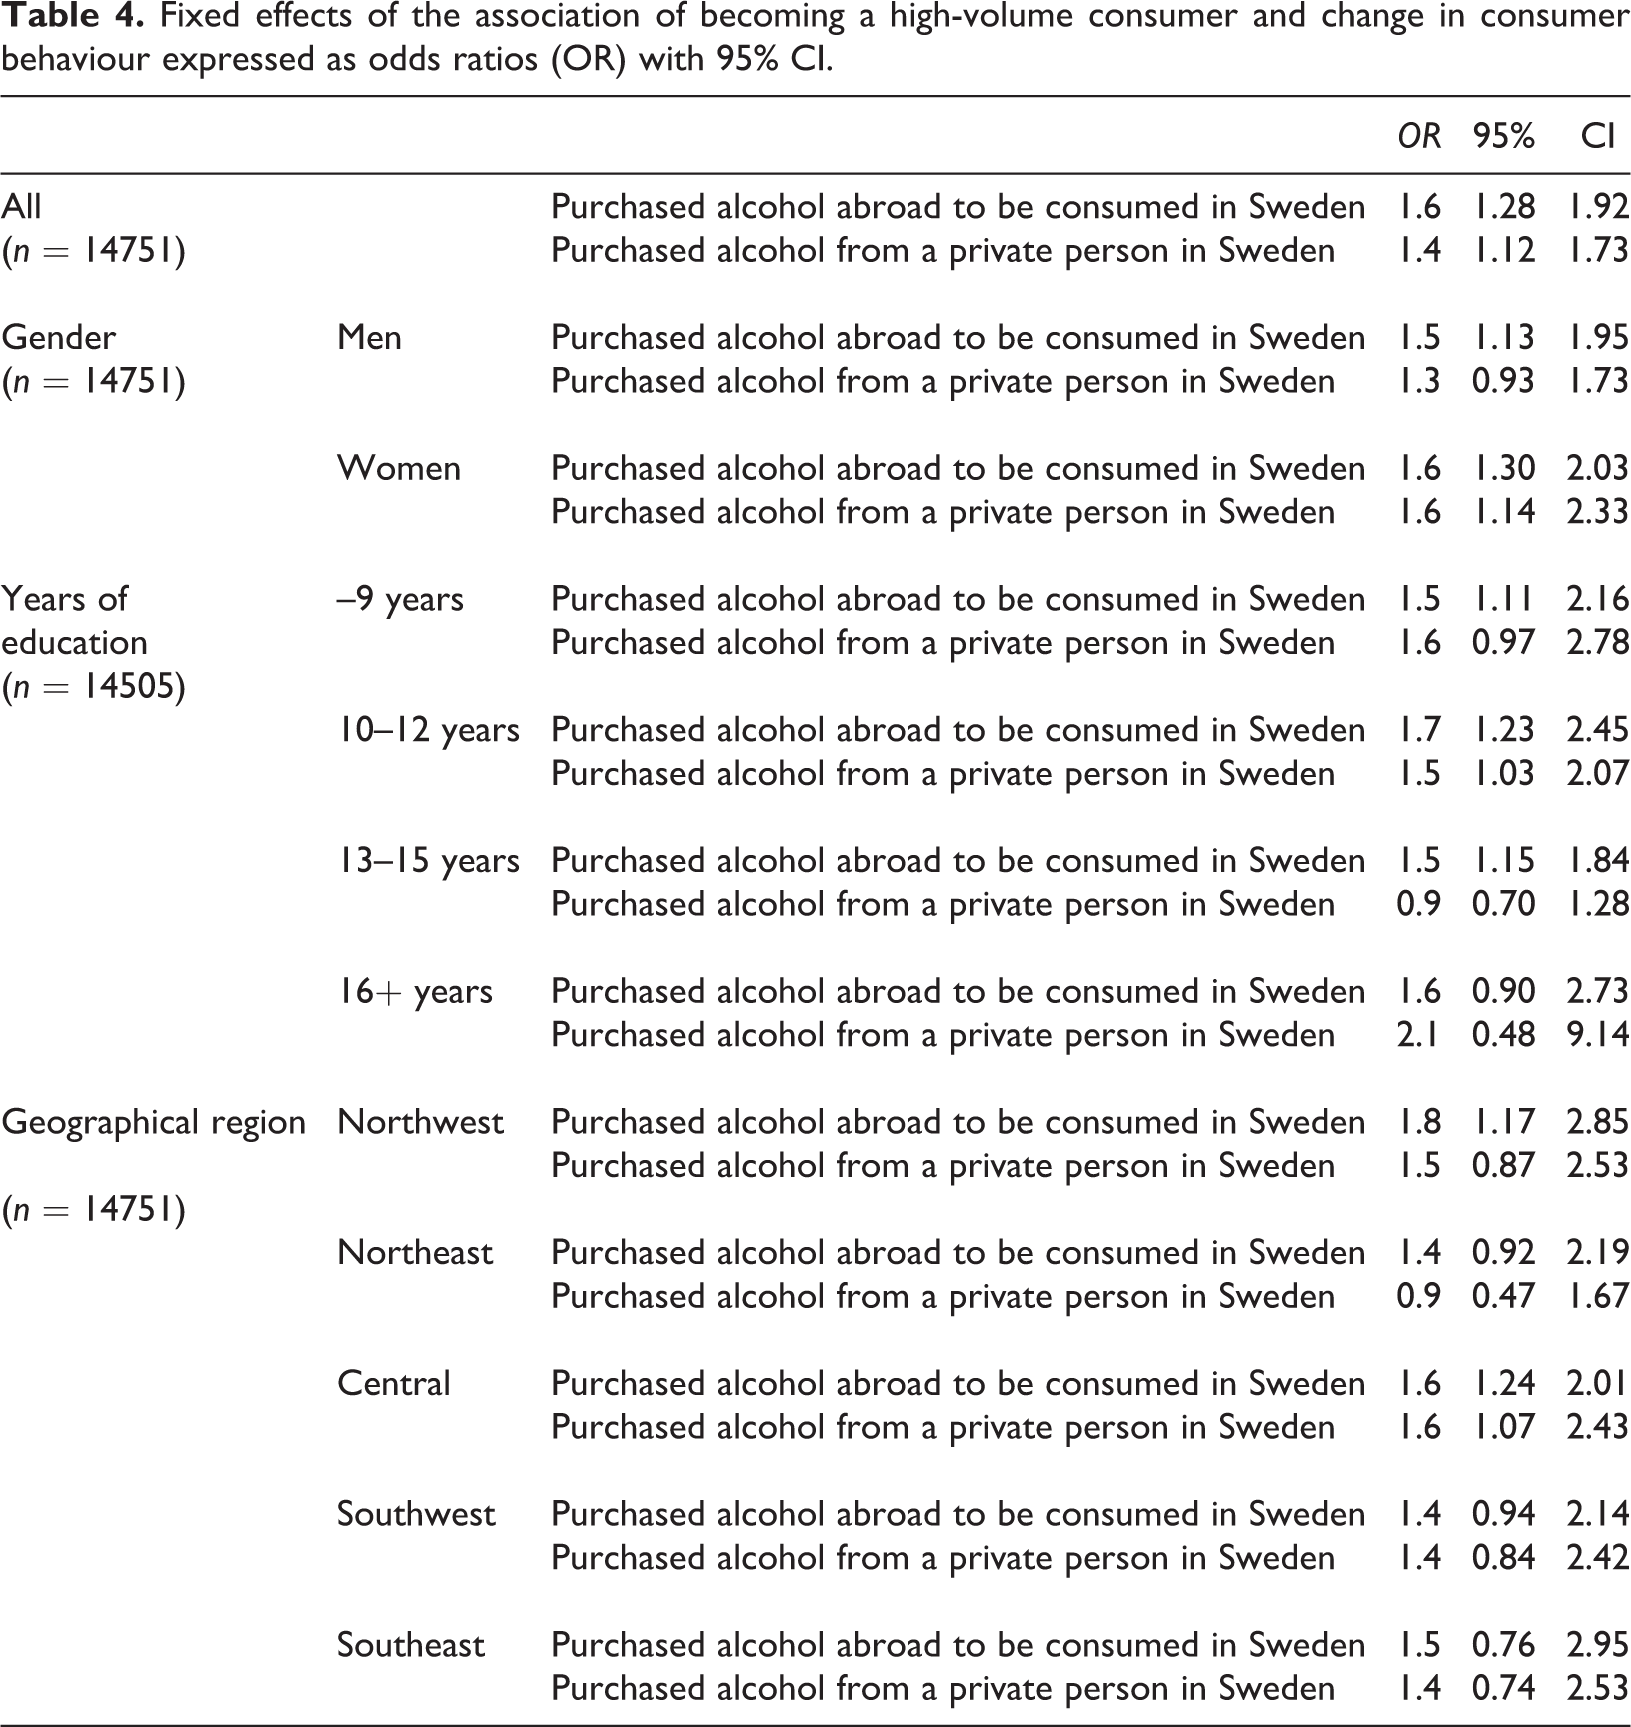
In Table 4 we present the logistic fixed effects of the consumer behaviours, as odds ratios (OR), in relation to increasing one’s estimated consumption to that of the highest quintile of the sample. In the full sample both actions were independently associated with the outcome. This was also the case for women, those with 10–12 years of education, and for those living in the Central region. For other determinants (being a man, having either 9 or fewer years of education or 13–15 years of education, and living in the Northwest region) only buying alcohol abroad was associated with developing a heavy drinking pattern. Interestingly, for all age strata there were no significant associations and therefore these results were omitted from the table.
Fixed effects of the association of becoming a high-volume consumer and change in consumer behaviour expressed as odds ratios (OR) with 95% CI.
Discussion
This study aimed to assess the effect that changing consumer behaviours have on alcohol use. The results indicate that they do have an effect, totally amounting to 5.7%, while the total overall increase of alcohol use in the sample between 1999 and 2010 was 14.4%. The analyses further described the effects within several strata, and we could observe that these effects are different within different groups. In addition, we could also associate incidence of heavy alcohol use with the adaptation of the consumer behaviours included in this study.
An important notion within this study is that we have not assessed the impact of price changes and price elasticity, which are commonly analysed in studies addressing the demand for alcohol. Yet, according to the publicly available data at Danmarks Statistik (2017) and Statistics Sweden (2017) on the inflation-adjusted alcohol prices in Sweden and Denmark, considering currency rates, the prices across the study period (1999–2010) were almost unchanged, e.g., a bottle of alcohol that in real terms would have cost the buyer 100 SEK in 1999 would in 2010 cost 99.7 SEK. When comparing prices of alcoholic beverages between Sweden and Germany, Eurostat data suggest that the price gap has been reduced between the two countries. In 2000, the so called “comparison price level index” for alcoholic beverages was 164 for Sweden and 82 for Germany. In 2010 the same figures were 138 for Sweden and 91 for Germany. This means that the relative price difference of alcoholic beverages has been reduced from 100% in 2000 (164/82) to 52% in 2010.
Time is another important aspect in this study. We analysed individual-level data gathered across a decade. It is evident that alcohol use within the cohort, i.e., on individual level, will fluctuate especially since the estimation of use is rather blunt – but given this data collection method this is to be expected (Skog & Rossow, 2006) – while it will illustrate more accurately the change in aggregate-level consumption. Therefore, it can be assumed that having three waves of data would improve the fixed-effects estimates, in comparison to having only two.
Another important aspect of time is how the southern Swedish culture has assimilated to the EU membership conditions. As proposed in another study (Room et al., 2013), there was initially a large interest in cross-border shopping for alcohol when Sweden joined the EU in 1995 and up until the first couple of years of the 21st century. The import quotas were, however, not even remotely as high as they were in 2005 and onwards. This suggests two conclusions. First, it is not the size of the import quota alone that will determine the extent of cross-border shopping. Second, the first changes to a quota is likely to tickle the curiosity of the general public who initiate cross-border shopping, while the circumstances will not be as interesting later on. The reason might be that alternative costs are starting to be taken into account, as suggested by Room et al. (2013). One finding in this article that suggests the latter is that the effect size for buying alcohol abroad was considerably higher among the oldest age group (7.5%) than for most other groups. This is an age group that is more sensitive to price and has considerably lower alternative costs.
Another interesting finding was that it was the central parts of Scania, not the western parts closest to the borders, where the effect was the highest. This suggests that the culture vis-a-vis private imports of alcohol has developed differently in different locations. In the border towns, EU membership and the evolvement of communications (mainly the Øresund Bridge) might have led to a setting where one travels to Denmark from Sweden without thinking about the fact that one is leaving one country and entering a different one. Thus, the further away from the border you live the more “abroad” Denmark appears. However, alternative costs make long journeys less interesting, hence central Scania experiences the greatest effect from the cross-border alcohol trade.
As suggested by some authors (e.g., Andreasson, Holder, Norström, Österberg, & Rossow, 2006; Norström, 2005), the demand for alcohol, expressed as price and income elasticity, does not differ when comparing the border regions with other regions further away from the border. In this study, we only included data from what has been considered a border region. Within the region, we found that the impact of the consumer behaviours linked to the increased cross-border trade indeed had a higher impact closer to the border. This finding is similar to the conclusion of a Danish study analysing data in relation to the cross-border trade between Denmark and Germany in the wake of the Danish tax cut on spirits in 2004 (Grittner & Bloomfield, 2009). However, in this present study, it did seem as if the effect was strongest in the central region, which is not in the immediate vicinity of the border. This is something that could be explained by travel patterns, i.e., in the border regions travel across the borders has become much more normalised compared to regions further away.
The present study provides findings that differentiate the impact of the policies between different subgroups. This is an important contribution to the existing literature as there is a lack of information on how the relaxed traveller allowances have impacted different groups within Swedish society. Previous research has pointed out a lack of insight into such a differentiated pattern (Nelson & McNall, 2016).
When evaluating how the Swedish strategy succeeded in containing alcohol consumption, the country faced two concurrent challenges to its alcohol policy measures. First, the traveller allowances were eradicated. Second, Denmark, the closest alcohol market outside Sweden, lowered their excise tax on sprits by 40%. The Swedish government met these challenges by deciding not to change the excise alcohol tax – contrary to Finland, which lowered its taxes. The conclusion of this article is that this decision resulted in a 6% increase in overall estimated alcohol consumption and an increased risk of developing heavy alcohol use in among those who chose to engage in the market related to private imports of alcohol within this sample. Concurrently, in this sample, the mean alcohol use increased overall by 14.4%, implying that about 2/5 of the increase in consumption can be explained by the cross-border trade. This indicates that the majority of the increase in drinking can be mainly explained by other factors, such as a shift in culture and in overall purchasing power as previously suggested (Room et al., 2013). Lowering taxes would most likely have led to a heavier increase in overall use and greater risks of developing heavy alcohol use – as it did in Finland (Mäkelä et al., 2008; Room et al., 2013). The Finns chose to reduce their excise taxes severely; still they experienced an even steeper increase in alcohol use and a similar trend regarding unregistered alcohol use (Karlsson, Mäkelä, Österberg, & Tigerstedt, 2010). Yet, in Denmark, their reduction of the spirits tax did not lead to a substantial decrease in overall private imports of spirits, though there was a shift from many importing little, to fewer importing more (Grittner & Bloomfield, 2009).
Even though the results suggest that the course taken by the Swedish Government was quite successful in meeting the challenge posed by EU directives, the findings do indicate an increase in consumption due to the uptake of consumer behaviours that were a consequence of the policy change. Previous studies have not demonstrated this impact of the relaxed traveller allowances on drinking trends within their Swedish samples (e.g., Mäkelä et al., 2008; Room et al., 2013; Stafström & Östergren, 2014). Yet, in this study, I show that the policy-associated consumer behaviours have contributed to about 2/5 of the increase in consumption that we have identified in our sample. One can argue that the main reason for this discrepancy between this study and previous research is time. This study followed the same sample over a longer time period. Previous studies have all had narrower time intervals between baseline and follow up, and it should be assumed that there is a period of adaptation to a new policy setting.
Methodological considerations
The data used in this study have several strengths. They form a large panel data set with three repeated measurements across a 10-year period, during which Swedish alcohol trends were changing in an unprecedented manner. Another important strength is that they included measurements of policy implications relating to traveller allowances and a parallel private illicit market for alcoholic beverages.
There are, however, some challenges. First, there was a considerable proportion of the initial sample that chose not to participate in the following data collections. This does not imply that the findings within this study are less valid, though it does raise issues of how well the sample represents the general population. Additionally, in the current panel the response rate was higher among women and among older baseline respondents. Another challenge is that alcohol use was measured at point intervals, and not continuously. Therefore, the study identified great variation in some individuals while very slight changes in the vast majority.
Another concern is recall bias. In alcohol research, recall bias tends to lead to underestimation of consumption. In this particular study, however, the interest was predominately in comparing consumption over time within each subject. The most important issue regarding recall bias then becomes whether it changes over time, either due to ageing or due to changing alcohol use. If it is stable, recall bias does not affect the estimates in a fixed-effects analysis. The study found one reliability study addressing this issue, and it could conclude that those older than 55 years and those drinking heavily statistically significantly underestimated their alcohol use (Liu et al., 1996). It should be noted that this study did assess yearly alcohol use, and not monthly. Applying these findings to the present study would imply that the fixed effects among the older age strata would likely be larger without recall bias.
Another limitation applies to the sample. One should have in mind that the sample consists of a population that is “normal”, in the sense that marginalised individuals, e.g., those with severe drinking problems, are most likely underrepresented. The sampling method is not ideal to gather data from individuals who have an unstable life situation, such as alcohol addicts. In conclusion, this suggests that the findings of this study may explain the effects of the policies within the general population but should not be considered automatically as impacting the drinking behaviour among alcoholics and other very high-volume consumers. In addition, the sample consists of individuals living relatively close to the border. For those living in the western and central regions, nobody lived more than an hour away by public transport or car from either the bridge connecting Sweden and Denmark or ferries connecting to Denmark or Germany. In the eastern regions, the distance is greater and it may take up to 90 minutes to get to the border.
A final limitation is that no control area was included in the study. However, the regional analysis indicates that there are regional differences of both distance to the border and, as we suggest, culture. This makes it clear that the impact of these policy changes was not general for Sweden, but differentiated between different geographical locations.
Conclusion
The fixed-effects analyses identified significant associations between consumer behaviours and alcohol consumption. The uptake of behaviours that developed because of the relaxed Swedish traveller allowances has contributed to an overall long-term increase in alcohol use and higher prevalence of harmful drinking within this general population study sample. About a third of the increase in the sample can be explained by the association between consumer behaviours and alcohol drinking levels, which indicates that the policy change has had a long-term impact on drinking trends.
Footnotes
Declaration of conflicting interests
The author declared no potential conflicts of interest with respect to the research, authorship, and/or publication of this article.
Funding
This study was funded through a research grant from the Swedish Research Council for Health, Working Life and Welfare (FORTE). (Grant / Award Number: ‘2013-01768’).