
Abstract
Using multiple sets of longitudinal panel data from three countries (Hong Kong, Thailand and Indonesia) and three product categories (ride sharing, food delivery and online shopping), this study analyses deviations from the expected market performance of standalone mobile apps – that is, apps not attached to any other existing offline or online brand. Specifically, drawing upon the Double Jeopardy, we identify and interpret deviations in the underlying relationship between the market size of each app (i.e. the percentage of active users vs. the total number of smartphone users in each market, or market penetration) and its level of stickiness (i.e. the average rate of app usage). We document that there is nothing inherently unique about the market performance of standalone apps, as they exhibit robust conformity to the Double Jeopardy benchmarks previously found in other digital and non-digital consumer markets. Namely, most standalone apps attain a level of stickiness proportional to their market size, and fairly similar to the other apps competing within the same category. Although there are some dissimilarities across the markets explored, there are more standalone apps performing ‘as expected’ than deviations and, when present, deviations can be easily explained. These outcomes provide several theoretical and practical contributions, elucidating that it is possible to leverage known empirical marketing laws to harness market opportunities for standalone apps.
Keywords
Introduction
Standalone apps are software downloadable to mobile devices, which can prominently convey a brand identity (Bellman et al., 2011) without a pre-existing offline or online brand (Stocchi et al., 2022). Unlike other types of apps, standalone apps yield significant opportunities for entrepreneurial ventures (Chaffey & Ellis-Chadwick, 2019). Hence, it is not surprising to see a proliferation of standalone apps in prominent mCommerce categories where direct-to-consumer and consumer-to-consumer business models can, at times, disrupt industries (Stocchi, 2022). In these markets, standalone apps need to counteract slim odds of survival caused by high rates of new entrants, imitative behaviours and ‘reverse engineering’ of value propositions (Lee & Davis, 2016). These challenges add to the general heightened competition and lowering technological standards superimposed by app stores (Bresnahan et al., 2015) on all types of apps. However, in the absence of a pre-existing brand and business identity to draw from, these conditions become particularly challenging for standalone apps, enhancing the importance of understanding and appraising their market performance.
Within existing mobile apps marketing literature, research examining downloads (Lin et al., 2022), ratings (Tafesse, 2023), rankings (Deng et al., 2023; Liu et al., 2012) and app revenues (Ye & Kankanhalli, 2020) is the primary avenue for insights concerning the understanding and appraising of apps’ market performance. These approaches carry significant risk of misinterpretation resulting from the underlying impact of algorithms and the unique nature of apps stores, making it hard to translate research findings into app’s optimisation strategies (Reyes-Menendez et al., 2020). Therefore, there is a pressing need for more empirical research directly examining the performance of standalone apps beyond the scope of app stores’ analytics (Stocchi et al., 2022). In particular, it is necessary to expand from the very few studies that have used panel data for the analysis of app market performance but lacked insights for standalone apps and lacked sufficient links with broader theories of user behaviour (e.g. Jung et al., 2014; Lee et al., 2021; Lee & Raghu, 2014).
To address the issues discussed so far, the present study uses a unique set of longitudinal panel data from three countries (Hong Kong, Thailand and Indonesia) and three categories of standalone apps (ride sharing, food delivery and online shopping) to benchmark current versus expected market performance (e.g. in terms of share of app users and the level of app stickiness, or frequency of use). We do so by drawing upon a key empirical generalisation (i.e. a recurring, expected and thus near ‘law-like’ pattern – see Bass, 1995) ascribing market performance and brand competition in a variety of offline and online consumption settings: the Double Jeopardy (McPhee, 1963).
The Double Jeopardy sets out simple yet very important expectations on market performance: more popular offerings typically attain better market performance and are ahead of competitors thanks to their market size, rather than heightened levels of brand loyalty or customer retention (e.g. Ehrenberg et al., 1990; Sharp et al., 2012). This pattern has been extensively documented in over five decades of marketing research (e.g. Ehrenberg et al., 2002; Graham et al., 2017; Greenacre et al., 2015) and, even though it is not exempt from criticism (Bongers & Hofmeyr, 2010), it can help understanding markets and brand performance using different types of consumer data like panel and scanner data, and cross-sectional survey data. Unlike research indirectly and directly appraising apps’ market performance, Double Jeopardy research is also not atheoretical, given that it is itself a theory of ‘mass behaviour’ (McPhee, 1963); and given the extensive ties with theories of buying and audience behaviour such as the NBD-Dirichlet model (Goodhardt et al., 1984). Therefore, in the present study, the Double Jeopardy is used to address issues and limitations of mobile apps marketing research, improving the direct understanding and appraisal of standalone apps’ market performance. Moreover, to enhance the theoretical and practical contributions made, instead of simply exploring the existence and strength of the Double Jeopardy in the market performance of standalone apps, this study focusses on identifying and interpreting exceptions or deviations from it.
Several past studies focussed on deviations from the Double Jeopardy to determine the feasibility of market strategies such as niche or change-of-pace brands (i.e. brands attaining greater and lower levels of brand loyalty for their market size, respectively – see Bhattacharya, 1997; Fader & Schmittlein, 1993; Kahn et al., 1988; Scriven et al., 2017; Stocchi et al., 2015). In this research, we follow a similar approach and unravel the heightened analytical scope resulting from focussing on deviations from the Double Jeopardy, bypassing the need to set-out a priori expectations. In this vein, we treat potential inconsistencies as informative outcomes, rather than disproves of assumptions (see also Pourazad et al., 2023).
The resulting contribution is threefold. First, we significantly expand mobile apps marketing literature, offering an alternative approach to examining app-store metrics (Deng et al., 2023; Lin et al., 2022; Tafesse, 2023) or app revenues (Ye & Kankanhalli, 2020), and providing novel insights for standalone apps based on panel data (expanding the work of Jung et al., 2014; Lee et al., 2021; Lee & Raghu, 2014). Second, the present research adds to the body of knowledge on the Double Jeopardy, reporting new findings for a consumption context previously overlooked and shedding light on the significant sameness (Bound & Ehrenberg, 1989) of a very competitive digital field. That is, we expand past research where the Double Jeopardy has been effectively used to understand digital settings, including eCommerce (e.g. Anesbury et al., 2016; Chowdhury et al., 2022), social media (Pourazad et al., 2023; Taneja, 2020) and online magazines (Tarkiainen et al., 2014). To this end, the present study is also significantly different to research that has documented the Double Jeopardy for branded mobile apps in relation to consumer perceptions or app image (Stocchi et al., 2017). Finally, this research yields practical value, as it is easily replicable by managers and stakeholders of the appscape (Kumar et al., 2018) to support the launch, promotion and growth of standalone apps.
Background
Mobile apps’ market performance research
Research on mobile apps approaches the understanding of market performance from different angles, most of which involve indirect appraisals. For example, there is extensive research that concentrates on specific stages of technology adoption or usage, embracing a consumer perspective to outline factors driving app use (see Stocchi et al., 2018, 2019, 2020). In these instances, app performance is associated with positive user responses (e.g. positive attitudes and predispositions), as well as behavioural variables like sustained use over time, or heightened frequency of use, often assumed to result from specific characteristics of an app. As Zolkepli et al. (2021) argue, the focus on the user perspective assists with drawing implications for User Experience (UX) factors, using established theoretical frameworks (e.g. technology acceptance, expectations confirmation and information system success models, among others). Indirect appraisal can also help evaluating apps’ market performance from a strategic brand management angle – for example, deriving measures of app customer-based equity (Stocchi et al., 2017, 2020), or of stock market performance (Boyd et al., 2019). However, the main limitation of indirect appraisals is the lack of real-world observations and the tendency to provide conclusions generalised for all apps, a certain type of apps or specific instances of individual apps; thus, omitting simultaneous evaluations of the performance of multiple apps, market-level statistics and market competition.
In contrast, research that focusses on direct evaluations of apps’ market performance is based on real market data. Recurrently app performance measures used for direct evaluations include app downloads (Lin et al., 2022), app ratings (Tafesse, 2023), app rankings (Deng et al., 2023; Liu et al., 2012) and app revenues (Ye & Kankanhalli, 2020). These direct assessments are often normalised and/or transformed to overcome issues linked to severe market fluctuations (Abulhaija et al., 2022) or to algorithms dampening representativeness of less popular apps (Tafesse, 2023); and to recreate proxies for market demand (Deng et al., 2023). There are also studies appraising apps’ market performance based on the number of active users per time-period (e.g. daily, or monthly active users – see Li et al., 2022) or app penetration (see Shaheer et al., 2020). Alternatively, it has been suggested to use measures typically employed to evaluate other digital technologies, such as engagement, impressions, click-through-rates, conversion rates or unique users. Ye and Kankanhalli (2020) recommend controlling for market-level factors like app size in kilobytes, app category and developer’s experience, whereas others suggest accounting for competition intensity (Lin et al., 2022) and app characteristics (Shaheer et al., 2020).
Irrespective of the measurement approach used and the obvious lack of consensus (Reyes-Menendez et al., 2020), research directly evaluating apps’ market performance can be rationalised into three broadly overlapping streams. First, research that explains and evaluates app market performance considering the uniqueness of app markets’ structure – for example, touching on the notion of ‘long-tail’ and market fragmentation, discussing demand-side drivers (e.g. low switching costs) and supply-side drivers (e.g. infinite assortments; see Tafesse, 2023). Within this line of enquiry, the discourse often turns to the significant limits to market survival that originate from the business model inherent to app stores, which imposes profit sharing and limits differentiation (in price or technology), adding to very low entry barriers (see Cuadrado & Dueñas, 2012; Martin et al., 2017; Oh & Min, 2015; Roma & Ragaglia, 2016; Wang et al., 2016). Next, there is research documenting the effects, on apps’ market performance, of alternative market strategies for apps. For instance, Shaheer et al. (2020) explored apps’ market performance from the angle of internationalisation (i.e. strategies harvesting location advantages vs. within-country demand heterogeneity), and the implications of targeting paying users and light/infrequent users (both reported to be of hinderance to growth). Lin et al. (2022) investigated the effectiveness of app updating frequency, which they distinguished between exploitative (efficiency-driven) and explorative (market-discovery oriented), finding the former more likely to yield short-term positive impacts on market performance. Ye and Kankanhalli (2020) discussed the implications of service innovation on apps’ market performance, using a service-dominant-logic perspective. Similarly, Tafesse (2023) delineates between strategies chasing popularity versus pursuing niche apps with strong hedonic focus, over and above store optimisation efforts. There are also studies that link the analysis of apps’ market performance to monetisation strategies, estimating the odds of market survival for free versus paid apps (see Jung et al., 2014; Lee et al., 2021; Lee & Raghu, 2014), and for freemium apps (Deng et al., 2023). Finally, there are several studies exploring apps’ market performance from the perspective of app developers, focussing on the identification of strategic guidelines for managing apps’ portfolios. For example, there is research evaluating the impact on portfolio performance of: i) product line diversification (Roma & Vasi, 2019); ii) portfolio size and quality (Li et al., 2022); iii) economies of scale and specialisation (Tavalaei & Cennamo, 2021); and iv) switching between paid versus free strategies (Lee et al., 2021).
Although superior to indirect evaluations of apps’ market performance, direct analyses still share a series of limitations that the present study wishes to address. Above all, most studies explore only one type apps at the time (e.g. travel apps, gaming apps, newly launched apps), with limits in timeframes of the analyses and geographical locations considered. Additionally, the market performance appraisals presented are still, at times, supplemented with user surveys, requiring a certain degree of inference when establishing links between observed apps’ key-performance-indicators (KPIs) and the causes of these results. There is also a tendency to manipulate market statistics with complex techniques like parametric hazard models with random effects (see Shaheer et al., 2020), further heightening the level of approximation (Abulhaija et al., 2022) resulting from trying to manage endogenous bias (Deng et al., 2023). Finally, most of the studies mentioned so far lack clear ties with relevant theories explaining drivers of usage and the resulting implications in terms of aggregate market performance or dynamics. Combined, these limitations make most existing findings somewhat hard to implement/use strategically in the real world to optimise apps’ performance (Reyes-Menendez et al., 2020).
More closely related to the aims of the present research, a final recurring limitation is an absence of insights at individual app level, which is particularly hindering for standalone apps, since their market performance and survival primarily (if not solely) cannot benefit from any attached, pre-existing offline or online brand. As we explain next, an alternative approach could be akin to what is routinely performed in consumer package goods or for other branded offerings like subscription services, whereby longitudinal analyses of panel or scanner data simultaneously provide market (or category) level insights as well as diagnostic information of individual brand performance. In such instances, individual brand performance is typically benchmarked against expectations (e.g. theoretical estimated derived from suitably defined mathematical models or econometric simulations), identifying and interpreting deviations from known underlying patterns of market results.
Double Jeopardy and its value to understand standalone apps’ market performance
In digital consumptions contexts, there is over a decade of research drawing on the Double Jeopardy to understand and appraise brand performance and market dynamics in online retailing or eCommerce – see Dawes and Nenycz-Thiel (2014), Anesbury et al. (2016), Trinh et al. (2017), Naami et al. (2022), Chowdhury et al. (2022), Klepek and Kvíčala (2022) and Higuet and Remaud (2023). These studies often focussed on exploring the extent to which online settings resemble offline counterparts, revealing crucial drivers of online market dynamics such as the spurious allocation of loyalty across multiple online brands. Moreover, authors such as Klepek and Kvíčala (2022) recognised tied the Double Jeopardy to the evaluation of the impact of low entrance barriers, heightened competitive settings and exceptionally homogenous product offerings or portfolios. There are also studies that used the Double Jeopardy to explain market dynamics in rather unique digital settings such as online magazines (Tarkiainen et al., 2014); online betting (Calvosa, 2016); social media (Pourazad et al., 2023; Taneja, 2020); and telecommunications (Naami et al., 2022).
Besides providing a wealth of empirical benchmarks, scholarly work on the Double Jeopardy provides a further crucial benefit well suited to the aims of the present study. Specifically, there is significant scope for deriving novel theoretical and practical implications from concentrating on exceptions or deviations from this pattern (Ehrenberg et al., 1990, 2004) to learn more about specific market dynamics such as customer loyalty and retention (Meyer-Waarden & Benavent, 2006; Stern & Hammond, 2004; Sharp & Sharp, 1997; Wright et al., 1998); or to interpret anomalies and departures from underlying trends for individual offerings such as brands competing within a product category (Scriven et al., 2017). At times, analyses of deviations from the Double Jeopardy have been used to understand specific consumption contexts (Anesbury, Greenacre, et al., 2018, 2021; Anesbury, Nguyen, & Bogomolova, 2018) and, more closely linked to the goals of the present study, to ascertaining the feasibility of specific market strategies (Bhattacharya, 1997; Fader & Schmittlein, 1993; Kahn et al., 1988; Scriven & Bound, 2004; Scriven et al., 2017; Stocchi et al., 2015) including: (i) niche brands – that is, brands with deficit market penetration but combined with higher-than-expected brand loyalty for their size in the market, or heightened brand image; and (ii) change-of-pace brands – that is, brands with higher market penetration but combined with deficit brand loyalty for their size in the market. These brands are typically known by many consumers but evoke a rather ‘narrow’ image.
Interestingly, research exploring the Double Jeopardy in online settings has seldom concentrated on deviations (with Taneja, 2020 and Klepek & Kvíčala, 2022 being an exception, due to discussing niche brands). Moreover, there is only one prior study that has examined niche apps and there seems to be no prior research that has considered change-of-pace apps. In more detail, Tafesse (2023) compared market strategies for apps that might be directed to grow popularity (becoming large, widely used apps) as compared to creating specialised niche apps with strong hedonic focus. They report that niche apps are feasible if maintained through frequent major updates over and above store optimisation and monetisation efforts (e.g. app price). This finding is partially aligned to Stocchi et al. (2017), which reported that the strength of the underlying link between the market penetration and the image of an app (as inferred from consumer perceptions) is greater for unique apps with no free alternatives. However, contrary to Tafesse (2023), Stocchi et al. (2017) connected this occurrence with the app being offered to consumers at a price, acting as a cue for uniqueness and superior value for the app. This conclusion was derived from cross-sectional survey data, lacking comparisons of multi time periods or of different app categories. Accordingly, the following research questions remain and are addressed in the present study:
Methods
Data and measures
As Table 1 shows, this study is based on a set of longitudinal panel data covering three countries (Hong Kong, Thailand and Indonesia) and three categories of standalone apps (ride sharing, food delivery and online shopping). The dataset originates from ‘Eureka’s Omni Market & Financial Intelligence’ enterprise software, a dashboard powered by Artificial Intelligence (AI) providing business intelligence on smartphone usage based on an opt-in panel of smartphone users covering different countries and mobile categories (Eureka, 2024). The unique nature of this dataset allowed a series of robustness checks directly linked to our two research questions, and enhancing the generalisability of the conclusions drawn.
Dataset Description.
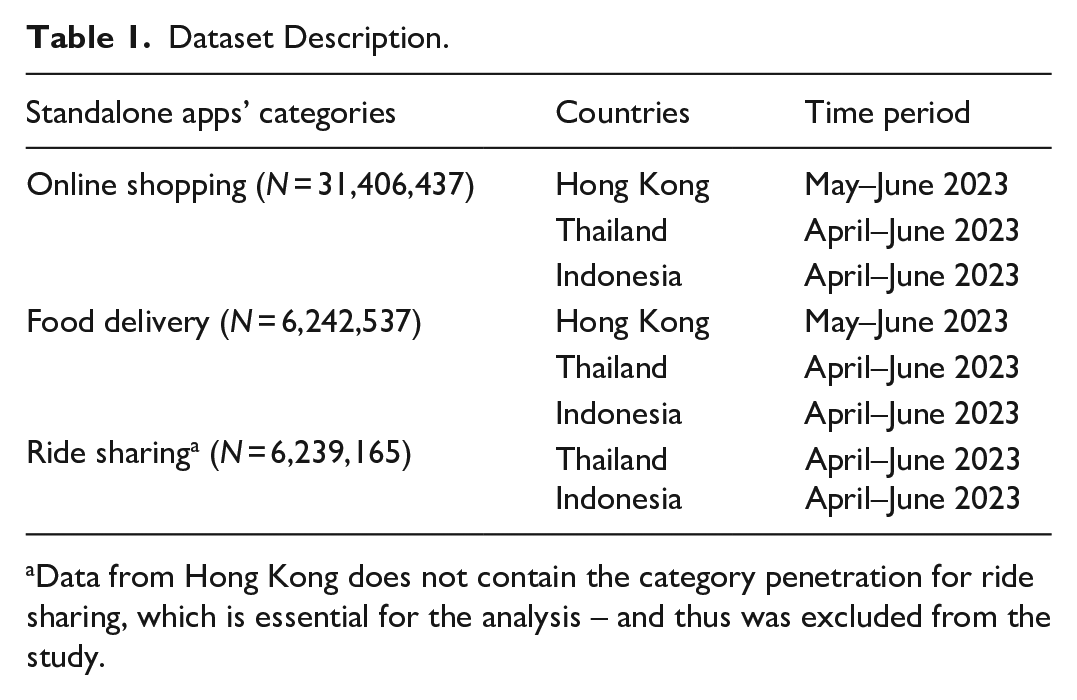
Data from Hong Kong does not contain the category penetration for ride sharing, which is essential for the analysis – and thus was excluded from the study.
The two key measures of interest explored to identify and explain deviations from the Double Jeopardy were: (i) the market size or penetration of each standalone app, calculated as the percentage of active users versus the total number of smartphone users in each market (adapted from Shaheer et al., 2020; Stocchi et al., 2017); and (ii) app stickiness, defined as the visit or usage frequency of the app and can thus be inferred to reflect the users’ intention for app re-use (see Yoon et al., 2022; Zhou et al., 2024).
Empirical tests
To address the specific research questions introduced earlier, this study replicates and expands the methods used in previous studies (e.g. Ehrenberg et al., 1990; Kahn et al., 1988;, 2004; Meyer-Waarden & Benavent, 2006; Scriven et al., 2017; Stocchi et al., 2015), which entailed identifying and explaining deviations from the Double Jeopardy using the NBD-Dirichlet model (Ehrenberg et al., 2004; Goodhardt et al., 1984). In more detail, the established two-step analytical process involves: (i) deriving observed measures at the category and individual brand level from the data at hand; and (ii) estimating the corresponding theoretical values for the same measures, through fitting the statistical distributions that form the NBD-Dirichlet model to the observed data – for example, using automated software solutions like the Dirichlet software by Kearns (2010). We reproduced these two steps using the measures described above in each of the four categories, for each individual standalone app and all time periods.
For consistency and ease of interpretation, conclusions are focussed on the correlation between the observed and theoretical values of the measures of interest, and on the relative percentage differences of the observed values against the theoretical values. Accordingly, we highlight instances of mean absolute percentage error (MAPE) equal to 15% or higher, as reported in previous research (e.g. Driesener et al., 2017; Stocchi et al., 2015; Uncles et al., 2010; Wright et al., 2002). We report MAPE scores greater than 15% for both app penetration and app stickiness, as instances of deviations from the Double Jeopardy inferable from the NBD-Dirichlet model.
Results
Table 2 portrays the average results across all time periods, delineated by country and app category, reported at the level of individual standalone apps across the two measures of interest. Out of the 64 comparisons of observed and expected market performance (32 apps in total, times the two measures), there are 28 deviations from the Double Jeopardy, which is approximately 43% of all evaluations of standalone apps’ performance run. This proportion of deviations falls within the range reported in Scriven et al. (2017), especially for small share brands, as most of the standalone apps are.
Aggregated Results (Averages Across Time Periods).
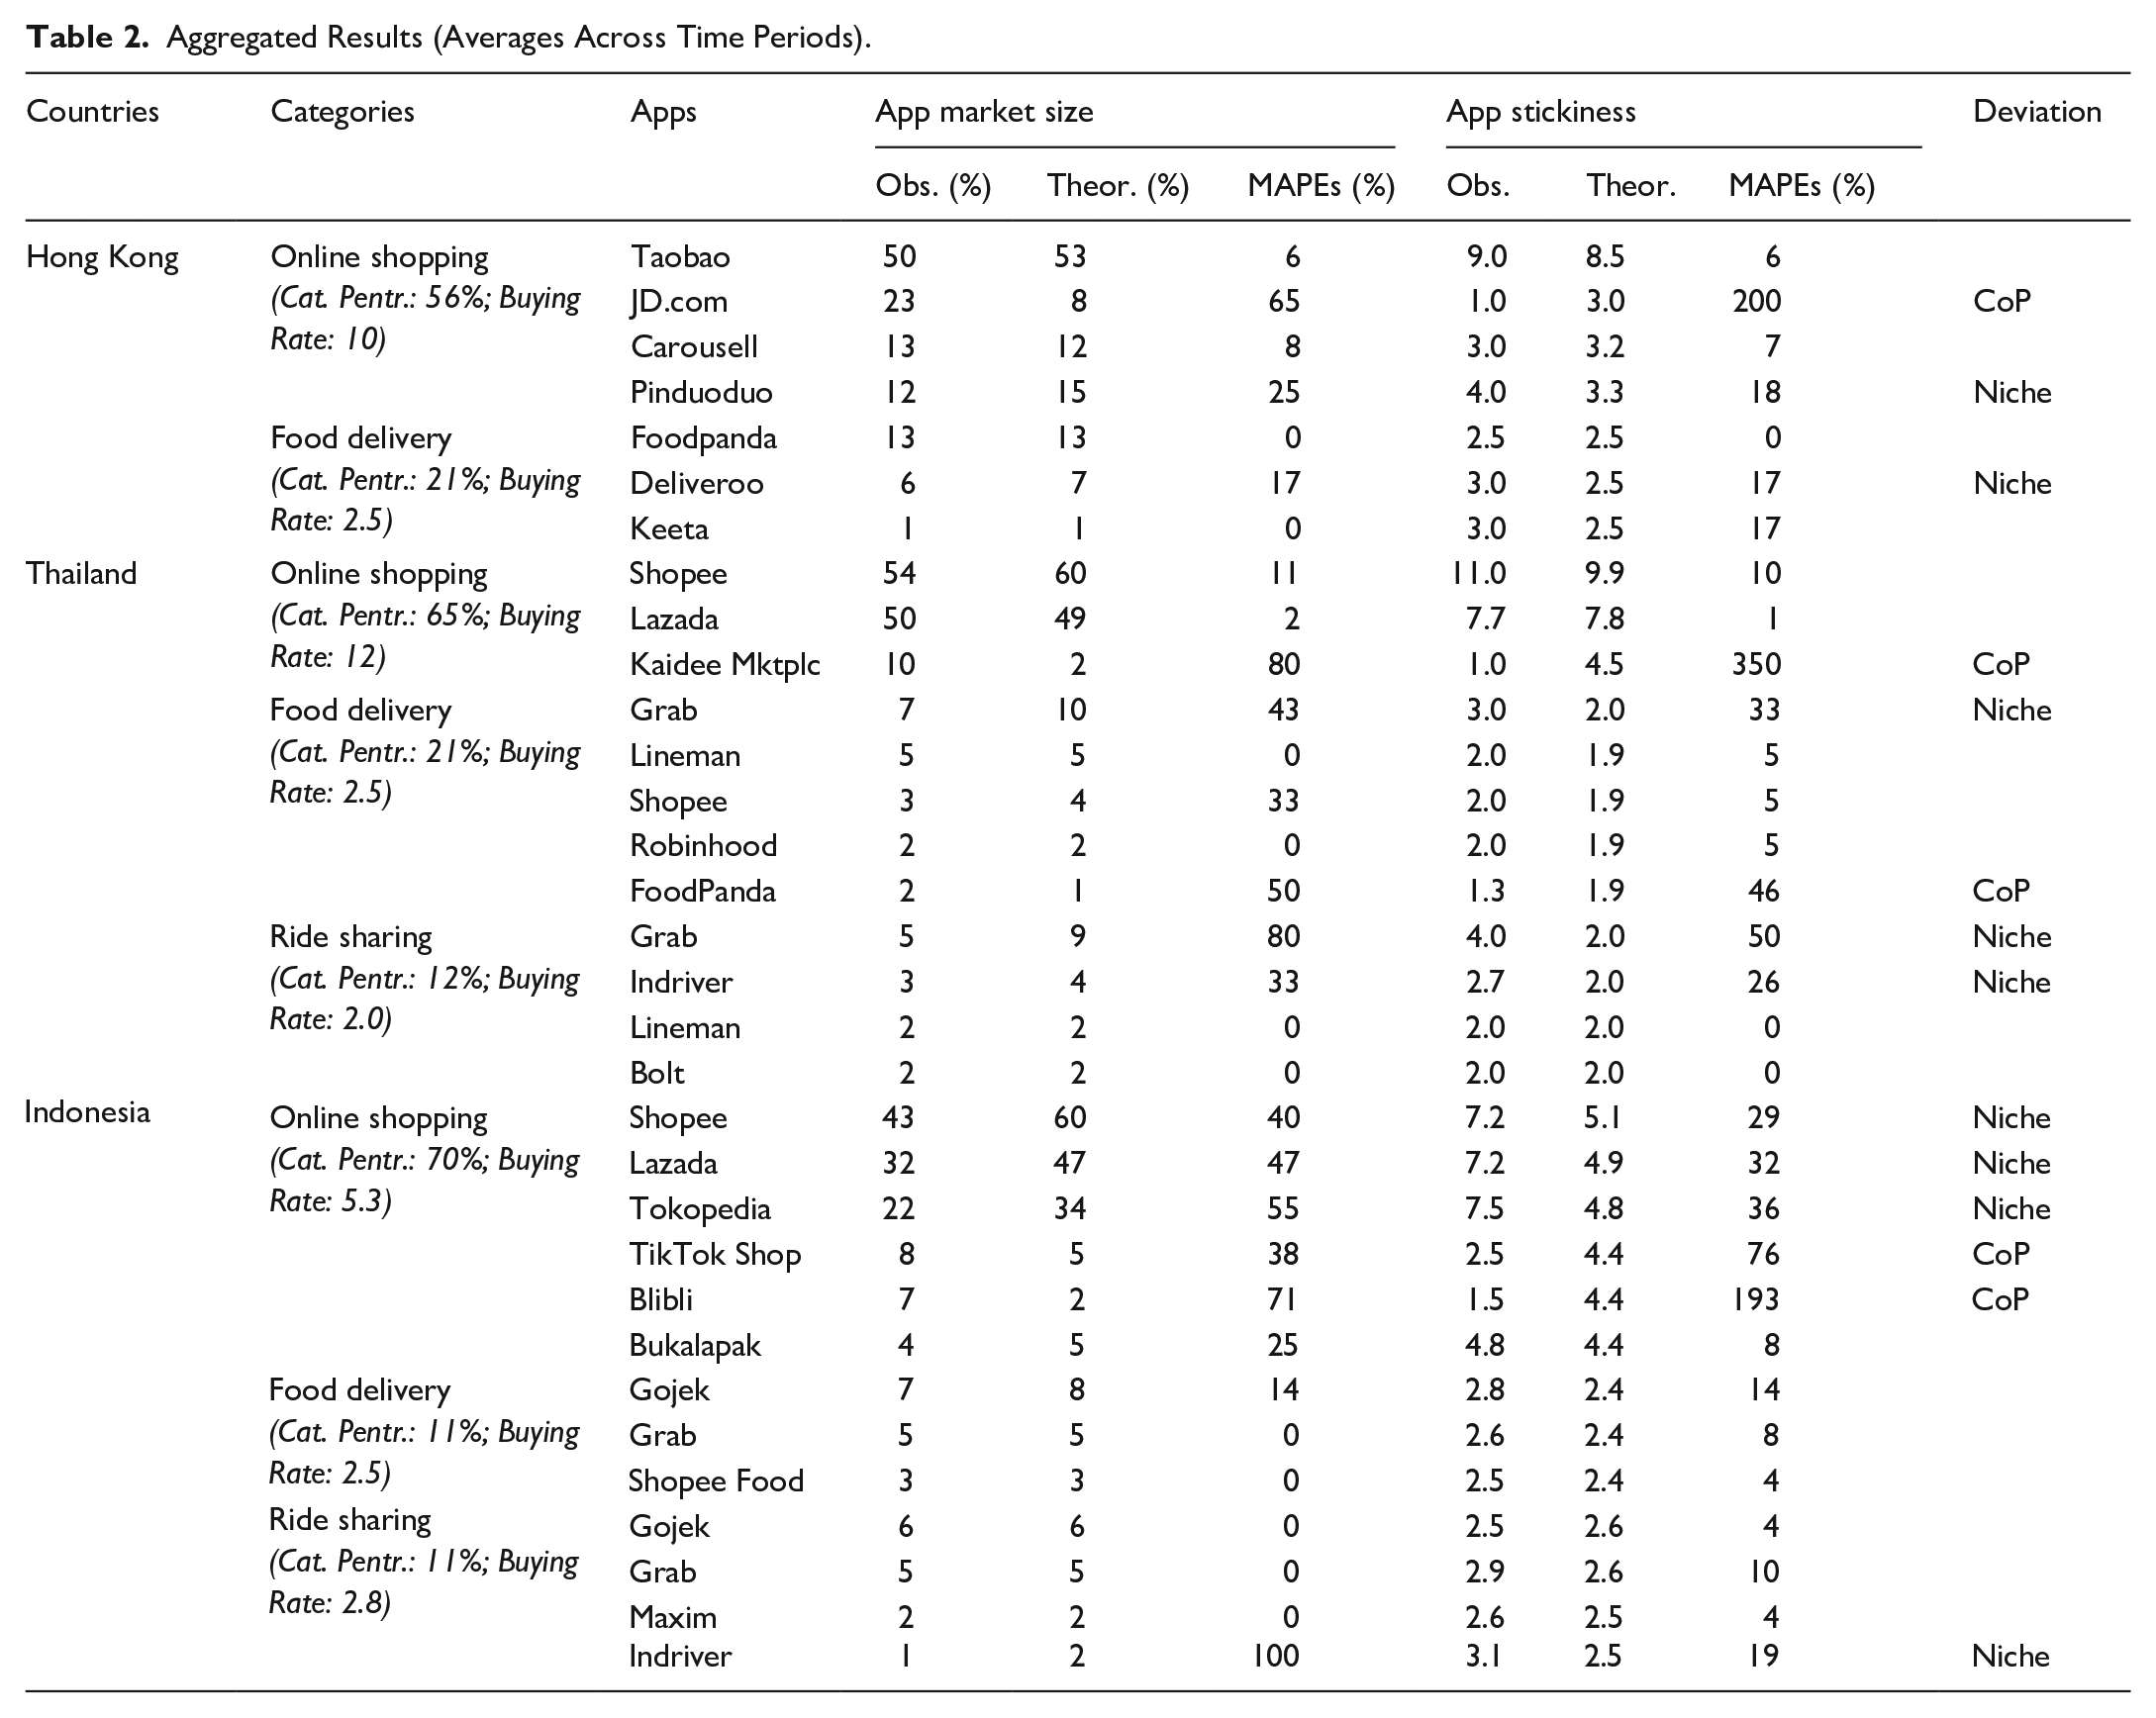
Adding more detail to the answer to RQ1, comparing the observed and theoretical market size figures and stickiness, the two sets of metrics show high positive correlations. The correlation between the observed and theoretical market size figures is .96 – a result consistent within each country examined (i.e. .93 for Hong Kong; .99 for Thailand; and .91 for Indonesia). The correlation between the observed and theoretical app stickiness figures is also highly positive and equal to .85 across all countries (i.e. .93 for Hong Kong; .90 for Thailand; and .70 for Indonesia, where the slightly lower correlation reflected the relatively higher incidence of deviations in that market). Hence, overall, the extent to which we observe deviations is proportionally less than the instances of standalone apps performing ‘as expected’. Furthermore, the incidence of the deviations’ types observed is in line with past research (e.g. Scriven et al., 2017) and plausibly explainable based on established research findings or market and/or app-specific factors. In more detail, 9 out of the 14 deviation pairings across the three countries are niche apps – that is, standalone apps with lower than expected market size, but higher than expected stickiness. These are apps likely to have embraced market strategies focussed on frequent major updates, optimisation and monetisation efforts (e.g. app price; Tafesse, 2023) – an approach that could logically explain the heightened stickiness observed in our data at the expense of market coverage. Five of the remaining deviating standalone apps are change-of-pace apps, showing a deficit in stickiness likely to be caused by variety seeking (Higuet & Remaud, 2023). These results address RQ2 too, providing a picture of consistency in deviations from the expectations of standalone mobile apps’ performance set-out by the Double Jeopardy across countries, categories and subsequent time periods.
Nonetheless, shedding more light on both RQ1 and RQ2, we now discuss specific deviations within each market and category. Overall, when deviations emerged, these were consistent for both market performance measures for the same standalone app, and again easily explainable, as follows. In Hong Kong, there are two standalone apps deviating from the Double Jeopardy in the online shopping category: JD.com and Pinduoduo. JD.com is a change-of-pace standalone app with greater than expected market size, but a deficit in app stickiness, which may be related to the range of products available this app offers compared to competitors (Bhattacharya, 1997; Kahn et al., 1988; Scriven et al., 2017) being exceptionally homogenous (Klepek & Kvíčala, 2022); or to the app being well-known to many people for a few specific brand attributes (Stocchi et al., 2015). In contrast, Pinduoduo is a niche standalone app with lower than expected market size but higher than expected stickiness. In this instance, the deficit in market size could be associated by factors hindering adoption across the whole market (e.g. app store platform or extra requirements for app usage and adoption; Fader & Schmittlein, 1993; Scriven et al., 2017); or having a specialist focus (Tafesse, 2023; Taneja, 2020). For the same country, there is also one standalone app deviating from Double Jeopardy in the food delivery category: Deliveroo. This discrepancy could be easily attributed to limited availability of the app within the country (Scriven et al., 2017), combined with the expansion and growth of direct competitors. Indeed, at the point of data capture and analysis, having only been launched in May 2023 rival app Keeta was initially limited to one district in Kowloon, but rapidly become available nationally; and Deliveroo will exit the Hong Kong market in April 2025 (The Standard, 2025).
In Thailand, there are two deviations in the food delivery category (Grab, a niche app, and FoodPanda, a change-of-pace standalone app); two in the ride sharing categories (Grab and Indriver, both niche standalone apps); and one deviation in the online shopping market (Kaidee, a change-of-pace standalone app). Supplementary analysis of the Thai apps’ markets suggests possible cross-category usage for standalone apps by the same brands, thus leading to explaining these results in terms of app portfolio strategies focussed on attaining economies of scale at the expense of specialisation (Li et al., 2022; Tavalaei & Cennamo, 2021). For example, Shopee, Lineman and Grab also provide services in other categories such as eCommerce, online messaging and are evidently ‘one-stop-shop’ quick-service apps – characteristics likely to limit users’ ability to see these apps as ‘unique’ (Stocchi et al., 2015).
In Indonesia, deviations are confined to the online shopping category, where all apps revealed a performance departing from the Double Jeopardy expectations, as evident from three niche standalone apps (Shopee, Lazada and Tokopedia) and two change-of-pace standalone apps (TikTok Shop and Blibli). In this instance, the three largest standalone apps all have market size deficits, which may be caused by a lack of new user recruitment and a focus on current users to increase popularity (Tafesse, 2023). At the same time, TikTok Shop and Blibli have a deficit in app stickiness likely caused by limited product or category range compared to competitors, and the lack of motivation to return to the app for the users’ next purchase occasion (Kahn et al., 1988; Scriven et al., 2017). It is also important to note that in Indonesia consumers in the capital city, Jakarta, are known to behave relatively differently to those living in the vast regional areas of the country. Moreover, promotional practices such as ‘monthly double days’ (e.g. 03/03 or 04/04) might have led consumers to intensify app usage around promotions, causing the brands to exhibit change-of-pace characteristics.
Discussion
This study has documented that the market performance of standalone apps across three categories (online shopping, food delivery and ride sharing) in three distinct geographical locations largely follows the Double Jeopardy, with a positive trade-off between market penetration and app stickiness. This is supported by the strong positive correlations between the observed and theoretical market performance measures overall, and within each country. It is also supported by MAPEs scores calculated for individual standalone apps to further compare their expected and revealed market performance. In more detail, deviations from the Double Jeopardy for standalone apps are rarer than instances of these apps performing ‘as expected’ – that is, revealing a strong underlying proportional link between the app market size and the level of app stickiness (usage rate) it attains. The deviations are also easily explained and consistent with past results from studies exploring deviations from the Double Jeopardy in offline markets, and with empirical research focussing on the detection of this pattern in online markets. The resulting contributions to theory and practice are as follows.
Theoretical implications
The primary contribution of the present study lies in the significant expansion of existing knowledge concerning the evaluation of mobile apps’ market performance, previously suffering from several limitations, including the lack of ties with relevant theories of consumption. Specifically, this study proposed and showcased an alternative perspective to cumbersome direct evaluations of mobile analytics linked to app stores, which typically call for complex analytical techniques to reduce biases and seldom yield generalisable conclusions for app optimisation. As shown, the use of the Double Jeopardy (e.g. Ehrenberg et al., 2002; McPhee, 1963) and, more importantly, the focus on detecting and interpreting deviations from it with simple inferential techniques, provide numerous advantages. Above all, the proposed approach provides a range of established theoretical principles and empirical guidelines from past research, including studies conducted in online retailing and eCommerce (e.g. Anesbury et al., 2016; Dawes & Nenycz-Thiel, 2014; Higuet & Remaud, 2023; Klepek & Kvíčala, 2022; Trinh et al., 2017). The ability to draw from the ties with widely accepted theories of buying and audience behaviour (the NBD-Dirichlet model) overcomes the issues of indirect evaluations of apps’ market performance based on panel or survey data, previously lacking in-depth evaluations of standalone apps across multiple time periods and markets. It also adds to the very few studies that have discussed niche brands in digital settings (e.g. Tafesse, 2023), clarifying reasons for the existence of niche standalone apps; and for previously undisclosed change-of-pace standalone apps – noting that Stocchi et al. (2017) mentioned this second type of apps, but in relation to user perceptions rather than app performance metrics directly linked to usage and stickiness.
Besides advancing mobile apps’ marketing research focussed on the analysis of standalone apps’ market performance, this study makes a secondary contribution to marketing literature on the Double Jeopardy deviations (e.g. Bhattacharya, 1997; Fader & Schmittlein, 1993; Kahn et al., 1988; Scriven et al., 2017). To this end, this research provided evidence of significant sameness (Bound & Ehrenberg, 1989) and a new set of empirically derived conclusions and benchmarks for a previously unexplored digital context. It showcased the new knowledge that can arise when combining what we know from: (i) studies exploring market regularities in online markets, which have overlooked the analyses of exceptions from said regularities and offered limited coverage of mobile domains; and (ii) studies focussing on exceptions from said regularities in offline markets, formerly lacking appraisals of deviations in online consumption contexts.
Managerial implications
Along with the theoretical implications listed above, the results of this research also provide guidelines for developers and managers of standalone apps on how to grow their app. The clear applicability and evidence of the Double Jeopardy on the various categories apps and markets provide the foundation for applying typical brand growth tactics to standalone apps. In more detail, it appears that to optimise market performance marketing activities aimed at encouraging users to maintain and increase standalone app usage should be supplemented with campaigns to recruit new users. Users of standalone apps are likely to ‘shuffle’ through apps that satisfy the same underlying category-linked needs. As a result of this market dynamic, for niche standalone apps, higher than expected stickiness should not be considered an ideal result. Rather, it should be considered an indication of the app missing out on users (or market penetration) compared to its competitors, perhaps due to failing to attract new users and excessively focussing on increasing usage rates amongst the existing users. For developers, this scenario signals potential issues in the app functionality and/or app layout (as immediately inferable by users upon download), potentially discouraging uptake. It could also signal scenarios whereby the standalone app has heightened responsive design connotations and becomes primarily geared towards the retention and engagement of existing users – for example, via strong emphasis on personalisation of the user experience via user data and usage logs as well as continuous subscription. Conversely, change of pace standalone apps need to provide comparatively similar offerings and services to competitors to maintain their market size, addressing deficits in stickiness. In this instance, the implications for app developers include a strategic focus on app updates and upgrades that are in line with features offered by the competitors; for example, introducing widely appealing features that can divert usage from other apps within the repertoire such as gamification and instant rewards.
The practical implications discussed so far also imply that, more broadly, the strategic management of standalone apps should include panel-derived benchmarking of market size or app penetration and app stickiness directly inferred from usage behaviour. Indeed, the availability of such insights is becoming wider through bespoke dashboards such as the Eureka tool that underpinned this research. Besides its flexible use by all stakeholders of the appscape, a further important advantage of this approach lies in the assurance that business insights and strategies typically associated with more traditional categories also apply to standalone apps markets and can be used to steer market success and growth.
Conclusions, limitations and future research directions
Using a unique set of longitudinal panel data covering three countries and three categories of standalone mobile apps, the present research explored expected dynamics in how these apps perform, deriving a set of clear and ease-to-use implications for theory and practice. The most compelling outcome of this study concerns discovering that there is nothing inherently unique or different for standalone apps, which implies there is a wealth of additional knowledge to draw from to inform market survival and growth strategies.
Nonetheless, as with any research, there are a few limitations that should be taken into consideration and turned into future studies. First, it is important to replicate and extend the same analytical approach using longer time periods to infer trends in the markets and detect fluctuations in apps’ performance (e.g. before and after major changes to the app itself, newer entrants or market exits, as well as any major disruption in the market). Due to data limitation, the analysis focussed on the average over 2 months of data for Hong Kong and three months of data for Thailand and Indonesia. Observing granular data over longer period provide opportunities to experiments, A/B testing on app design and functionality and the addressing of user feedback. It would be also interesting to explore other categories of standalone apps in markets where there is a greater impact of hedonic drivers of app usage and stickiness, such as health and fitness apps, or work and productivity apps. In the same vein, replications and extensions in standalone apps’ markets where there is a majority of paid or freemium apps would be valuable, as well as explorations of geographical contexts where the uptake of mobile technologies is less advanced. Finally, there is a wealth of additional empirically derived theories that could be tested beyond the Double Jeopardy, including some that are theoretically linked to it such as the Duplication of Purchase (e.g. Ehrenberg et al., 1990, 2004).
Footnotes
Declaration of conflicting interests
The author(s) declared no potential conflicts of interest with respect to the research, authorship, and/or publication of this article.
Funding
The author(s) received no financial support for the research, authorship, and/or publication of this article.