
Abstract
Understanding music listening behaviour benefits those seeking to market music to the general population and those choosing music to feature in retail environments or advertising. In particular, understanding how consumers consume different genres is important. There are, however, two conflicting bodies of knowledge. One finds segments of music listeners who differ on music genre preferences, while the other finds (media and brand) user profiles are more similar than different. Our research provides additional evidence by surveying over 1,000 representative respondents in the United States regarding their listening behaviour of 13 music genres. The proportion of listeners of each genre is compared with the average profile for all genres using those segmentation variables previously found to cause differing genre preferences (e.g. age and income). While some minor differences exist, notably that younger listeners prefer electronica/dance, the overall results show genre user profiles are more similar than different. The theoretical implication is that using approaches designed to find minor differences will do precisely that and magnify them. At the same time, for those marketing music in the industry, achieving a broader market coverage may be more effective in expanding their listener bases than focussing on narrower segments.
Introduction
On average, over half of Americans listen to music daily, and more than two-thirds of those are aged 18 to 34 years (Statista, 2019). The sources of music are vast, with over 41 million Compact Discs (CDs) sold in 2021 (Bloom, 2022), over 18 million vinyl records sold every year since 2019 (Vinyl, 2022) and cassette tapes recently sold over 200,000 (Bomey, 2022). But physical music is relatively small compared to the revenue of $25 billion a year from music streaming apps, half solely within the United States (Curry, 2022). Yet, little is known about music listener demographics, directly impacting an artist’s growth potential and stakeholder profitability.
The origins of music are embedded in the history of humanity itself, with varying theories proffered as to why it exists. These include an evolutionary theory, the ‘putting the baby down’ hypothesis (Falk, 2004a, 2004b). In this instance, it is suggested that parents would use humming or singing to signal to their baby that they are still in proximity while using their hands for other activities (e.g. cooking or cleaning; Schäfer et al., 2013). Escapism theory suggests that music provides a method to soothe and relieve human anxiety surrounding death and life’s transitionary nature (Dissanayake, 2009; Frith, 1996), while other theories suggest predatory avoidance or social cohesion. The latter suggests fewer demographic differences due to the reinforcement of the in-group and out-group affiliation principle, as in social identity theory.
There are two conflicting bodies of knowledge about the similarities and differences of music genre preferences. The first is based on the premise that music listening research broadly investigates psychological and physiological functions, consumption contexts and environments, device and personal music library management (e.g. Krause et al., 2015; Lim et al., 2015; Schäfer et al., 2013) and self-representation (Larsen et al., 2009). Research focussed on examining differences in listener bases for genres does so from a psychological perspective. Further, prior research indicates demographic preferences (Greenberg et al., 2016; Rentfrow & Gosling, 2003). For example, to a greater extent, Rock listeners are Caucasian, middle-class and male, while Country listeners are more likely to be older, less educated and fewer ethnic minorities (Savage, 2006).
The second and contrasting research stream is based on the established marketing literature. Media use literature finds that the user bases of television programs (Barwise & Ehrenberg, 1988), television channels (Sharp et al., 2009), radio (Nelson-Field & Riebe, 2011; Winchester & Lees, 2013) and newspapers and magazines (Nelson-Field & Riebe, 2011; Winchester & Lees, 2016) are remarkably similar across a wide range of demographic and psychographic variables. These results are also found in the user profiles of brands in many consumer goods categories (e.g. Z. Anesbury et al., 2017; Hammond et al., 1996) such that it can be considered a ‘law’ of marketing. Overall, their consistent finding is that there are many similarities and few differences in the users of varying media.
Our research aims to reconcile the stark contrast between the music literature highlighting demographic differences (Greenberg et al., 2016; Rentfrow & Gosling, 2003; Savage, 2006) and the marketing literature suggesting these differences smaller and managerially insignificant (Z. W. Anesbury, Davies, et al., 2022; Hammond et al., 1996; Uncles et al., 2012). The results of such would have implications for those choosing music to feature in retail environments or advertising and those seeking to market music. If demographic differences in music preferences exist, then music competes in a segmented market, with music genres attracting unique listeners and potentially acting as sub-markets. If music preference demographics do not exist, music competes in one mass unsegmented market, with music genres all appealing to and competing for the same broad listener base – essentially the population at large (or at least that part of it that listens to music). Therefore, this study aims to challenge the established research on music genre demographic and psychographic differences based on the broader marketing findings.
Background and research questions
Competing-brand user profiles (BUPs)
Segmentation is claimed to be the key to marketing success as brands appeal to distinct types of customers, predominately demographic (Kotler, 1991; Lilien et al., 1992; Smith, 1956). Providing solutions to identifying local farmer’s market segments (McNeill & Hale, 2016), understanding politically salient household segments regarding climate change policy (Morrison et al., 2013), outlining the user segments of a sharing economy (Sands et al., 2020) or even segments of female shoppers within the intimate apparel category (Tsarenko & Lo, 2017). Yet, research demonstrates brands sell to similar demographic customers (e.g. Hammond et al., 1996; Uncles et al., 2012), and these seldom change (Z. Anesbury et al., 2017).
The seminal user profile analyses were conducted within consumer goods research, finding few brands appealed to a distinct demographic group (Hammond et al., 1996). The finding was successfully replicated in examining additional consumer goods (Z. Anesbury, Greenacre, et al., 2018; Z. Anesbury, Nguyen and Bogomolova, 2018; Singh et al., 2008; Sjostrom et al., 2014; Tanusondjaja et al., 2015), durables, financial and services (Kennedy et al., 2000), music outlets, high-street and supermarket retailers (Kennedy & Ehrenberg, 2001a), banking products (Lees et al., 2016; Lees & Winchester, 2014). Longitudinal research demonstrates that user profiles seldom differ and seldom change (Z. Anesbury et al., 2017; Uncles et al., 2012). The results have been consistently found across many countries and categories – are still being advanced by empirical generalisation research (Sharp et al., 2017).
The brand user profile research applies to various media. Early television audience research examined demographic (e.g. age) and usage variables (i.e. light, medium, heavy viewers) to determine whether different people watch different program types (e.g. light entertainment, sport; Barwise & Ehrenberg, 1988). Program types differed little in demographic and usage audience composition. Similarly, television channels attract homogenous audiences (Sharp et al., 2009), radio in Australia and New Zealand (Nelson-Field & Riebe, 2011; Winchester & Lees, 2013) and Newspapers and print magazines in Ireland (Nelson-Field & Riebe, 2011; Winchester & Lees, 2016).
Deviations to the brand user profiles
Generally, when deviations from the Law of Brand User Profiles occur, most are negligible or unsubstantial. There are a few exceptions. Media research shows few deviations – sports channels attract more men (65% vs. the avg. 45%; Barwise & Ehrenberg, 1988), Hispanic-language channels have small but overwhelmingly Spanish-speaking viewers (Sharp et al., 2009) and Rock radio stations have more males (52% vs. the avg. 41%; Winchester & Lees, 2013).
For consumer goods categories, only 2% of brand comparisons are greater than 10 percentage points (e.g. Hammond et al., 1996; Kennedy et al., 2000; Uncles et al., 2012). Some sportswear brands over or underperformed among social class groups, for example, 39% of Adidas buyers were lower income compared with 33% on average (Dawes, 2009). When comparing luxury clothing brands, it was found that the user profiles are more similar than different, but 11% to 13% of all comparisons had deviations over 10 pp (Patrick et al., 2016). Recent research has found that less than one in five sub-brands skewed, and when they did, it was more likely to happen for smaller brands rather than bigger brands ( Z. W.Anesbury, Bellman, et al., 2022).
Why the law of BUP might not apply to music listening
Brand user profiles may not apply to music listening because music genres have different psychological and emotional functions that are not substitutable. Existing research finds that demographic or psychographic variables segment music preferences or listening (e.g. Rentfrow & Gosling, 2003; Savage, 2006). Demographic differences related to differences in listening include age, gender, ethnicity, social class, health, relationships, living arrangements, beliefs, crime, media usage and leisure time (Christenson & Peterson, 1988; Davies et al., 2022; Holbrook & Schindler, 1989; North & Hargreaves, 2007a, 2007b, 2007c; Savage, 2006). Rock listeners are young, male, ethnically white, middle-class and managerial workers or technicians (not professionals; Savage, 2006). Listeners of R&B, Hip-Hop/Rap and DJ-based music are the least likely to drive, attributable to lower ages (North & Hargreaves, 2007a). Personality has been found to relate to musical preferences (Rentfrow & Gosling, 2003).
However, these studies often use highly restricted choices and generally take sociological or psychological perspectives, intending to understand the meaning of music in people’s lives, leading to the use of approaches designed to find and amplify differences. For example, respondents are confined to select one of 35 music genres that best describe their current music taste (North & Hargreaves, 2007a, 2007b, 2007c), which is problematic as respondents can enjoy more than one genre. Alternative research uses similar techniques, limiting people to selecting only one ‘favourite’ genre, using survey data from the Cultural Capital and Social Exclusion (CCSE) project, which only includes eight genres and eight musical works, and seeking to specifically design their studies to ‘get at key distinctions in musical taste’ (Savage, 2006). When studies are specifically designed to seek out and find differences, feature so few works and draw substantial conclusions, it becomes even more problematic that they also find that the shapes of the taste cultures change over time (Adorno & Simpson, 1941; North & Hargreaves, 2007c). Is this changing tastes, or simply random variation in sample or method? Researchers have even correlated negative personality traits to genres they dislike (e.g. Hansen & Hansen, 1990). In summary, the prior research does not account for the polygamous nature of music genre consumption.
The current research takes a different view, seeking to understand how you might profit from being a musician (i.e. how one sells music) rather than what music means and to whom. The marketing literature has converged on several key ‘laws’ of marketing (Z. W. Anesbury, Davies, et al., 2022; Sharp et al., 2024), including the assertion that Brand User Profiles Seldom Differ (Sharp, 2010). In the context of music, this would imply that to become a large ‘brand’, a musician should seek to engage with as broad a cross-section of the population as possible to maximise listening and that appealing to a small (or niche) segment of potential listeners is a recipe to remain small. If groups of people do show differential preferences for genres of music, they must be in group sizes large enough to address through advertising. However, broad demographic segments can be targeted.
Central limit theorem and uses and gratification theory
Two competing theories are relevant to the overarching user profiles research. Central Limit Theorem (CLT) would support the idea that they are similar (Lynn, 2019), while the Uses and Gratification Theory (U&G) would suggest they differ (Webster, 2005). First, core to the Central Limit Theorem is people’s behaviour tends to be concentrated with few people behaving differently (Gordon, 2006; Trinh et al., 2014). Prior CLT research has examined the similarities and differences between information encoding, activation and retrieval and those of the Dirichlet model (Stocchi, 2014), often linked to user profile examinations (Anesbury, Greenacre, et al., 2018; Anesbury, Nguyen, & Bogomolova, 2018). Relating to sample sizes and the sample’s normally distributed means, from a music genre perspective, this translates to most respondents’ music listening being contained to a few genres, resulting in similar user profiles. While CLT allows for music genres having differing listener profiles, these are likely the less popular genres.
Second, the Uses and Gratification (U&G) Theory (Webster, 2005) would suggest that user profiles should differ, given that people use media for personal uses, motives and self-perceived needs (Rosengren et al., 1985). Recently, U&G was used to examine consumer behaviour for food delivery apps in India (Ray et al., 2019), microblogs in China (Liu et al., 2020), media-enabled voter relationships with political entities in Australia (Abid & Harrigan, 2020) and digital content marketing for Chinese tourists (Bu et al., 2021). The underlying assumption of U&G is that individuals engage with certain stimuli to satisfy specific pleasures (Abid & Harrigan, 2020; Liu et al., 2020; Ruggiero, 2000). Music may not be substitutable due to its unique ability to fulfil needs. Music can fulfil different needs, such as background noise, facilitating social interaction, helping manage moods or concentrating on a task (Lonsdale & North, 2011; North et al., 2000; Rentfrow & Gosling, 2006; Tarrant et al., 2000). These other needs are likely related to various music styles, which may not be evenly distributed among the population, so music listener profiles may differ. This leads to our research question:
Addressing the research question helps understand consumption behaviour, predict preferences and empirically resolve conflicting academic research regarding music genre listeners.
Method
Data
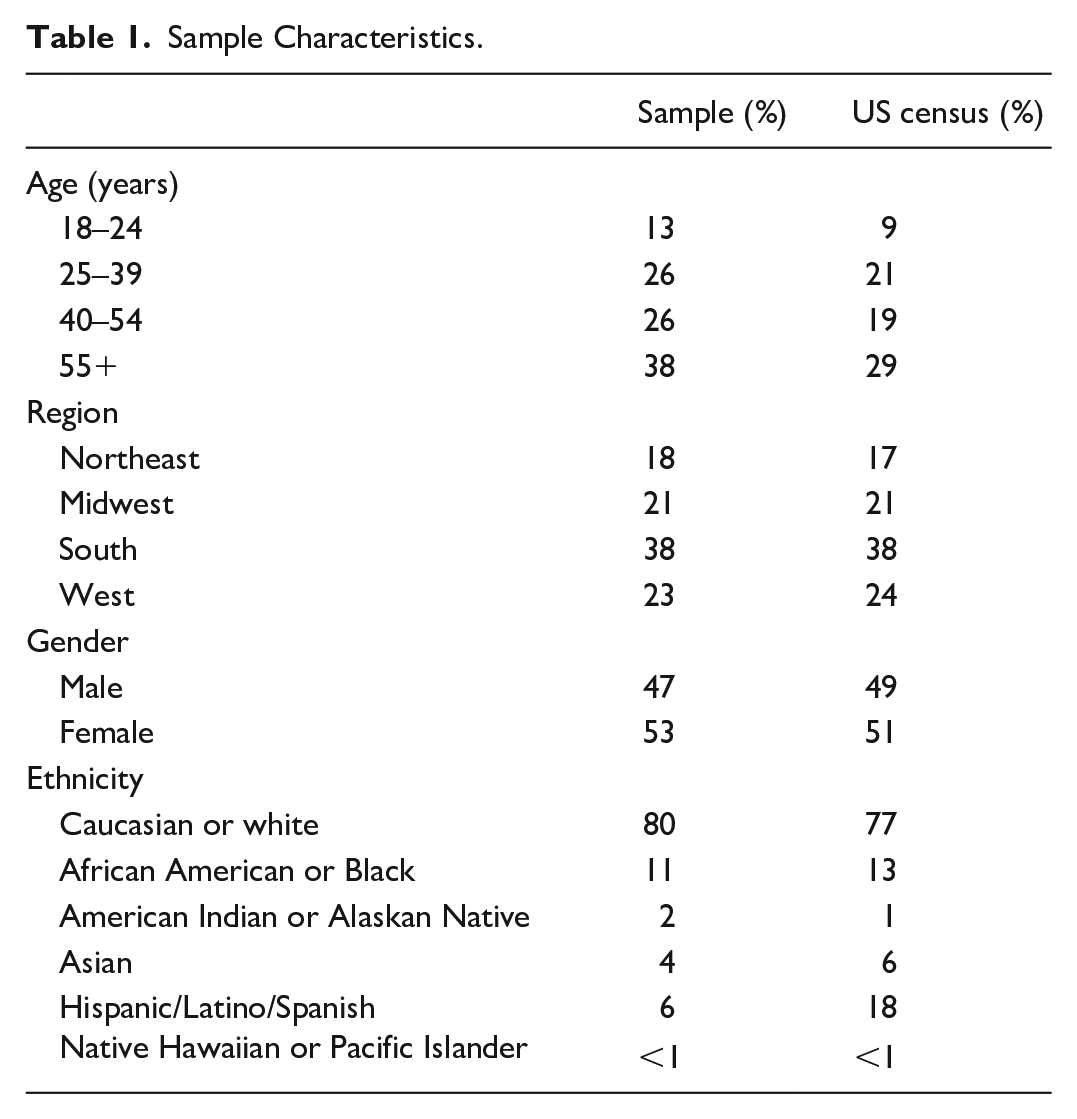
Our study uses online survey data collected by a commercial panel provider that was screened for respondents over 18 years of age in the United States and music listeners (more specifically, those who had listened to music in the previous week). Our sample was appropriate for this research, with data collected in February 2019. Table 1 outlines how the 1,036 respondents were a nationally representative United States sample by age, gender, race and location (U.S. Census Bureau, 2018; U.S. Census Bureau Population Division, 2017, 2019). Of some note, 53% of the sample was female versus 51% of the population, and 80% were Caucasian compared to 77%.
Sample Characteristics.
We asked respondents which genres of music they had listened to in the last week. We presented them with a prompted list of 13 genres – with an ‘other (please specify)’ and ‘none of these’ options – to allow for non-listed genres and to avoid false attribution or guessing. Previous research has used the genre as the basis of analysis when examining the relationships between demographics or psychographic variables and music listening preferences (e.g. Peterson & Kern, 1996; Rentfrow & Gosling, 2003; Savage, 2006). There is, however, no universal genre classification system (Davies et al., 2022). For example, the number of genres analysed varies from 9 (Savage, 2006) to 14 (Rentfrow & Gosling, 2003) or 19 genres (North & Hargreaves, 2007a), and Apple Music has 44 top-level genres, while Spotify is claimed to have over 6,000 genres (Daniels & McGhee, 2023). This study uses the Short Test of Musical Preferences (STOMP) genre list (Rentfrow & Gosling, 2003), which contains four musical dimensions – reflective and complex (Classical, Jazz, Blues and Folk), intense and rebellious (Alternative, Rock and Heavy Metal), upbeat and conventional (Country, Pop, Religious and Soundtracks) and energetic and rhythmic (Rap/Hip-Hop, Soul/Funk and Electronica/Dance). These genres are shown to have 97% familiarity levels with respondents and account for almost 90% of their music collections (Rentfrow & Gosling, 2003, 2006). Further, these genres align well with Apple Music and Spotify, which account for 73% of all music streaming subscribers (Musical Pursuits, 2024). Our final list uses the classifications of Rock, Pop, Country, Hip-Hop/Rap, R&B/Soul/Funk, Classical, Metal, Soundtracks, Indie/Alternative, Jazz, Blues, Electronica/Dance, Folk and World. However, we excluded World from the analysis as less than 100 respondents had listened to the genre.
While personality differences are not meaningfully targetable, even in online contexts (Taneja, 2020), we have included the BFI-10 item scale to measure the Big Five personality traits (Rammstedt & John, 2007). We also used a motivation for listening scale (Oliver & Raney, 2011) to investigate eudaimonic and hedonic listening differences. For each of these five personality traits and two motivations, we classified those scoring more than one standard deviation above the mean as being ‘high’, and one standard deviation below the mean as being ‘low’, and between these two levels as being ‘mid’ on each trait.
Method
Our method is in line with previous brand user profile research (Hammond et al., 1996; Kennedy & Ehrenberg, 2001a), and we compare each music genre’s profile to the average profile of the music category. To understand the degree of similarity between genres, the deviations of each genre’s profile from the average of all profiles (i.e. the category profile) are used. Table 2 shows that the Rock genre listener profile has 1% fewer listeners earning less than $29,999 a year compared to the average genre (25% vs. 26%); however, it has 3 pp more listeners earning $30 to −$49,999 (22% vs. 19%).
Genre Listener Profiles by Annual Income.
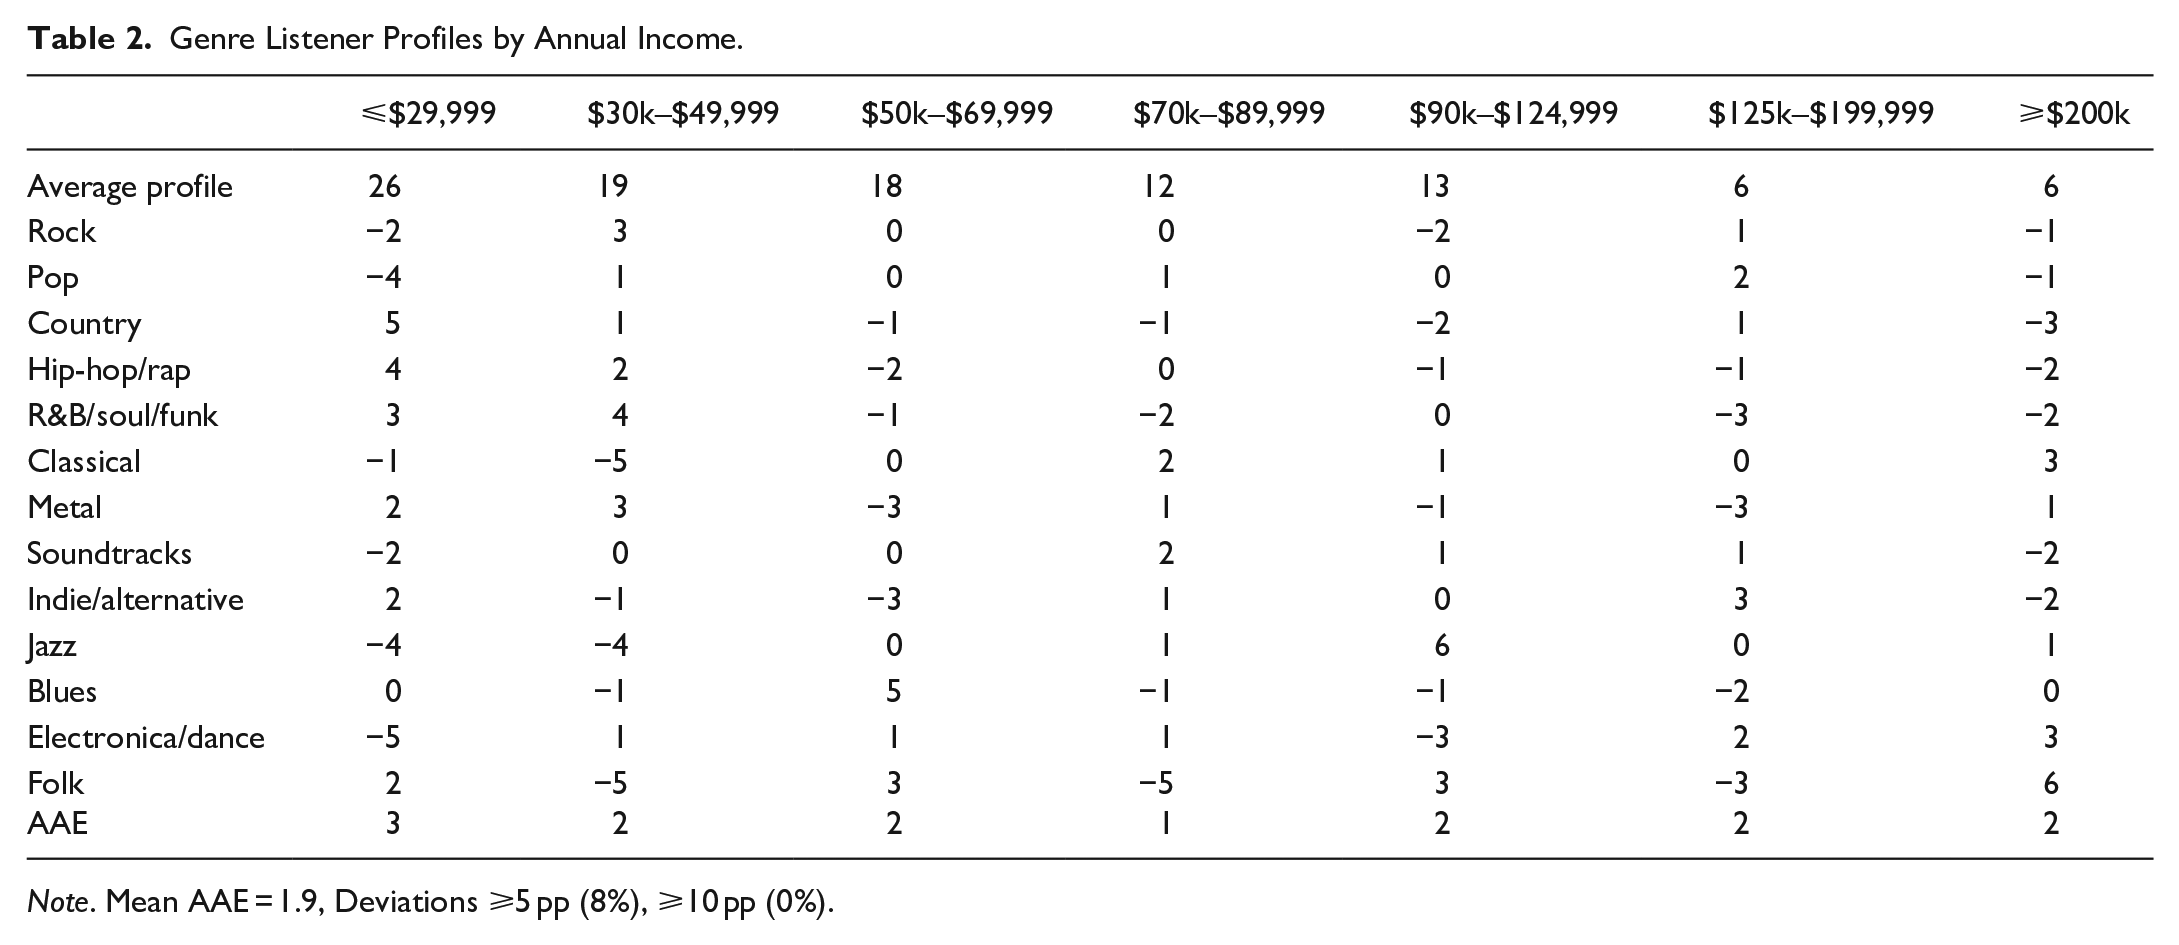
Note. Mean AAE = 1.9, Deviations ⩾5 pp (8%), ⩾10 pp (0%).
Noteworthy differences are identified by considering them in the context of the threshold at which individual deviations are considered managerially significant. Brand user-profile studies use deviations of 5, 6 or 10 pp (e.g. Z. Anesbury et al., 2017; Kennedy & Ehrenberg, 2001a; Nelson-Field & Riebe, 2011). In line with Kennedy and Ehrenberg (2001a), we highlight deviations above 5 pp but consider deviations ⩾10 percentage points to be managerially significant (indicated by green or red). Further, a weakness of AAEs is that data at the tails can impact the average value by minimising the size of some larger differences (Nelson-Field & Riebe, 2011). So, the percentage of deviations that exceed 10- and 5-pp are reported.
Table 2 shows that the mean average absolute error is just 1.9 percentage points. Further, seven deviations greater than 5 percentage points of the total 91 (i.e. 8% of all comparisons) and zero above the 10 pp (i.e. the benchmark deemed managerially significant). To rigorously test whether the differences in percentage points are statistically significant, we ran a post-hoc Chi-squire test for adjusted residual values generated using the Cross-Table analysis function in SPSS (version 26; Dunn, 1961). The music genres with statistically significant differences are flagged with an asterisk (*) in the tables. There were no differences for Table 2 (annual income); however, for Table A1 (age), we find that Hip-Hop/Rap unsurprisingly has significantly more listeners among the 18 to 24 and 25 to 39 years age groups, but fewer older listeners enjoy it. While Electronica/Dance is notably more appealing to the 25 to 39 years age group, it is the genre with the fewest representation amongst the oldest audience. Conversely, Country music is more likely to be favoured by 55-year-old listeners but is less attractive to the listeners in the second youngest cohort. The process is systematically repeated for age, gender, household size, ethnicity, employment status and education level for all genres.
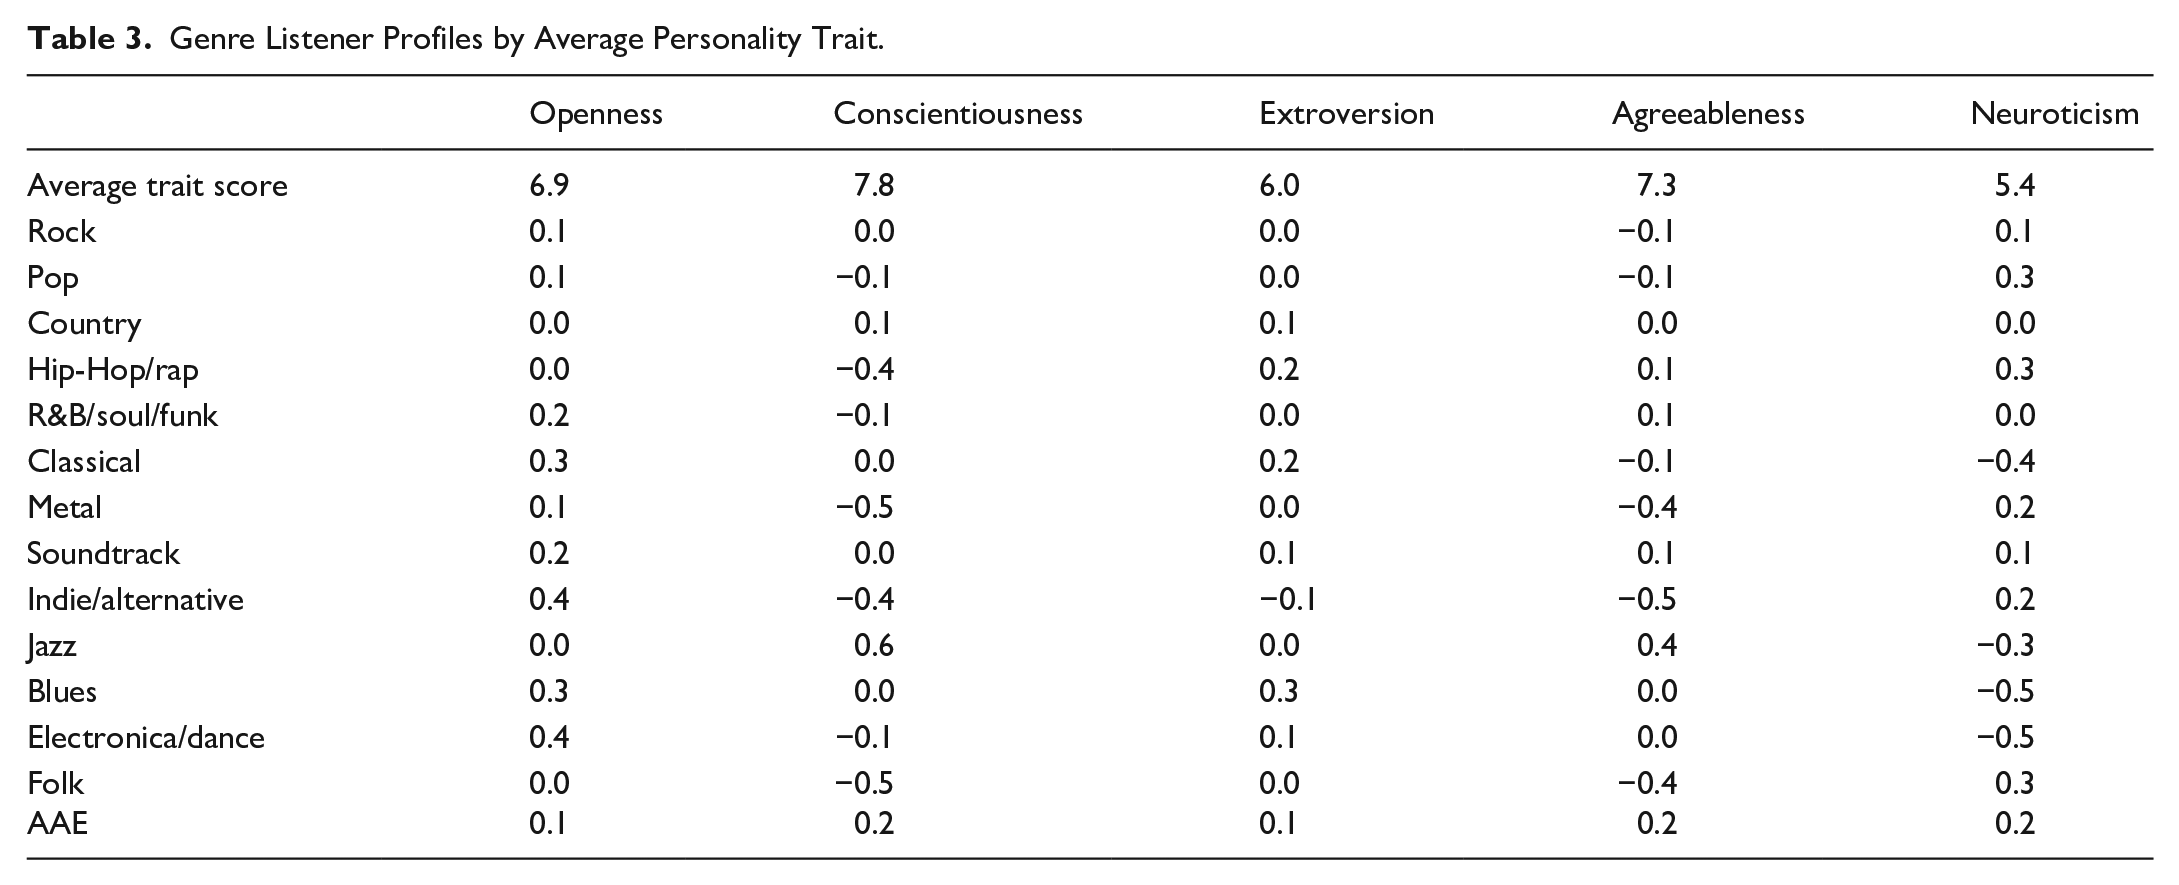
When examining psychological segments, given the interest in the relationship between personality and genre (e.g. Greenberg et al., 2016), we use the widely accepted and validated Big Five Inventory-10 (BFI-10; Rammstedt, 2007). The BFI-10 is a shorter 10-item version of the larger Big Five 44-item Inventory (Rammstedt & John, 2007). Although the BFI-10 comprises less than 25% of the full BFI-44 scale, the 10-item scale has a predictive ability nearly equivalent to the 44-item scale and is relatively superior from a respondent fatigue point of view. It requires a minimum amount of participant time, which curtails respondent fatigue and boredom (Thalmayer et al., 2011). Table 3 details the [lack of] differences between genres by average personality trait score. One potential explanation for such low deviations is likely due to the use of raw scale scores. Therefore, in line with other psychological research dealing with scales, raw scores were standardised (Fischer & Milfont, 2010; Kim & Ferree, 1981) Personality trait scores were then compared separately in three groups by the number of genre listeners that scored high (⩾1 standard deviation), mid (⩾−1 ⩽ 1 standard deviation) and low (⩽−1 standard deviation) for each personality trait (see Appendix Tables A8–A9).
Genre Listener Profiles by Average Personality Trait.
Results
To answer the research question regarding music genre listener profiles, we examine the differences between the overall profile (i.e. the representative sample of the US population) and the profile of each genre.
For age, the most substantial differences are among the 55+-year-old age group listening to previously profiled ‘old people’ genres (North & Hargreaves, 2007a). Table A1 in the Appendix shows that Country, Classical, Jazz, Blues and Folk are 10 to 14 percentage points above the average genre profile. Notably, fewer 55+-year-old listeners appear in the listening bases of Hip-Hop/Rap, Metal, Indie/Alternative and Electronica/Dance (deviations up to −21). On the flip side, far more listeners between the 25 and 39 years age group listen to Electronica/Dance (+22 percentage points) and Hip-Hop/Rap (+10 percentage points). However, this age group is less represented in the Country’s listening base (−10 percentage points). Overall, 46% of all comparisons (deviations) are 5 percentage points or more, 21% are 10 percentage points or more and the mean AAE is 6.2. The results suggest that different genres may attract a different aged listener, consistent with radio station audience research (Nelson-Field & Riebe, 2011; Winchester & Lees, 2013).
When examining differences in genre by ethnicity, Table A2 in the Appendix documents that listeners of R&B/Soul/Funk and hip-hop/rap are less likely to be Caucasian or White listeners and more likely African American or Black listeners. In contrast, Rock, Country and Folk are genres that are listened to by more Caucasian or White listeners than the profile. Overall, 29% of deviations are 5 pp or more, 10% are 10 percentage points or more and the mean AAE is 4.4, indicating that although the ethnicity of genre listeners is more similar than different, in line with previous research (Savage, 2006), specific genres appeal disproportionally to certain ethnicities.
Table A3 in the Appendix shows one substantial deviation in education: Metal listeners, who are underrepresented holders of an Associate or Bachelor’s College degree (−10 percentage points). Few deviations were larger than 5 percentage points (18%), and zero were above 10 percentage points. The mean AAE was a low 3.1, indicating a slight tendency to skew. We see no support for the notion that Country listeners are less educated (Savage, 2006).
For employment status, Table A4 in the Appendix, Country appeals more to listeners who are homemakers, currently unemployed or retired (+10 pp). Listeners of Folk are less represented in the full-time employment status group (−10 pp). Country and Folk differences appear to reflect the differences also observed for age – as percentage points seen in Table A1 (Appendix). One potential explanation is that older listeners (55+) are more likely to be retired. Listeners of Electronica/Dance are underrepresented in the homemakers, currently unemployed or retired employment status group (−11 percentage points). The result may also reflect age-related differences as more 25- to 39-year-olds listened to Electronica/Dance listeners (+22 percentage points). The young age group are unlikely to be homemakers or retired. Overall, employment status listener characteristics differ minimally between genres, as 27% of deviations are above 5 percentage points, with just 4% above 10 percentage points, and mean AAEs are 3.4.
Overall, more differences were found for gender (Table A5 – Appendix), with 69% of deviations being larger than 5 percentage points but only 8% being larger than 10 percentage points. Our results indicate that Metal and Blues skew towards male listeners (+10 percentage points), while Pop skews towards female listeners (+10 percentage points). However, the AAEs are still low, considering the claimed ‘consensus’ (Greenberg et al., 2016) that there are large differences in the listeners of different genres (e.g. Greenberg et al., 2016; Rentfrow & Gosling, 2003).
We also investigated music preferences using two common psychological variables (i.e. personality and motivations). Given the potential for different motivations for listening to music to lead to different genre choices, we investigated hedonic (i.e. pleasure-based) and eudemonic (i.e. deeper and more meaningful) motivations for listening, using the best-practice scale previously applied to film (Oliver & Raney, 2011). Table A6 in the Appendix shows listeners classified as high in a Big Five personality trait (⩾1 standard deviation). Larger differences are present using these standardised scale scores than the raw scores (Table 3). Notably, more high-trait respondents in Openness were Folk listeners than the average genre (+9 percentage points). None of these deviations in Table A6, however, are significant. Another larger difference occurs for listeners high in Conscientiousness, who are less present in the listening base of Metal (−8 percentage points). In the Appendix, Table A7 shows the only deviation is that listeners of the Blues are 10 percentage points more likely to be low in the Neuroticism trait, and this difference is significant. Table A8 in the Appendix shows no deviations above 10 percentage points for either medium-trait personality trait respondents or for the varying motivations for listening to music. There were two significant deviations here, with both Jazz and Blues listeners having a positive skew to Extroversion. Regarding motivations, Table A9 in the Appendix indicates that only 8% of deviations are greater than 5 pp and zero greater than 10 percentage points – for either eudaimonic or hedonic characteristics. None of these deviations were significant.
Overall, for personality or motivation psychographic variables, 17% of deviations are 5 pp or more, and 0.4% are 10 percentage points or more, which may indicate personality trait or motivation differences in listeners of different genres. Further, given that AAE ranges from 2.2 to 3.0, any differences are negligible and unlikely to be actionable in practice. Very few of these deviations were significant.
Discussion
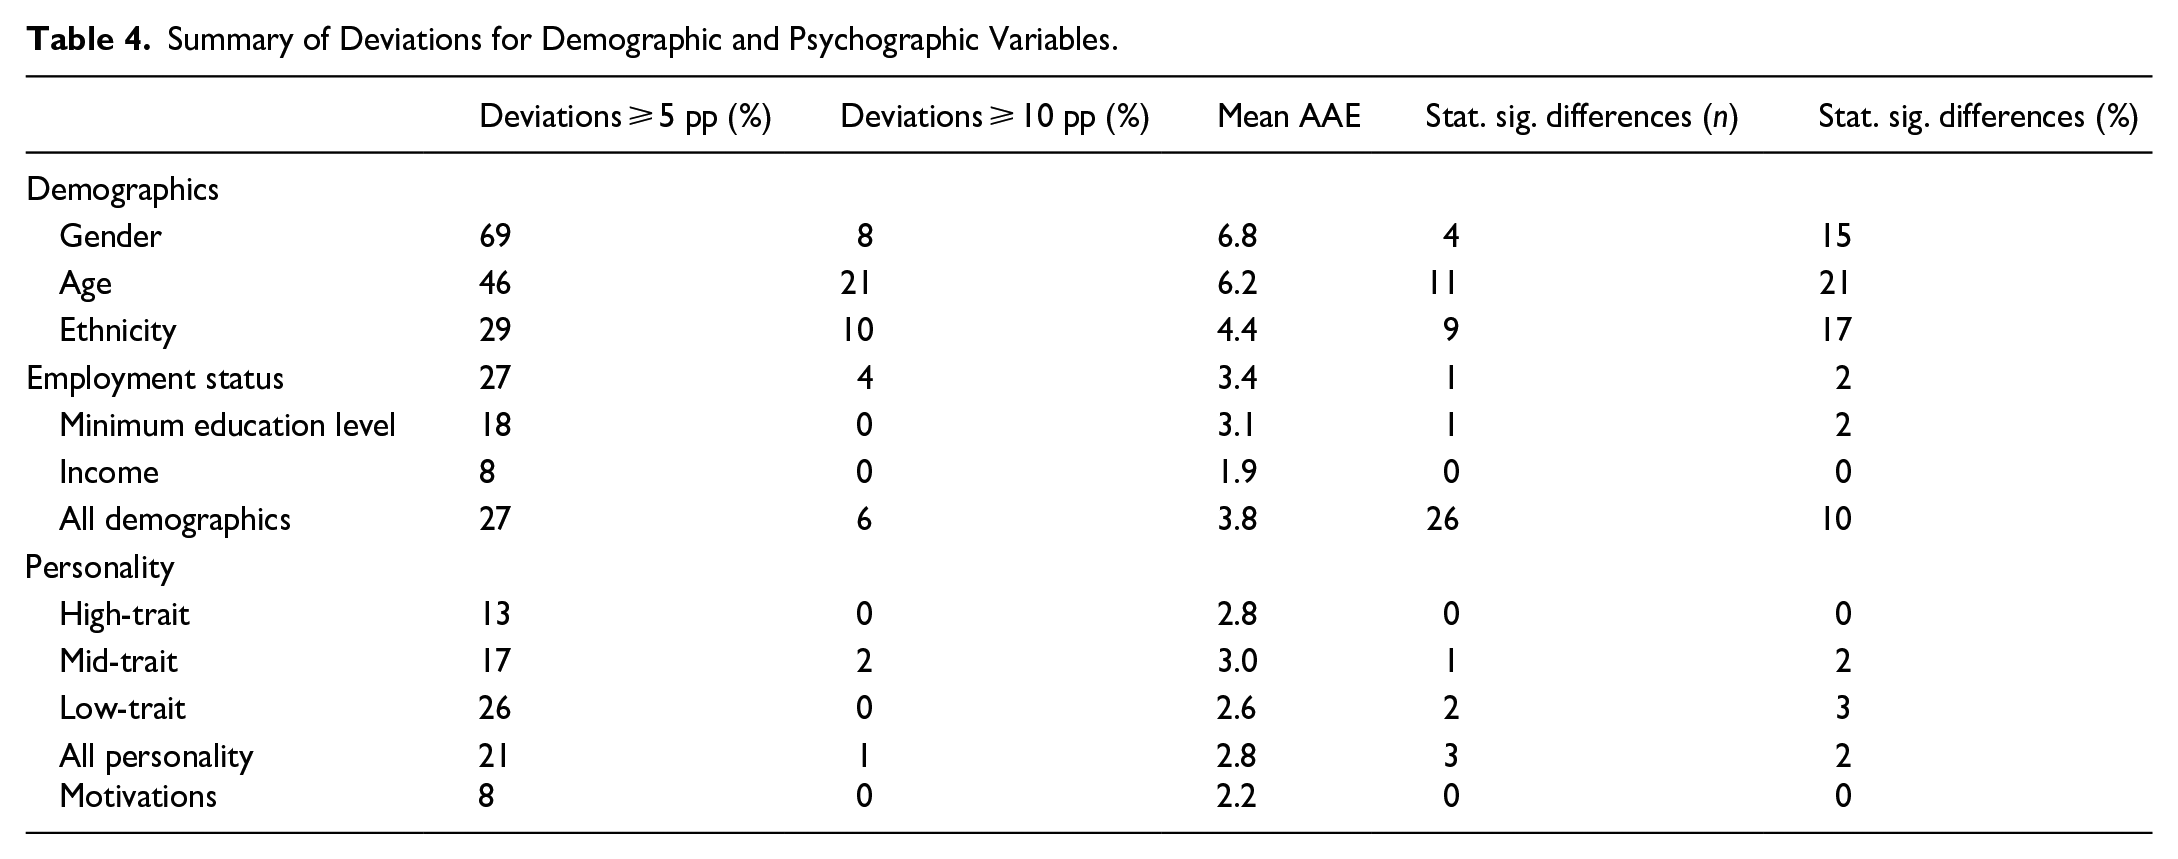
The current study examines music listening, a behaviour innately connected to the human experience, whether the reassurance of a present parent to an infant (Falk, 2004a, 2004b), the distraction from the existential dread of mortality (Dissanayake, 2009; Frith, 1996) or other reasons. Our research determines if music listening of genres is predictable based on demographics or psychographics and if genres attract a dissimilar demographic or psychographic listening base. The findings are essential to music stakeholders promoting music brands (e.g. artists, music marketers/labels, streaming services) or others who may want to use music in their commercial endeavours. We find that personality and motivation psychographic variables differed the least and that differences were more pronounced for gender and age variables – consistent with music and radio studies (e.g. North, 2010; Winchester & Lees, 2013). The majority of deviations were small and unimportant (Barwise & Ehrenberg, 1988).
We find that genre listener profiles are more similar than different, indicating the importance of a mass marketing strategy. For example, Classical music listeners are more similar (than different) to listeners of Rock (e.g. 55% vs. 50% male or 10% vs. 9% 18–24), demonstrating the limits of demographic and psychographic targeting, at least at the genre level. Eclectic tastes primarily cause such similarity; listening to both Classical and Rock genres results in a listener appearing in both genres’ profiles. This may be due to a broadening of musical tastes; in the past, genres such as Jazz or Classical were thought to be more high-status, whereas there is evidence that musical omnivorousness has become a marker of cultural capital (Peterson & Kern, 1996). That the largest differences are found for ages of listeners is no surprise, given the robustness of the influence of nostalgia (Davies et al., 2022). Surprisingly, age’s influence is smaller than expected (i.e. only one in five are managerially or statistically significant – Table 4), given its potential to shape preferences and listening behaviour.
Summary of Deviations for Demographic and Psychographic Variables.
Theoretical contributions
First, our research finds conflicting evidence to the previous music literature reporting genres have different listener profiles by demographic variables (e.g. age, gender, race (North, 2010; van Eijck, 2001)). For example, Rock is listened to by white, male, young and middle social class listeners, while Jazz is listened to by urban professionals and managers (Savage, 2006). Rock listeners are 95% white versus 88% average profile, 50% male versus 49% average profile, 37% under 40 versus 48% average profile and 40% $30 to 70,000 versus 37% average profile. The differences are minimal. In comparison, a stream of media and consumer goods research shows that audiences of competing media channels are rarely different (e.g. Z. Anesbury et al., 2017; Uncles et al., 2012). While we find differences between the audience profiles for genres (more so than between brands), the far bigger story is that few notable demographic and psychographic listener profiles of genre differences exist. Genres rarely attract a unique demographic or psychographic music listener. While they may be less likely to have an older (55+) listener, they still have these listeners in their profile; for example, Electronica/Dance has managerially and statistically significantly fewer listeners over 55 years of age, but we must acknowledge that they still account for almost one in ten listeners. This suggests music listening behaviour follows additional empirical patterns observed in consumer goods categories, such as duplication of purchase (i.e. music genres share listeners in line with their size (Z. W. Anesbury, Davies, et al., 2022b), which might mean that existing tools used to measure, understand and estimate audiences (e.g. Z. W. Anesbury et al., 2020) can find new relevance in this area.
Second, previous music research emphasises statistical significance (e.g. Rawlings & Ciancarelli, 1997; Rentfrow & Gosling, 2003), not the managerially helpful analysis in this study (Kennedy & Ehrenberg, 2001a, 2001b; Kennedy et al., 2014; Uncles et al., 2012). Therefore, the finding that genre listener profiles are more similar than different across demographic and psychographic variables suggests the previous literature is overstated. For example, correlations between personality and music preference are generally moderate (r < .30), which is relatively weak (e.g. Delsing et al., 2008; George et al., 2007; Rentfrow & Gosling, 2003; Zweigenhaft, 2008). Yet, these are reported as meaningful indications connecting personality and music preference. Despite no correlations between personality traits and genre or musical dimensions exceeding .2, personality is also reported to predict music preference far beyond demographic variables (e.g. Greenberg et al., 2016). Our novel results suggest that the link between demographics or psychographics, and music listening is negligible (i.e. psychographics overall MAD ⩽2). However, more notable differences were found for age (fifth of all age deviations ⩾10 percentage points) and gender (69% of deviations ⩾5 percentage points). Therefore, supporting the findings of previous research that demographics, especially age, are more related to music listening than psychographics (Davies et al., 2022; North, 2010).
Last, our research contributes to user profile-related theories – the Central Limit Theorem (Lynn, 2019) and the Uses and Gratification Theory (U&G; Webster, 2005). Our results show that music listener user profiles are overwhelmingly more similar than different, supporting that few people’s behaviours differ from the concentrated embodiment. That is, in support of CLT (Gordon, 2006; Stocchi, 2014; Trinh et al., 2014). Our research, therefore, provides limited support for the idea that people have individual reasons for listening to music genres, resulting in different user profiles, advocating Uses and Gratification (U&G) Theory (Abid & Harrigan, 2020; Webster, 2005). We may see that music is not directly substitutable, but somewhat different music is used for various reasons, and humans have many needs that music genres can fulfil (Lonsdale & North, 2011; North et al., 2000; Rentfrow & Gosling, 2006; Tarrant et al., 2000). Focussing on music genres, we show that music listeners are polygamous in their behaviour, resulting in similar user profiles for genres.
We do not propose that individual demographic and psychographic differences in music preferences do not exist at all. However, using a managerially useful test to interpret results and avoiding preconceptions that differences should exist leads to fewer and smaller differences than previously suggested.
Practical contributions
The current research has practical implications for those who market music to the public, the labels who own the rights to various music artists and subsequent genres, and entities that may want to use music. The current research finds that genres are generally listened to by cross-sections of audiences with similar demographic and psychographic profiles. Our results effectively dispel stereotypes that music genres are exclusively listened to by an in-group of particular people (exclusive sub-groups) – rather, some genres have a skew to some demographics but still have the spectrum of all other demographics in their listening bases. For those seeking to market music to the general population, demographic or psychographic genre targeting restricts rather than broadens growth potential. Those marketing musicians and their music can think about targeting a bit like cooking with salt – adding too much will spoil the dish, but adding a little will improve the dish (Sharp, 2010). Music marketers can be assured that listening to a genre such as Metal does not prohibit listening to other genres. In other words, the listeners of Metallica are also listening to Taylor Swift. As such, launching a new single or album for a Metal band should not be limited to those who listen to Pantera, Black Sabbath or Iron Maiden but to listeners of Lady Gaga, Beyoncé and Katy Perry.
Music Labels such as Sony Music own the rights to various music genres – Australian hip-hop artists (i.e. Hilltop Hoods), American country artists (i.e. Lainey Wilson) and rock-pop artists (i.e. P!nk), to name a few. Our research confirms that these genres have broadly similar listener profiles. The cause of similarities in genre listener profiles is simple – repertoire and multi-genre listening behaviour are the norm, as few listen to one genre. For example, if an individual listens to Blues and Pop, they appear in the listening bases of both genres, and it has been demonstrated that the listeners of Blues do indeed also listen to Pop (Z. W. Anesbury, Davies, et al., 2022). As a result, artists and their affiliated labels need to amass a wide audience to reach a broad range of music listeners as a feasible pathway to growth. Thus, musicians will grow their ‘ear-share’ in the same way as brands: by increasing the overall number of listeners rather than how often they listen (Romaniuk et al., 2018).
Limitations and future research priorities
There are two fundamental limitations to this research. The first is the use of a survey technique: claimed listening behaviour is prone to memory errors (Ludwichowska et al., 2017), social desirability bias (Gao, 2020) and natural limitations on the number of genres that can be contained in a survey – and not capturing the full repertoires of listeners or fully capturing the broad and interlinked and overlapping nature of genre (Trinh et al., 2017). Ideally, future research should strive to acquire data containing the actual listening behaviour and demographic details to understand this behaviour better. The second limitation is the period of music consumption (i.e. music genres often listened to), which, like brand-based questionnaires, will cause the most prominent genres to come to mind (Vaughan et al., 2016).
Not examined in this research is the weight of listening. Future research should consider light and heavy listeners’ demographic and psychographic profiles, which may yield more profound insights into listening behaviour. While overall music genre listener profiles seldom differ, heavier listeners may reflect the previously found segments. It would be helpful for practitioners to understand the relative importance of each weight of the listener. If heavy or light listeners account for a disproportionate weight of listeners, then the segmentation data changes importance. In a consumer behaviour context, recent research has highlighted the importance of a brand’s lightest buyers, who, although purchasing infrequently, account for a substantial portion of the sales (Dawes et al., 2022; Hossain et al., 2023). Thus, future research could determine if infrequent listeners account for many genre listens.
Footnotes
Appendix
Genre Listener Profiles by Motivations.
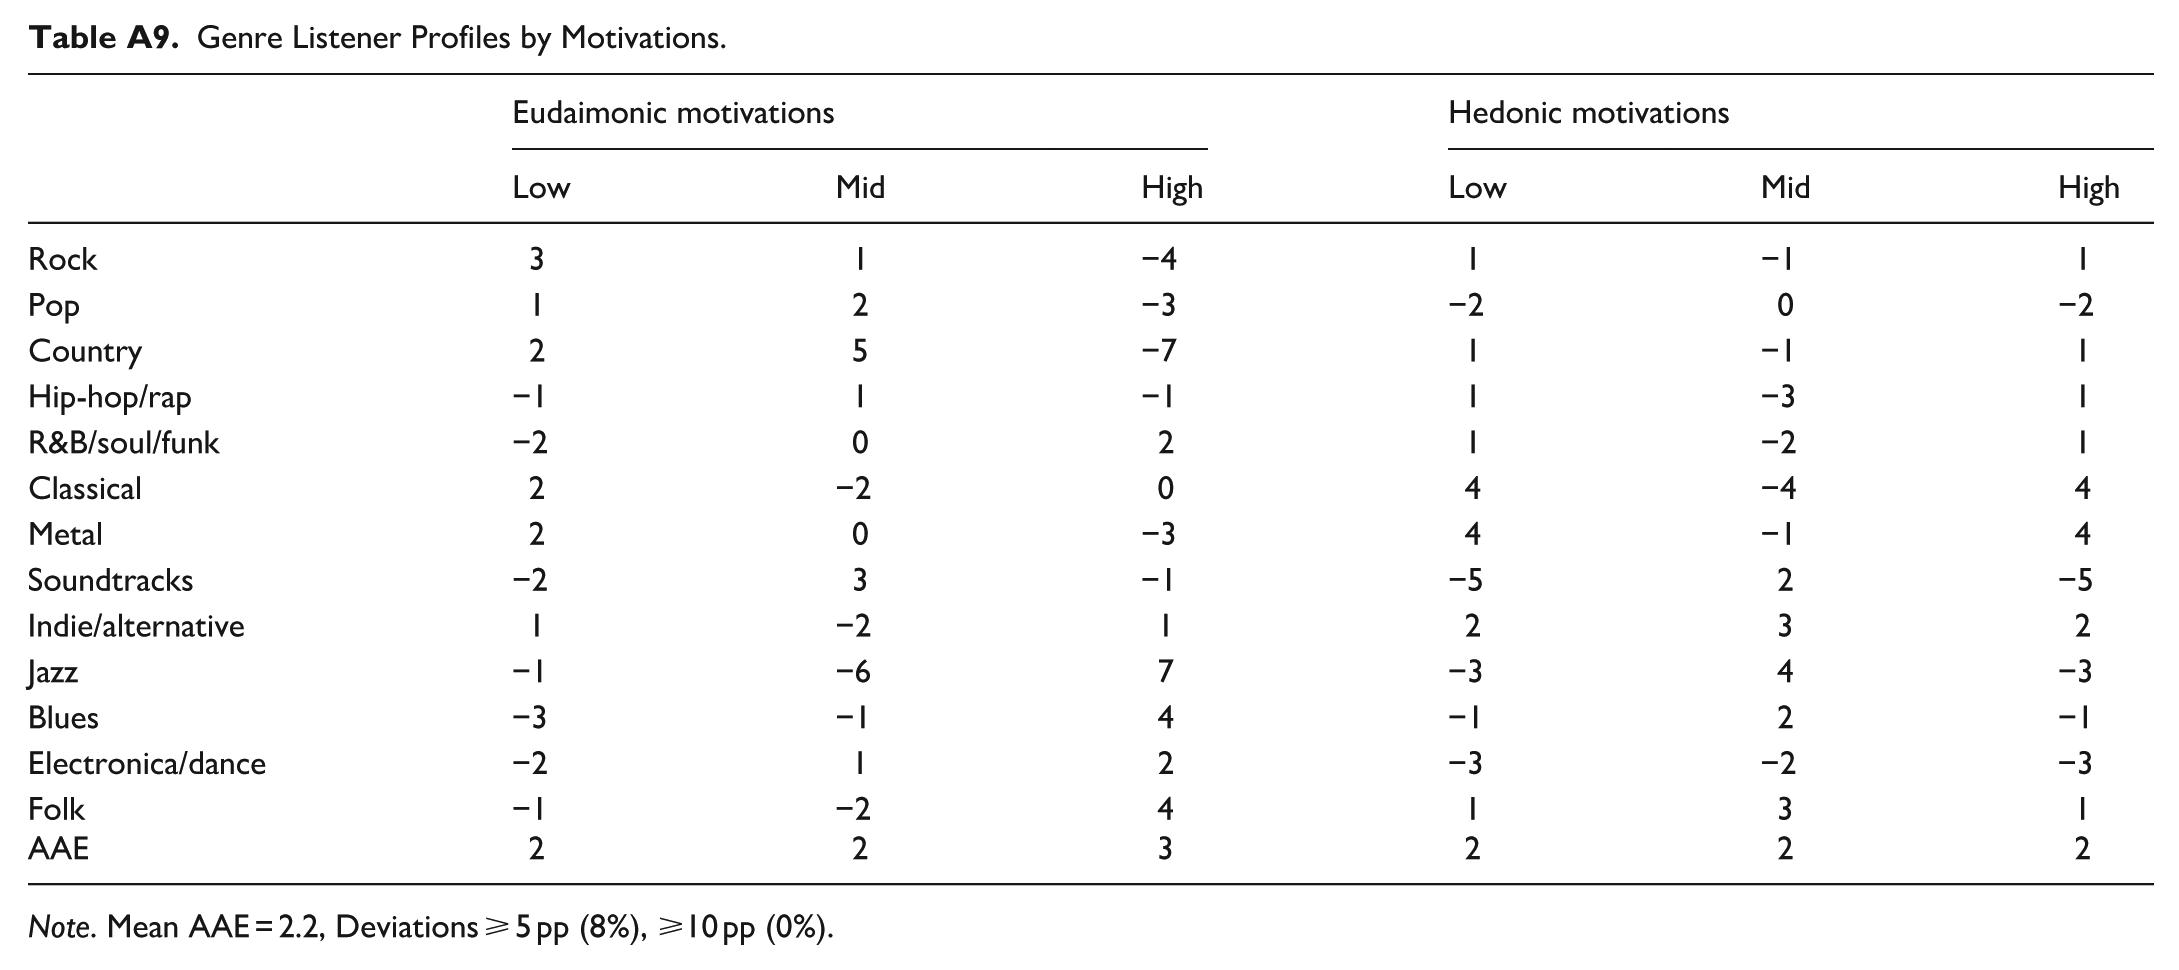
| Eudaimonic motivations | Hedonic motivations | |||||
|---|---|---|---|---|---|---|
| Low | Mid | High | Low | Mid | High | |
| Rock | 3 | 1 | −4 | 1 | −1 | 1 |
| Pop | 1 | 2 | −3 | −2 | 0 | −2 |
| Country | 2 | 5 | −7 | 1 | −1 | 1 |
| Hip-hop/rap | −1 | 1 | −1 | 1 | −3 | 1 |
| R&B/soul/funk | −2 | 0 | 2 | 1 | −2 | 1 |
| Classical | 2 | −2 | 0 | 4 | −4 | 4 |
| Metal | 2 | 0 | −3 | 4 | −1 | 4 |
| Soundtracks | −2 | 3 | −1 | −5 | 2 | −5 |
| Indie/alternative | 1 | −2 | 1 | 2 | 3 | 2 |
| Jazz | −1 | −6 | 7 | −3 | 4 | −3 |
| Blues | −3 | −1 | 4 | −1 | 2 | −1 |
| Electronica/dance | −2 | 1 | 2 | −3 | −2 | −3 |
| Folk | −1 | −2 | 4 | 1 | 3 | 1 |
| AAE | 2 | 2 | 3 | 2 | 2 | 2 |
Note. Mean AAE = 2.2, Deviations ⩾ 5 pp (8%), ⩾10 pp (0%).
Declaration of conflicting interests
The author(s) declared no potential conflicts of interest with respect to the research, authorship, and/or publication of this article.
Funding
The author(s) received no financial support for the research, authorship, and/or publication of this article.