
Abstract
This study examines the claim that the Net Promoter Score (NPS) is an indicator of future revenue growth. It firstly reviews published work on this topic, then presents evidence from firms in three US industries: airlines, supermarkets and insurance companies. A distinctive feature of the analysis is that it uses longitudinal data for NPS and revenue for periods between 5 and 11 years for airlines and supermarkets. This contrasts to the predominant approach in past work, which has been to analyse cross-sectional data. In addition to that longitudinal analysis, the cross-sectional association between NPS and revenue growth is examined for a sample of 10 large insurance firms for an aggregated period 2017 to 2020. The overall conclusion from the analysis is that Net Promoter is not an indicator of future revenue growth.
Introduction
The Net Promoter Score (NPS) is a metric derived from asking customers about their likelihood to recommend a product or service. The Net Promoter Score is claimed to be an indicator of future revenue growth for firms: ‘the one number you need to grow’ (Reichheld, 2003); and is used by thousands of businesses world-wide (Christensen, 2017). Many studies have examined the claimed link between NPS and firm revenue, with mixed results (e.g. Keiningham, Cooil, Andreassen, & Aksoy, 2007; Reichheld, 2003; Van Doorn et al., 2013). These mixed results call into question the efficacy of NPS monitoring and improvement programmes for business. However, most of the evidence to date has relied on cross-sectional analysis, which may limit our ability to fully discern the nature of the NPS-revenue association. Therefore, the present study examines the NPS – revenue link incorporating a different, arguably more insightful approach, which is a longitudinal analysis of NPS scores and revenue over time for a sample of US airlines and supermarkets. This analysis is supplemented with a cross sectional (multi-year) analysis of leading US insurance firms. The results show a lack of support for the proposition that NPS is an indicator of future revenue growth.
The NPS was introduced by Reichheld (2003), a senior executive at Bain & Co., who was already an influential figure through promulgating the importance of customer loyalty in several books (e.g. Reichheld & Teal, 1996) and Harvard Business Review articles (Reichheld, 1993). Since then, the NPS has become extremely popular in industry. A prime reason for this popularity is that NPS is simple to administer, and simple for managers to understand – the ‘one question’ firms need to track, as Reichheld put it. Another large part of the reason for this popularity is the bold claim that NPS is linked to revenue growth: if a business has a high NPS score it will grow faster than competitors with lower scores, and if a business improves its NPS score it will grow faster than before. This claim was not only made in the original Reichheld article and subsequent book (Reichheld, 2003; Reichheld & Covey, 2006) it has been repeated by a myriad of survey providers and consultants (as can be seen by a web search query for ‘Net Promoter Score’).
Additionally, Bain & Co. created a consulting arm called Satmetrix, that promotes the use of NPS and makes strong causal claims about the link between NPS and outcomes such as revenue growth. For example: ‘companies with scores higher than their competitive set will grow faster’ (Satmetrix, 2016, p. 1). And indeed, firms believe in the strong effect of word of mouth upon which NPS is based – consider this quote from a large US firm: ‘We spend much less on advertising and marketing than other supermarkets – approximately 0.4% of our total sales in fiscal year 2010. Instead, we rely on word-of-mouth recommendations and testimonials from our shoppers’ (Whole Foods Market, 2011).
The NPS has received criticism on various grounds. Some relate to the conceptual foundation of the NPS, namely that recommendations alone can drive business growth (Grisaffe, 2007). Others pertain to the claim that NPS is a superior metric to predict growth compared to satisfaction (Keiningham, Cooil, Andreassen, & Aksoy, 2007), or that a single metric alone is sufficient to guide growth (Fisher & Kordupleski, 2019; Keiningham, Aksoy, Cooil, Andreassen, & Williams, 2008; Keiningham, Cooil, Aksoy, et al., 2007). There have also been multiple critiques of the NPS measure itself, which we briefly summarise for context. First is that the NPS is poor at measuring negative word of mouth (East et al., 2011; Stahlkopf, 2019; second that the NPS question is confusing to respondents (Schneider et al., 2008), and relatedly, that absence of a ‘don’t know’ option is not good survey practice (Eskildsen & Kristensen, 2011). Another aspect that has received rebuke is the concept of grouping respondents into ‘promoter’, ‘passive’ and ‘detractor’ groups, with the notion that low willingness to recommend necessarily equates to negative word of mouth (Fisher & Kordupleski, 2019; Schneider et al., 2008), or that respondents who score 7 or 8 out of 10 should be considered merely ‘passive’ (Fisher & Kordupleski, 2019) and removed from analysis. Kristensen and Eskildsen (2011) found the NPS approach of deducting ‘detractors’ from ‘promoters’ created imprecision in the NPS score. We proceed to now canvass the evidence relating to NPS and revenue growth.
The claimed link between NPS and revenue growth has been questioned, with some researchers criticising Reichheld’s original evidence on the basis that the NPS scores partially post-date the growth for the company examples used (e.g. Keiningham, Cooil, Andreassen, & Aksoy, 2007, p. 42). Another aspect relates to the firms that were selected to show results. Reichheld (2003) reported that the research to validate the NPS-revenue link examined over 400 companies in two dozen industries (p. 51), but only 20 companies were included in the published results. The analysis in Reichheld and Markey’s 2006 book includes 35 companies, most of which were the same as those shown in 2003. The NPS-growth relationships for the other 350+ companies have not been disclosed.
Understanding if the claimed link between NPS and growth is valid is important to marketers and their business partners such as advertising agencies, and market research providers who could be tasked with obtaining NPS data. Most simply, it would be desirable to know the extent to which this link does occur, given the large sums invested in obtaining, analysing and reacting to NPS data and related customer improvement programmes. The NPS issue also has significant managerial importance in that it embeds an idea of how business growth can occur. That is, that highly satisfied customers will recommend the firm to others, and potential buyers will be highly influenced by this recommendation to become customers of the firm in question. By implication, this chain of logic suggests that traditional marketing tools such as advertising are less important. Rhetorically, why would a firm need or want to advertise, when in the words of Reichheld (2003), ‘the only path to profitable growth may lie in a company’s ability to get its loyal customers to become, in effect, its marketing department’ (p. 51). But what is the evidence for such claims? Over the past 15 years a series of studies has examined NPS and growth. As we will see, the evidence to date is discordant, and most work to date has analysed the cross-sectional relationship between NPS and revenue growth. As will be argued, this approach has several shortcomings. First is an apparent overlap in the time periods for NPS and revenue in some studies, making causal inference difficult. Second is the possibility that firm revenue growth or decline ‘persists’ over multi-year periods, which might confound an NPS – growth association with a past growth-future growth association. These shortcomings suggest multi-year, longitudinal analysis would be insightful. A range of studies have analysed NPS scores against sales growth or buyer purchases in the next 1 to 3 years (Anselmsson & Johansson, 2013; Fiserova et al., 2018; Korneta, 2018; Mecredy et al., 2018), however, the focus has been primarily across firms (or buyers within a firm), rather than examining NPS and revenue over time, within the same firms. One study, by Farooq et al. (2019) examined telecommunications companies over 5 years, but used self-reported customer numbers, which while certainly a growth metric is not the same as revenue. Therefore, a gap in knowledge exists as to the over-time association between firms’ NPS scores and their revenue performance. The present study addresses this gap, by analysing the firm-level, longitudinal relationship between NPS and publicly reported revenue for a sample of firms, over periods between 5 and 11 years. This approach is supplemented by a cross-sectional (aggregated over multiple years) analysis of the only other relevant, publicly available data identified, for leading US brands of car and homeowner insurance.
The paper first summarises and critiques past work on the possible link between NPS and revenue growth. It then describes a data search for additional evidence about NPS, and presents a simple and transparent analysis linking NPS levels or changes to revenue or market share gains for a variety of firms over multiple years. The review and critique of past work indicates a minority of studies support the claim that NPS drives revenue growth. Second, the empirical analysis shows overall lack of support for the notion that NPS scores are an indicator of future revenue growth.
Existing evidence
In this section we review, in chronological order, past studies that analyse the association between NPS and revenue growth or market share growth. We confine the review to NPS studies, 1 and we focus on studies that have specifically examined the relationship between firms’ NPS scores and their revenue/revenue growth or market share/market share growth. We include several relevant studies that examine NPS scores and customer retention. Outside the scope of the review are studies that chiefly examine methodological issues pertaining to NPS (which was covered earlier), or studies that measure an association between NPS and future intentions of behaviour.
We undertook a thorough search for published or work-in-progress studies that examine the association between NPS and firm revenue or market share growth; or NPS and related metrics such as customer retention. We excluded studies that involved only cross-sectional analyses of NPS scores and intentions measures (intention to stay or defect from a firm) gathered in the same survey. We used Google Scholar, Web of Science, Scopus, ProQuest, EBSCO and Business Source Premier, as well as ResearchGate and Academia, that can identify grey literature. We also undertook ‘ancestry chasing’ (Li & Wang, 2018) for references in primary studies to ensure all relevant past work was identified. Note that a formal meta-analysis of past work was not considered to be appropriate because many previous studies pose issues with the timing of the NPS relative to revenue, as will be discussed.
Chronology of NPS – revenue studies
Reichheld (2003) presented the idea of the NPS in a HBR article, showing graphs for three industries indicating high correlations between NPS and growth. While there were dates for the revenue figures, the dates for the NPS data were not disclosed. Keiningham, Cooil, Andreassen, and Aksoy (2007) later pointed out the NPS data were from periods that partly came after the date of the revenue figures.
In a subsequent book, Reichheld and Covey (2006) presented graphs showing positive correlations between NPS and revenue growth for firms in six industries: computers, life insurance, auto insurance, airlines, ISP and UK supermarkets. Again, however, the NPS scores came partly or mostly from time periods after the revenue growth. This partial overlap or pre-dating of the growth figures makes it difficult to know the extent to which the NPS is influencing growth, or if it is the growth that has influenced the NPS. The idea that it could be growth that drives NPS is not new. Godes and Mayzlin (2004) suggest: “While the mapping from word of mouth to future sales is of great interest to the firm, we must also recognize that word of mouth is an outcome of past sales” (p. 545).
At approximately the same time as the Keiningham, Cooil, Andreassen, and Aksoy study (2007), Marsden et al. (2006) examined NPS and revenue growth in five UK industries. They reported a correlation of r = .48 between the two metrics. However, the same issue arose as had been identified by Keiningham, Cooil, Andreassen, and Aksoy (2007): the growth figures were for the 2003 to 2004 period while the NPS was obtained in 2005 (see p. 45). Overall, this study appears to suggest a relationship between NPS and prior growth, not necessarily future growth. Similar work by Pingitore et al. (2007) examined NPS and revenue change for firms in two US industries – rental cars and airlines as part of a broader study. The survey data from which the NPS was derived was for the years 2005 to 2006 (p. 10). The study used a 4-point willingness to recommend scale from which a net promoter score was calculated. This NPS score was correlated against 3-year revenue figures, but the revenue figures were for 2003 to 2004 for rental cars and 2002 to 2004 for airlines (see Exhibit 3 in the study). The correlations between NPS and revenue were high: .77 for rental cars and .83 for airlines. However, since the revenue growth occurred prior to the NPS scores, this result suggests again that past growth correlates highly with NPS, not that NPS predicts future growth.
As a follow up to the Keiningham, Cooil, Andreassen, and Aksoy (2007) study, Keiningham, Cooil, Aksoy, et al. (2007) surveyed consumers in three industries: banking, retail and ISP. Respondents provided willingness to recommend scores among other metrics, as well as initial share of wallet. A year later, respondents were re-surveyed and asked if their share of wallet with the firm had increased or decreased. The correlation between willingness to recommend and change in share of wallet was only r = .12. Interestingly, the variable with the largest correlation with change in share of wallet was initial share of wallet, and it was negative at r = −.63 and −.34 (banking and retail, ISP figure not reported). This indicated that highly loyal buyers in the initial year were likely to reduce their loyalty, and low initial loyal buyers were likely to increase their loyalty: a manifestation of ‘regression to the mean’ (Barnett et al., 2005).
Keiningham, Cooil, Andreassen, and Aksoy (2007) also examined the link between NPS and revenue across five industries. The study reported correlations between a firm’s net promoter scores and revenue change of r = .40, −.45, −.12, .86 and .08. The overall average is r = .15, which is considered weak by social science standards (Cohen & Cohen, 1983). The authors stated of their results ‘there is no real indication that average levels of any of the satisfaction/loyalty metrics in Table 1 are significantly correlated with the relative change in revenue within the respective industry’ (p. 42). The study also reported other, quite high NPS-growth correlations but these were from Reichheld’s initial NPS work (2003) in which the growth partially precedes the NPS. The study also reported on individual consumer-level analysis and showed correlations between willingness to recommend and subsequent change in share of wallet that averaged r = .12, again a very weak correlation (2007, Table 3).
Summary of Work to Date on NPS and Revenue Growth (or Related Measure).
In a departure from the conventional approach of basing NPS on willingness to recommend, Morgan and Rego (2006) used actual positive word of mouth for a firm, minus negative word of mouth. They used US Compustat data for over 500 firms, matched with ACSI survey data from which they derived the word-of-mouth metric. The correlation between their derived net promoter score and sales growth was very low and negative at r = −.11. This study was criticised by Keiningham, Aksoy, Cooil, and Andreassen (2008), on the basis that the measure of net positive word of mouth used was quite different to the NPS. However, Morgan and Rego (2008) subsequently obtained additional data to show the two metrics were very highly correlated.
A book by Owen and Brooks (2008) discussed how to implement the NPS, with the work endorsed by Reichheld. The book also reported very high correlations (above r = .80) between NPS scores and growth for firms in two industries, using data provided by Satmetrix. The NPS data was for 2002 to 2004, while revenue was 2003 to 2005 or 2004 to 2006 (refer their Figure 1.2). The authors suggested that since the NPS scores (partly) pre-date the NPS years, this validated the proposition that NPS leads to growth. However, it is potentially possible that high revenue growth could have occurred in 2003 to 2004, and the NPS also scores increased in 2003 to 2004, while both stayed stable in 2005. Therefore, the pattern Owen and Brooks (2008) report does not conclusively indicate NPS is a lead indicator of growth. It is notable that the correlations between NPS and growth in this study are markedly above those reported in any other peer-reviewed, published work.
The next study, by Van Doorn et al. (2013), analysed 46 Dutch firms in several services industries. They reported a correlation between NPS in 2008 and sales growth in 2008 of r = .28, but for sales growth in 2009 to 2010 the correlation was −.06. This result appears to suggest that the correlation between NPS and growth occurs at the same time, but that NPS does not correlate positively with growth in a future year. Indeed, the authors concluded ‘the predictive capability of . . . NPS . . . is limited’ (p. 314). More encouraging results were reported by Anselmsson and Johansson (2013), who obtained willingness to recommend and satisfaction scores from Swedish customers and analysed them against sales growth for various retail chains in the subsequent 3 years. They reported a correlation of .48 between recommendation and change in sales.
A study of NPS and customer retention, which while not the same as revenue growth, is also relevant to this review. De Haan et al. (2015) surveyed customers of Dutch companies across 18 industries, obtained NPS scores, then re-surveyed them 2 years later to assess the effect of NPS (along with other measures such as satisfaction) on customer retention. They concluded that NPS did correlate with retention (r = .17, Table 5). This is a positive result for NPS, however the association is fairly weak, and retention, while important, is not the same as sales growth. The study also gathered satisfaction scores, which also correlated with retention at about the same level as NPS (r = .15). Satisfaction and NPS correlated with each other at r = .34. The authors noted a limitation, that retention was self-stated (still a customer, or not). It may be the case that in some of the non-contractual industries they studied that some of the customers who stated they were not now customers of a firm had not actually defected from them, but merely were not purchasing from them at the time of the second survey.
Mecredy et al. (2018) utilised longitudinal, individual-level data from a B2B market in New Zealand. They found that the NPS positively correlated with past, present and future revenue. The study also identified that growth came ‘across the board’ from all three NPS classes of detractors, passives, and promoters and that ‘the incremental effect of purchases by promoters, separate from the overall trend, is relatively modest’ (p. 8). A Polish study (Korneta, 2018) examined NPS and revenue growth over time (3 years) for transport companies, and found non-significant relationship between the two metrics. That said, it did find companies with higher NPS were more profitable. However, the mechanism by which NPS could influence profitability without favourably affecting revenue growth is unclear.
Fiserova et al. (2018) also used longitudinal data to examine the possible link between NPS and revenue in a study of stores within a UK furniture retailing chain. They found NPS scores were positively related to growth in store sales for up to 6 months after the date of the survey. Respondents completed three NPS surveys (post purchase, post delivery, 6 months post purchase) with the last one being the one used. It is not clear if the same results would hold if either of the other two survey results were used. Nevertheless, this study does provide positive evidence of a positive link between NPS and subsequent growth, albeit within one large retail chain, not across competing businesses.
Sauro (2019) assembled NPS and revenue or market share data from 14 industries. The study found a positive correlation between NPS and growth in 11 of the 14; producing an overall average correlation across the 14 industries of r = .35. That is, companies with higher NPS in a base year tended to grow faster in the subsequent 2 years. The study concluded that NPS does appear to correlate with future growth in the majority of cases.
A potential alternative explanation to Sauro’s conclusion and possibly also the finding from Anselmsson and Johansson (2013) is that corporate growth or decline may be ‘persistent’ over time. That is, corporations that grow faster (slower) than their peers in one year tend to do the same the next year. Short-term persistence or autocorrelation is a common feature of longitudinal data (Greene, 2011; Yaffee & McGee, 2000). Logically, if firm growth generally comes from building more mental or physical availability (Romaniuk & Sharp, 2016; Sharp, 2010), or introducing new or superior products (McKelvie et al., 2017) then the effects of such actions should persist for longer than only one year. Indeed, there is some empirical support that corporate revenue growth is positively autocorrelated (Chandra & Ro, 2008; Coad et al., 2018, p. 67). Next, it could be the case that a firm that grows faster in one year could attract higher NPS scores – because it has gained new buyers who arguably have more interest or motivation to recommend, because they have experienced something new that is therefore topical for conversation with others. By contrast, long-term customers are less likely to recommend a firm, because firstly, they are habituated to it, and secondly, would be repeating themselves to friends or colleagues if they did. 2 Support for this idea comes from Wangenheim and Bayón (2004), who find that customers who recently switched to a new service provider gave more word of mouth about it compared to older-tenure customers. Therefore, a firm might grow, obtain a higher NPS score on the back of its growth, then will tend to grow (in line with on-average positively autocorrelated growth) again the next year. Therefore, under this scenario if we correlated NPS scores with next year’s growth in this scenario it would falsely appear that the NPS is driving the growth.
The individual-level link between NPS scores and customer loyalty was investigated by Jahnert and Schmeiser (2022) in a study of insurance firms. The study found respondents who give very high NPS scores for their provider tend to have more policies with it. In theory, then, firms with higher NPS scores might enjoy higher customer retention, which could aid growth. However, research on business growth indicates new-customer acquisition plays a more important role than retention (e.g. Riebe et al., 2014).
Most recently, Baehre, O’Dwyer, O’Malley, and Lee (2022) examined NPS and revenue growth in a survey-based study. The study analysed quarterly waves of NPS scores against a quarterly sales measure. It reported that NPS scores predicted future revenue. That said, the study used scores from both brand buyers and non-buyers. It is likely that non-brand buyers would only recommend brands that they are familiar with, therefore the NPS in this study may be acting more as a proxy for brand awareness rather than a loyalty or word of mouth measure. The study did not find an association between NPS and sales growth using NPS scores from brand buyers.
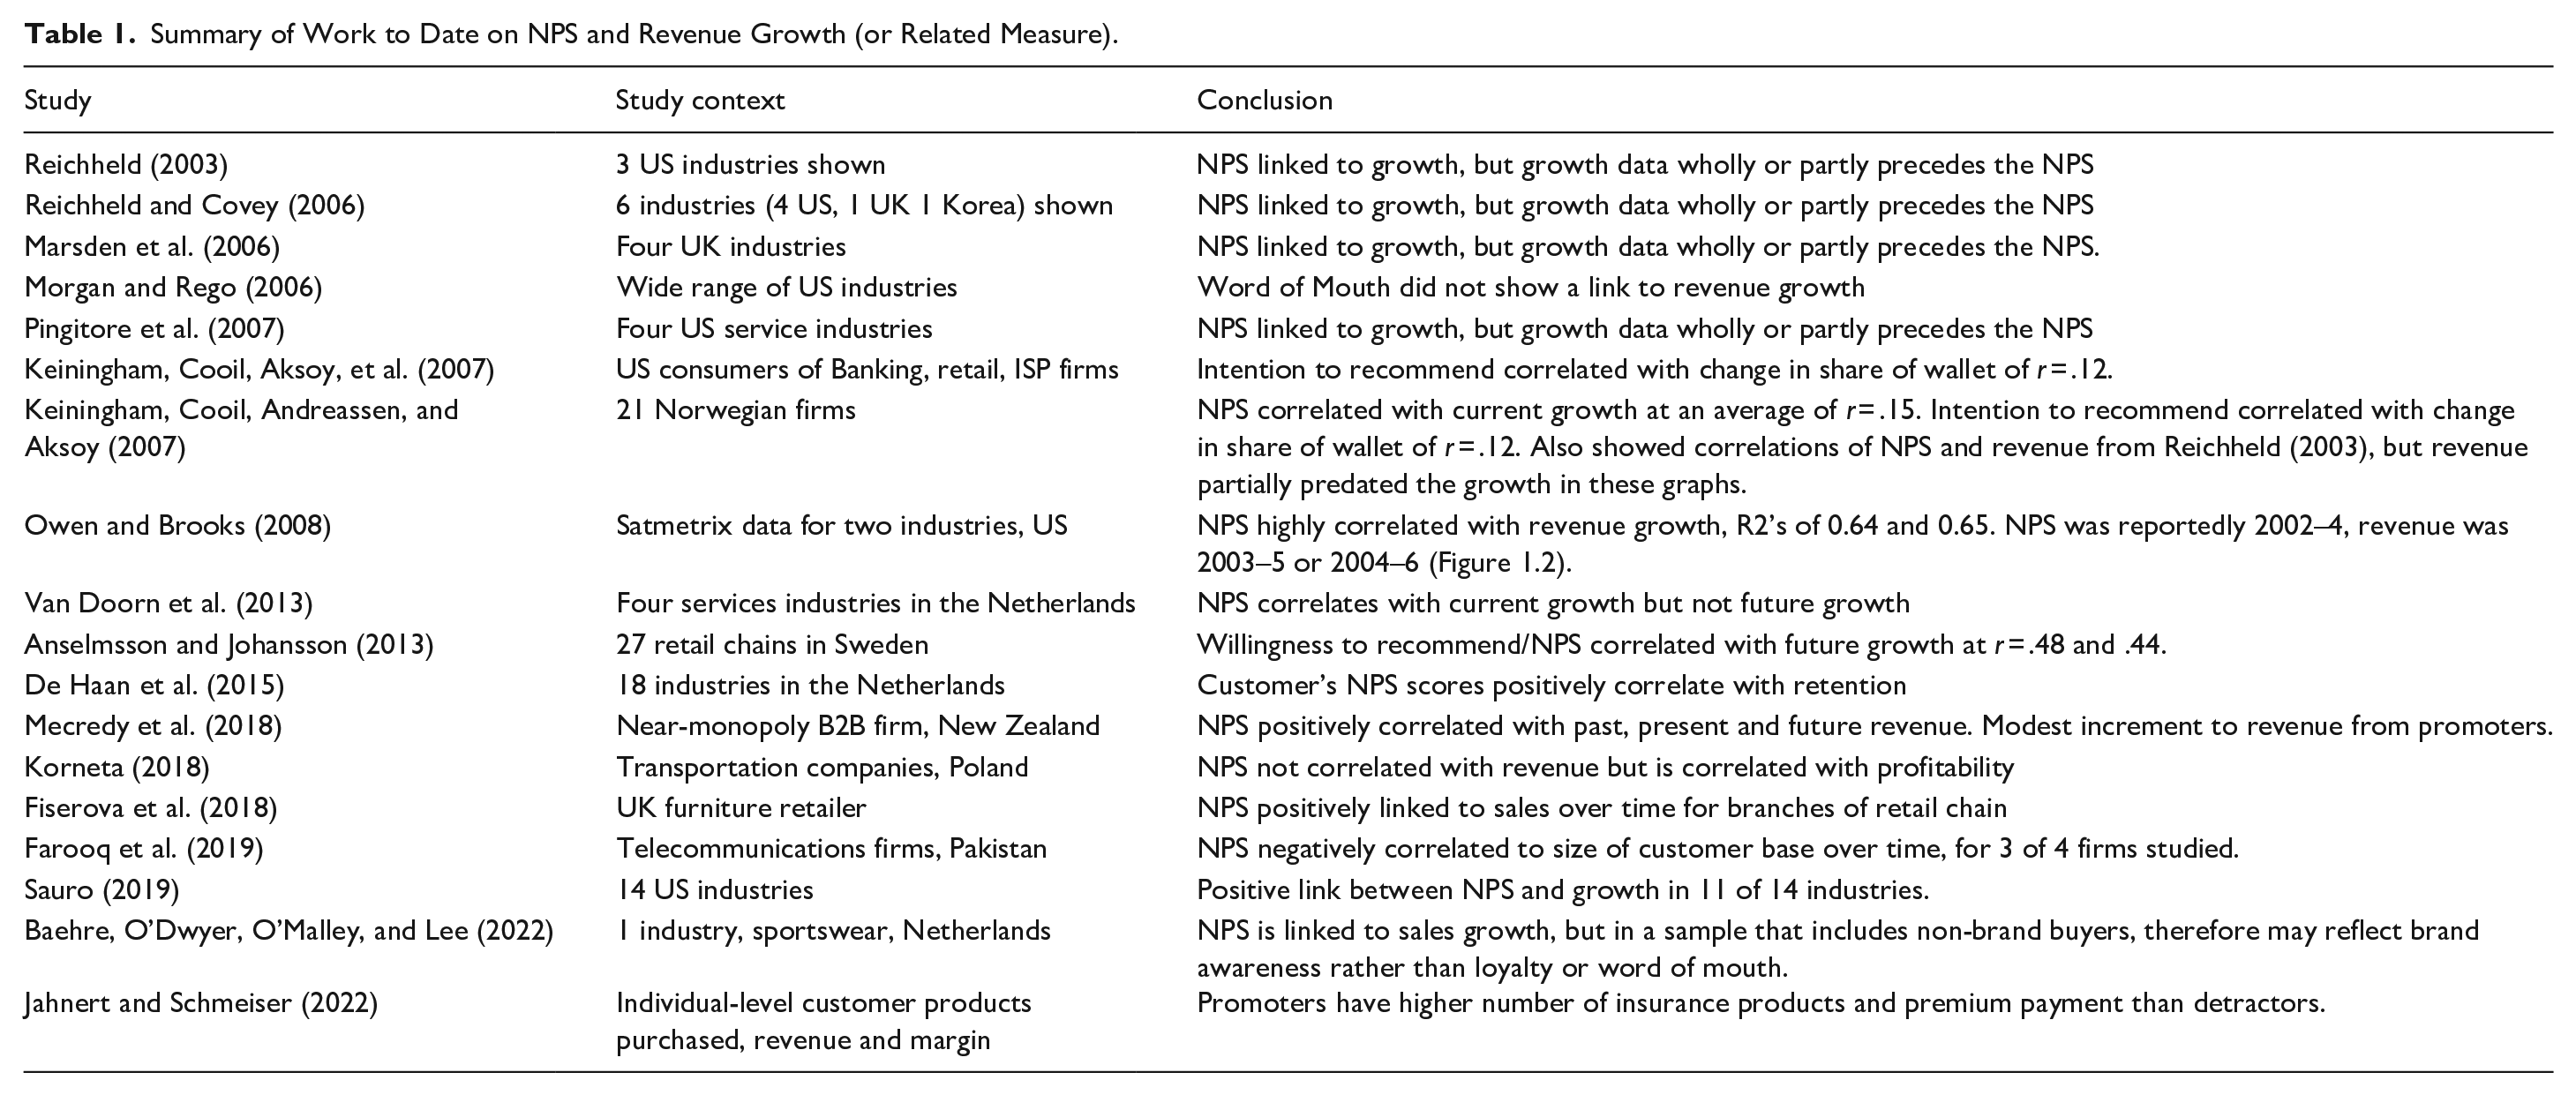
We summarise the empirical studies that have been reviewed here, as well as their principal findings, in Table 1.
This review finds that while some studies support the claim that NPS links to revenue growth, many do not. A shortcoming of several studies is that the NPS – growth association has been confounded by apparently analysing growth that occurred wholly or partially prior to the NPS score. Moreover, while cross-sectional analyses that examine NPS scores with near-term subsequent growth can be insightful, it is possible that year-on-year persistence in revenue growth (Chandra & Ro, 2008; Coad et al., 2018, p. 67) might inflate the real NPS-growth relationship. Therefore, additional independent evidence on how NPS might or might not link to revenue growth is warranted. More specifically, it would be insightful to go beyond solely cross-sectional analyses, and build on the longitudinal approach taken by Farooq et al. (2019). A distinct contribution of the present study, therefore, is that it incorporates a longitudinal examination of firms’ NPS scores, matched to over-time published firm revenue or market share data. The study also makes use of publicly available NPS scores for US car and homeowner insurance brands, matched to their revenue growth in a supplementary cross-sectional analysis.
Method
To locate NPS data, we firstly conducted an extensive web search using keywords ‘Net Promoter’ or ‘NPS’ to find scores for firms. The search focused on finding firms for which multiple years (more than three) of NPS data was available, to then match with revenue or market share information.
We found that only a limited amount of multi-year NPS information is publicly available, and is almost exclusively for US firms. It appears that companies such as Satmetrix sell NPS scores to clients to use as benchmarks, therefore have curtailed the extent to which it publicly releases NPS scores. Despite this, we did locate useful data from Satmetrix, which published a series of infographics with annual NPS scores for firms in the US airlines and supermarkets for the period 2010 to 2014, and some additional limited information in 2015 to 2017. We tabulated the scores from these sources, then obtained annual revenue data for the companies for the same years from either the stock analyst site www.macrotrends.com, or the company’s published figures. We also searched for more NPS data for these firms on their own web sites or third-party sites. This revealed that two airlines, Jet Blue and SouthWest, published NPS data in financial statements between 2009 and 2020. For Delta we found additional scores from www.customergauge.com. Note that we do not use any 2020 scores or revenue given the disruption of the covid pandemic in that year. We note the data source in the tables to allow for checking. In some cases, there are NPS scores in company information (annual reports) as well as third-party sites such as customergauge.com. We did not use the Satmetrix data for American Airlines because it merged with US Airlines in 2014. The other airlines identified to have appropriate NPS and revenue data are United, American Airlines and US Airways, albeit for only 5 years or 6 in the case of American. For these companies we obtained annual revenue information from the US Bureau of Transportation (Bureau of Transportation Statistics, 2022).
As mentioned earlier, there has been controversy about the reported timing of NPS scores. Some investigations have shown that NPS scores are for time periods that partially post-date company revenue figures, for example as reported by Keiningham, Cooil, Andreassen, and Aksoy (2007). Here we take care to use the year for which the NPS was gathered (or achieved) for our analysis. For example, the 2009 Jet Blue annual proxy statement issued in April 2009 pertains to NPS scores for the 2008 year. Therefore, we classify that NPS figure as being for 2008, and match it against reported revenue for 2008. Appendix 1 provides detail to allow interested readers to verify data details such as these.
We present evidence from (1) six US airlines over multiple years, (2) four US supermarket chains over multiple years; and (3) ten US insurance providers for both car and homeowner insurance. The principal evidence presented comprises NPS and revenue for firms over periods of 5 years, to a maximum of 11 years in the case of Jet Blue Airlines. We acknowledge that these constitute small numbers of annual observations. However, from our extensive search process, we believe it represents as much publicly available data as is available. In appraising the evidence, we examine not only the over-time NPS scores and revenue for specific firms, but we also qualitatively compare NPS scores and revenue growth across firms in the same industry.
There are several ways in which one could analyse the possible association between NPS and revenue. One is the simple correlation of NPS and Revenue in the same year. While we report this association for completeness, the claim being tested is that a higher NPS is linked to higher growth. Therefore, we also analyse the correlation between a firm’s NPS in a year and the firm’s revenue growth in that year (i.e. change in revenue from year 1 to 2 as a proportion of year 1). We also acknowledge that growth might take some time to occur on the back of improvements in NPS, therefore we also correlate NPS with the next year’s revenue growth.
Meta-analysis
We combined the correlations between NPS and revenue, and NPS and growth for the 10 firms using a meta-analysis approach. We follow an accepted procedure for pooling, or combining the correlations, as per Field (2001). We first calculated the Fisher Z transformation (e.g. Borenstein et al., 2009) which transforms the correlations such that they have a normal sampling distribution. We then take the number of annual observations for each correlation and use that number of observations minus three, to create a weight for each Fisher Z, called the inverse variance weight. We then calculate a weighted effect size for each firm as the Fisher Z multiplied by the inverse variance weight. We then compute the weighted mean effect size as the mean of the effect sizes divided by the sum of inverse variance weights. We transform the weighted mean effect size back to a correlation using the inverse of the Fisher transformation; and then calculate the standard error of the weighted correlation, which is the square root of the sum of inverse variance weights. The results of these calculations are shown in Tables 2 to 4.
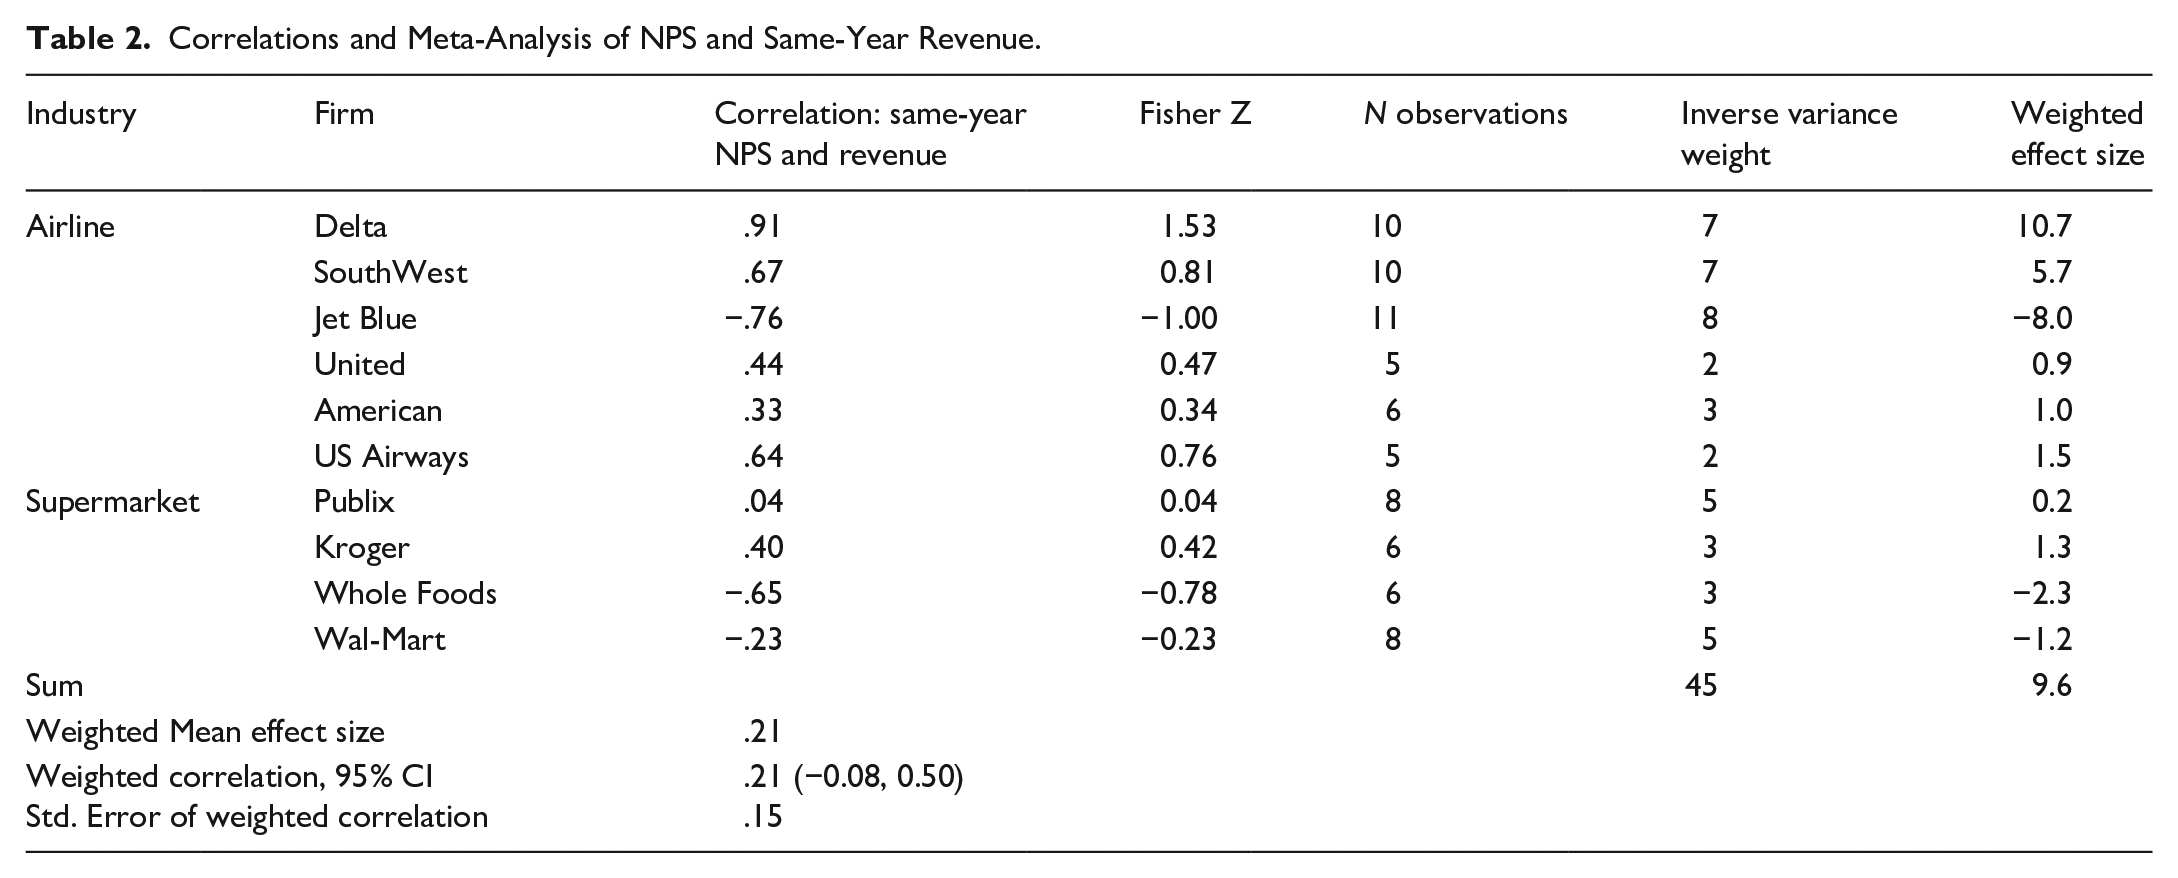
Correlations and Meta-Analysis of NPS and Same-Year Revenue.
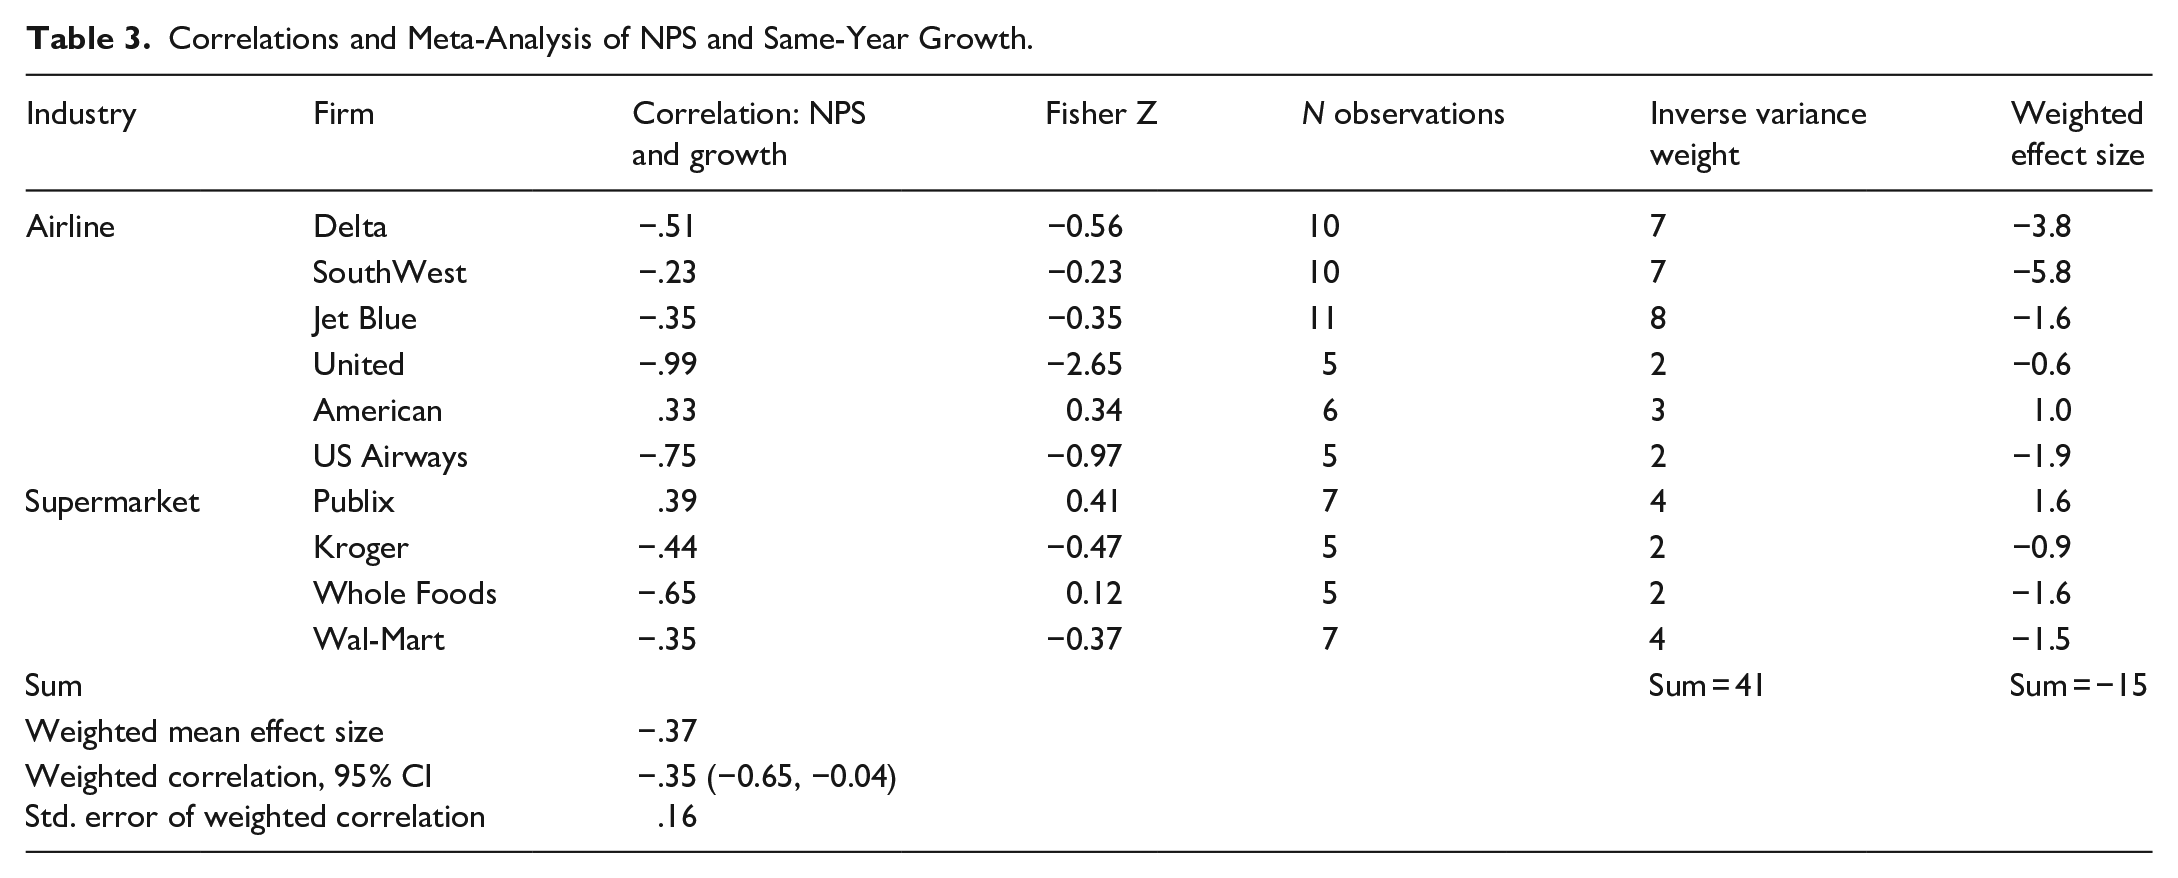
Correlations and Meta-Analysis of NPS and Same-Year Growth.
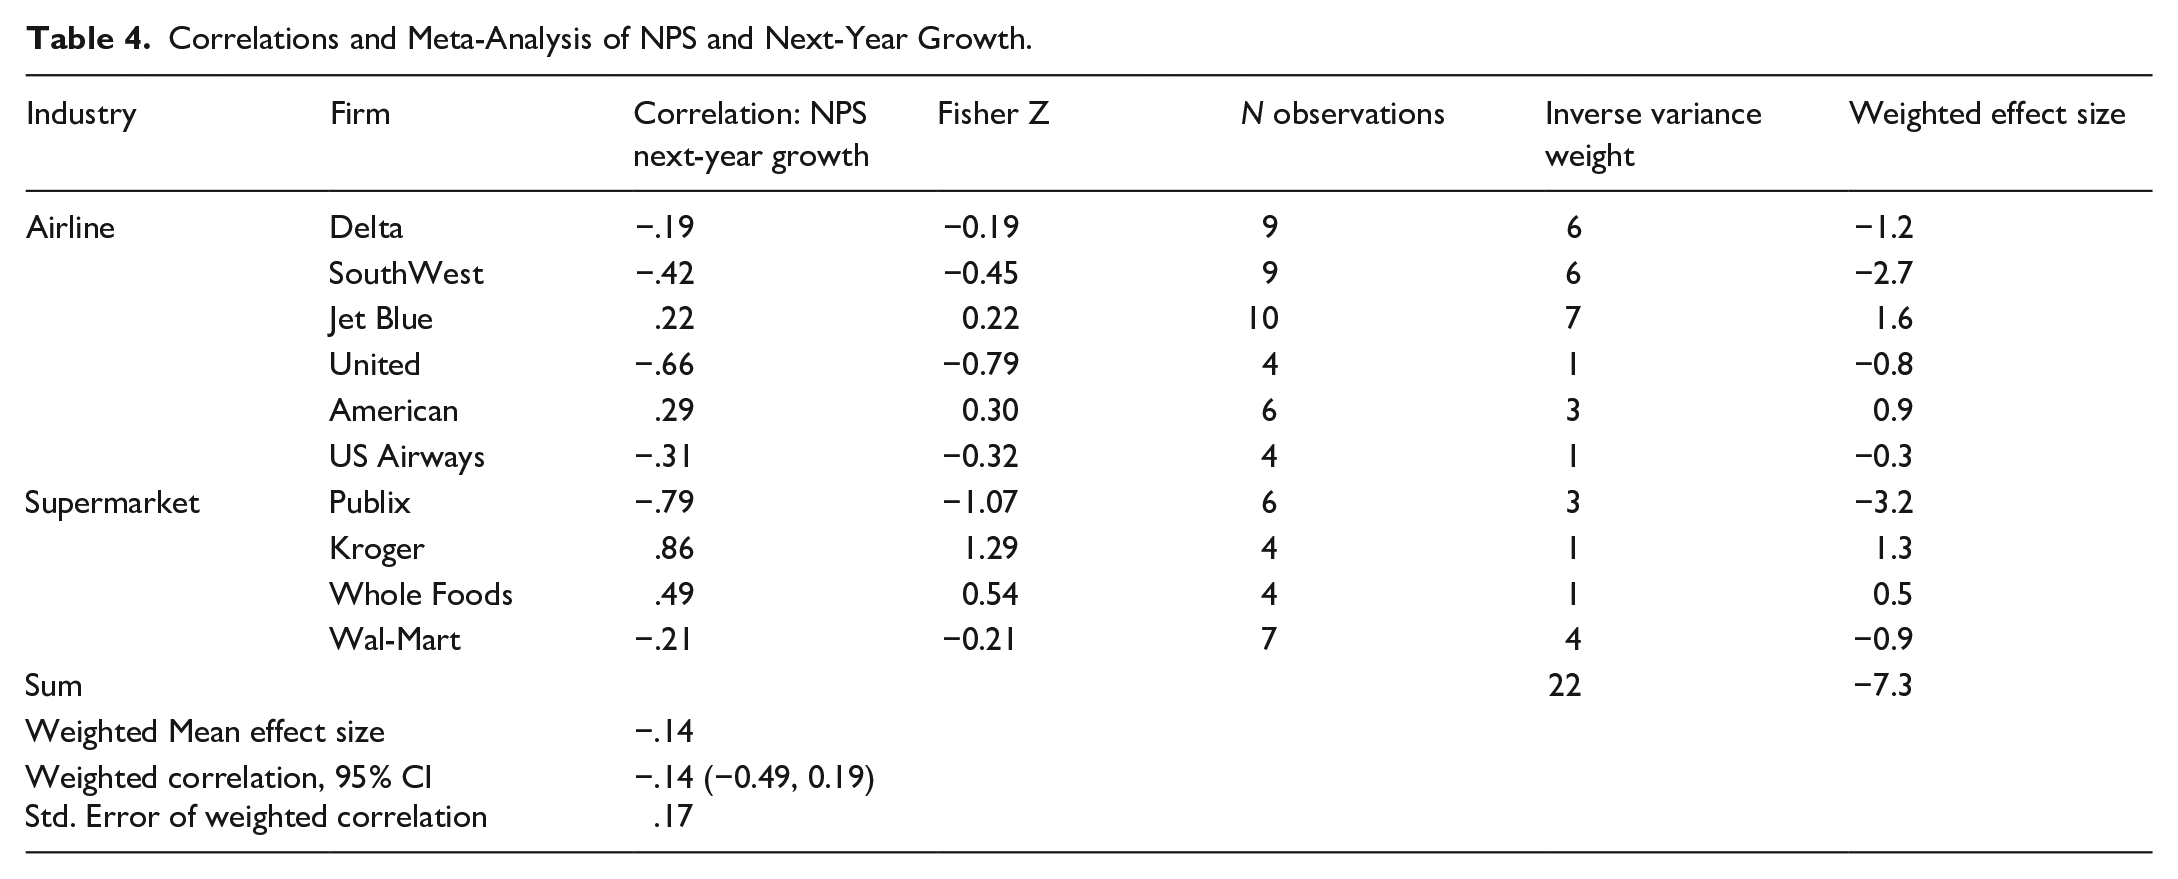
Correlations and Meta-Analysis of NPS and Next-Year Growth.
Results
In Table 2 we see that the overall weighted correlation for NPS and same year revenue across the 10 firms is r = .21. However, the standard error of that correlation is .15, which means the 95% confidence interval is (−0.08, 0.50). The confidence interval crosses zero, therefore there is not a statistically significant positive (or negative) correlation between NPS and revenue from these data.
Table 3 shows the correlation between NPS and growth. The weighted correlation is −.37 with a standard error of 0.16, which gives a 95% confidence interval of (−0.65, −0.04). Therefore, there is actually a statistically significant negative correlation between NPS and growth among this sample of firms. Finally, Table 4 shows the correlation for NPS and next-year growth to be −.14 with a standard error of 0.17, producing a confidence interval of (0.19, −0.49); not statistically significantly different to zero. 3 We see somewhat diverse results from the three potential ways of measuring a possible association between NPS and growth but overall, we see an absence of evidence linking NPS to positive revenue outcomes. This analysis is of the average within-firm association between NPS and revenue or growth over time. In the next section we also qualitatively compare the NPS scores and growth across the firms in each industry.
Across-firms analysis: Airlines
We then calculated the average NPS for each airline over these multiple years, together with average revenue growth over the same period, and compare the six airlines. The detailed NPS scores and revenue/growth figures are provided in Appendix 2. The top NPS performers were Jet Blue with an average NPS of 63, which had annual growth of 8.4%, and SouthWest with an average NPS of 64 and average annual growth of 8.3%. Next is Delta, with an average NPS of 23, and 5.4% growth on average. American Airlines had an NPS of 0.2 and growth of 8.3%. United’s NPS was −4 and it had annual growth of 22%, 4 and for US Airways the NPS figure is −9.2 with 8.8% annual growth. Therefore, American grew at a similar rate to Jet Blue and SouthWest, but with an NPS performance considerably under those two rivals. United grew the fastest of the six, but had the lowest NPS score. US Airways grew nearly as fast as Jet Blue and SouthWest but their NPS were in the 60s while US Airways with comparable growth had a very low average NPS of −9.2. Therefore, there is not a discernible positive association between NPS scores and growth over the period for this sample of airlines. We now do a similar analysis for the US supermarkets.
Across-firms analysis: Supermarkets
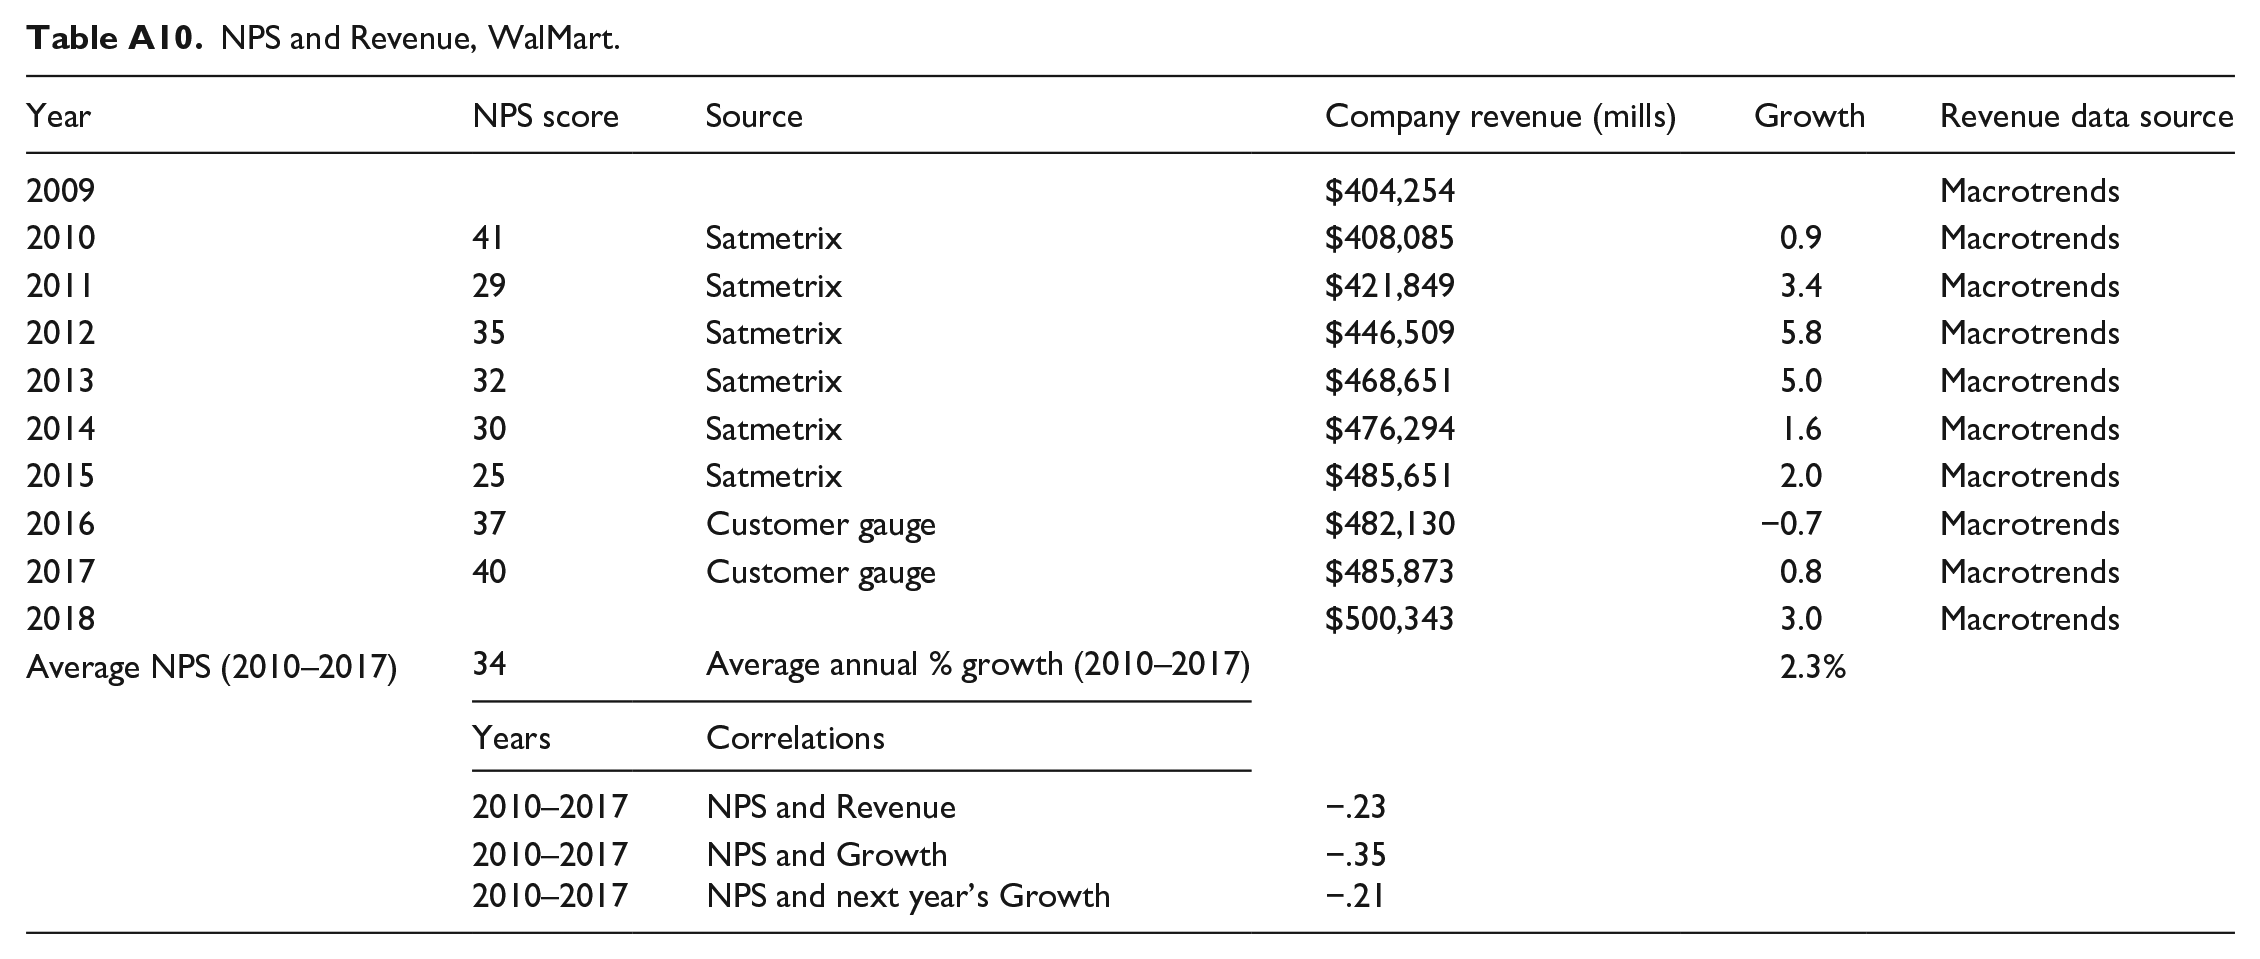
Publix grew 4.8% annually over the period, and its NPS was 63. Kroger grew 6.1% annually with an NPS of 45. Whole Foods grew 11% per year on average; with an NPS of 48. Walmart grew 2.3% annually and had an NPS of 34. Therefore, WalMart has the lowest NPS and the lowest growth. That said, WalMart is far larger than the other chains and a lower rate of growth is somewhat expected. Of the other supermarkets, Whole Foods grew much faster than Kroger, yet their NPS results were very similar. Publix, with by far the highest NPS, grew more slowly than Kroger and Whole Foods. Therefore, there does not appear to be any clear association between average NPS scores and average revenue growth over a multi-year period for these supermarkets.
We now turn the final industry, US insurance.
Insurance companies
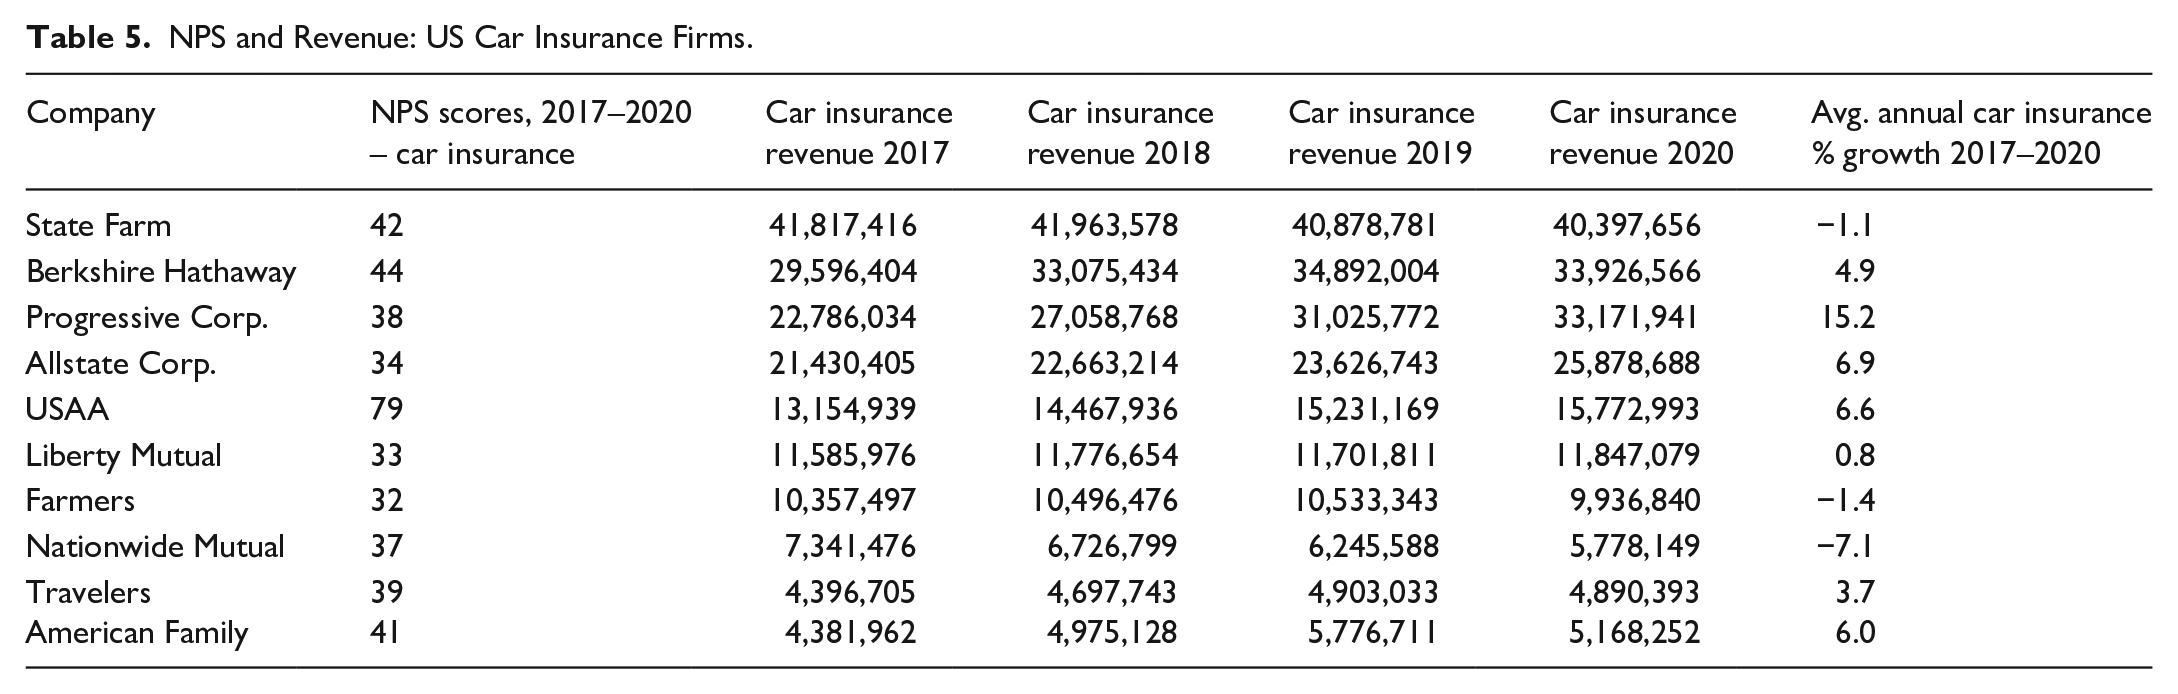
We obtained NPS scores for the period 2017 to 2020 from clearsurance.com, a US insurance comparison company. The scores pertain to car insurance and homeowner’s insurance. The scores are aggregated over the 4-year period, so we do not know the specific scores in each particular year. However, we can compare the growth rates of these firms for the period relative to their NPS. We obtained revenue figures for the top 10 car and homeowner insurance firms in the US from the Insurance Information Institute, for the period 2017 to 2020 (Insurance Information Institute, 2021) and tabulated revenue against NPS scores. Note that Chubb Ltd had revenue scores but no NPS scores, we omit it from analysis but retain it in the table. Also note that Berkshire Hathaway is the owner of Geico, so we used Geico’s NPS score and Berkshire Hathaway’s insurance revenue (Berkshire Hathaway does not own any other car or home insurance companies). The results are shown in Tables 5 and 6.
NPS and Revenue: US Car Insurance Firms.
NPS and Revenue: US Homeowner Insurance Firms.
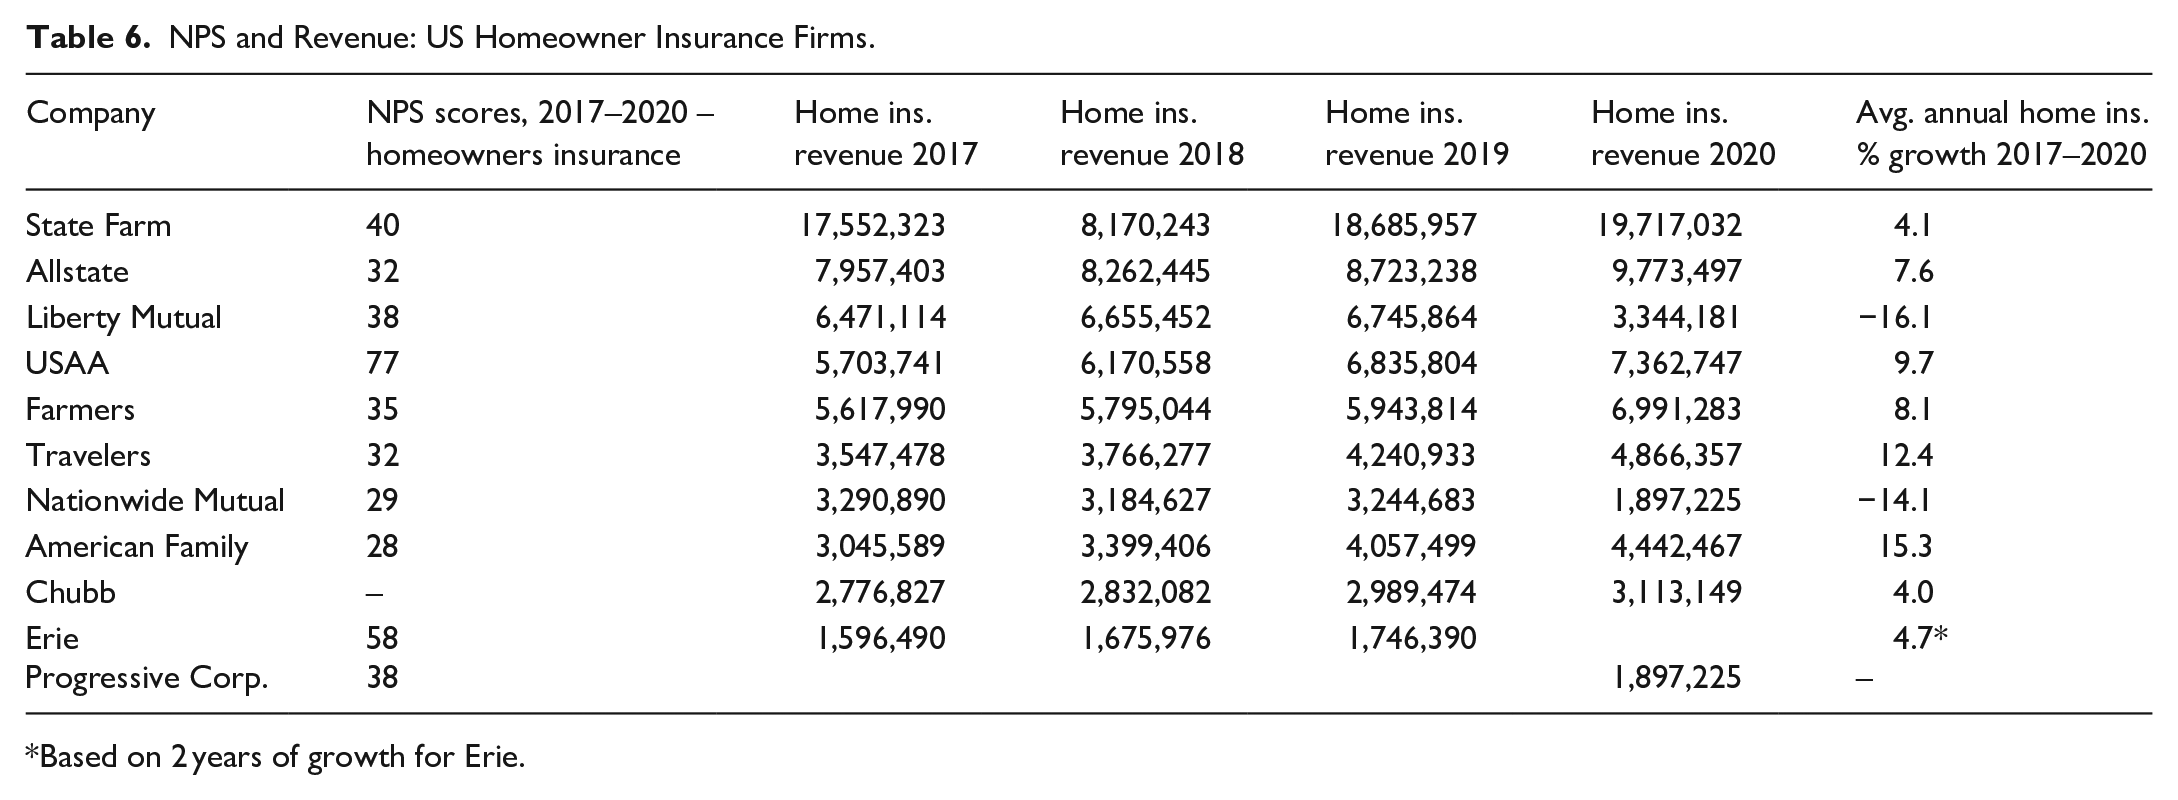
Based on 2 years of growth for Erie.
The correlation between these NPS scores and company growth over the 2017 to 2020 period for car insurance is r = .15, and r = .23 for homeowner insurance; neither statistically significant due to the small number of firms in each case. As mentioned earlier, some authors have posed that perhaps rather than NPS scores influencing growth, it could be that past growth influences subsequent NPS scores (Bendle et al., 2019; Pollack & Alexandrov, 2013). To check this possibility, we also calculated the correlation between NPS and past growth – for the period 2015 to 2016, before the NPS scores were obtained. The correlations with NPS and past growth were stronger (r = .31 and r = .33 for car and homeowner respectively) than with growth in the period during which the NPS scores were obtained. However, they were not statistically significant either. Given the discussion earlier about the likely persistence of growth over time (or decline) we also tested if past growth correlated more strongly with the 2017 to 2020 growth for these firms than the NPS did. We found that it did, with correlations of .34 and .58 for car and homeowner respectively. We considered that while the two sets of growth rates were for largely the same firms, they were in different insurance categories (car and homeowner), therefore it would be applicable to calculate the combined weighted correlation. This was calculated to be r = .48 (c.i. 0.02, 0.96), which is just above the threshold of statistical significance. Therefore, past growth outperforms the NPS in explaining present growth for these firms. The small number of observations is a limitation for this analysis. However, if NPS is as strongly linked to growth as has been claimed, an analysis using this number of firms could have readily identified it.
Summary, conclusions and limitations
A key selling point for using Net Promoter is a claim that it predicts, or leads to, future sales growth. These claims are very direct and bold, and strongly causal. The purpose of this study was to contribute to the body of work that has investigated, in various ways, whether the NPS is associated with business revenue growth. We firstly reviewed past work that has endeavoured to correlate NPS scores with revenue growth. The conclusion was that the evidence on this question is mixed. In the last 10 years, particularly, the strongest evidence for NPS linked to growth comes from Anselmsson and Johansson (2013), Fiserova et al. (2018) and Sauro (2019). However, in contrast Farooq et al. (2019) found a strongly negative relationship, Korneta (2018) failed to find a positive association between NPS and growth, and Van Doorn et al. (2013) found only a relationship with current growth, not future growth. Baehre et al (2022) found an association between NPS and future growth, but only when a sample including non-buyers was included, not in a model using brand buyers. Moreover, NPS was significantly associated with revenue growth in only one of four models tested, and had non-significant zero order correlation with current or future sales growth (Baehre et al., 2022 Table 2). Therefore, the evidence is far short of the strong NPS – growth link claimed by proponents such as Reichheld. While one could argue the overall conclusion here is similar to that of the seminal study by Keiningham, Cooil, Andreassen, and Aksoy (2007), the study makes a new contribution by carefully evaluating all the evidence that has accumulated since that study. Moreover, the review of published work here has also developed theoretical counter-arguments as to why certain studies that show positive support for the NPS-revenue growth association may not necessarily be valid. These may be useful for managers considering the use of NPS, or for academic discourse on the subject.
We then conducted an original empirical analysis, examining a series of US corporations over periods up to 11 years, and how their NPS scores were associated with higher or lower revenue growth over time. We found somewhat varied results depending on the precise way in which the association is measured, but overall there was not a statistically significant positive association between NPS and revenue growth. We complemented that analysis with a cross-sectional examination of insurance providers. In that analysis we found (a) directionally positive but non-significant correlations overall between NPS and present growth but also correlations of similar size between NPS and past growth; but notably (b) past growth correlated more strongly with present growth than NPS scores did.
These findings raise the question, what sort of metric is the NPS? Based on the evidence presented here, it does not necessarily appear to be a driver of growth. It appears to be more of a customer sentiment measure, strongly related to customer satisfaction but less of an indicator of actual word of mouth behaviour. It therefore appears to be an accompaniment to growth, or a reflection of present or past growth, rather than a portent of future growth.
A managerial implication is that firms should be very cautious about planning for growth predicated on obtaining high, or higher NPS scores. While obtaining a high NPS score is certainly not a bad thing, the evidence presented here casts doubt on the promise that investing in NPS measurement, analysis and related managerial interventions will have a clear link to improved revenue performance.
A limitation of this work is the scope of data. It proved difficult to find publicly available NPS scores for firms over multi-year time periods. While the number of firms analysed is modest, the study nevertheless makes an important contribution by showing – in a dataset that represents the publicly available evidence on this issue – the absence of an association between NPS and revenue over time, or across firms.
Future work may be able to obtain more in-depth data, perhaps from co-operating businesses. It may also be the case that more publicly listed companies will publish their NPS scores along with operating revenue, as Jet Blue and Delta have done. This information would enable a broader-based examination to build on the work conducted here. Another limitation is that the analysis is exclusively of US corporations. An avenue for future work is to obtain longitudinal NPS and related revenue data for businesses in other countries.
Footnotes
Appendix 1: Notes on data sources for Airlines and Supermarkets
Jet Blue revenue data was sourced from www.macrotrends.com and cross-checked via annual reports or company proxy statements via http://investor.jetblue.com/investor-relations/financial-information/reports/proxy-statements
Jet Blue NPS data was obtained from the same annual reports as the revenue data. Satmetrix also published NPS scores for Jet Blue in a report titled Net Promoter Industry Report: US Consumer 2014, via https://www.satmetrix.com/nps-benchmarks/
SouthWest revenue data was sourced from www.macrotrends.com and cross-checked via annual reports or company proxy statements via https://www.southwestairlinesinvestorrelations.com/financials/company-reports/annual-reports
SouthWest NPS data was obtained from the same annual reports as the revenue data. Satmetrix also published NPS scores for SouthWest in a report titled Net Promoter Industry Report: US Consumer 2014, via https://www.satmetrix.com/nps-benchmarks/
Delta revenue data was sourced from www.macrotrends.com.
Delta NPS data for 2010-14 was obtained from a Satmetrix report titled Net Promoter Industry Report: US Consumer 2014, via https://www.satmetrix.com/nps-benchmarks/. Supplementing the Satmetrix data was data from customergauge https://customergauge.com/benchmarks/companies/delta-airlinesandcorporatetravel.com https://corporatetravelcommunity.com/analysis/delta-aims-to-reign-supreme-in-nps-customer-service-metrics-585484
United Airlines revenue data was obtained from www.macrotrends.com
United Airlines NPS data for 2010-14 was obtained from a Satmetrix report Net Promoter Industry Report: US Consumer 2014, via https://www.satmetrix.com/nps-benchmarks/. Additional NPS data not used in the analysis was obtained from customergauge https://customergauge.com/blog/net-promoter-news-united-airlines-national-bank-of-australia-cba#:~:text=According%20to%20NPSBenchmarks.com%2C%20United,NPS%20is%20far%20from%20positive. and Forbes https://www.forbes.com/sites/danielreed/2019/09/10/why-does-delta-with-its-superior-operating–profit-numbers-have-a-lower-net-promoter-score-than-american-sometimes-numbers-lie/?sh=3e98bcd241cd
American Airlines 2010-2014 NPS data was obtained from a Satmetrix report Net Promoter Industry Report: US Consumer 2014, via https://www.satmetrix.com/nps-benchmarks/ and for 2015 from https://customergauge.com/benchmarks/companies/american-airlines-group
American Airlines revenue data was obtained from the United States Department of Transportation https://www.transtats.bts.gov/Tables.asp?QO_VQ=EGD&QO_anzr=Nv4%FDPn44vr4%FDf7zzn4B%FDQn6n
US Airways NPS data was obtained from a Satmetrix report Net Promoter Industry Report: US Consumer 2014, via https://www.satmetrix.com/nps-benchmarks/.
US Airways revenue data was obtained from the United States Department of Transportation https://www.transtats.bts.gov/Tables.asp?QO_VQ=EGD&QO_anzr=Nv4%FDPn44vr4%FDf7zzn4B%FDQn6n
Kroger revenue data was obtained from www.macrotrends.com
Kroger NPS data for 2010-15 was obtained from a Satmetrix report titled Grocery & Supermarkets Net Promoter Benchmark Report US Consumer 2015, via http://cdn2.hubspot.net/hubfs/268441/Satmetrix_2015_US_Consumer_NPS_Benchmark-Grocery_Supermarkets.pdf
Publix revenue data was obtained from Businesswire https://www.businesswire.com/news/home/20120301006135/en/Publix-Announces-4th-Quarter-and-Annual-Results-for-2011, https://www.businesswire.com/news/home/20130301005636/en/Publix-Announces-4th-Quarter-and-Annual-Results-for-2012, https://www.businesswire.com/news/home/20150302006096/en/Publix-Announces-4th-Quarter-and-Annual-Results-for-2014 and US Securities and Exchange https://www.sec.gov/Archives/edgar/data/81061/000008106114000002/publix-q4x12282013.htm and CSI Markets https://csimarket.com/stocks/singleY_growth_rates.php?code=PUSH&rev
Publix 2010-2015 NPS data was obtained from a Satmetrix report titled Grocery & Supermarkets Net Promoter Benchmark Report US Consumer 2015, via http://cdn2.hubspot.net/hubfs/268441/Satmetrix_2015_US_Consumer_NPS_Benchmark-Grocery_Supermarkets.pdf, also from Temkin Group https://dokumen.tips/download/link/temkin-group-insight-report-net-promoter-score-many-large-companies-use-net and Satmetrix 2017 NPS from a report titled US Consumer 2017 Net Promoter Benchmarks at a Glance: chrome-extension://efaidnbmnnnibpcajpcglclefindmkaj/viewer.html?pdfurl=https%3A%2F%2Finfo.nice.com%2Frs%2F338-EJP-431%2Fimages%2Fsatmetrix-infographic-2017-b2c-nps-benchmarks-glance-061217.pdf&clen=2021080&chunk=true
Whole Foods revenue data was obtained from www.macrotrends.com
Whole Foods NPS data was obtained from Satmetrix report titled 2015 Consumer Benchmark Grocery Supermarkets, http://cdn2.hubspot.net/hubfs/268441/Satmetrix_2015_US_Consumer_NPS_Benchmark-Grocery_Supermarkets.pdf
Walmart revenue data was obtained from www.macrotrends.com
Walmart 2010-2015 NPS data was obtained from Satmetrix report titled 2015 Consumer Benchmark Grocery Supermarkets, http://cdn2.hubspot.net/hubfs/268441/Satmetrix_2015_US_Consumer_NPS_Benchmark-Grocery_Supermarkets.pdf. Data for 2016-2017 was obtained from customer gauge https://customergauge.com/benchmarks/companies/walmart
Appendix 2: Data tables
NPS and Revenue, WalMart.
| Year | NPS score | Source | Company revenue (mills) | Growth | Revenue data source |
|---|---|---|---|---|---|
| 2009 | $404,254 | Macrotrends | |||
| 2010 | 41 | Satmetrix | $408,085 | 0.9 | Macrotrends |
| 2011 | 29 | Satmetrix | $421,849 | 3.4 | Macrotrends |
| 2012 | 35 | Satmetrix | $446,509 | 5.8 | Macrotrends |
| 2013 | 32 | Satmetrix | $468,651 | 5.0 | Macrotrends |
| 2014 | 30 | Satmetrix | $476,294 | 1.6 | Macrotrends |
| 2015 | 25 | Satmetrix | $485,651 | 2.0 | Macrotrends |
| 2016 | 37 | Customer gauge | $482,130 | −0.7 | Macrotrends |
| 2017 | 40 | Customer gauge | $485,873 | 0.8 | Macrotrends |
| 2018 | $500,343 | 3.0 | Macrotrends | ||
| Average NPS (2010–2017) | 34 | Average annual % growth (2010–2017) | 2.3% | ||
| Years | Correlations | ||||
| 2010–2017 | NPS and Revenue | −.23 | |||
| 2010–2017 | NPS and Growth | −.35 | |||
| 2010–2017 | NPS and next year’s Growth | −.21 |
Declaration of conflicting interests
The author declared no potential conflicts of interest with respect to the research, authorship, and/or publication of this article.
Funding
The author received no financial support for the research, authorship, and/or publication of this article.