
Abstract
Demand side management (DSM) is a strategy for district heating (DH) networks to reduce peak demand and energy costs. Traditional DSM methods apply fixed temperature reductions, assuming uniform occupant tolerance, which can limit effectiveness or cause discomfort. This paper presents findings from a longitudinal field study (2023–2024 heating season, Stockholm, Sweden) evaluating a personalized DSM approach. Using the ComfortID mobile application, approximately 70 users could accept, or abort DSM events based on individual thermal comfort preference. The results showed that about 25% of events were cancelled. Accepted events averaged a 0.8-K reduction over 22 hours and 54 minutes; cancelled events showed a 1.1-°C reduction over 76 minutes. Additionally, the study found that participants’ thermal sensations significantly deviated from the ISO 7730 standard, highlighting the limitations of generic models. Incorporating personalized thermal models doubled occupant flexibility for DSM compared to a population-based approach. The results demonstrate that integrating personalization into DSM programs can enhance flexibility and energy savings up to 28% without compromising occupant's comfort.
Introduction
Demand side management (DSM) is a key efficiency strategy for energy companies and other sectors aiming to address production shortfalls or optimize operations by reducing peak demand. While such measures may be necessitated by limited energy availability, they are also shaped by requirements on quality of service and economic viability. In some cases, reduced revenue is acceptable if production costs exceed selling prices.
For energy providers operating district heating (DH) or cooling networks, DSM typically involves temporary adjustments to the thermal energy supplied to a building's heating ventilation and air conditioning (HVAC)-system. Due to the thermal inertia of building structures, the extent and duration of these adjustments lead to varying degrees of indoor climate moderation.
The capacity to reduce peak loads depends on the degree to which indoor conditions can be altered without compromising occupant comfort. Existing DSM strategies often employ standardized temperature constraints based on presumed acceptable reductions in quality of service. However, research indicates significant variation in both thermal comfort and occupant flexibility. 1 As a result, fixed constraints may either underutilize DSM potential or cause discomfort.
This study addresses this gap by examining how DSM strategies can be improved through personalization and user flexibility. Conducted during the 2023–2024 heating season in Stockholm, Sweden, the study involved approximately 70 occupants across 60 rooms in 12 residential sites and one office building. In shared spaces, a compromise was implemented to account for individual thermal preferences amongst present occupants. Participants were also empowered to adjust or cancel DSM events and to engage in other energy-saving measures, such as thermal setbacks.
The approach builds on the concept of participatory control, inspired by research into personal comfort systems, which seek to create localized micro-climates tailored to individual needs, offering enhanced comfort with lower energy use. 2 However, current personal comfort systems often require stationary behaviour or wearable devices, which are impractical in private residences. This study extended the concept of ‘personal space’ to encompass entire rooms, thereby introducing a more feasible application principle for personal comfort systems in residential settings, albeit with potentially lower energy-saving margins. The system is designed to integrate with existing hydronic HVAC infrastructure, making adoption technically, practically and financially viable.
Relevant studies
DSM has been identified as a promising strategy for improving energy efficiency while maintaining thermal comfort. 3 HVAC control can be implemented either centrally at the power injection point or locally at room level heat exchangers. Regardless of the control level, poor usability of HVAC interfaces has been noted as a barrier to user engagement. 4 This may be due to human acclimatization, where physiology adapts to the environment, reducing users’ motivation to manually adjust settings.
This challenge is particularly pronounced in shared spaces, where thermal comfort is often defined by statistical norms and formalized in standards such as thermal neutral zone. 5 These standards, while useful, may fail to satisfy individuals with preferences outside the norm. 6 Addressing such limitations requires a holistic approach that considers transitions between shared and private spaces, and their varying acclimatization demands. 7
While energy cost savings remain a key DSM objective, comfort-related trade-offs are frequent. Ghilardi et al.
8
demonstrated potential energy savings of up to 80% in simulations, with temperature fluctuations up to 4 °C. Cai et al.
9
showed that shifting loads to periods with lower marginal costs could reduce energy expenses by 11%, while maintaining indoor temperatures within
Hamp et al. 14 implemented a model predictive control logic that respects comfort constraints (e.g. a 0.5°C maximum temperature reduction) and showed effective results during a one-year simulation in Stockholm's climate. Pre-heating strategies further improved the system's load reduction potential. However, most of these DSM approaches still rely on static definitions of acceptable load reductions and overlook user-specific flexibility.
Recent studies have deepened the understanding of thermal comfort dynamics. Sevilgen et al. 15 used numerical modelling to explore air flow, heat transfer and moisture transport in relation to comfort. Ozcelik et al. 16 studied human-building interaction under multimodal discomfort and found that blinds were adjusted in 57.8% of discomfort cases, suggesting behavioural triggers were used for adaptive conditioning strategies. De la Hoz-Torres et al. 17 carried out a seasonal field study of naturally ventilated university classrooms in southern Spain. They determined neutral temperatures of 23.5 °C (autumn), 23.1 °C (winter), 23.3 °C (spring) and 23.9 °C (summer), and established 90% acceptability ranges per season. A statistical analysis based on survey data collected in China's hot summer and cold winter climate zone under mixed-mode heating and cooling conditions was presented. 18 Their main finding showed that during ‘transient’ seasons, thermal sensations are proportional to outdoor temperature. Wu et al. 19 developed a parametric modelling framework integrating XGBoost and a multi-objective genetic algorithm to optimize both the spatial configuration and thermal comfort of traditional Beijing Siheyuan courtyards. Their model efficiently generated renovation schemes that improved PMV scores while preserving traditional architectural symmetry. Meanwhile, Bera et al. 20 conducted a year-long field study in coastal eastern India, combining household surveys and environmental monitoring to evaluate seasonal indoor heat stress, identifying key thermal discomfort symptoms and proposing targeted bioclimatic design strategies to improve comfort in low-cost rural dwellings. Another interesting study by Nambiar et al. 21 examined three single-family houses in Alaska equipped with connected heat pumps, analysing the energy-saving potential of DSM in relation to thermal comfort. However, the reported discomfort was not used to assess individual flexibility. Moreover, the study's methodology is not feasible for long-term implementation, as thermal comfort data were collected through occupant surveys, a method that is too cumbersome over extended periods and remains decoupled from the control of HVAC-systems.
Abdelrahman et al. 22 demonstrated improved comfort prediction (by 14–28%) using an enhanced building information model validated in a net-zero building. Deng et al. 23 created a smart HVAC control system using real-time physiological data, achieving comfort improvements in 95% of cases, while cutting heating and cooling by 90% and 30%, respectively.
Behavioural science supports using prompts to influence action, 24 yet financial incentives (e.g. via home energy reports) have shown limited success.25,26 Instead, participatory control using subjective feedback, such as occupant thermal votes, has emerged as an alternative. 27 ThermoVote is one of such systems, but it lacks persistent user profiles. 28 Other works have discussed the advantages of personalized thermal profiles.6,29,30
Sensor-based comfort solutions requiring indoor location data may be more precise but also costlier.31,32 As a more cost-effective alternative, some systems use GPS data from mobile devices. 33
Controlled temperature drift is another promising avenue. Intentional comfort reduction can prompt user feedback while supporting acclimatization. Studies have explored how controlled drifts can encourage more sustainable setpoints and conditioning behaviours.34,35
While DSM holds great promise, space conditioning remains one of the largest energy consumers, and thermal comfort remains the main constraint on further gains. 36 To the authors’ knowledge, no existing studies simultaneously consider both personal thermal comfort and flexibility in the context of real-life DSM events.
Research gap
The reviewed literature highlights a critical gap that this study aimed to address: the lack of integration between DSM strategies and personalized thermal comfort. In particular, the following shortcomings have been identified: Existing studies do not simultaneously address the full range of aspects, such as personal thermal preferences, dynamic flexibility, usability and energy system performance, nor do they present techno-economically feasible solutions to optimize both production and consumption in thermal conditioning. Most current DSM implementations rely on static and uniform temperature reductions. This overlooks the diversity in personal comfort preferences and flexibility, which limits the potential for peak shaving and demand responsiveness. Several studies are constrained by simplified conditions, such as a limited number of thermal zones, short evaluation durations, single-occupant scenarios or neglect of occupants’ awareness, adaptive behaviours and spatial usage patterns.
This article addresses these gaps by proposing an approach that enables participatory control of thermal environments based on individual occupant feedback, offering a pathway toward more nuanced and effective DSM implementations.
Contribution
This study contributes to the domain by investigating the interplay between thermal comfort and demand-side efficiency through a participatory control framework. The novelty lies in the integration of personalized thermal comfort as a dynamic and actionable input within DSM strategies. Unlike conventional approaches that assume static or population-averaged comfort parameters, the proposed method recognizes the variability in individual preferences, flexibility and behavioural responses. By incorporating real-time occupant feedback into the control logic, the approach enables adaptive conditioning that aligns with both energy efficiency goals and individual satisfaction.
Methodology
Gathering meaningful, near real-time data from occupants during DSM events presents challenges. 37 The fragmented management of HVAC-systems often prevents urban occupants from cancelling DSM events even when these negatively impact their thermal comfort. Additionally, mitigation strategies employed by occupants to address discomfort are typically not tracked or are generalized rather than personalized. Consequently, DSM strategies often assume uniform consent and comfort across all occupants, which can compromise both the user's experience and efficiency.
This study addresses these challenges by introducing a bidirectional communication channel between energy providers and end users. This channel enables tracking of occupants’ thermal comfort on an individual level and allows for dynamic adjustments of thermal energy supply, even during DSM events.
The system emphasizes financial benefits through energy savings offering following features: Manual and automated absence handling to reduce energy use while avoiding freeze damage. Seasonal adaptation to support natural acclimatization. Configurable participation in DSM events. Personalized climate control based on users’ preferences, with a system that gradually ‘forgets’ old preferences to adapt to evolving comfort expectations. Configurable temperature setbacks.
While individualized climate control works well in private settings, it becomes more complex in shared environments. This study explored the intricate relationship between thermal comfort and energy efficiency in both individual and shared residential spaces.
Study setup
Overview of the experiment
The system was deployed in 12 residential sites and one office building, with 67 thermostats installed during the heating season 2023–2024 (1st October 2023 to 30th April 2024)). Approximately 70 users registered in this study. However, only the data of 39 users were analysed due to their active participation, while the other registered individuals did not provide sufficient data points during the experimental periods. Installation occurred progressively, and one site uninstalled the system during the heating season, leading to fluctuating numbers of thermostats, connected rooms and active users.
Bidirectional communication channel
A bidirectional communication channel was implemented between the energy provider and the occupant to explore the relationship between thermal comfort and energy-efficiency measures. This channel was realized via a set of graphical user interfaces (GUIs), accessible through all smart devices.
The ComfortID application, available at www.ComfortID.org, was used to serve as the medium through which occupants communicated their thermal sensation and preferences and configure personal participation in DSM events. Simultaneously, energy providers used the platform for production planning, incorporating occupants’ configurations and zone-specific data to forecast the potential for DSM participation. Abortion signals from users during DSM events were sent back to the provider to allow real-time adjustments in the production plan. The application was designed to follow users across any building type, including residential, commercial and institutional contexts, enabling consistent comfort management regardless of location.
Building and HVAC characteristics
All residences in this study were heated by centrally controlled, hydronic radiator systems, and all were supplied by a DH network except one that was supplied by a heat pump. Figure 1 illustrates a district comprising 90 terraced houses, one of which was equipped with the ComfortID system. As the entire district was supplied by the DH network, hourly consumption data for heating were available for all houses.
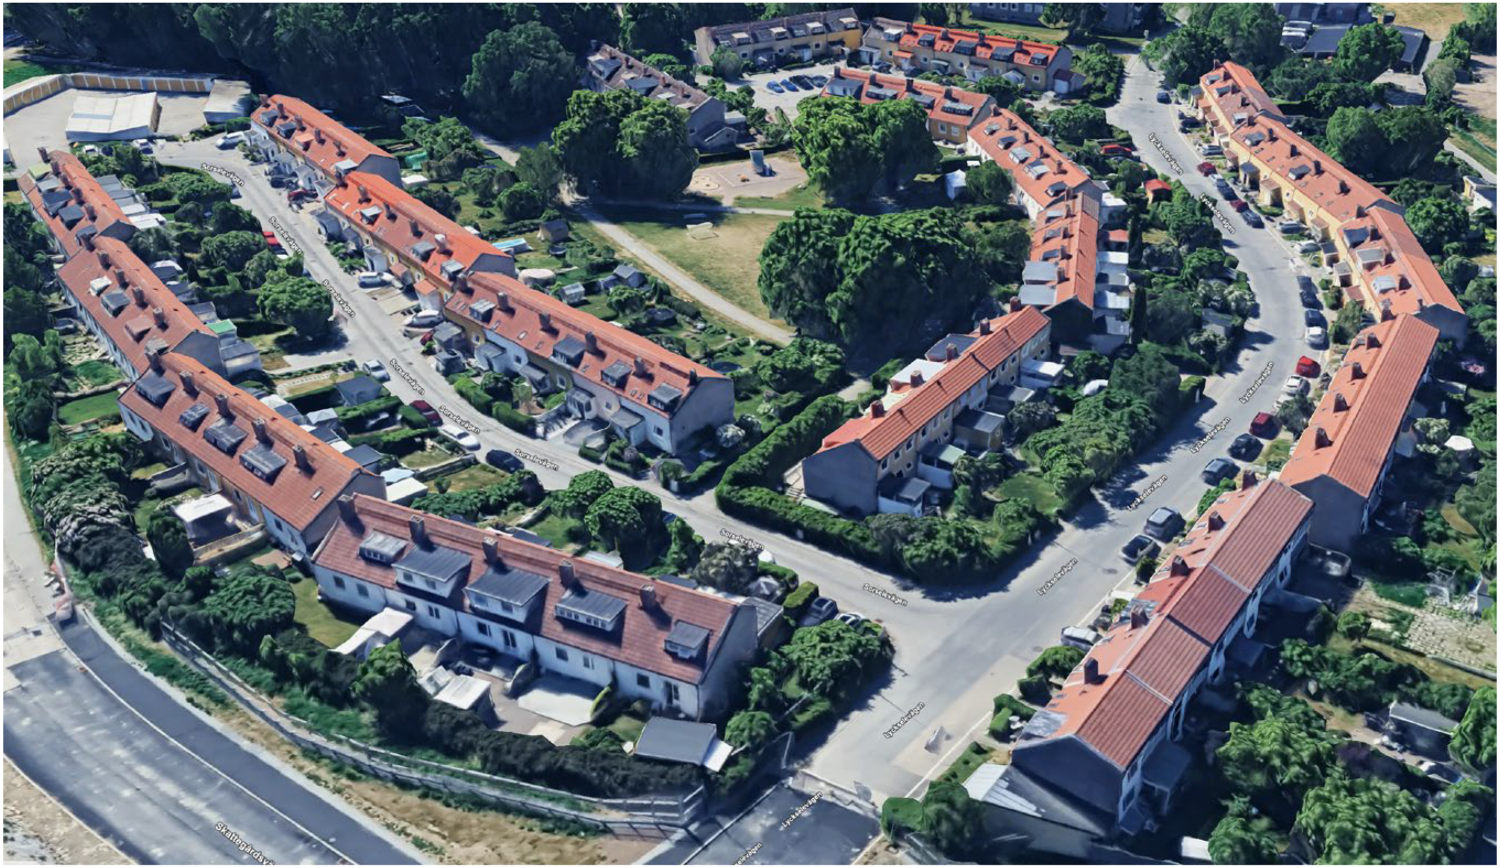
Residential row house district in Stockholm, Sweden where one of the residences had ComfortID installed. (Source: Google Earth).
Indoor climate conditions were monitored via sensors integrated into electronic thermostatic radiator valves (eTRVs), allowing for automated setpoint control. This control was based on users’ preferences submitted through the ComfortID platform, combined with occupancy information derived from global positioning system (GPS)-enabled end devices.
User interaction design
Bias was minimized by the deliberate design decision to omit numerical temperature displays on the main page for thermal sensation submission (see left panel of Figure 2). Two main assumptions underlined this choice: (a) numerical values may bias subjective comfort perception 38 and (b) setting fixed target temperatures may reduce the flexibility necessary for effective DSM participation.
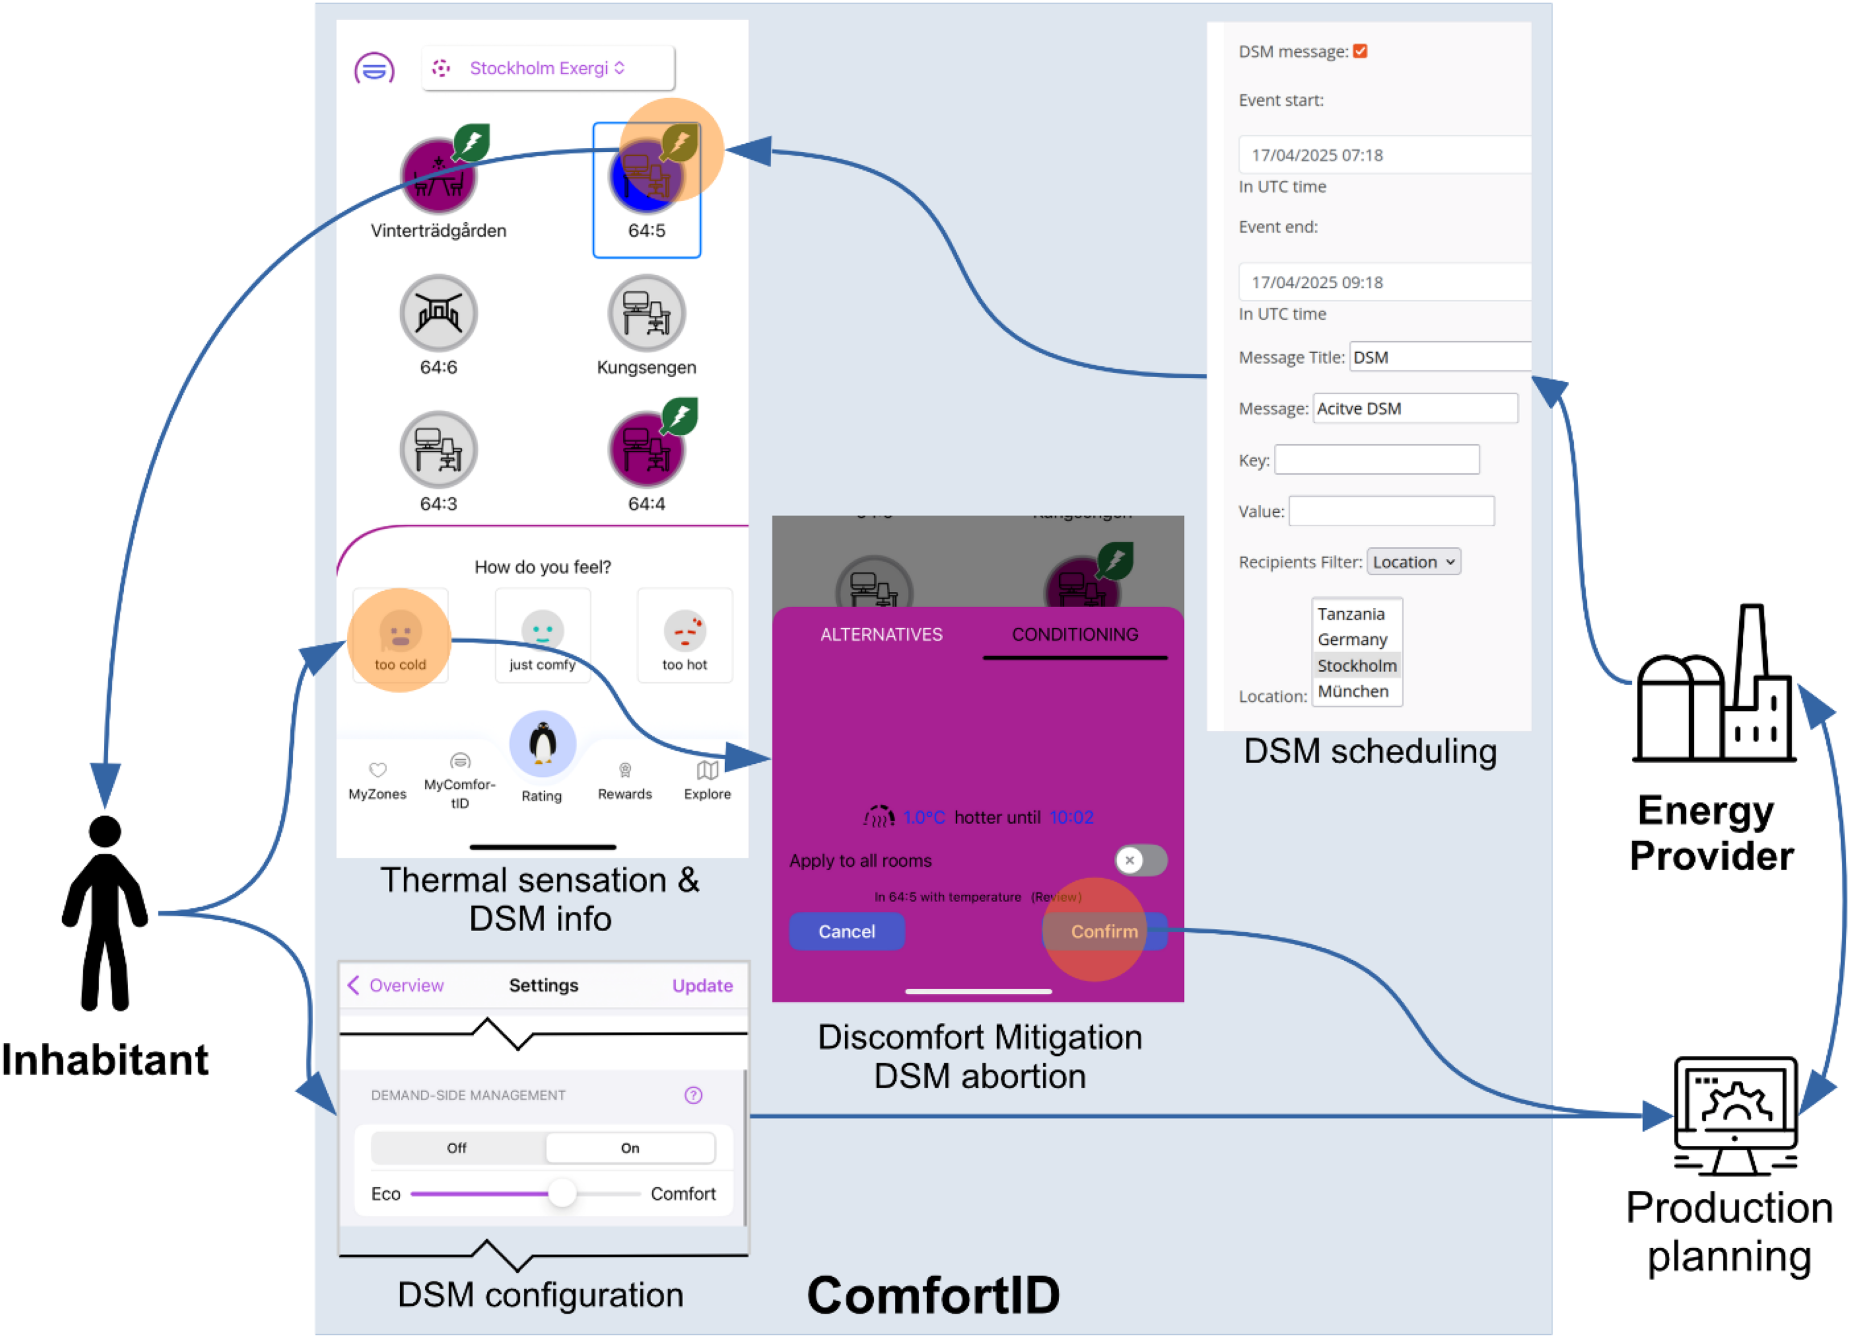
GUI of the ComfortID mobile application, illustrating the bidirectional communication channel concerning DSM.
At the beginning, users could control the room temperature only through preference indications, setbacks or away-mode activation. However, in response to users’ feedback during the field study, aligned with findings from a previous study. 39 A numeric temperature range (minimum 1°C) was introduced. This feature was intentionally optional (default: no limits) and made secondary in the interface design to maintain a balance between user control and system-driven flexibility. During the field study, users were asked to regularly submit subjective thermal comfort ratings through the ComfortID app. Feedback was collected using a simplified thermal sensation scale, allowing users to indicate their comfort level without numerical temperature values. During active DSM events, users received push notifications and could either passively accept participation or actively abort the event if discomfort arose. In addition to comfort ratings, event participation choices and optional free-text comments on discomfort mitigation strategies were recorded.
User presence and zone management
Users’ presence was determined using geofenced zones. Each ‘zone’ is an area in which users can rate thermal conditions, and, if ComfortID was integrated with the building's HVAC, the climate can be automatically adjusted to suit individual preferences.
Zones may be private (e.g. residences), public (e.g. offices) or hybrid (e.g. hotels). Zones consisted of one or more rooms. In private zones, occupants were assigned to specific rooms, and thermal conditioning was dynamically controlled based on the presence of each individual as determined by a comprehensive geofencing logic applied across all participating zones. When an occupant left the premises, thermal conditioning in their assigned room was reduced or suspended, while the comfort preferences of remaining occupants were maintained without compromise. This presence-aware control strategy has enabled significant energy savings while preserving individual thermal comfort.
A personalized thermal model was developed for each user, based on subjective ratings, indoor conditions and external weather data. This model was fitted using a sigmoid function that relates indoor setpoints to outdoor temperatures and was implemented through an eTRV with a proportional integrative derivative (PID)-control logic that also measured indoor temperature and humidity, thereby enabling automated conditioning.
In shared rooms, the system computed a consensus temperature trajectory that could reconcile all occupants’ preferences via configurable compromise rules. 40 In unoccupied rooms, the eTRV would revert to a predefined ‘vacancy temperature’. Occupants may also use the app to manually select discomfort mitigation strategies such as increasing room temperature, adding insulation or consuming a hot beverage.
DSM event execution
DSM events are centrally scheduled by energy providers based on predicted peak loads and affected geographical areas. For the purpose of this study, one of the authors scheduled events and selected times that approximated actual peak loads in Stockholm's DH network.
Once planned, the application calculated a temperature offset for each site, based on user-defined willingness and extent of contribution (default: –1.5 °C). Vacancy settings could override this offset. At the event start, users received a push notification and the app GUIs update to indicate an active DSM event (e.g. green leaf icon in Figure 2). The set temperatures on the eTRVs were adjusted according to the average offset across users. Users may abort the event if discomfort arises. Users could choose amongst three activation options for DSM events: (a) off, (b) on with explicit confirmation via push notification (default) and (c) automatic. Due to limited engagement with the second option, the system was simplified to a binary choice (on/off), with automatic activation as the default. This aligns with the findings 4 that most users rarely adjust thermostat settings.
Participant recruitment and demographics
Participation was voluntary and no financial incentives were provided. Basic demographic information, including age, gender and household size, was collected during registration. However, detailed demographic analysis is beyond the scope of this paper.
Data analysis
To investigate the interplay between individual thermal preferences and participation in DSM events, data were collected continuously from October 2023 to May 2024. The dataset included user-generated comfort ratings, eTRV setpoints and actual temperatures, user presence (based on geolocation and manual overrides) and participation logs from scheduled DSM events.
Comfort ratings, recorded via the ComfortID app, were the primary metric for evaluating perceived thermal comfort. These ratings were submitted voluntarily by users and were time-stamped and spatially linked to specific rooms and zones. Each rating contains the thermal preference of the users with regard to indoor and outdoor conditions.
All statistical analyses were conducted using Python (v3.10) and the statsmodels, pandas and scikit-learn libraries. Data visualizations were created using matplotlib.
Thermal comfort analysis
The seasonal adaptation feature consisted of gradually reducing the indoor conditioning. Instead of using a trigonometric function like the previous study, 38 the indoor set temperature was linearly reduced from October 2023 to May 2024 for all participants in this study. Initially set to a reduction of −3 °C at the end of the heating season, users’ discomfort led to an adjustment of the offset to −1 °C starting 28th October 2023.
Due to the personal adaptation of thermal conditioning in rooms, vacancy detection and collective usage of rooms, the assessment of the effectiveness of this feature could not be based on measured room temperature. Instead, the correspondence between the timely development of thermal expectations of an occupant and the reduction in indoor conditioning due to the seasonal adaptation feature was analysed.
The thermal expectation of an occupant was described by a parametrized sigmoidal function

The analysis of thermal comfort relative to the outdoor climatic conditions was twofold. First the votes were grouped according to bins of outdoor temperature. This would allow the understanding of the dependency between sensations and outdoor temperature. The second analysis was performed by trying to estimate a joint probability density estimation based on two classes comfortable and uncomfortable, that is all too cold or too hot sensations. For the comfortable class a Gaussian mixture model was used. For estimating the probability of being uncomfortable a support vector machine was used. Both distributions were combined using Bayes theorem of joint probabilities and using a sigmoid inversion to the discomfortable probability density function. Furthermore, the votes were statistically analysed as they are well described by ISO 7730 standard 41 respecting indoor humidity.
No filtering was applied to the raw data in all cases.
Thermal preference modelling and flexibility definition
The analysis of thermal sensation across a population was based on grouped subjective thermal sensations
Population-level analysis
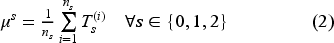
The population-level average temperature


Individual-level analysis
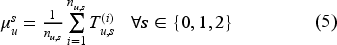
The characterization of individual behaviour was based on the average temperature
The individual flexibility

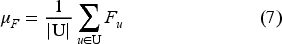
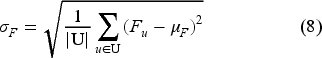
These metrics quantify variability in thermal preferences amongst individuals, enabling comparison between population-level and user-specific flexibility.
App usage analysis
The number of thermal votes submitted by users over time was modelled using an exponential decay function as given by Eq. (9). This equation helps to determine the system's ‘half-life’ and its learning phase through parameter

In Eq. (9),
The parameter
Setback analysis
Setbacks (temperature schedules) are configurable by users, with options to adjust settings based on room category and weekday. Analysis of these settings can reveal mismatches between manual setback configurations and thermal comfort, providing insights into user preferences for energy-saving measures.
Thermal comfort during DSM events
This paper examines how occupants’ comfort is affected during DSM events, focusing only on those that resulted in measurable temperature changes. Events without temperature measurements, those overlapping with vacancy periods or those that did not alter the set temperature on the eTRV (indicating no DSM command received) were excluded.
In some cases, the valve position remained unchanged because the set temperature was either always above or below the measured temperature. These cases were still included, as adjacent rooms could influence the room's temperature.
Events were categorized into three types: finished as planned, cancelled by the user via the app, or implicitly cancelled due to heating from an alternate source before the event's end. Finished events were considered accepted, while cancelled events indicated discomfort. Temperature variations during events were classified into idle (no change), reduction and increase. If the temperature increased early or reached a local minimum in the first half of the event, it was categorized as implicitly cancelled.
The acceptability of DSM events was primarily evaluated based on the resulting temperature reduction, which can cause discomfort during the heating season and whether the events were explicitly or implicitly cancelled by the occupant. Events that were completed without cancellation were classified as acceptable. Additional parameters analysed included the event duration and the drift rate defined as the ratio of temperature reduction to event duration. The temperature reduction was determined by calculating the difference between the temperature at the start of the event and the lowest recorded temperature (either the last local minimum or the overall minimum) during the DSM period. The event duration was determined as the time between the event's start and the timestamp of this minimum temperature. Figure 3 illustrates the measured temperature profile of a finished DSM event.
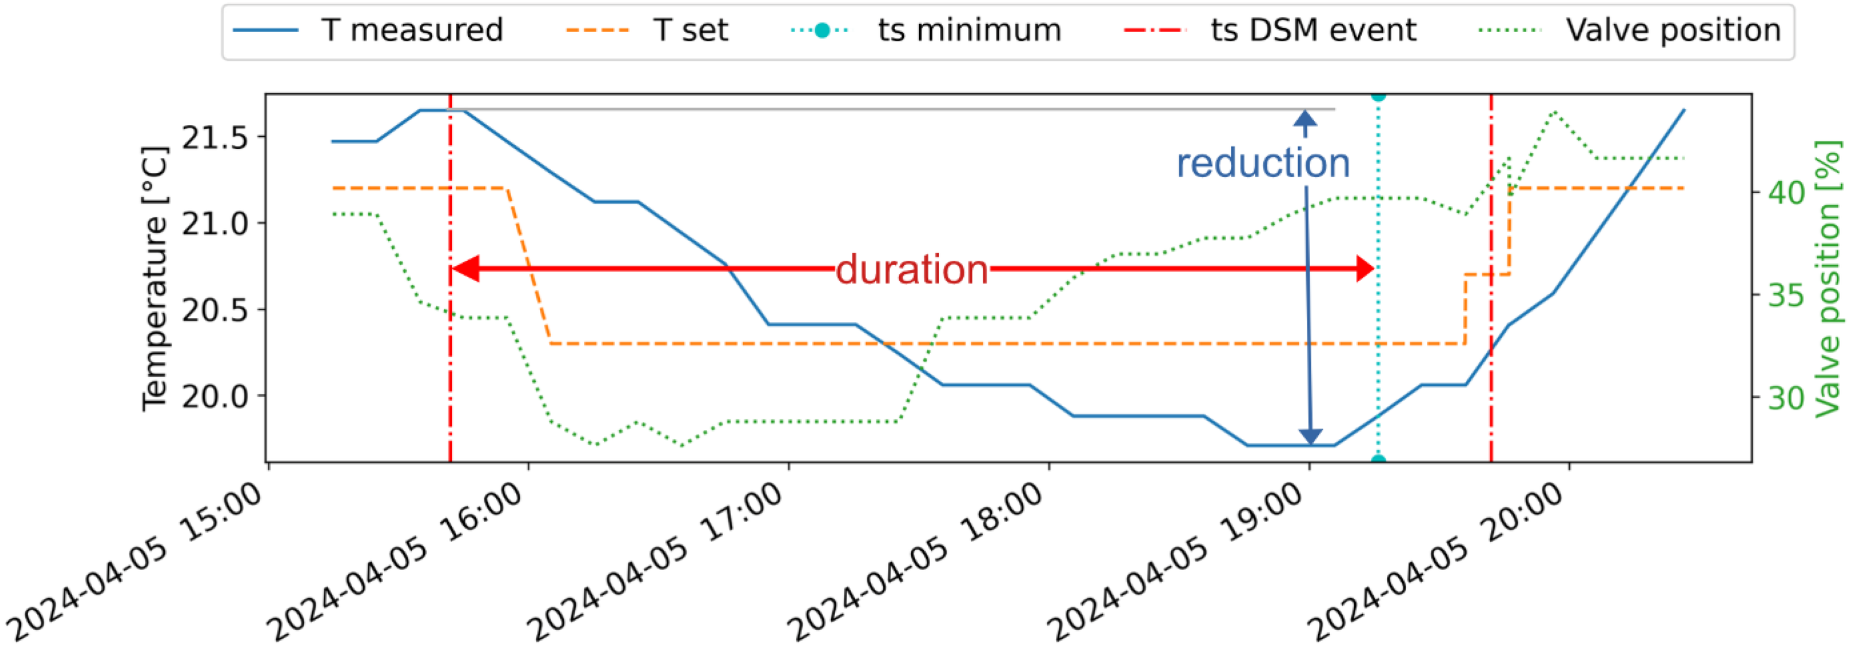
Measured temperature profile of a finished DSM event. The vertical lines represent timestamps ts: the planned DSM event's start and end is represented by a dash dotted line. The minimum in measured temperature T (presented one timestep after last minimum) determines the overall duration and reduction of a DSM event.
Additionally, the compatibility of DSM measures with occupant behaviour was assessed by quantifying the interaction between vacancy periods and DSM events. Users’ willingness to engage with the system was measured by counting the number of modifications made to the settings.
Results
This section presents the key findings of the study, structured according to the main research objectives. We began by analysing the usage patterns of the application, which provide insights into how quickly the ComfortID application can learn and adapt to individual users’ thermal preferences. Understanding this learning behaviour is crucial, as it forms the basis for subsequent analyses on the development of personal preferences over time.
Usage of the applications
The application was designed to not unnecessarily engage the users. Therefore, it is a clear intention that the users should not engage often with the app since the automation hidden from the user's awareness would successfully adapt the indoor climate to their individual preference. Whether this objective is attained is somehow verifiable through the visualization of the users’ votes. In attempt to get a more representative picture, the voting frequency is not represented relative to the timeline, but relative to the duration since initial setup as presented in Figure 4. The fit of an exponential decay would enable the determination of the half-life: After 41 days the app usage would be reduced by half. Whether the objective of successful automation of the indoor climate conditioning is achieved can be determined according to the constant offset of the exponential decay which is 7.2 votes/week for all votes. However, if only considering uncomfortable ones, that is too cold or warm, could result in a negative constant of −2.8 votes. For interpretation of this constant one should bear in mind that this is the cumulative amount over a whole population of 39 individuals.
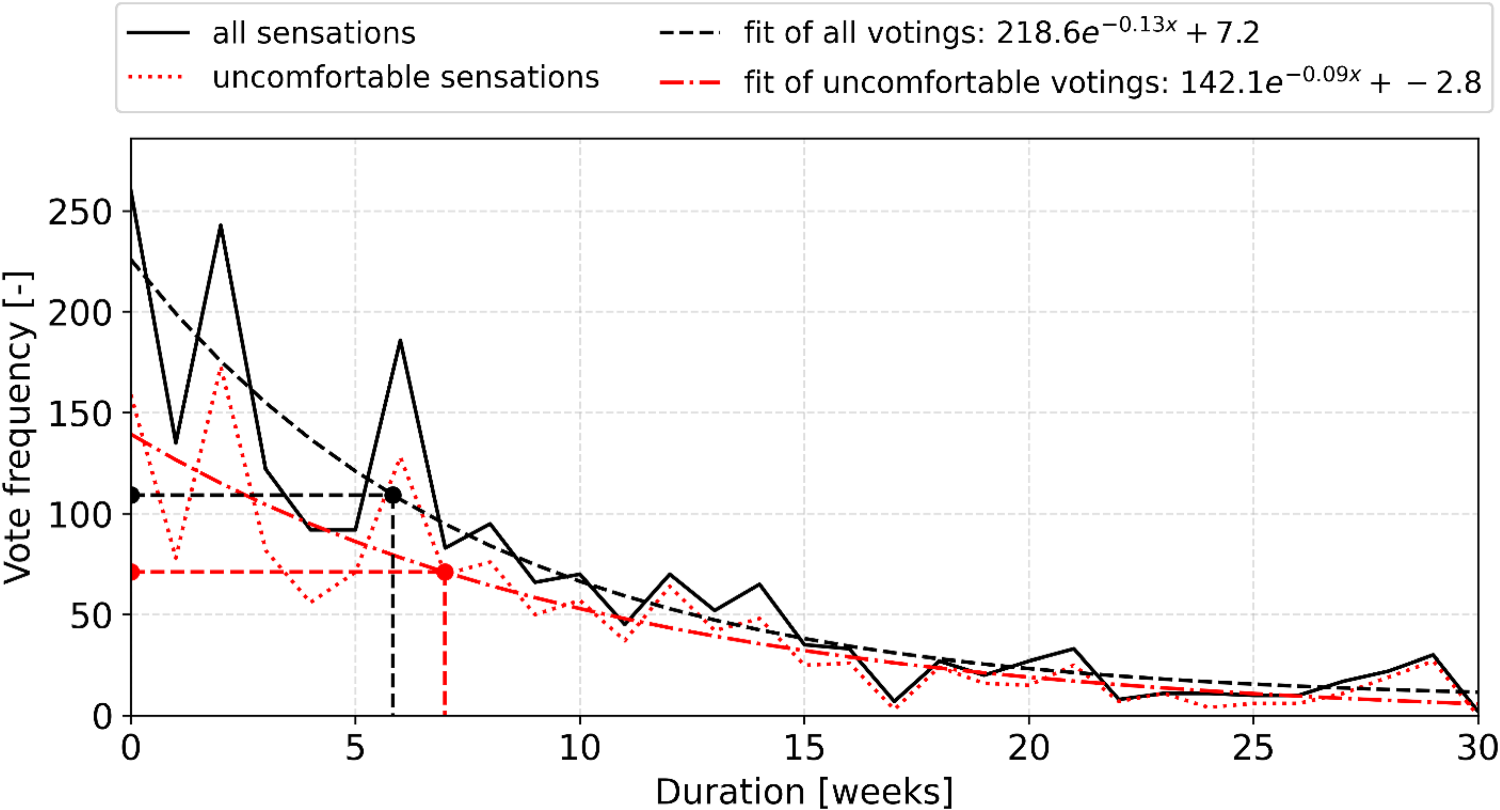
Number of votes for all users with at least one vote (total = 39) according to individual duration since initial setup. Based on the fitted exponential decay, the half-time constant for all sensations can be evaluated to 41 days, and slightly longer for uncomfortable votes (49 days).
The development of the frequency of automatically detected and manually declared vacancies is represented in Figure 5 filtered only for the zone where eTRVs were installed. There was no significant decline in manual vacancy frequency (p-value one-sided: 0.066), but a significant increase in the automatic one (p-value one-sided: 2.9e–05) at a significance level of
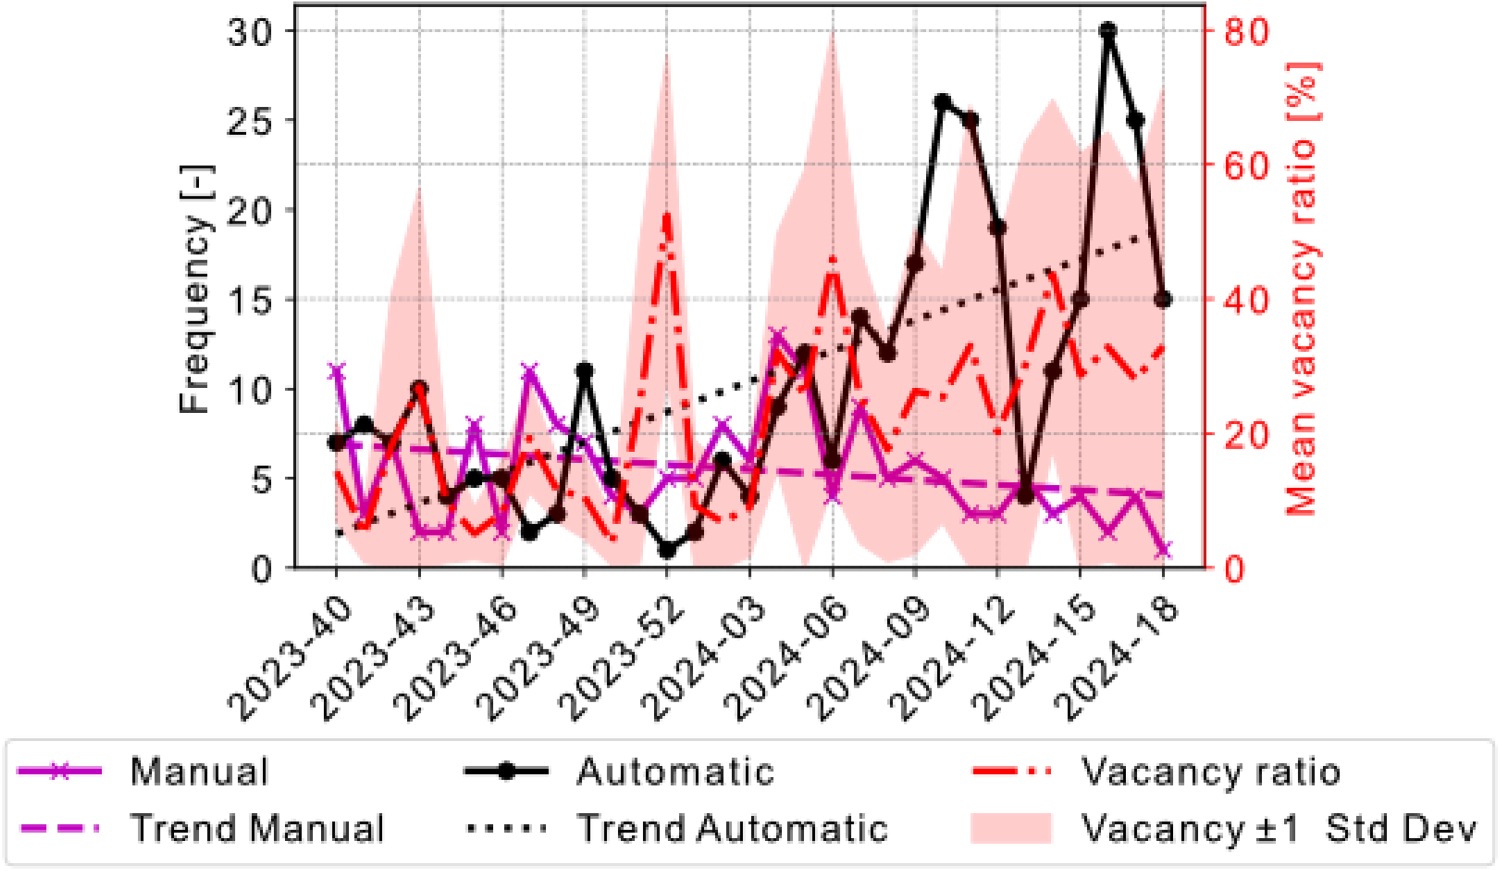
Weekly development of vacancies for two categories: ‘manual’ indicates vacancies explicitly declared by users, while ‘automatic’ refers to those inferred via the application's geofencing logic. The red line represents the mean weekly vacancy ratio, with the shaded area indicating one standard deviation. Percentages denote the average share of time sites were vacant during a week.
Occupants’ reaction to DSM events
Occupants did not change settings that allow to deactivate DSM events or changed the temperature offset. Only four distinct users aborted load reductions. Amongst them, only two did it consciously based on a qualitative survey submitted to all participants.
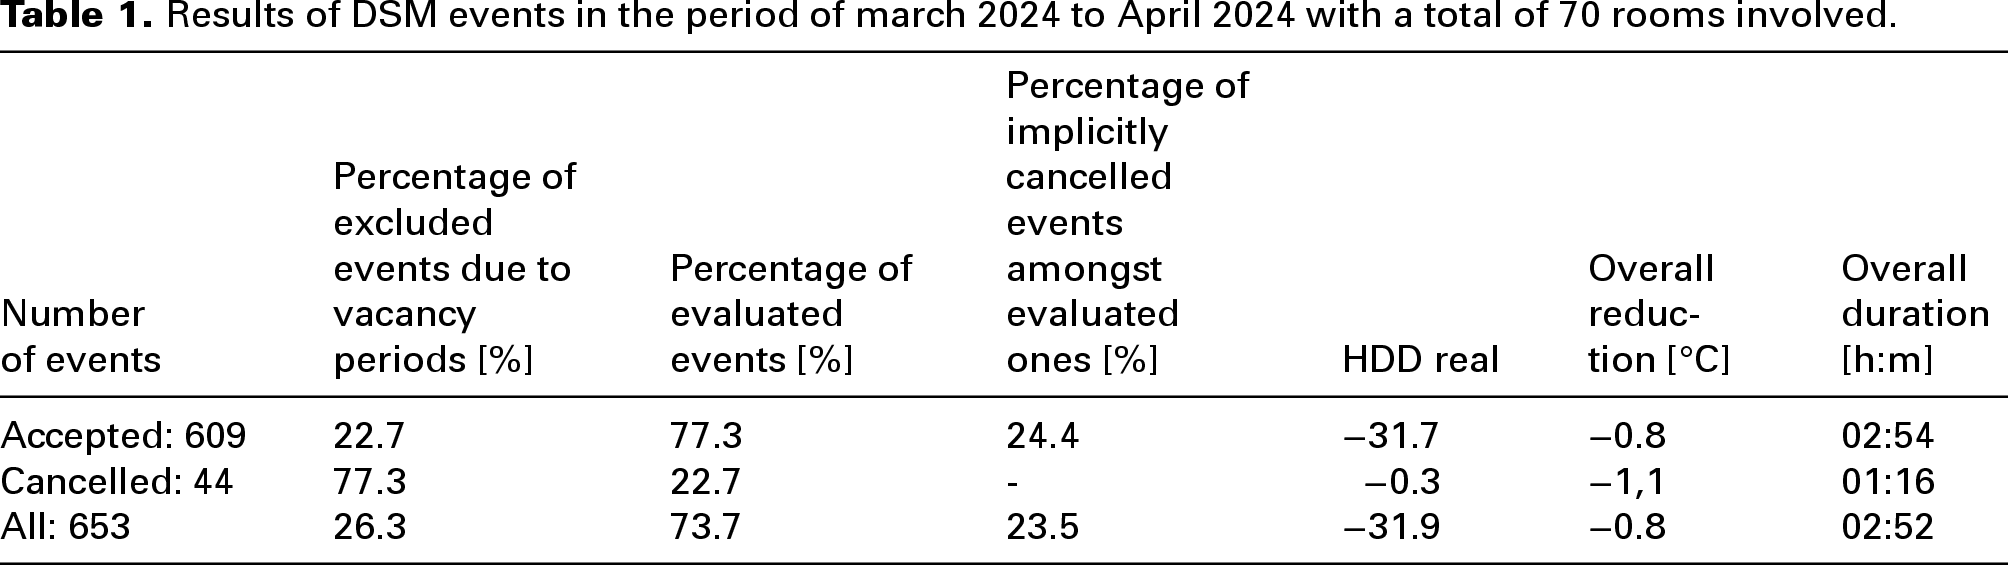
Table 1 shows results about DSM events from the field study. During 26.3% of all DSM events there was an overlap with a vacancy-period. Amongst these events, there was 20.4% of all overlapping vacancies that ended causing most likely a rise in energy consumption for restoring higher conditioning levels. 6.7% of all events have been explicitly cancelled during execution. 24.4% of the finished ones have been implicitly cancelled. It means that the room temperature has risen from the start of a DSM event or that a rise in temperature occurred in the first half of the planned event duration. Summing up the two categories, means that 26.0% of all DSM events have been either consciously and unconsciously cancelled since they caused discomfort. The mean temperature reduction for finished events was −0.8 °C where the minimum temperature was reached after 2 hours 54 minutes. Cancelled DSM events lasted 76 minutes on average and caused a mean reduction of −1.1 °C.
Results of DSM events in the period of march 2024 to April 2024 with a total of 70 rooms involved.
In Figure 6, the statistical representation of the impact of DSM events on indoor temperature is shown. In the scatter plot of Figure 6(a), the duration of each DSM event from the planned start to the time when the minimum temperature was reached was compared against the maximal temperature reduction. Horizontal patterns in the plot correspond to the planned duration of DSM events. This is because, for most DSM events, the minimum temperature was reached near the planned end time. The temperature reduction distribution resembled an exponential decay pattern, with larger reductions becoming less frequent, reaching up to −4 °C (as shown in the top bar plot of Figure 6(a)). The distribution of drift rates for all events that caused a temperature fall is presented in Figure 6(b). The mean negative drift rate for cancelled events was −1.0 °C/h, while for accepted events, it was −0.3 °C/h.
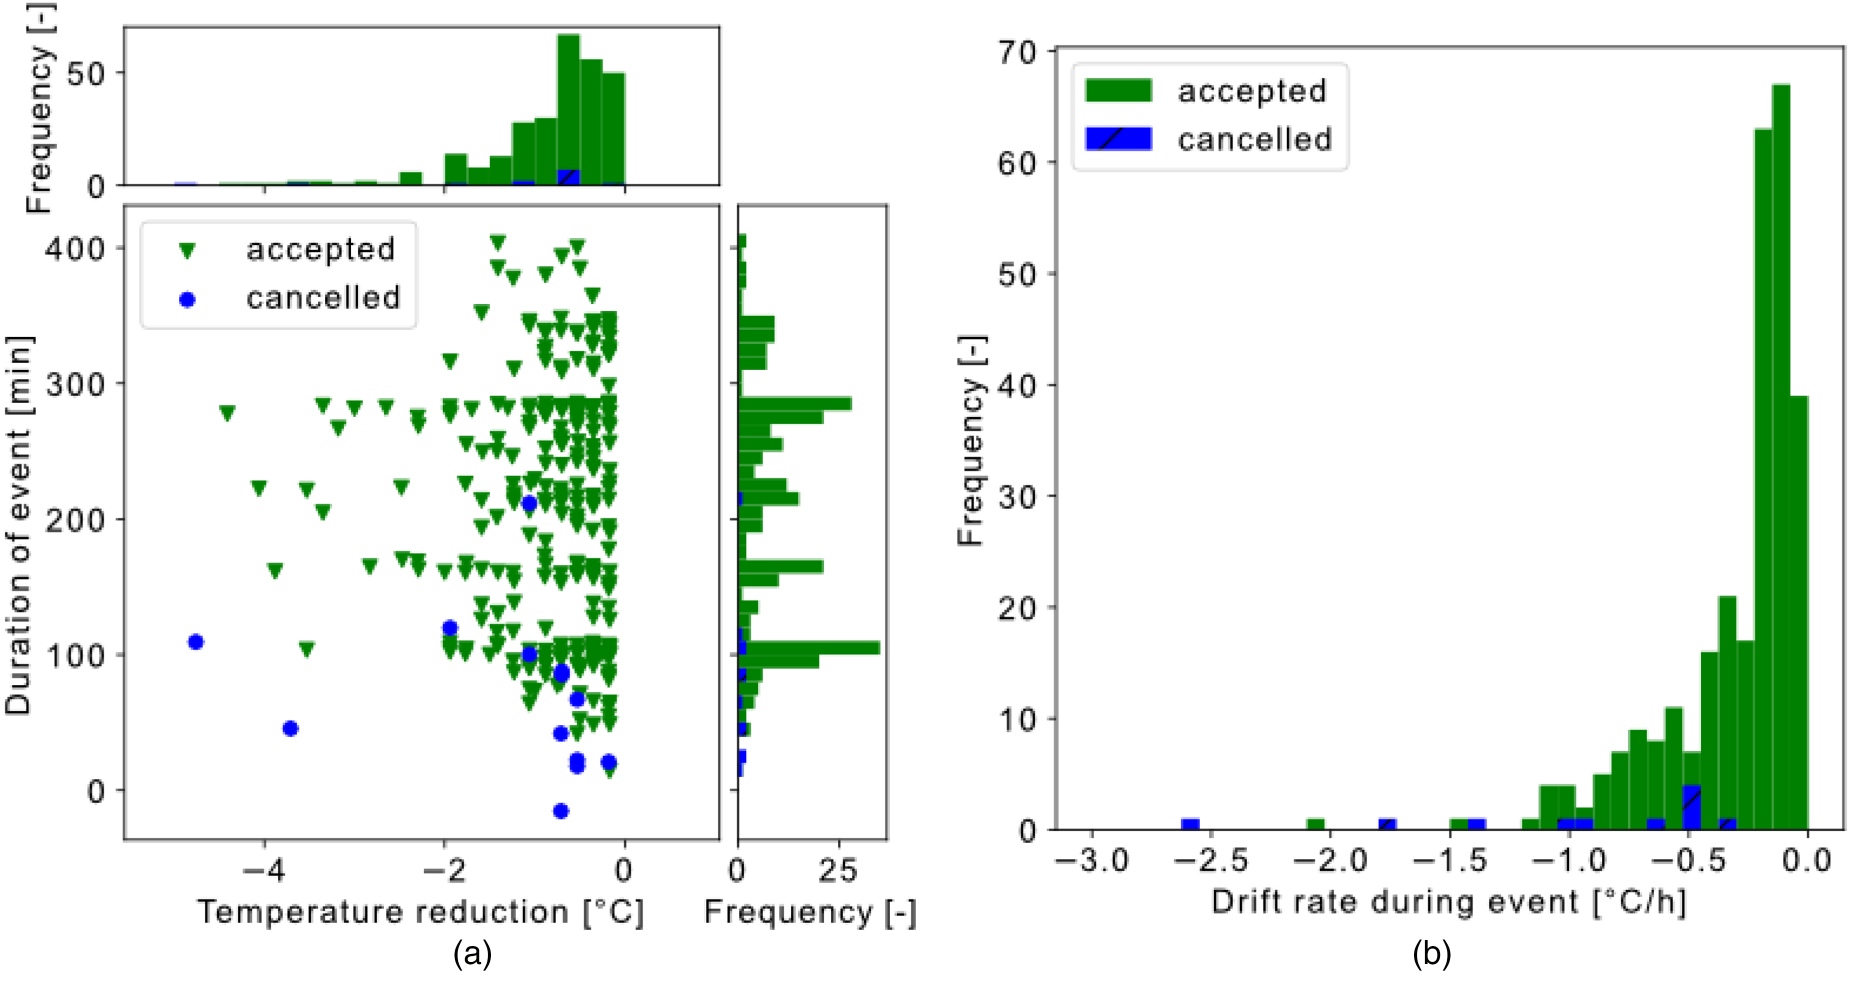
Statistics about all DSM events causing a temperature decrease. Results were based on 296 events observed in residential buildings between March 2024 and April 2024. The status label ‘accepted’ includes all completed events, while ‘cancelled’ also accounts for implicitly cancelled events.
Setbacks
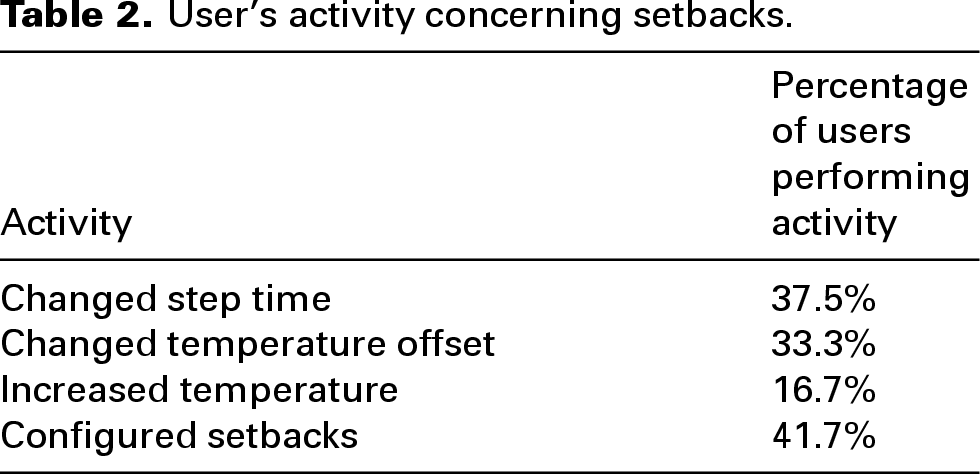
In Table 2, presents a summary of activities that the 24 users have performed. 41.7% did change either the step time or the temperature offset. Most of the users that changed step time also modified the temperature offset. Only 16.7% of users did use the capability to increase the temperature during a certain period of time.
User's activity concerning setbacks.
The default foresees a −1°C offset during the night from 22:15 in the evening till 6:00 in the morning. As presented in Figure 7, these main steps were almost unchanged. However, users tend to desire more offset during the night. Between 12:00 and 18:00, a slight increase in temperature was noted. A more detailed analysis in relation with each user, showed that most of the users did not configure any temperature offset in that time period and only few did increase the temperature during that time period.
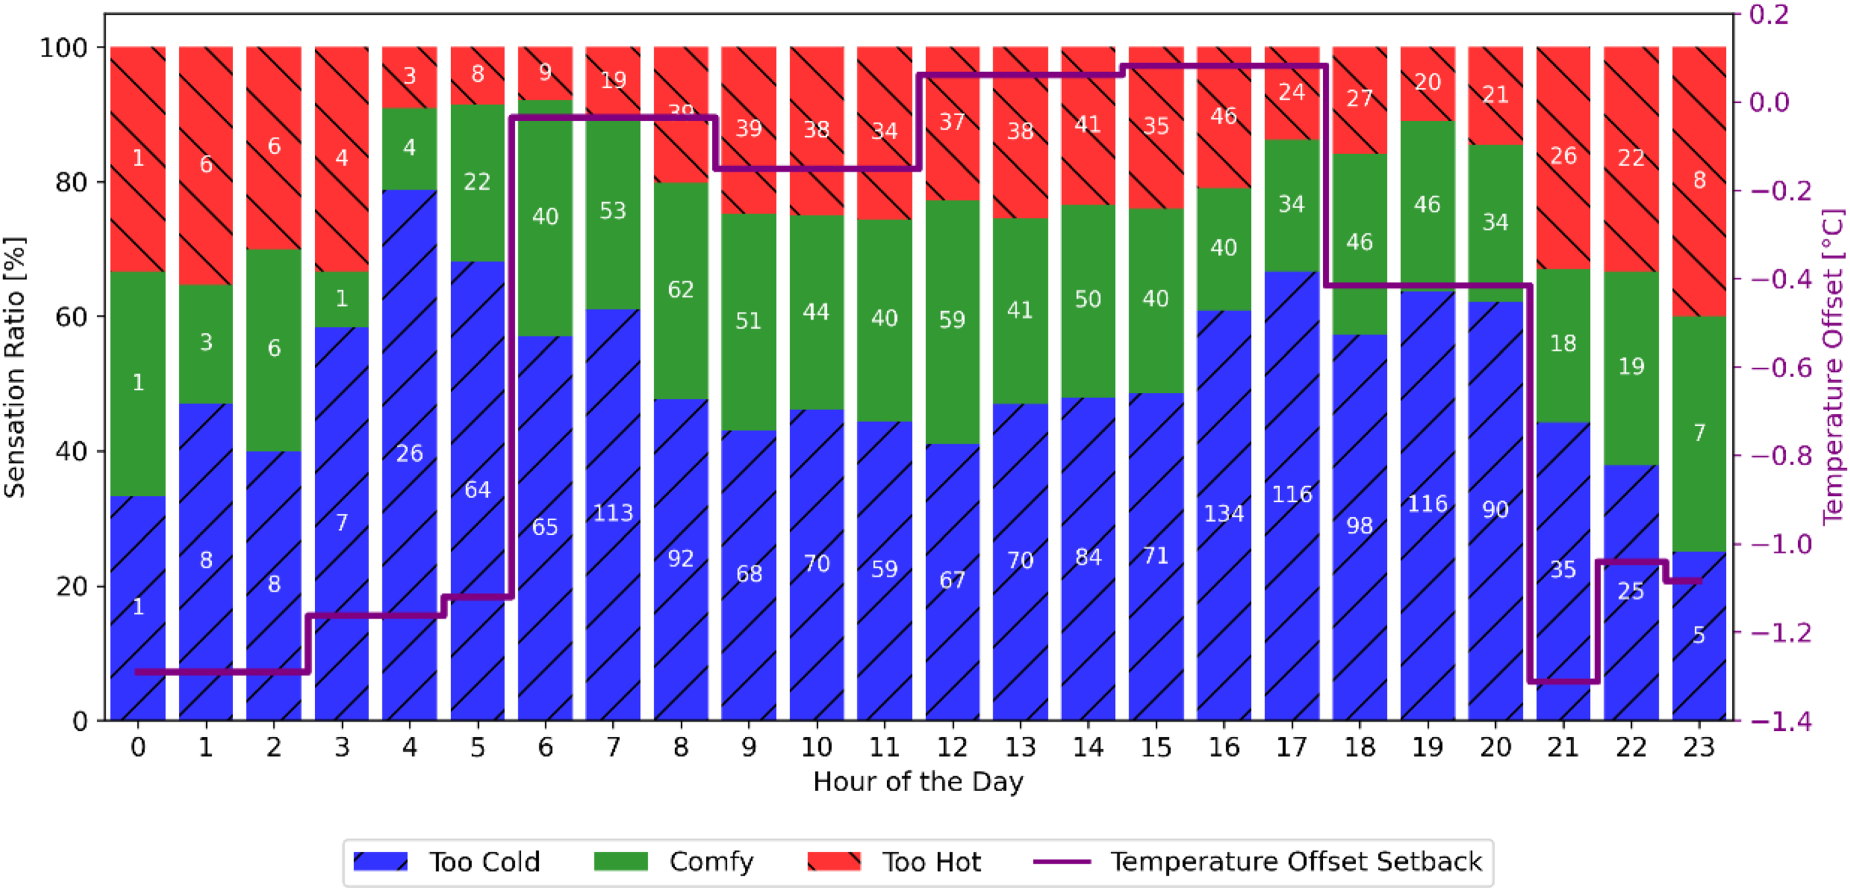
Mean offset for all setbacks and the sensation ratio according to the hour in the day.
Thermal comfort, flexibility and seasonal adaptation
The analysis of thermal comfort is quite challenging since an occupant has no urge to indicate comfortable conditions. Nevertheless, as presented in Figure 7 relative to the hour of the day several comfortable, that is no change preferences have been saved. The total number of votes was low during the night lasting from 21:00 to 3:00 in the morning and as higher ratios of too hot votes. There was a higher tendency to experience too cold indoor climate in the morning around 4:00 and evening hours around 17:00. Even if the total number for the time period between 21:00 and 22:00 was not very high, the users felt too hot while in the previous hour they predominantly felt too cold.
The development of personal thermal expectations (see Eq. (1)) is represented in Figure 8. The same graph shows the seasonal adaptation by a temperature offset and the mean of cumulative difference in thermal expectations of all users. The duration of half-life was removed from the first rating since it was not representative of the development of expectations but of the learning phase of the system. The individual values were interpolated linearly and resampled by a weekly frequency. Two statistical analyses were performed to express whether the seasonal adaptation was an efficient measure to moderate indoor conditioning: a linear regression and a Spearman rank correlation test. The linear regression analysis produced a slope of
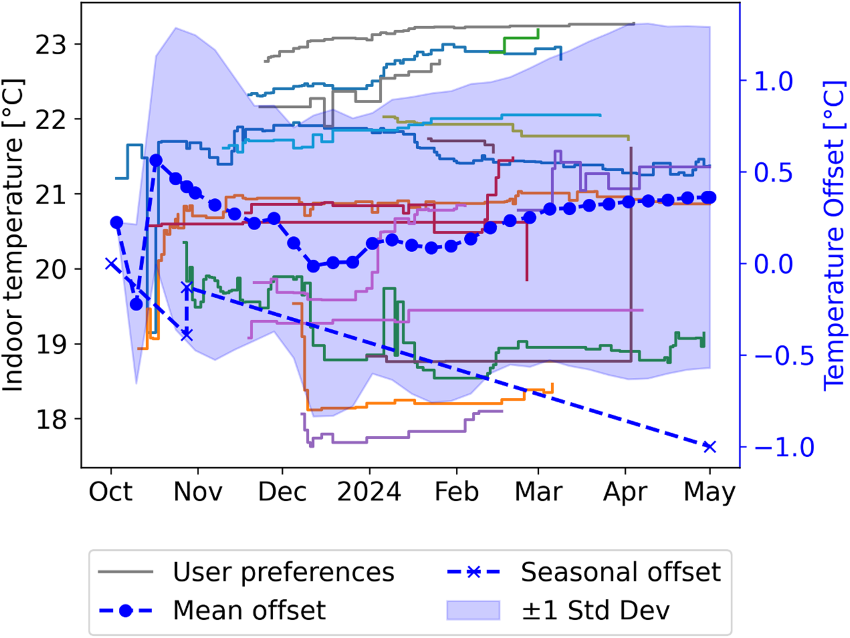
Development of thermal expectations
Thermal preferences and flexibility were analysed according to the previous section, both at the population level and for individual users. The results are presented in Figure 9, where top diagram (a) shows the aggregated population-level analysis, and bottom diagram (b) illustrates a deviating individual case. In total, 18 users satisfied the condition specified: 8 were women, 10 were men and 2 were children. Assuming that flexibility during the heating season can be quantified as the temperature difference between the mean of neutral (comfortable) and cold sensations, the population-level flexibility was calculated as
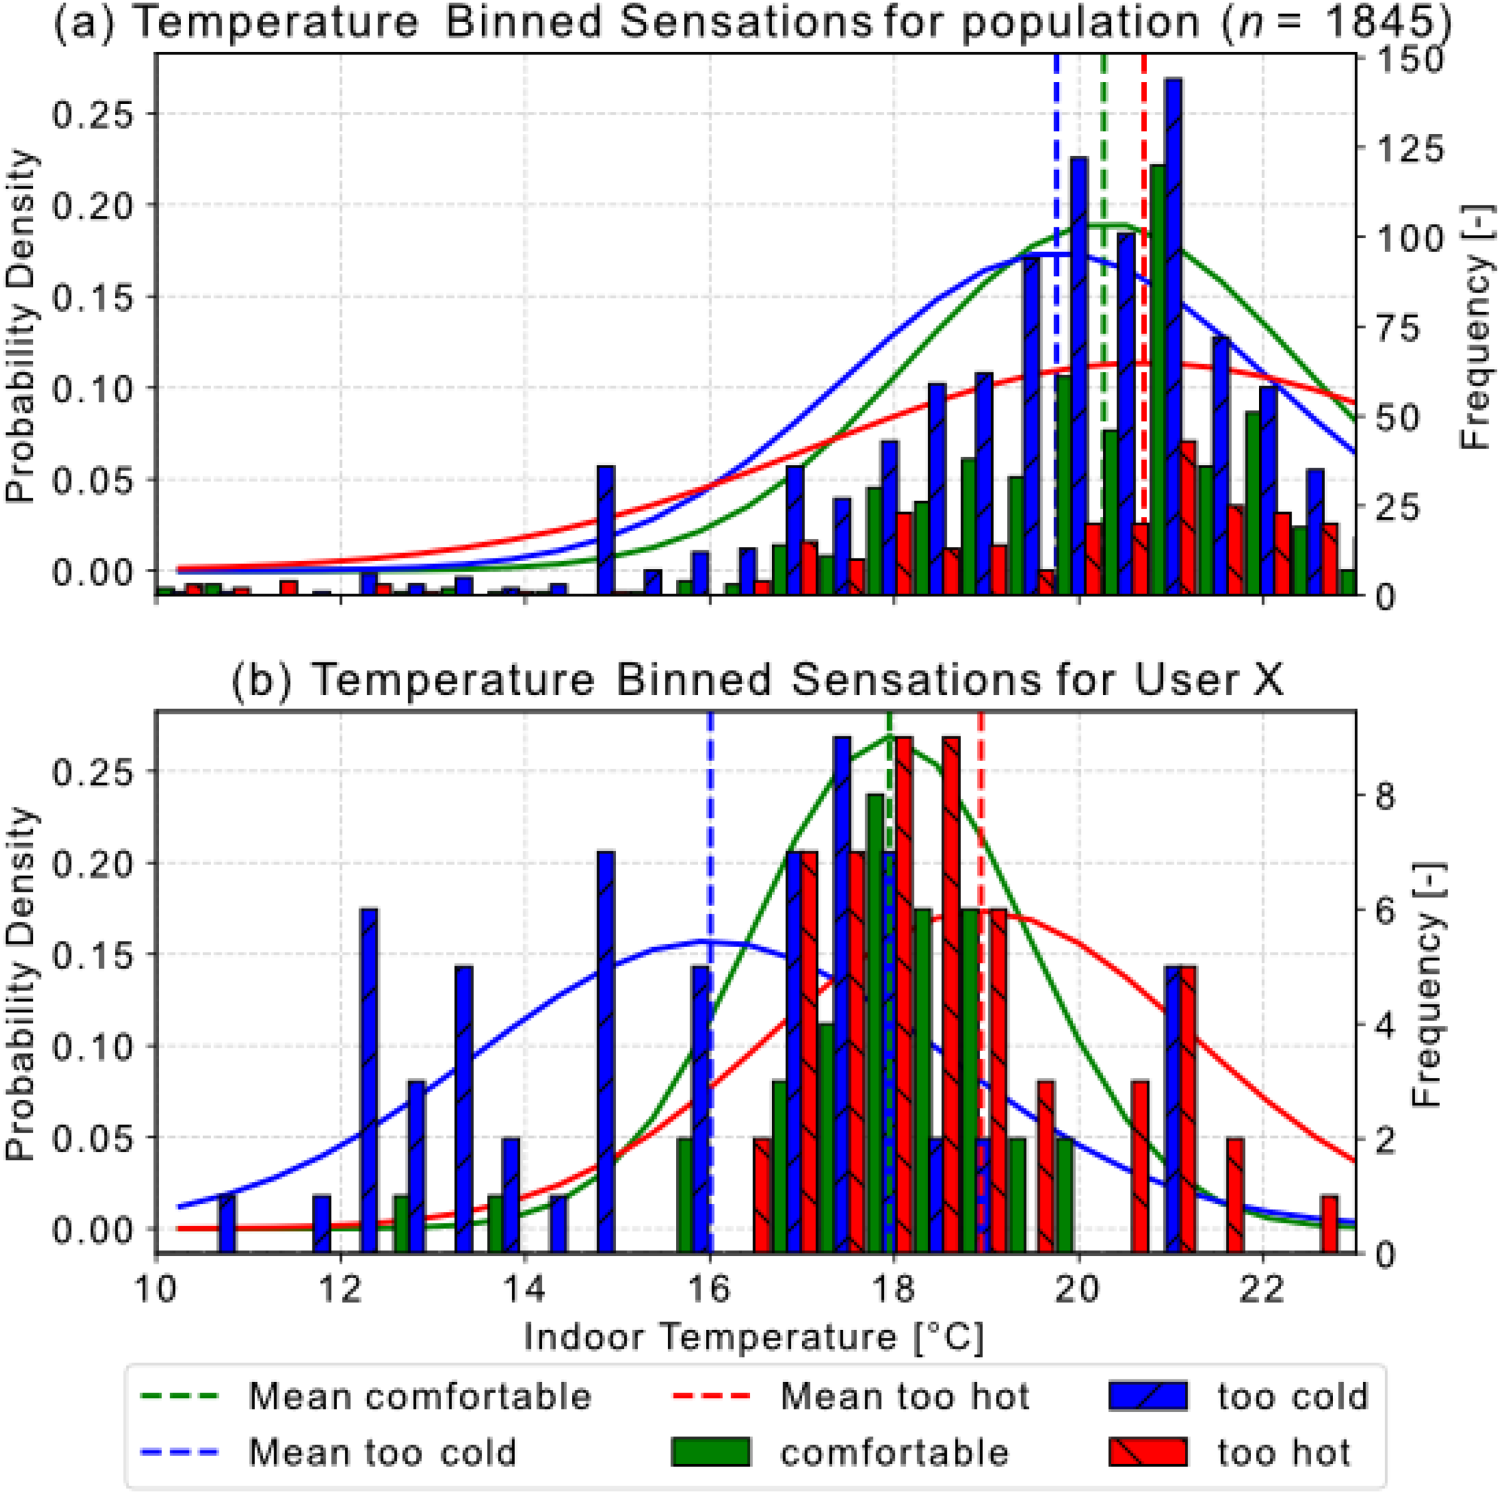
Frequency plot of sensations binned by indoor temperature and fitted normal distribution for a population of 18 users (a) having more than two ratings for each sensation. The population-level flexibility is
The assessment whether there is a significant positive linear relationship between personal mean comfortable indoor temperature level
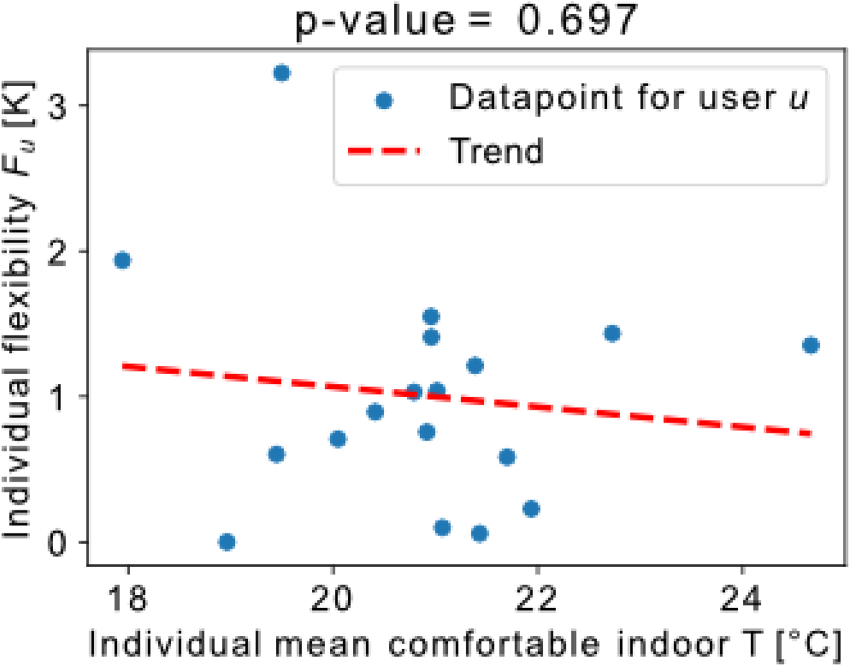
Analysis of relationship between individual comfortable indoor temperature level and flexibility. The trend shows that indoor temperature is not directly proportional to flexibility.
The regression yielded a slope of
Figure 11 shows the thermal comfort of all participants subjected to various environmental conditions. In Figure 11(a) the joint probability density distributions relative to indoor and outdoor temperatures is represented. The repartition of the comfortable region was delimited by the isoline of 80% of probability limited between 0°C and 15°C outdoor and 20°C and 23°C indoor temperatures. The sensations of being ‘too warm’ also occurred below 15°C indoor temperature.
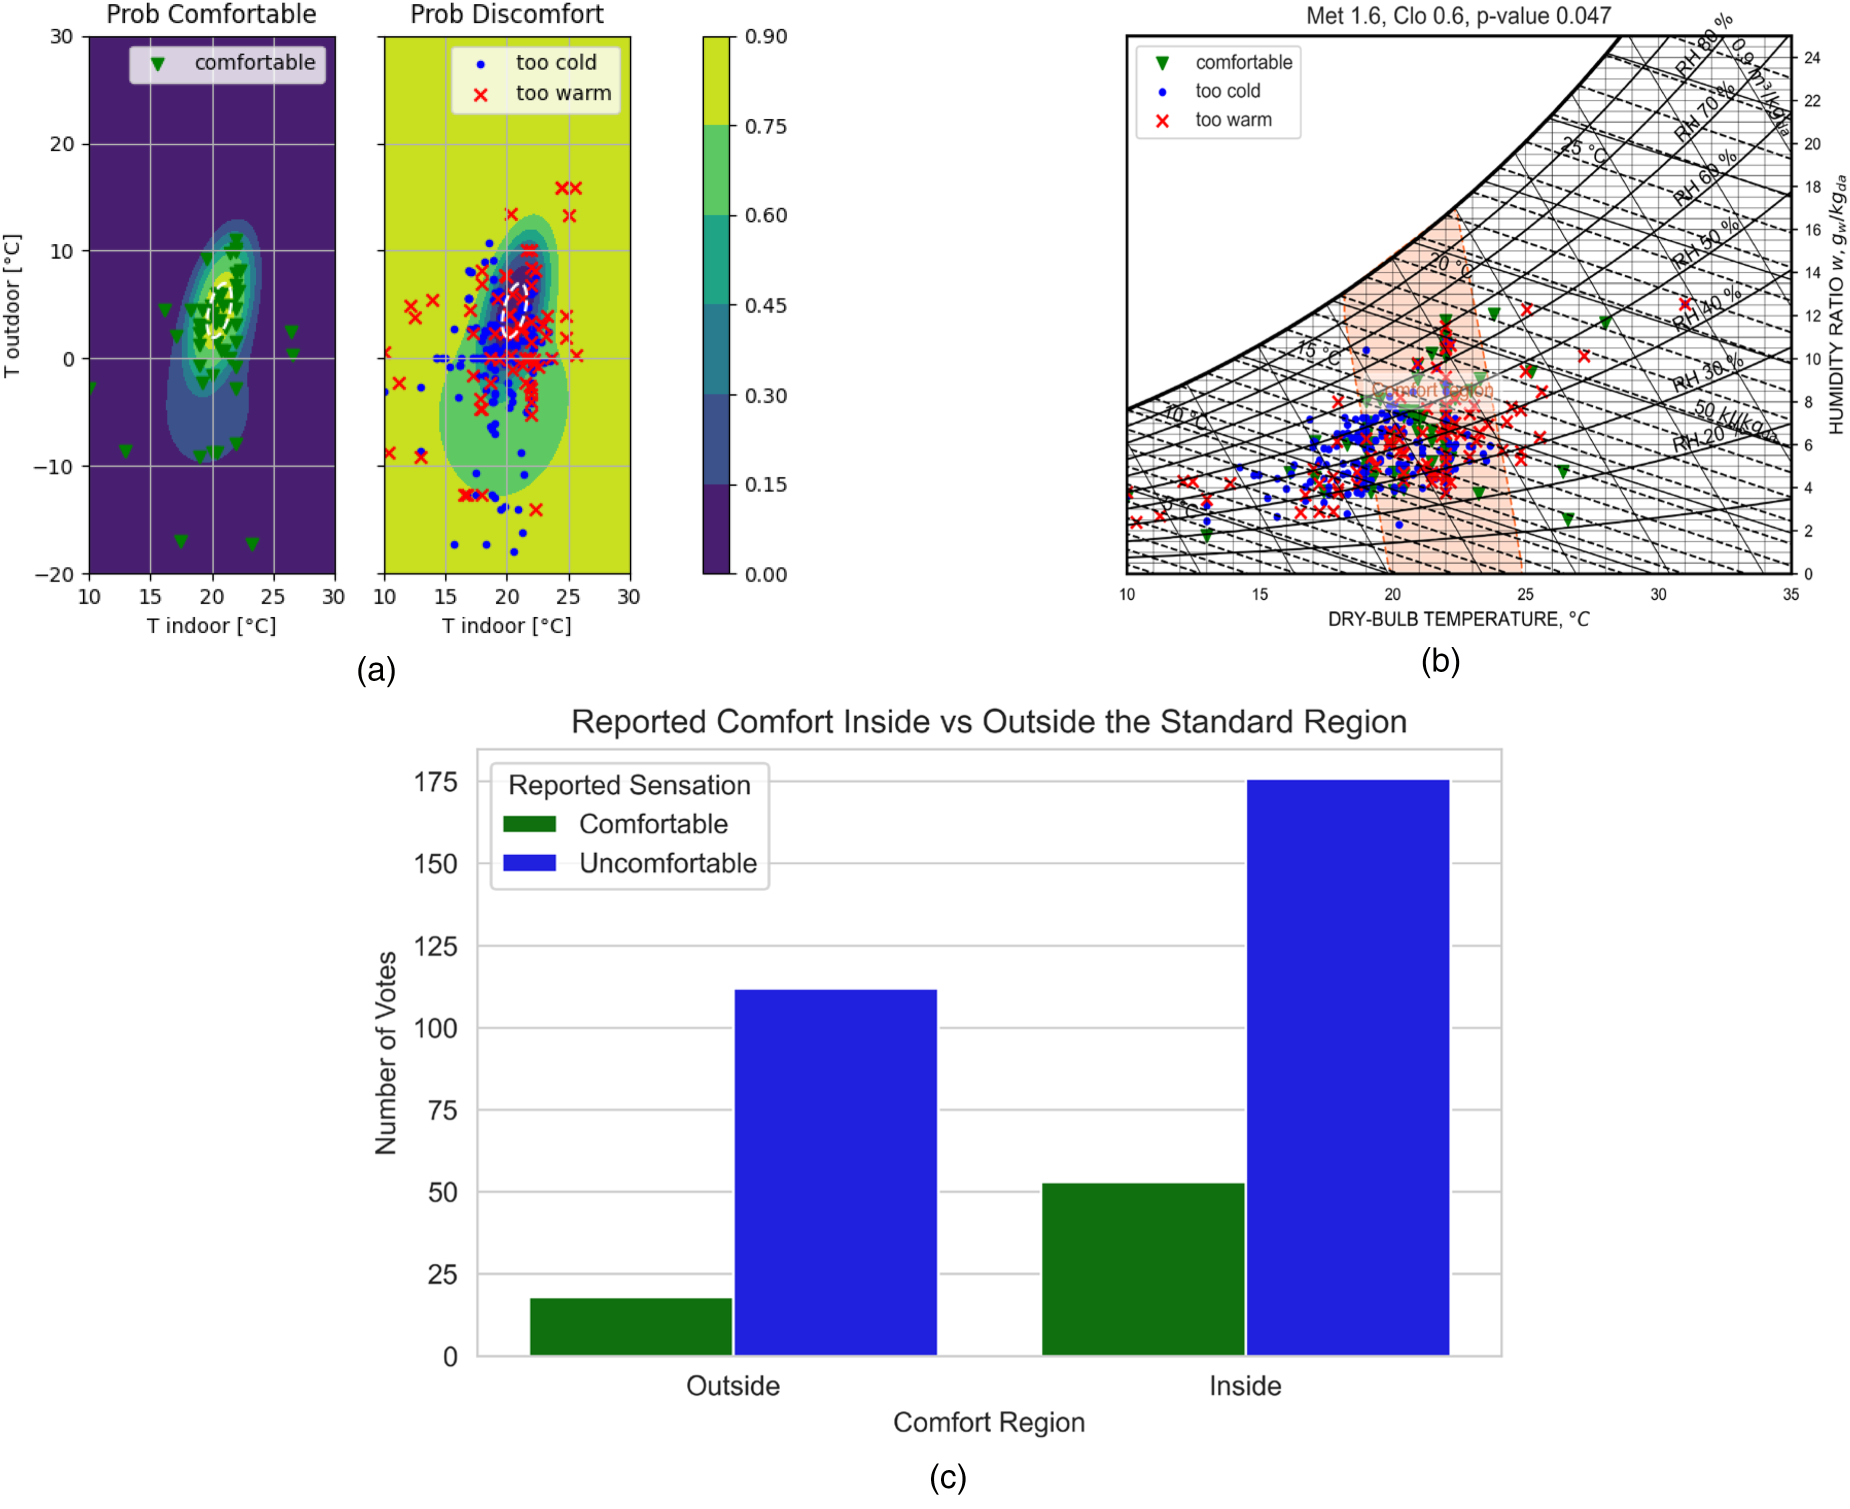
Thermal comfort relative to various environmental conditions.
In Figure 11(b), a psychometric graph shows the occupant-reported thermal comfort votes and a comfort region for specific metabolic and clothing levels highlighted in red.
39
To assess whether the standard psychometric comfort region aligns with the votes, Chi-squared tests of independence were conducted. Since metabolic rates and clothing levels are unknown in practice, various comfort regions have been tested (a relative air speed of 0.1 m/s and an equivalence between dry bulb and radiant temperature were assumed).
42
Votes were grouped into comfortable and uncomfortable (too cold and too hot), and each data point was classified as either inside or outside the standard comfort region. Figure 11(c) illustrates the contingency table for the comfort region represented in Figure 11(b). Table 3 presents results showing statistically significant association between region membership and reported comfort. It suggests that the defined comfort region universally reflect occupants’ actual comfort experiences. However, the effect size, measured by Cramér's V was always below 0.2 indicating a weak association between location in the comfort region and reported comfort. Furthermore, the combinations of metabolic rate and the presumed clothing insulation (see Table 3) revealed several pairings that diverged from typical residential occupants’ behaviours. According to ISO 7730,
41
common residential activities correspond to metabolic rates around 1.0 to 1.2 met (e.g. sitting, light movement), with clothing insulation levels typically ranging from 0.6 to 1.0 clo, depending on the indoor temperature and season.
41
However, several combinations resulting in significant associations (e.g. 1.6 met with 0.6 clo or 1.4–1.8 clo) imply either unusually high physical activity levels or very heavy clothing ensembles that are unlikely to be sustained indoors over longer periods. These deviations suggest that while the statistical associations (e.g. significant
Significant results for χ2-test (P-values < 5%): none of the combinations between metabolic rate (met) and clothing insulation (clo) align with typical residential indoor behaviour or produce strong associations above 0.2 Cramérs V.
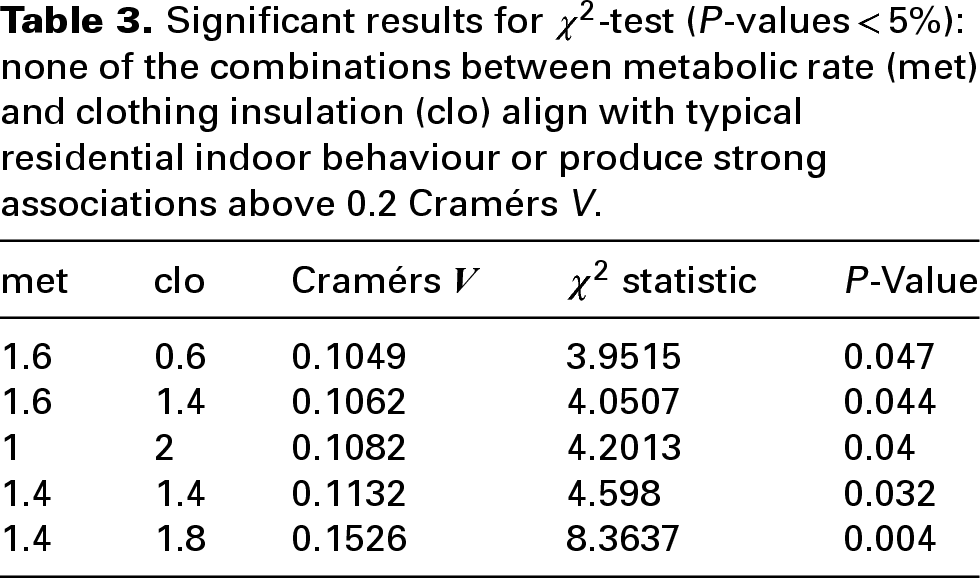
Figure 12 shows the relative distribution of thermal sensation responses across different outdoor temperature ranges. The proportion of ‘too cold’ sensations increased almost steadily as outdoor temperatures declined to below 17°C. In consequence, the proportions of ‘comfortable’ and ‘too hot’ sensations declined within this range. For outdoor temperatures between 17°C and 27°C, the distribution of sensations remained relatively stable, indicating a plateau in response patterns.
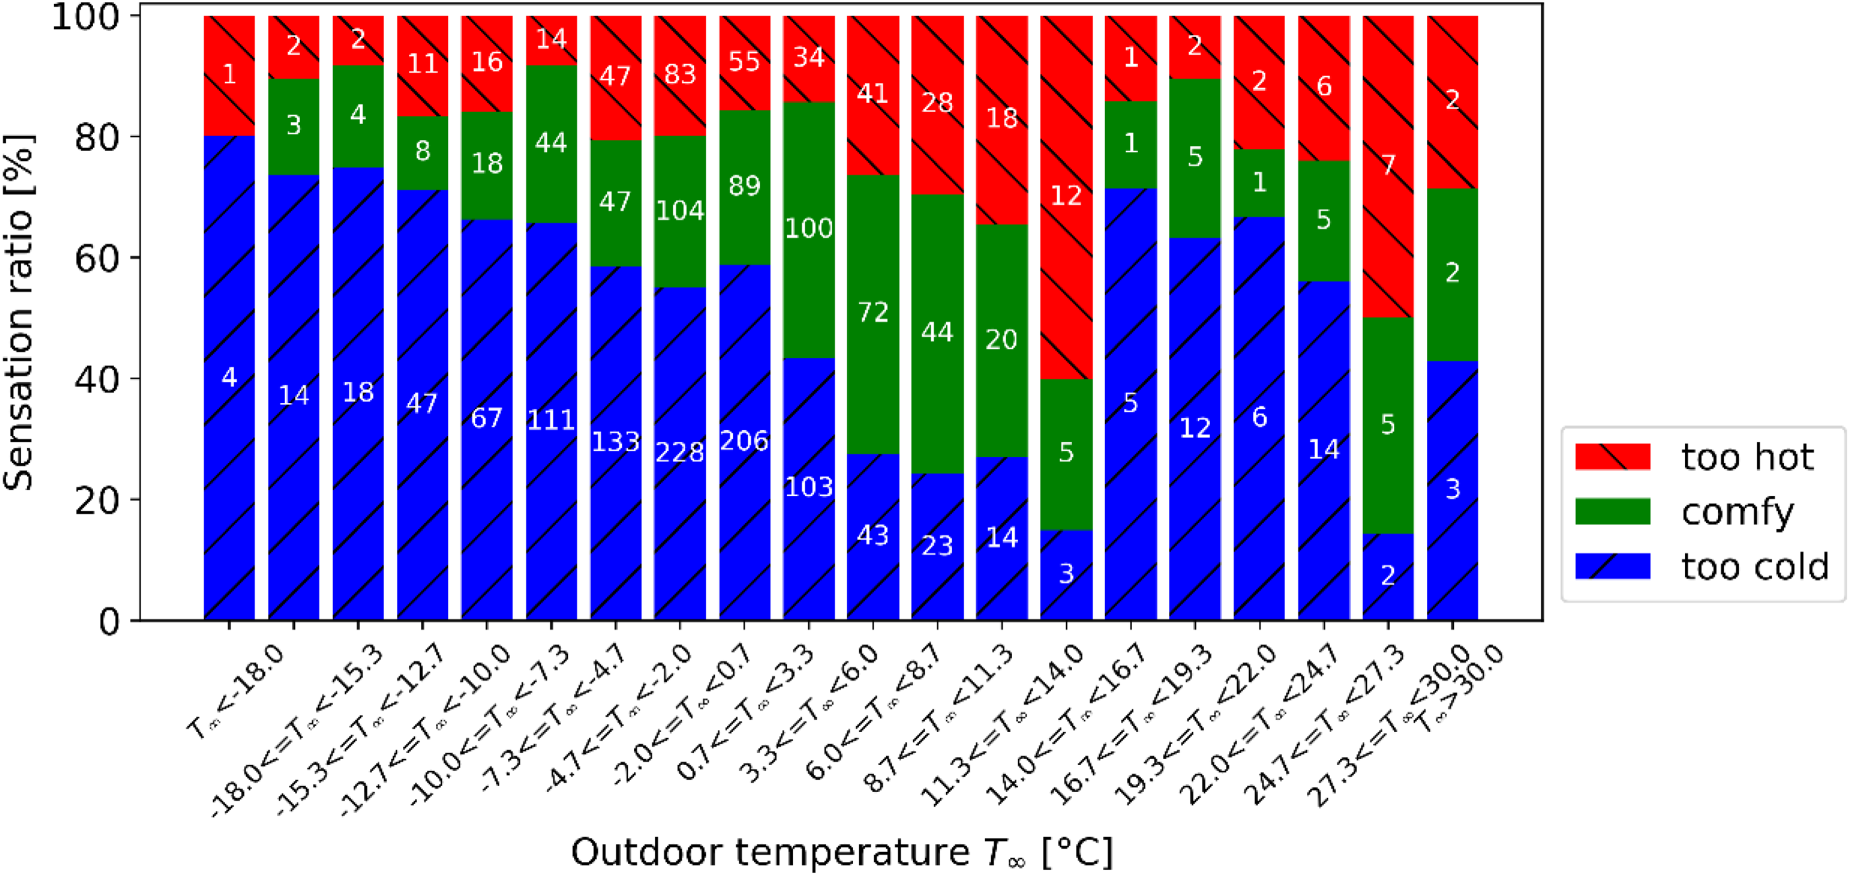
Ratings according to outdoor temperature.
Impact on energy consumption
The impact analysis of the ComfortID system compared the energy consumption of a site where the system with eTRV was installed to that of a group of control sites without such systems over the same heating season 2023–2024. A one-sided Welch's two-sample t-test was conducted on the weekly aggregated energy consumption data as presented in Figure 13, based on the directional hypothesis that the ComfortID system could reduce energy use.
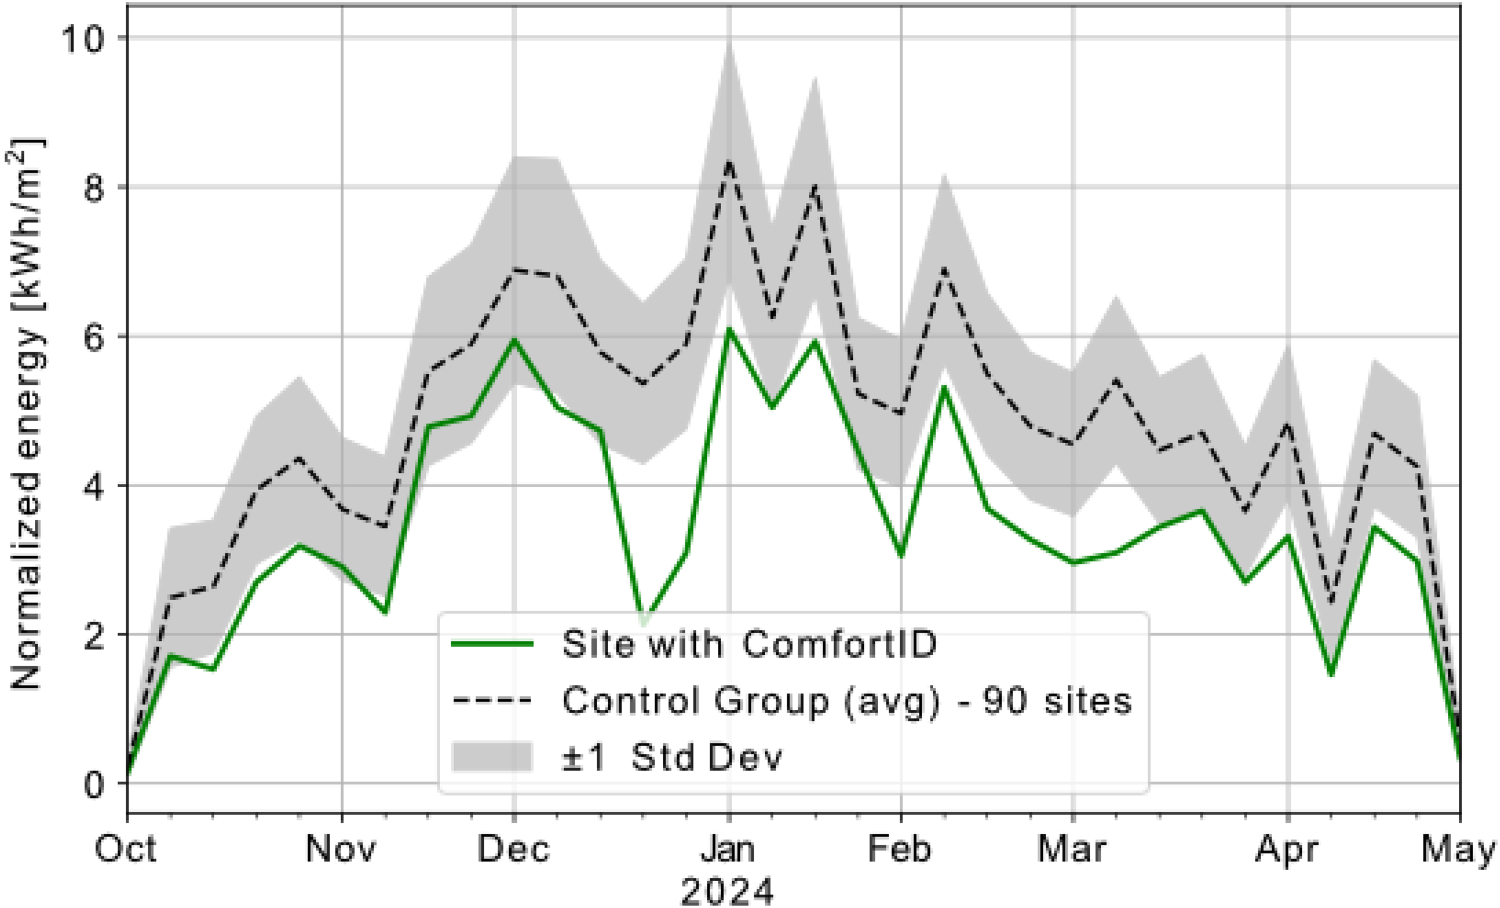
Comparison of energy consumption in heating season 2023–24. Weekly normalized energy consumption of the test site with ComfortID lied most of the time under the mean minus one standard deviation of the control group consisting of 90 sites.
The results indicate a statistically significant difference between the treated and control groups in the expected direction. The site with ComfortID exhibited a lower mean weekly energy consumption compared to the control group average (t = –3.215, one-sided p = 0.0011).
Over the entire heating season, the total energy consumption was normalized by living area of the treated site was 109.32 kWh/m2, compared to an average of 152.50 kWh/m2 across the control group. This corresponds to an estimated total energy savings of 28.3%. These results suggest that the energy-saving intervention provided by ComfortID was effective in reducing overall energy use during the heating season.
Discussion
Broadly speaking, the findings of this study align with observations reported in previous research4,6 such as the exponential decay in mobile application usage, or the lack of interaction with applications temperature settings, portrayed within this study by users’ adjustment of temperature setback adjustment.
However, as the present study was conducted under real-world conditions rather than in a controlled laboratory environment, the quantitative analysis of the impact of energy consumption is inherently limited. Specifically, it is challenging to isolate the energy used for indoor climate control from that used for preparation of domestic hot water. Additionally, variations in building usage such as differences in occupancy levels and the operation of heat-generating appliances introduce further complexity.
Despite these limitations, the study provides valuable insights into occupants’ behaviours in response to DSM events. One notable and previously undocumented observation is that occupants may implicitly override or cancel DSM interventions. Furthermore, this study demonstrated that a participative approach had enabled an increase in the potential of DSM since user-specific flexibility is the double of the population-specific one.
Thermal comfort
The thermal comfort model describing personal indoor temperature preferences relative to outdoor conditions is based on a sigmoid function. This function steadily increases with rising outdoor temperatures. Therefore, it is not astonishing that with decreasing temperatures the occupants would tend to rate that it is too cold more often since the indoor temperature model follows the trend of the outdoor temperature. One way to explain the important increase of too cold sensations above outdoor temperature of 17°C is to point out that in traditional HVAC-systems the heating only occurs if the mean daily temperature falls below a certain threshold usually lying around this value unlike mixed-mode heating. 18 Hence, it is probable that ratings with outdoor temperature above this threshold have been performed without active heating system. It is maybe a sign of a misconfigured HVAC-system. Another explanation of this phenomenon is that the application allows ratings everywhere on the planet. Therefore, votes might have occurred in hotter latitudes. In the future, geographical filters shall be applied to prevent this disturbance in the analysis.
Certainly, the presented results are limited by the significance of the available population participating in the study. However, one of the major insights this study allowed is that attempting to describe personal thermal preferences with a statistical definition for a whole population as presented in ISO 7730 41 is likely to fail. Therefore, it is more effective to design occupant-centric HVAC-systems.
One limitation of this study is that it has only analysed votes expressed by users over a mobile application. Only these personalized votes were used since otherwise it would not have been possible to analyse the duration since initial setup. However, users were also capable of mitigating their thermal discomfort by directly manipulating an eTRV in cases of private zones. Extending the analysis to these cases would allow users to express the willingness to manipulate the indoor climate over their mobile devices instead of manipulating an eTRV in the conventional way.
The constant c of the exponential decay of number of votes (see Eq. (9)) has been presented as an indicator for the successful automation of indoor conditioning according to personal thermal preferences. However, both the seasonal adaptation and DSM events compromise this automation. They have as objective to challenge both the flexibility and the lower acceptance limit of occupants by exposing them to chilly indoor climate. Therefore, this figure could also be interpreted as how aggressively the application challenges the occupants while exploring their lower acceptance limit both for the production and the consumption effectivity. Maybe the seasonal adaptation feature foresaw a too steep acclimatization process or a wrong profile for occupants thus failed to moderate thermal expectations.
Away periods
Away Periods enable effective energy consumption by reducing conditioning when occupants are absent. However, if the automatic detection is only based on one's home geofence, the feature caused discomfort whenever an occupant returns home since the geofence entry event is too late. Therefore, ComfortID improved automatic detection of a return to home by early detection that were available in week 7, 2024. The foundation of this improvement was based on ComfortID's philosophy to accompany an occupant's journey throughout the day. If a user's workplace is known, a geofence can be added at its location. Whenever a user leaves his/her workplace, the away period can be cancelled at home. As shown in Figure 5, these improvements have led to an increase in automatically detected away periods while manually detected ones slightly decrease over time. Simultaneously, the decrease in manual generated away periods is most likely related to the gradual reduction of application engagement which is both a natural tendency of users and a design goal. One can also assume that users are more prone to indicate manual vacancies for longer lasting absences such as holidays (see last week of 2023 in Figure 5).
Compatibility between demand and production efficiency measures
Efficiency measures on the demand side can interfere with the one on the production side. In 26.3% of the cases, DSM events had a timely overlap with away periods. While vacancies that cover or start during DSM events do not counteract the desired reduction in load during such an event, vacancies that end in that period commonly cause an increase in set-temperature since the away-temperature setting is by default lower than the reduced one of DSM events. Luckily, only for 20.4% of all interferences the vacancy ended during a DSM event. The ratio of interferences in cancelled DSM events is higher since the start of a vacancy automatically cancels a DSM event on zone-level.
Another consumption side efficiency measure potentially interfering with the production one is the setbacks. As we can conclude from the results, the default values for setback are seldom modified and influence occupant's comfort in particular in the morning. In order to maximize comfort, the default end of a night setback should be at 5:00 instead of 6:00. However, individual differences might occur. The issue of manual set and default night setbacks has two sides: it is neither assuring comfort nor does it prevent power-peaks. Therefore, a future improvement could be to individually learn night setbacks based on the votes of users related to the room category and the hour in the day. If this measure that is distributing the extra power required to return to nominal temperature levels does still cause a power peak on macroscopical level, other measures such as pre-heating are required. Another improvement could be to design smoother set-temperature transitions instead of sharp steps taking into consideration the thermodynamic properties of the building and its HVAC-system.
Users’ acceptance of DSM events
The mean temperature difference for completed events was −0.8 °C, with an average duration of 2 hours and 54 minutes to reach the minimum temperature. This suggests that such a level of temperature reduction was generally acceptable to occupants, indicating the extent and duration of thermal discomfort they were willing to tolerate during DSM events. In contrast, cancelled events exhibited a higher mean temperature difference of −1.1 °C, indicating greater occupant sensitivity to larger temperature decline. The relatively short mean duration of 76 minutes for these events aligns with the well-known fact that higher drift rates could significantly influence perceived thermal comfort. 41
Intuitively, one might expect the mean temperature difference for completed events to be greater than that of cancelled events, due to their longer duration. However, the study revealed the opposite. This could potentially be explained by the hypothesis that some users did not cancel a DSM event via the app but instead compensated for the temperature fall by switching on auxiliary heaters, most likely electric. If this behaviour was common, the overall effectiveness of energy production systems during peak demand periods would likely be compromised. It is plausible that during times of high demand for DH, there is also a high demand for electricity. These assumptions warrant further investigation to identify the optimal balance between DSM interventions and occupant comfort limits.
The study also yields insights into how to maximize the acceptance of DSM. First, it is likely that DSM interventions are more noticeable shortly after the installation of eTRV devices. A waiting period of approximately five weeks post-installation appears necessary for two reasons: (a) to ensure the personal comfort model is adequately learned, and (b) to give users the opportunity to focus on their actual thermal experience rather than being influenced by the environmental conditions displayed.
Another important factor is the outdoor temperature. The colder the external conditions, the more likely occupants are to feel cold. Consequently, DSM interventions should be more limited on colder days. This presents a challenge, as the need for production optimization is typically highest during periods of increased heating demand.
The study further demonstrated that an individualized approach to temperature flexibility reveals a potential for adaptation that is approximately twice as high as what population-level statistics suggest. Unlocking this potential necessitates a rethinking of traditional HVAC control strategies. Heating input should no longer aim to maintain a uniform temperature throughout a building but rather to satisfy the aggregate of all individual comfort demands. This requires dynamic hydraulic balancing in hydronic HVAC-systems, which in turn demands appropriate hydraulic configurations, such as the Tichelmann system.
Interestingly, 23.5% of all DSM events were implicitly cancelled, as they resulted in temperature increases, a rare but noteworthy outcome. These instances may be attributable to external influences such as weather conditions, occupants’ behaviour or system-specific factors like the thermal inertia of the building. Further analysis of these cases, in particular, analysis of the indoor conditioning power if available, could provide valuable insights into optimizing DSM strategies, helping to prevent unintended temperature rises and achieve a more even distribution of heating power reduction over the course of a DSM event.
The implemented DSM strategy achieved a net reduction in heating demand, evidenced by a total reduction of −31.7 HDD. However, the average temperature offset during load reduction events was −0.8°C, highlighting the trade-off between energy savings and occupant comfort. This value may represent a threshold at which energy savings become significant without severely compromising comfort.
Future improvements in occupants’ acceptance of DSM events may lie in incorporating individual flexibility with respect to temperature drift rates. This will require the development of models capable of capturing and predicting individual flexibility. Such models are only useful if the control logic can incorporate these constraints. Therefore, the ability to design temperature trajectories at the room level must be ensured. Methods such as those proposed in a previous study should be extended to model the thermodynamic behaviour of a room in relation to outdoor climatic conditions, the HVAC-system, its hydraulic balance and the room's heat exchanger. 14
Limitation and future work
One limitation of this study is the lack of data on domestic hot water and electrical consumption, which might have helped explain the observed temperature increases during DSM events. It is known that on one of the sites, electrical convectors were used to mitigate chilly indoor conditions. Therefore, the authors presume that such measures are also employed on other sites. Future work can be focused on how the DSM events with personalized control could affect energy-saving performance, as well as electricity consumption. Additionally, the reason why seasonal adaptation could lead to an increase in thermal expectation should warrant further investigation. It is unlikely that this effect is due to failed acclimatization: rather, other factors may play a role such as the personalized control logic, humidity, ‘seasonal fatigue’ or that the logic did not individually address the transitional seasons. 17 Finally, the impact on energy savings from occupancy-based thermal control, both at the room and zone level, using automatic detection, should be further investigated.
Conclusion
This study has explored the interplay between DSM and thermal comfort in district heating (DH) networks by presenting a field study during the 2023 to 2024 heating season in Stockholm, Sweden. The results of this study show that occupants can have a crucial role in mitigating climate change through efficiency measures. Financial or moral incentives alone may not be sufficient to support these measures. These incentives should be complemented by a participative and agentic control logic that places occupants at the centre of decision-making, encouraging them to stretch their comfort limits and be more flexible while leaving them a sense of control. In summary, the main conclusions of this study are: During DSM events, 7% were cancelled, with an average duration of 76 minutes and a temperature reduction of 1.1°C. Completed events showed a lower average temperature reduction (0.8°C) and a longer mean duration (2 hours and 54 minutes). The thermal comfort range across users spanned from 18°C to 23°C, with an average personal flexibility of 1°C (standard deviation: 0.8°C). Integrating personalized information into DSM strategies enables bigger load reductions by leveraging participative control logic. Drift rate is a critical factor for thermal comfort. Accepted DSM events had an average drift rate of –0.3°C/h, whereas cancelled events, often due to discomfort, averaged –1.0°C/h. These findings can guide the design of DSM schemes that maintain acceptable thermal conditions. Higher conditioning level does not directly translate into increased flexibility, highlighting the need for individualized approaches, as flexibility cannot be reliably inferred from conditioning levels alone. Participative, occupant-centric control based on personalized thermal comfort not only delivers energy savings of approximately 28.3% but also doubles the potential for effective DSM.
Footnotes
Acknowledgements
The authors would like to express their sincere gratitude to Stockholm Exergi, the main energy provider for the city of Stockholm, for financing this study. Special thanks go to Fabian Levinh for his valuable support throughout the project. The authors are also deeply grateful to the participants who bravely engaged with the ComfortID system. Finally, the authors acknowledge the Swedish Energy Agency for partially funding this work under Grant Nos. 51544-1 and P2024-01185.
Authors’ contribution
All authors contributed equally in the preparation of this manuscript.
Declaration of conflicting interests
The authors declared no potential conflicts of interest with respect to the research, authorship and/or publication of this article.
Funding
The authors disclosed receipt of the following financial support for the research, authorship and/or publication of this article: This work was supported by the Energimyndigheten and Stockholm Exergi AB (grant numbers 51544-1 and P2024-01185).