
Abstract
Storage enclosures made of paper-based materials are commonly used to store and classify archival documents for their hygrothermal buffering effect. However, there is little information about papermaking and quantitative studies on such an effect. Aiming to assess the feasibility of using the enclosure to buffer temperature and relative humidity fluctuations, without any detrimental effect on the collections, this paper reports four measurements and a feasibility assessment: thermophysical properties of the enclosure material, hygroscopic properties of the material, air change rate of the enclosure, buffering effect in a climate chamber and the assessment of safeguarding collections without causing any detrimental effect. The measurement results show that the enclosure can buffer macro-environmental fluctuations, which was considered sufficient to mitigate temperature and humidity fluctuations from the room environment and to secure a condition inside that is safe for the collections. The paper-based material determines the buffering capacity of the enclosure, and an appropriate air change rate ensures average temperature and relative humidity inside the enclosure at a controllable level and prevents off-gassing accumulation. This work provides assurance that using enclosures is an effective approach to collection storage and establishes a significant basis for further heat–air–moisture simulation and energy-saving optimisation study in the service operation.
Introduction
The control of temperature and relative humidity (RH) is a decisive factor in preventive conservation, as it aims to maintain the environment in the right conditions to avoid possible mechanical, chemical and biological deterioration in the collections to prolong their life. 1 The consensus in the industry, to avoid detrimental effects on the collections, are as follows: the upper limit of the room temperature is set at 25–30°C to guarantee the chemical stability of the collections and the lower one at 5°C to avoid the risk of frost damage to the building structure and condensation. The upper limit for the room RH is set at 70% to guarantee mechanical stability and 65% RH (at 20°C) to reduce the risk of mould germination, and the lower limit at 30% RH to avoid physical damage.2,3
Based on the consensus, the ASHRAE (American Society of Heating, Refrigerating and Air-Conditioning Engineers) and British Standards propose standard control bands with 24-hour fluctuations for the temperature and RH control in storage spaces of museums, galleries, archives and libraries. For instance, the ASHRAE points out a level of precision control (Type A Control): 10–25°C, 35%–65% RH control bands with ±2°C and ±5%–10% RH short-term fluctuations as it can minimise mould germination and mechanical damage for most paper-based artefacts. The same damage can be avoided for many artefacts and most books, except paintings and vulnerable artefacts, at the level of limited control (Type B Control): ≤30°C, 30%–70% RH control bands with ±5°C and ±10% RH short-term fluctuations. 4 The BS 16893:2018 specifies conditions of 5–25°C and 30%–70% RH control bands with ±5°C and ±10% RH short-term fluctuations for general collections. 2 For the storage of archive documents, the BS 4971:2017 stipulates a fixed temperature and RH setpoint within 13–16°C and 45%–60% RH with tolerances of ±1°C and ±5% RH. 5 Apart from temperature and RH, heritage collections should be monitored every 6 months to check for any contamination due to pollution.
Such stringent requirements for the indoor environment require precision air-conditioning running continuously and consistently across a whole storage room. The use of HVAC operations, with tight environmental controls, inevitably leads to high energy consumption and carbon emissions. Additionally, in Europe, many heritage collections are housed in historic buildings that are an essential part of that cultural heritage. Finding ways to improve energy efficiency can be challenging while preserving and respecting the cultural heritage of these buildings.
As a consequence, improving the existing conditions of the structure is not always a simple task. 6 As a part of a collective effort to protect both the cultural heritage and the natural environment, collections care professionals are constantly searching for innovative ways to preserve collections and energy. 7 One solution to this effort is passive environmental control, which reduces carbon emissions while ensuring environmental risk management for collections. 8
Passive control relies on the outdoor climate moderation capability of the building structure. Buildings with a large thermal mass and hygroscopic inertia, producing airtight and thermally insulated envelopes, impede heat and mass transfer between outdoor and indoor, thus stabilising the indoor environment.9–11 In general, the buildings which provide low energy operation for collection storage have three features for passive environmental control, ‘high thermal resistance value and energy storage capacity’, ‘good building airtightness’ and ‘effective absorption dehumidification’.12–14 Due to the passive environmental control, the indoor air temperature and relative humidity can be maintained within the comfort zone while the total energy consumption falls by 69.2% in a measured winter. 15
A good practice to keep the cultural collections has been established, such as archival documents in enclosures, in order to protect them from rapid fluctuations in temperature and RH and to mitigate the detrimental effect caused by any malfunction in the HVAC system.
2
Because of the thermal insulation, airtightness and temperature and humidity-control capacity of the enclosure, a desirable temperature and RH are achieved inside the enclosure (see Figure 1). While a relatively stable indoor temperature and RH are maintained by the air handling unit, the hygrothermal condition inside the sealed space can be further stabilised by placing inside the substances that can moderate the temperature and humidity, such as paraffin with silicon,
16
porous matrix with various hygroscopic salts,
17
composite material comprising natural polymer derivative, porous natural mineral and acrylamide copolymer.
18
Meanwhile, the airtightness of an enclosure affects how much air flows between the enclosed space and the indoor environment. These two environments are known as the micro-environment and macro-environment, respectively. Stable temperature and RH conditions inside the showcases were maintained in a historic house whose indoor environment could not be guaranteed by mechanical air-conditioning due to the buffering capacity of the cases with a suitable air change rate (ACR).
19
Schematic diagram of heat, air and moisture transfer among three elements – the outdoor, room and enclosure.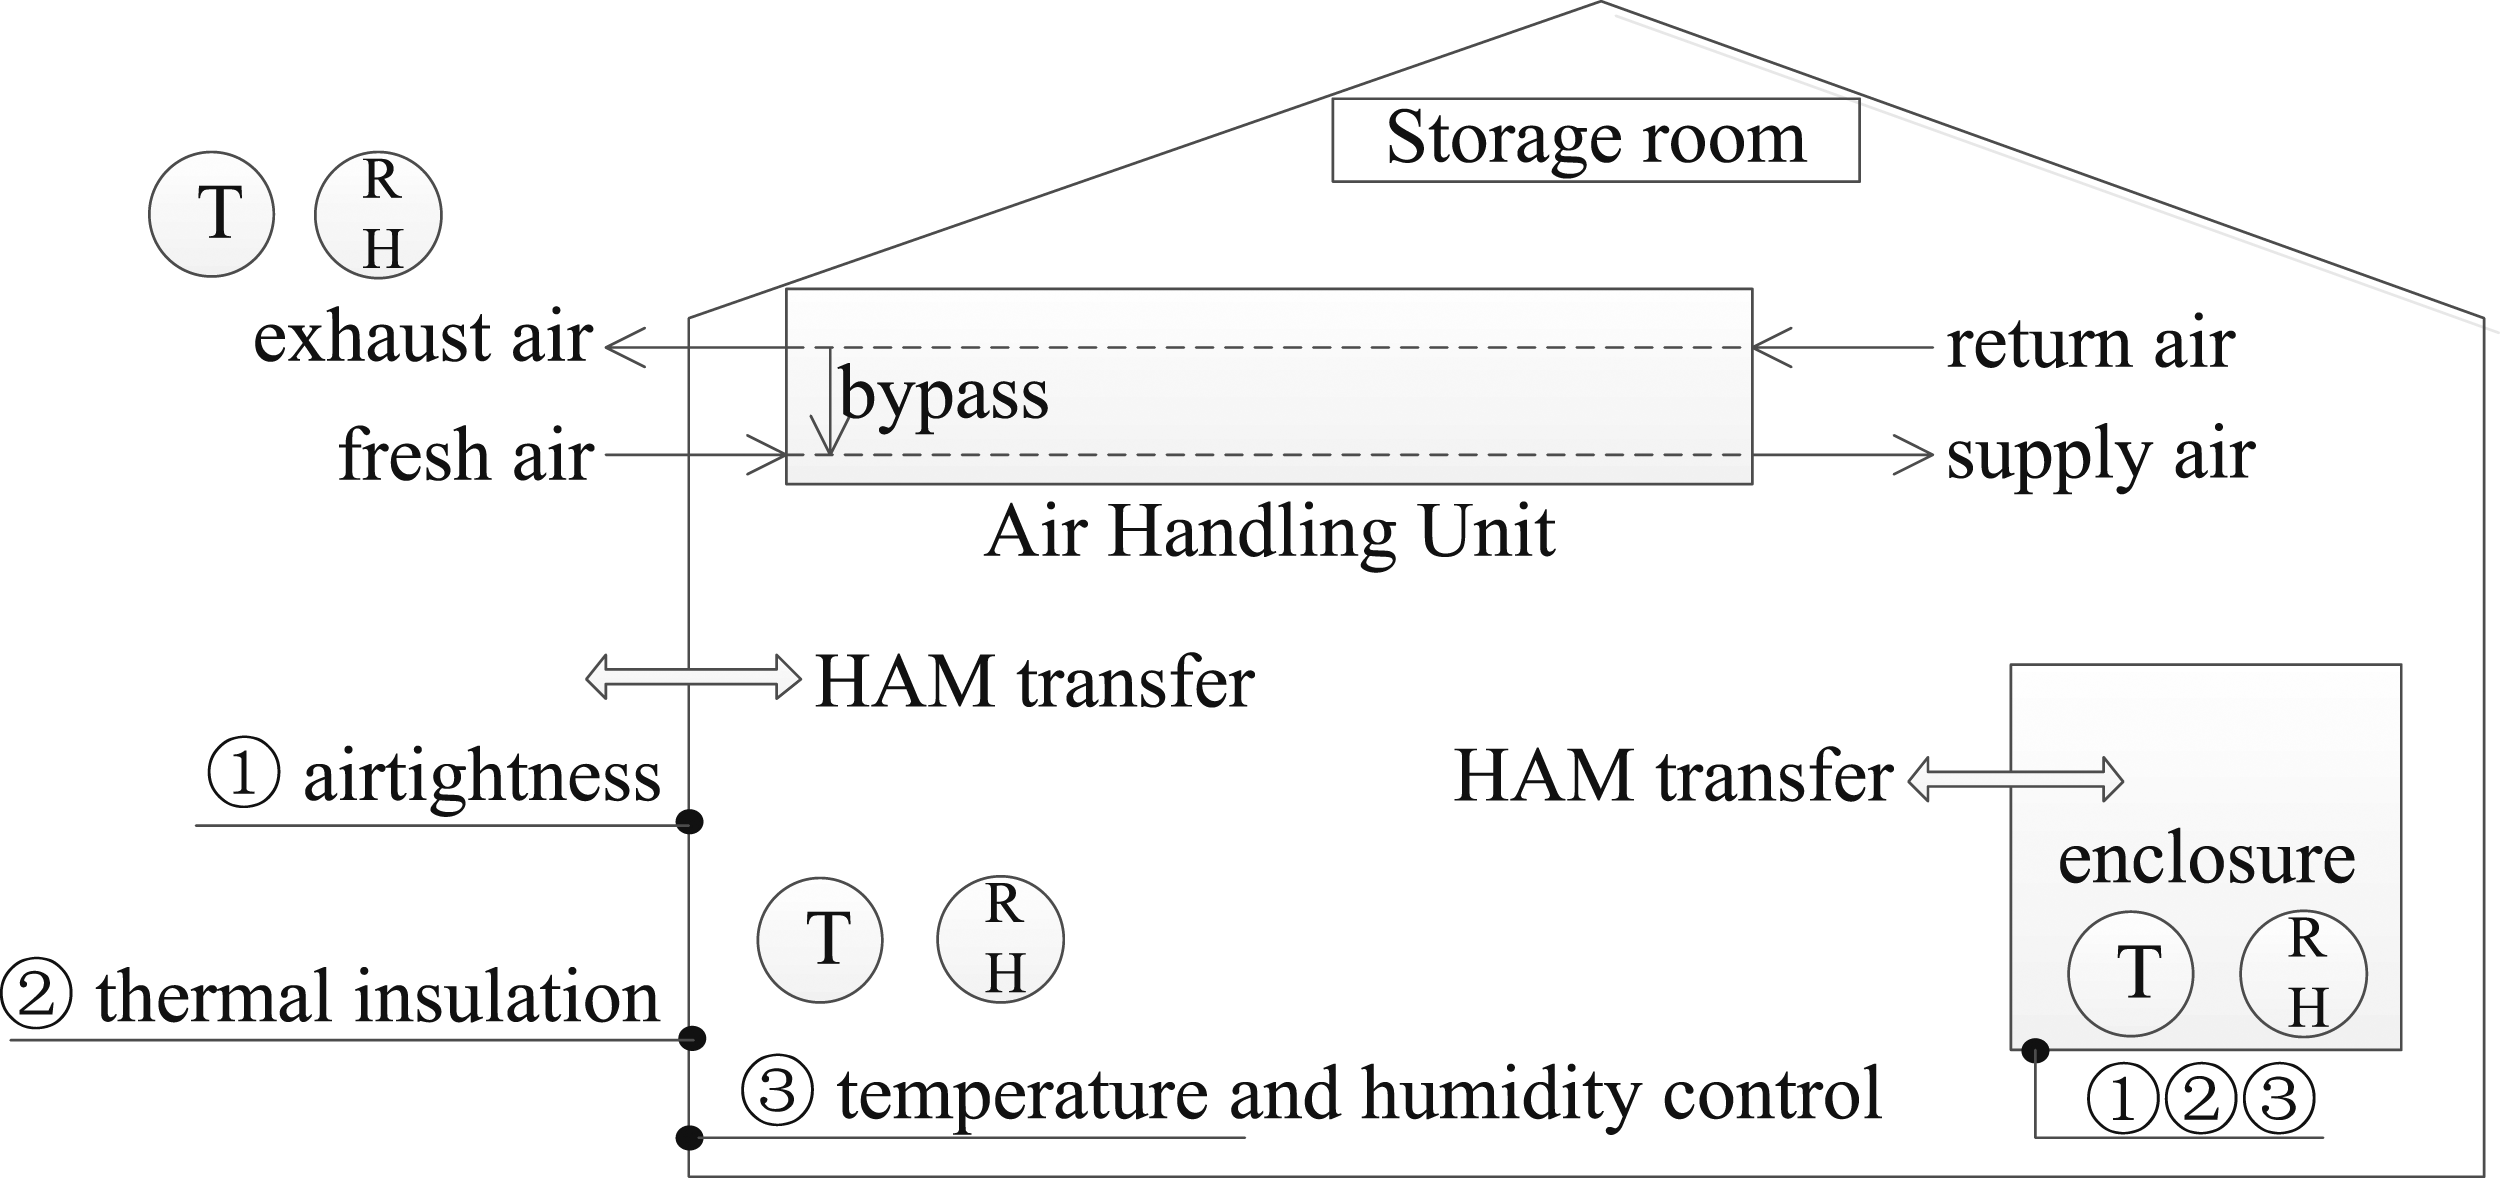
Although the capacity can increase with good airtightness, a certain degree of leakage is desirable to prevent high concentration of the off-gassing emitted from the collections inside an enclosure, which is another risk in collection care.
20
This consideration differentiates the functions of the enclosures used in storage and showcases in exhibition. A showcase is airtight to isolate the hygrothermal influence of the visitors and to protect the collections inside. The off-gassing concentration, temperature and RH are managed by a real-time micro-environment control system, involving adsorbents for pollutants and moisture removal and active sensors.
21
This method is generally impractical for storage enclosures given the greater volume of collections in storage at most cultural institutions. Each of the enclosures relies on the ACR to maintain a satisfactory micro-environment and, together with its envelope, to mitigate the hygrothermal fluctuations and mean level. While temperature and humidity buffering in buildings is recognised, its magnitude and application within the heritage repository industry remain largely unexplored. It is uncertain how it could help cultural institutions to reduce risk of the potential damage to their collection in an unconditioned space and how it could help to achieve energy saving while maintaining quality condition for the collection using a paper-based enclosure under the passive environmental control. Hence, this study aims to assess the feasibility of using the storage enclosure to provide a buffering effect in the macro-environment control of the storage spaces. There are three objectives: • To analyse the microstructure and hygrothermal properties of the paper-based material and test the ACR and buffering effect of the enclosure. • To understand the nature of the buffering effect by examining the heat, air and moisture transfer of the enclosure. • To assess the feasibility of the buffering effect by deriving an acceptable threshold of buffering from a similar model test and then comparing the measured values against the threshold.
The following contents were organised as Figure 2 shows. Contents and organisation.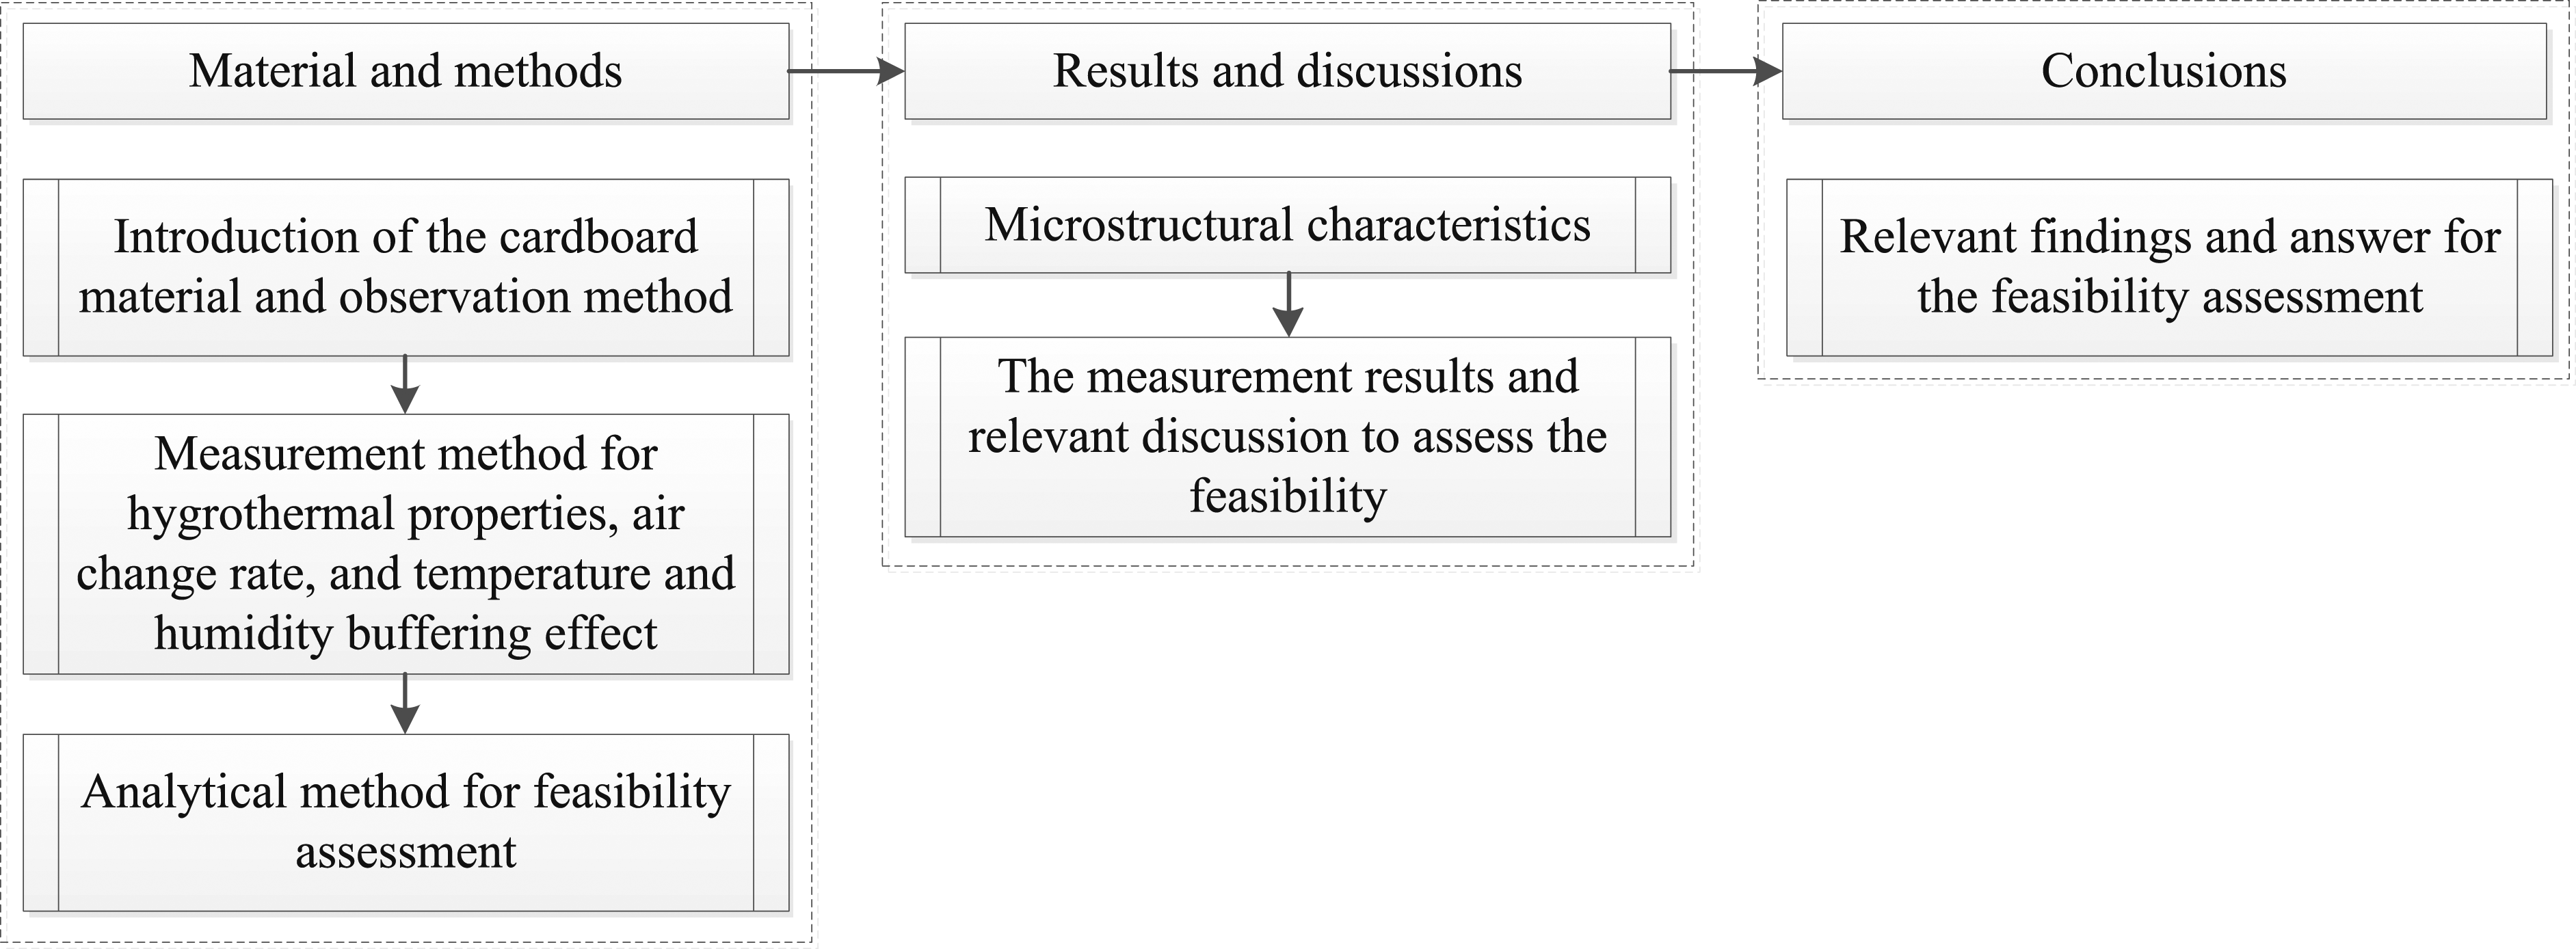
Material and methods
Material
The storage enclosure was folded from one piece of cardboard, with full length overlays on three-sides when it was closed (Figure 3). The cardboard was fabricated from a functional paper-based material that consists of layers of cotton pulp and polypropylene, with the addition of grounded calcium carbonate as an alkaline filler.
22
It had a thickness of 1.14 mm and was composed of three tightly laminated layers that cannot be easily separated. The National Library of Scotland manufactured the enclosure using board supplied by KLUG-CONSERVATION Walter Klug GmbH & Co. KG. To create a confined micro-environment inside the enclosure, the front 230 × 80 mm and top-bottom 180 × 80 mm faces were made of 4-fold and 2-fold full overlaps of the cardboard and the others were uncut without any gaps. As a result, the enclosure was considered well sealed. It was tested without any contents, as the items inside might affect its buffering effect. There were two reasons: firstly, the collection items could possibly provide additional buffering capacity to mitigate the indoor fluctuations and therefore affect the actual performance of the enclosure; and secondly, the collection item may stagnate the air inside the enclosure by blocking up gaps in the construction and consequently reduce the ACR (the lower ACR, the better buffering capacity). Therefore, using empty enclosures was the reasonable method for assessing the full buffering capacity of the box alone. Enclosure sample and structure diagram of its fabric.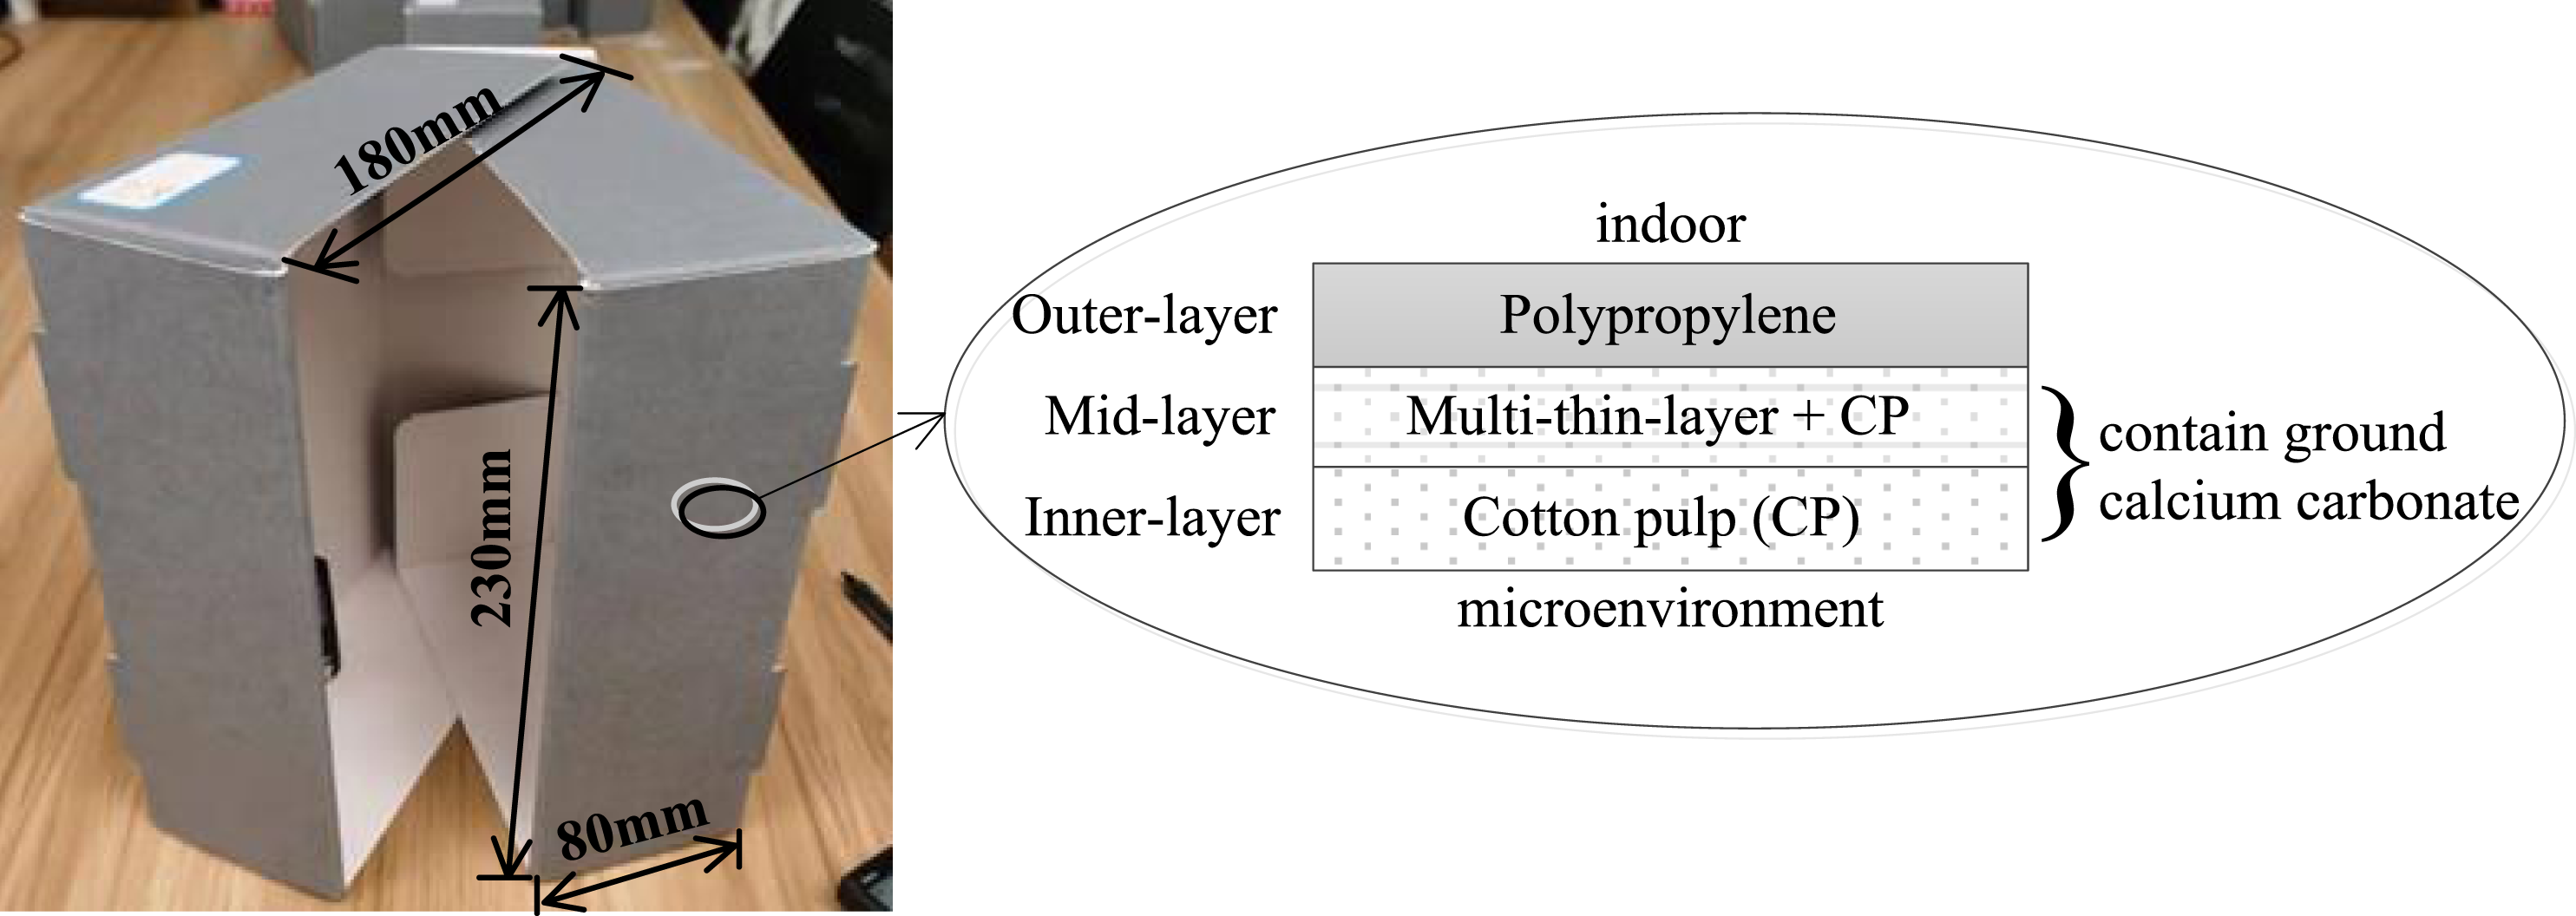
Microstructure observation
Morphological observations of the cross section and three functional layers were conducted using scanning electron microscopy (SEM), FEI Quanta FEG 250, at an accelerating voltage of 20 kV. SEM images were recorded at different magnifications: 150× for cross section, 5000× for outer-layer, 2500× for mid-layer (20,000× for locality) and 300× for inner-layer (10,000× for locality), to identify the microstructure of the cardboard.
Thermophysical property measurement

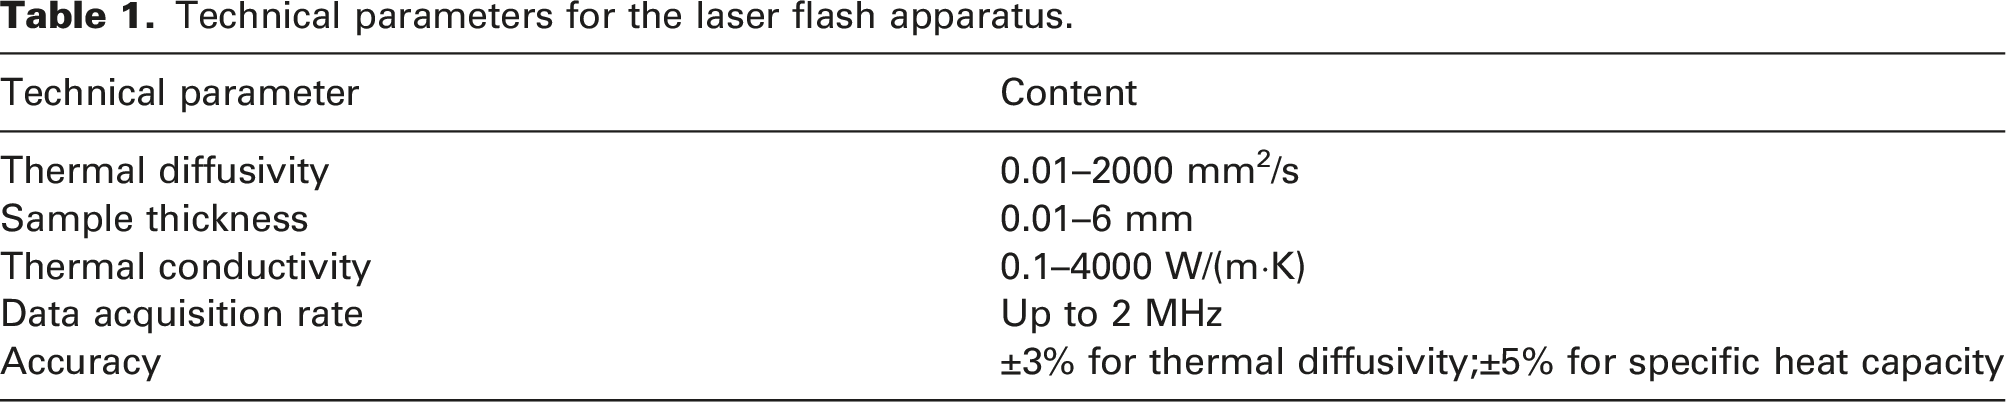
Technical parameters for the laser flash apparatus.
Hygroscopic property measurement
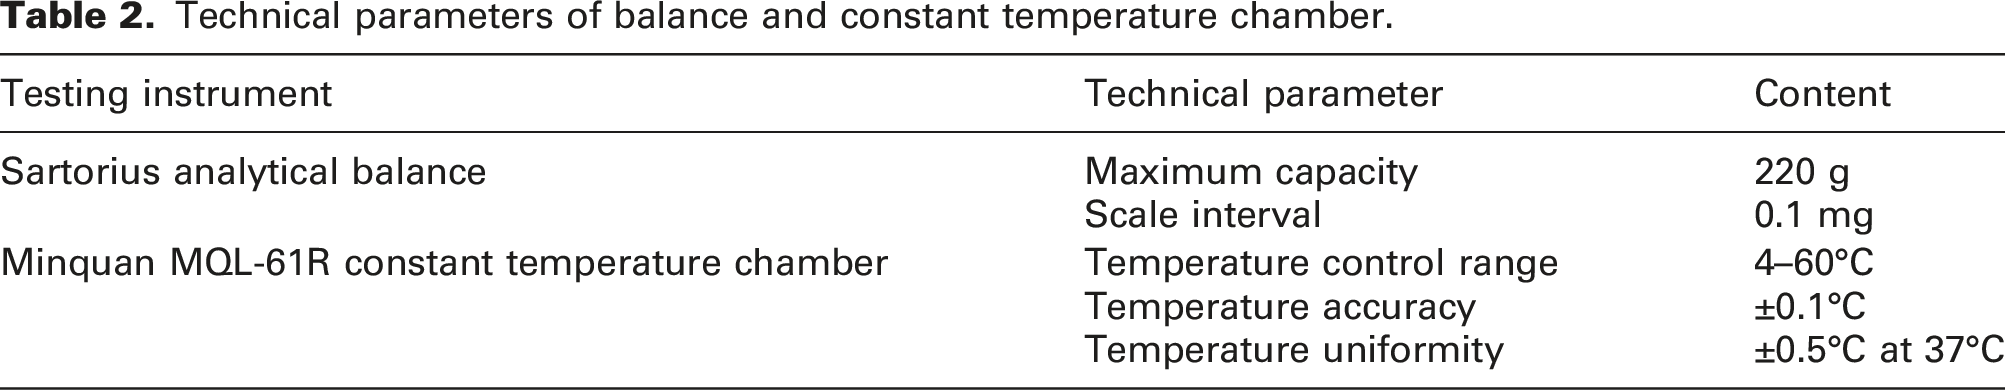
Technical parameters of balance and constant temperature chamber.
Measurement for EMC curves
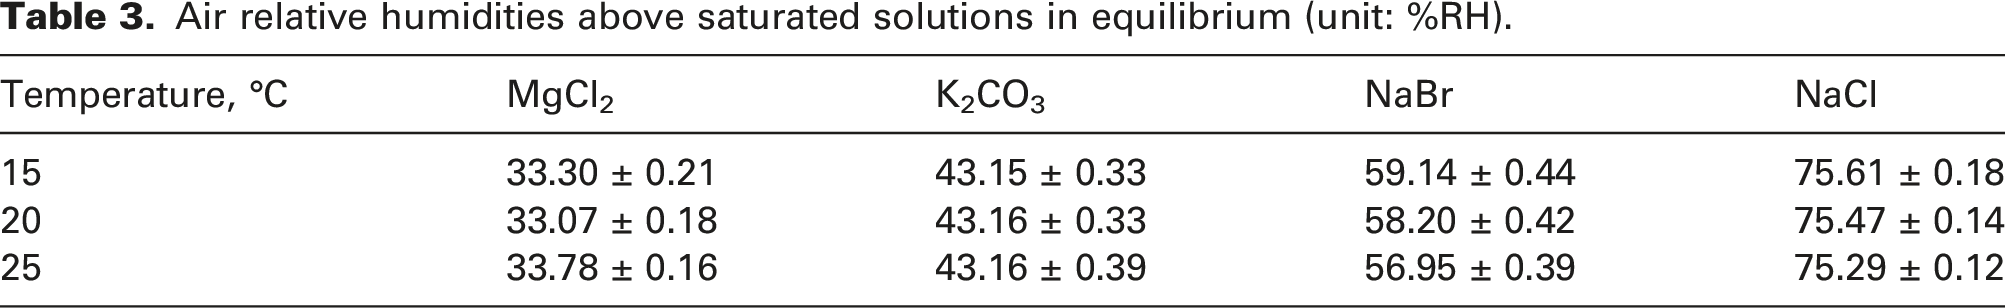
Air relative humidities above saturated solutions in equilibrium (unit: %RH).
Measurement for water vapour diffusion resistance coefficient
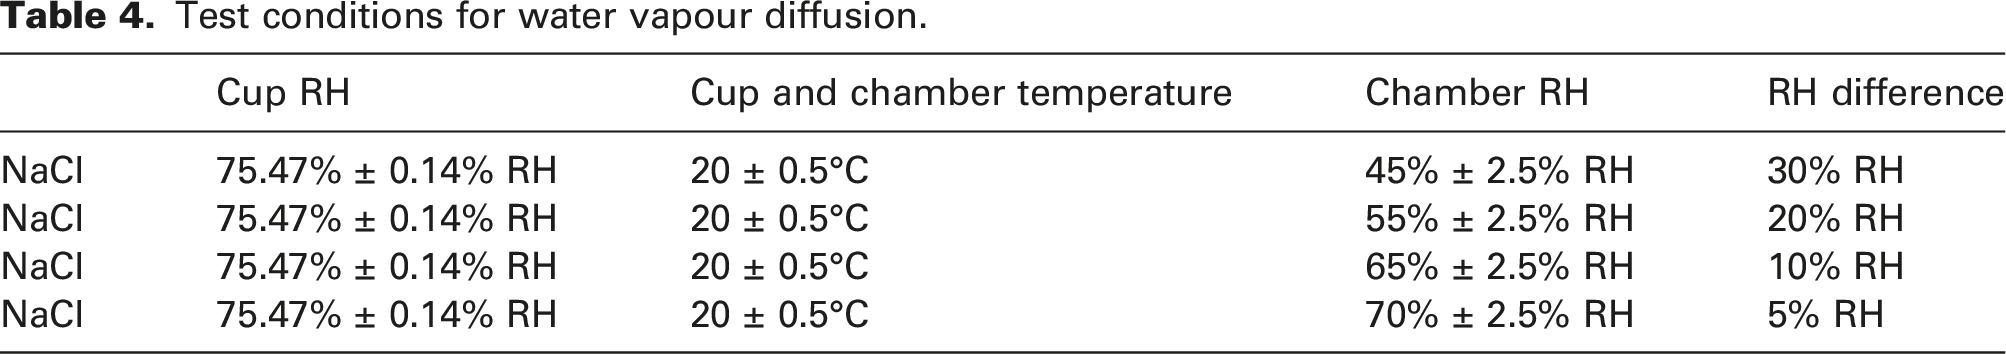
The water vapour diffusion resistance coefficient was obtained by testing water vapour permeability, according to BS EN 15803:2009. 30 The test specimen was mounted in a cup with specific RH inside, which was kept in a chamber with fixed RH to create different partial water vapour pressures on two sides of the specimen. The change in mass was measured at 24-hour intervals to determine the permeability of specimens under two test conditions. The first one was low humidity conditions, with the micro-environment and macro-environment stabilised at 0–3% RH and 50% RH, respectively. Moisture transfer occurred from the outside of the enclosure to the inside. The second one was high humidity conditions, with the micro-environment and macro-environment stabilised at approx. 93% RH and 50% RH, respectively. Moisture transfer occurred from the inside of the enclosure to the outside. Silica gel and NH4H2PO4 were used as humidity-control materials. Both tests were conducted at 20°C. The chamber’s built-in temperature and humidity sensor monitored the macro-environment.
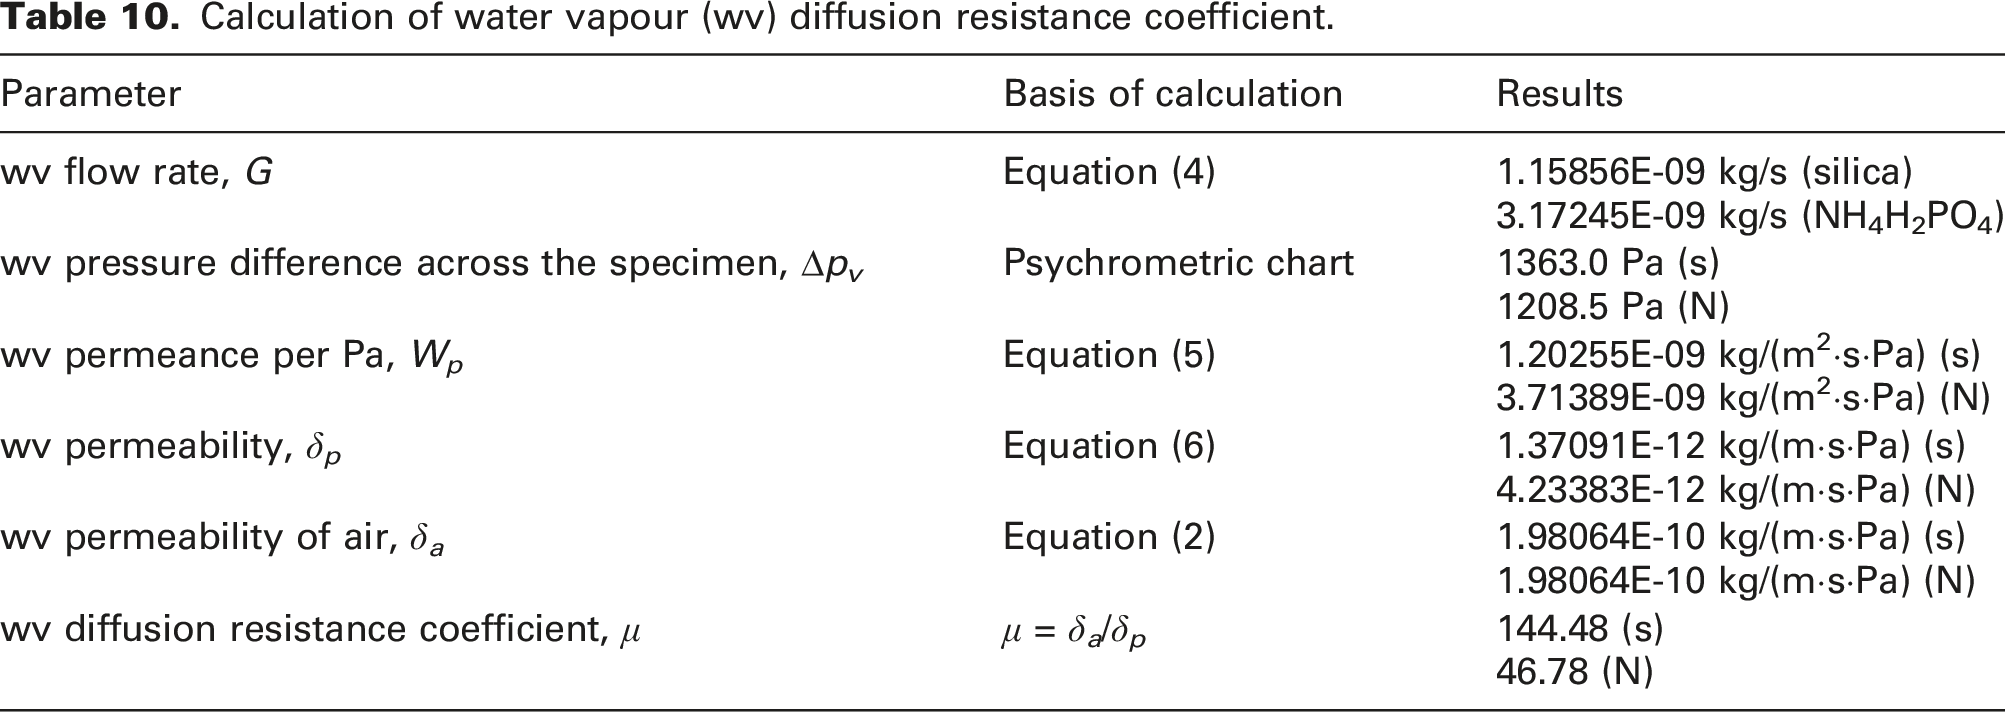
Water vapour diffusion resistance coefficient, μ, is a function of using water vapour permeability of air (δ
a
) versus water vapour permeability (δ
p
), μ = δ
a
/δ
p
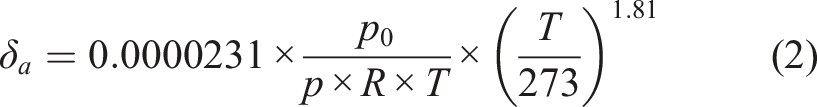
. Water vapour permeability of air is defined by the Schirmer equation (equation (2)).
31
Cumulative mass change, ∆m
i
, was calculated by equation (3).
Water vapour flow rate, G [g/s], was calculated by equation (4).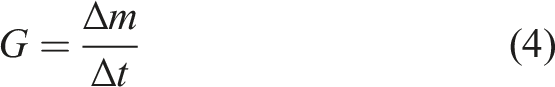
Water vapour permeance, W
p
, was determined by equation (5).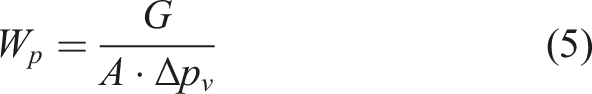

Measurement for water vapour diffusion coefficient
Test conditions for water vapour diffusion.
According to Fick’s first law,
33
diffusion coefficient, D
W
, can be described by using diffusive flux of water vapour over the concentration gradient as given by equation (7).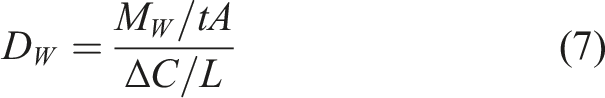

Air change rate of an enclosure
The tracer gas decay method using CO2 aims at cumulatively assessing the air and gas tightness of the envelope.
8
CO2 was selected as the tracer gas because its density is similar to air, which consequently can simulate similar behaviour of air exchanges.
36
The measurement followed ASTM E741-11.
37
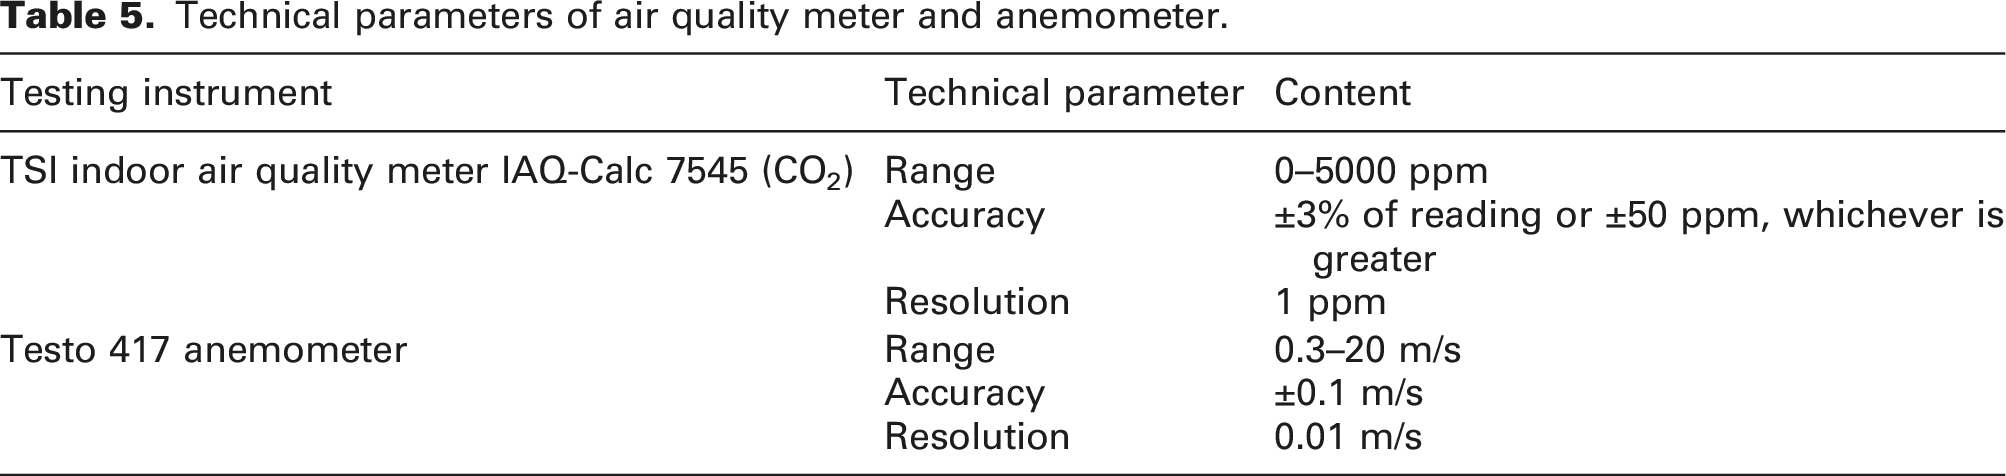
A small volume of tracer gas (<5000 ppm) was released into the enclosure, and then the concentration was recorded at a 5-second interval. The measured data was fitted into equation (9) to obtain the ACR value.
Technical parameters of air quality meter and anemometer.
Temperature and humidity buffering effect of the enclosure
Test conditions of buffering effect in temperature and RH.
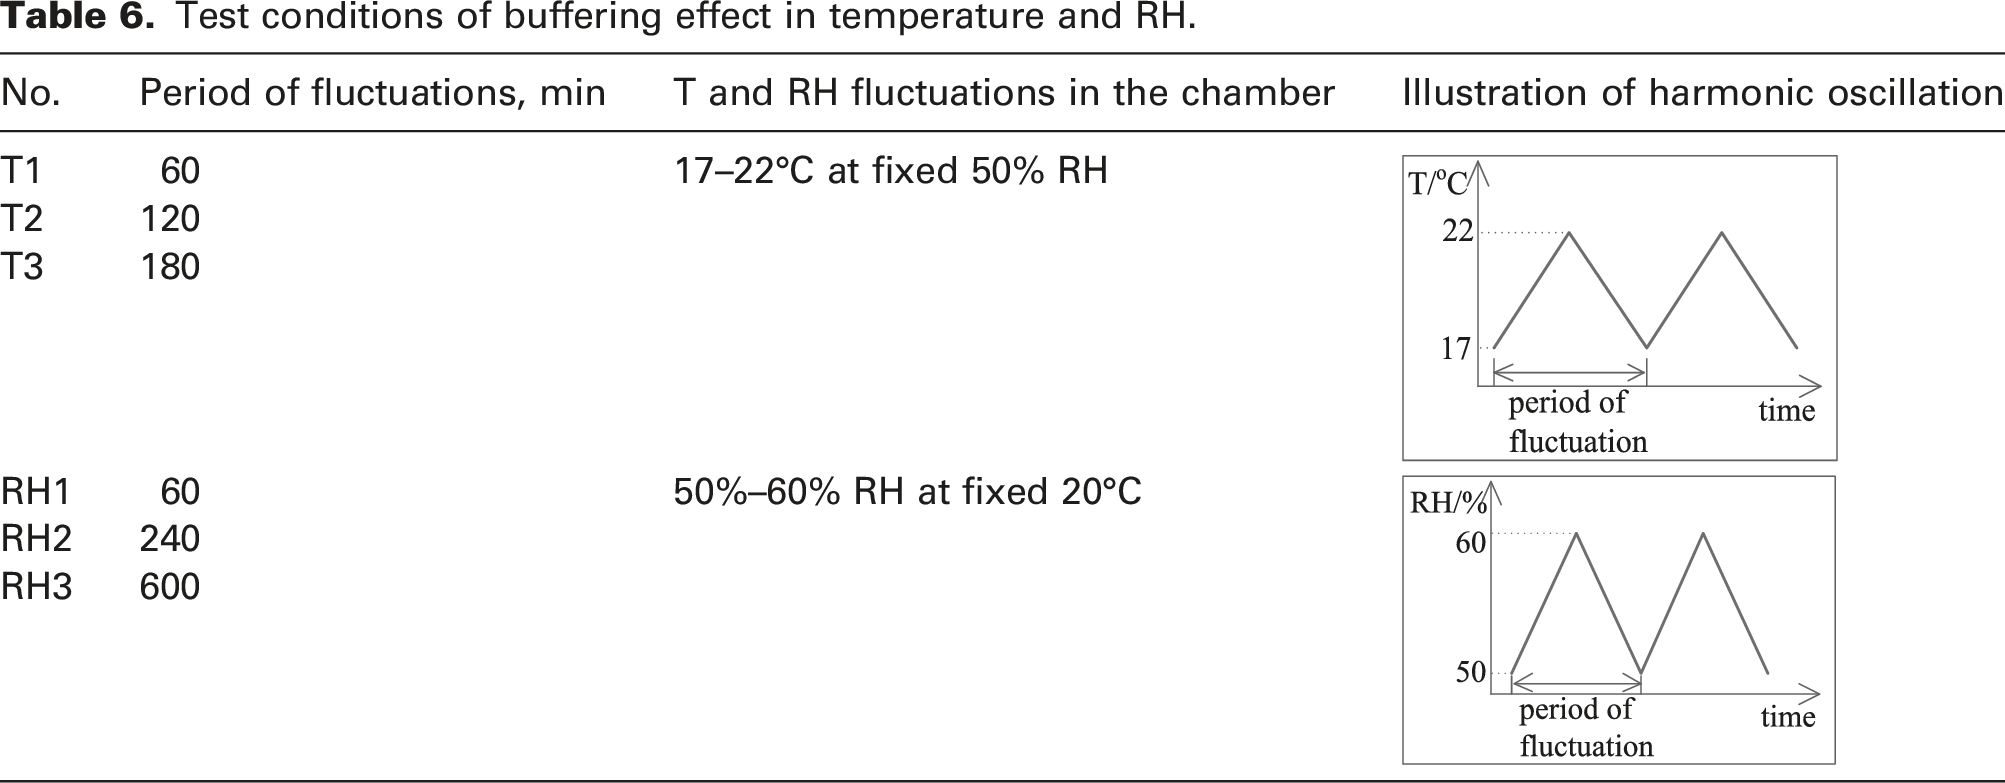
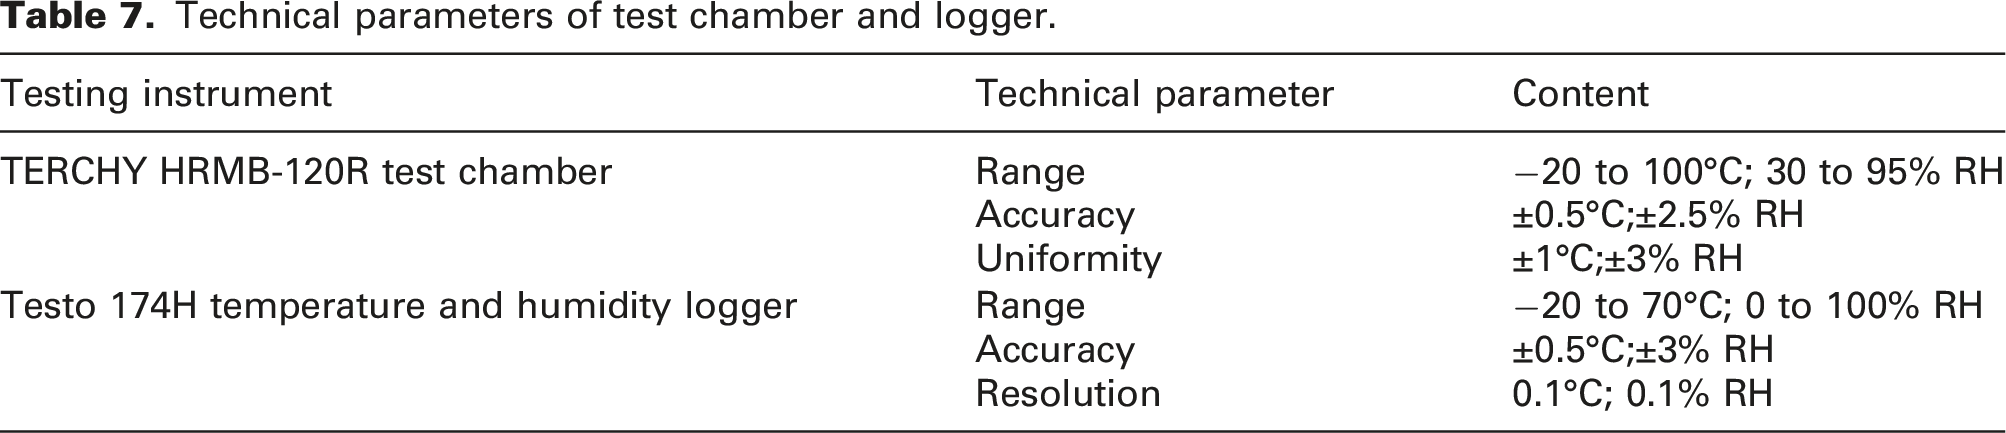
There was a 24 h acclimatization process during the initial conditioning (at 17°C and 50% RH; and 50% RH and 20°C) to control the initial moisture content inside the material before the test. Air velocity was kept at <0.5 m/s in the chamber to ensure the same condition for air exchange as in the ACR measurement. A schematic diagram of the measurement apparatus is shown in Figure 4. A programmable test chamber generated macro-environment temperature and RH fluctuations with designated fluctuation periods. Two temperature and humidity loggers were set inside the chamber and enclosure, respectively. Table 7 shows their technical parameters. There were no other contents (buffer materials) inside the enclosure. Schematic diagram of the measurement apparatus for buffering effect test. Technical parameters of test chamber and logger.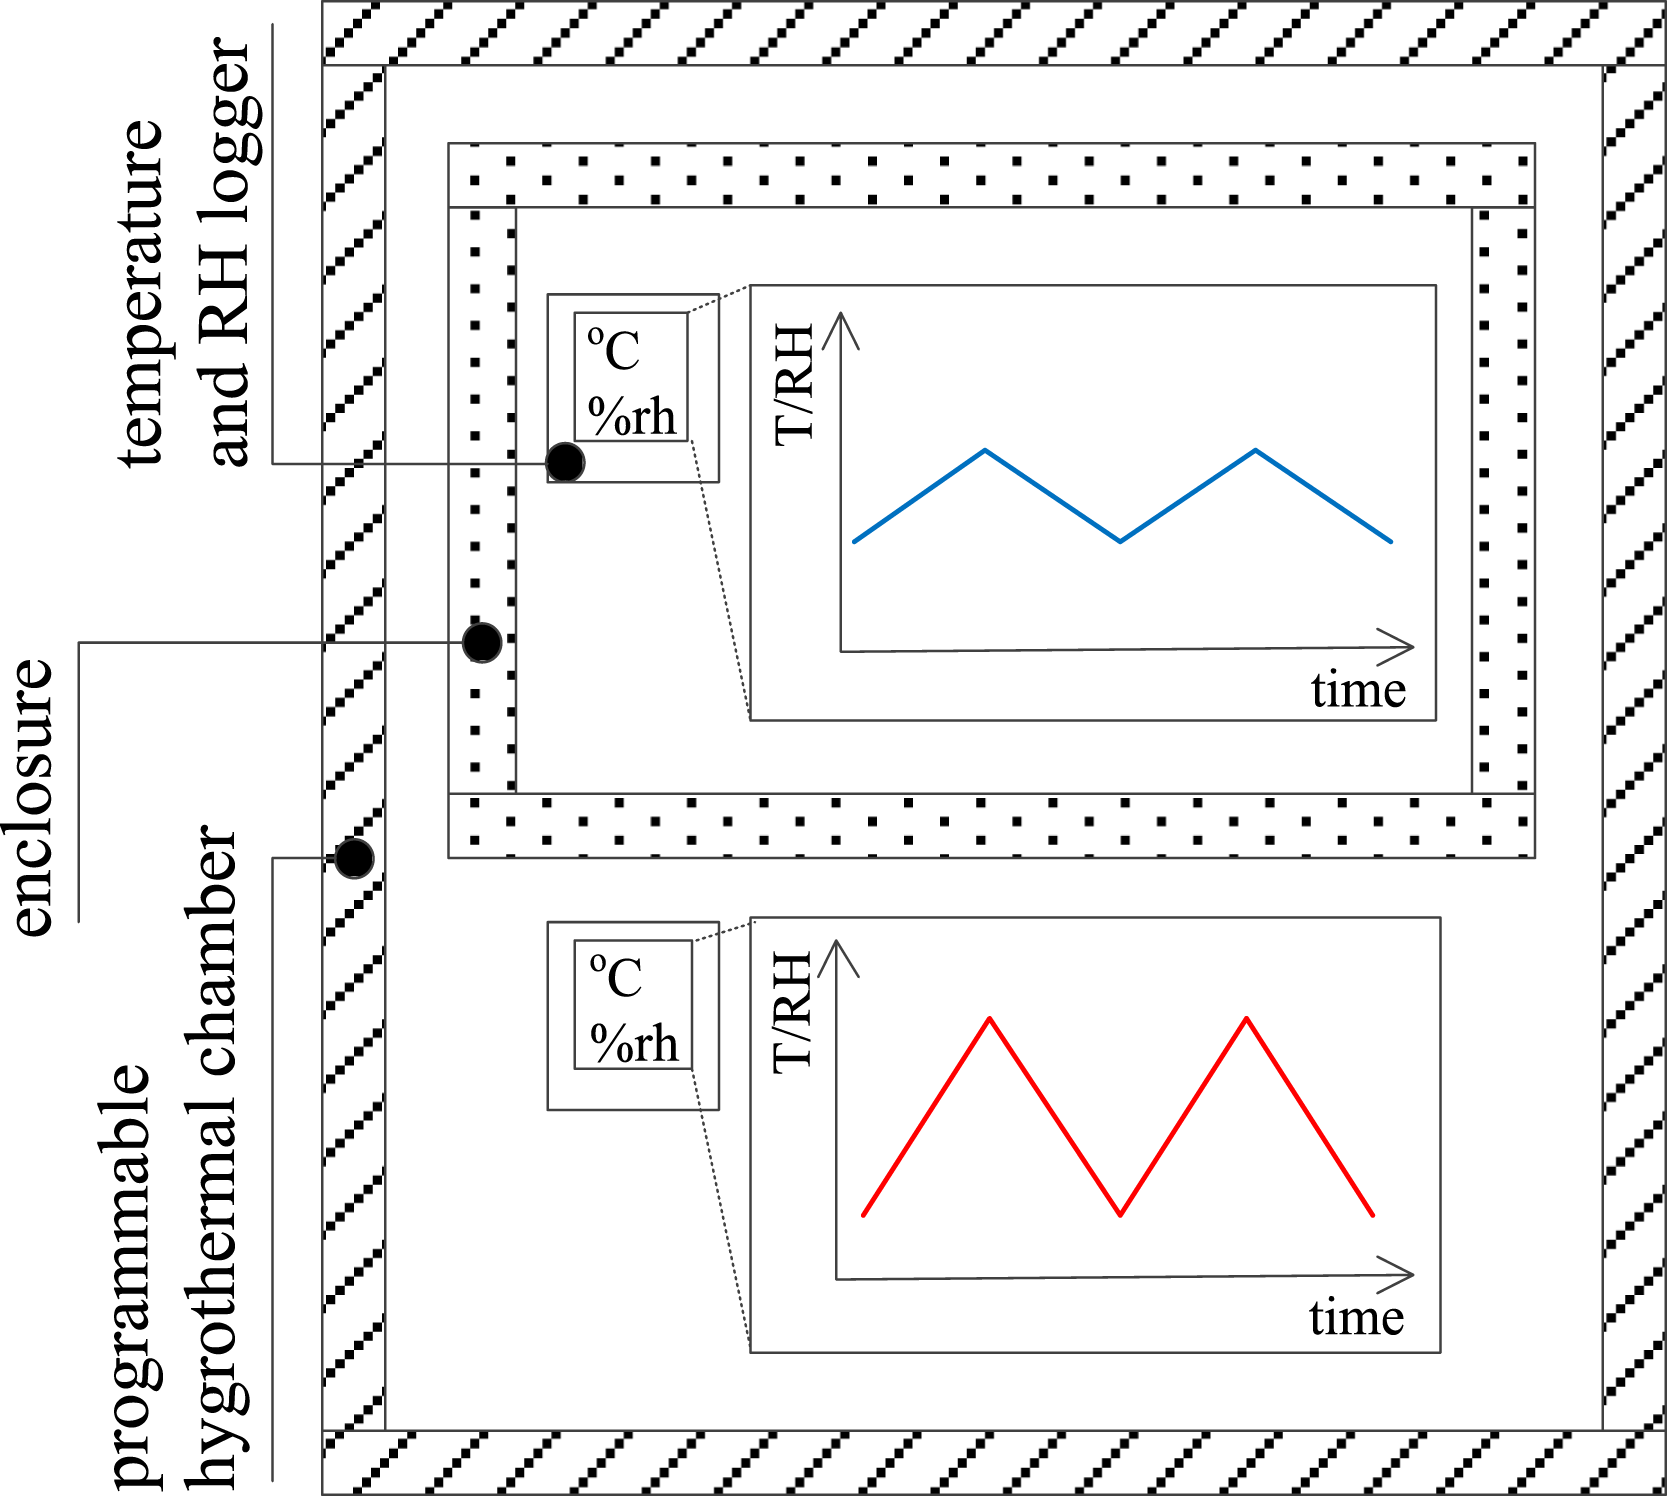
Two types of indicators were defined to quantify how much of the buffering effect was created at a given macro-environment fluctuation. Equation (10) is the absolute reduction of fluctuation, respectively, for temperature buffering (TB) [°C] and equation (11) is the humidity buffering (HB) [% RH]:

The second is the relative ratio of the amplitude of micro-environment over that of the macro-environment. Again, respectively, equation (12) is for the temperature fluctuation (AR
T
) and equation (13) is for the RH fluctuation (AR
RH
):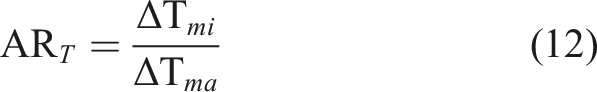
Subscript ma is for the macro-environment and mi is for the micro-environment.
Feasibility analysis of using the enclosure
The enclosure in a storage room was a ‘room in a room’ condition, for which the inner room of protection worked against the macro-environment fluctuation. Compared with unpackaged storage, using the enclosure provided a stable hygrothermal environment to avoid physical damage. However, it is important to ensure that the micro-environment within the enclosure is easy to control, as the enclosure could potentially cause chemical damage if it behaves like a greenhouse and concentrates off-gassing accumulations. 40 Hence, there were two factors to be considered in the feasibility analysis: the ACR for diluting high-concentration off-gassing and the buffering capacity for moderating an aggressive macro-environment.
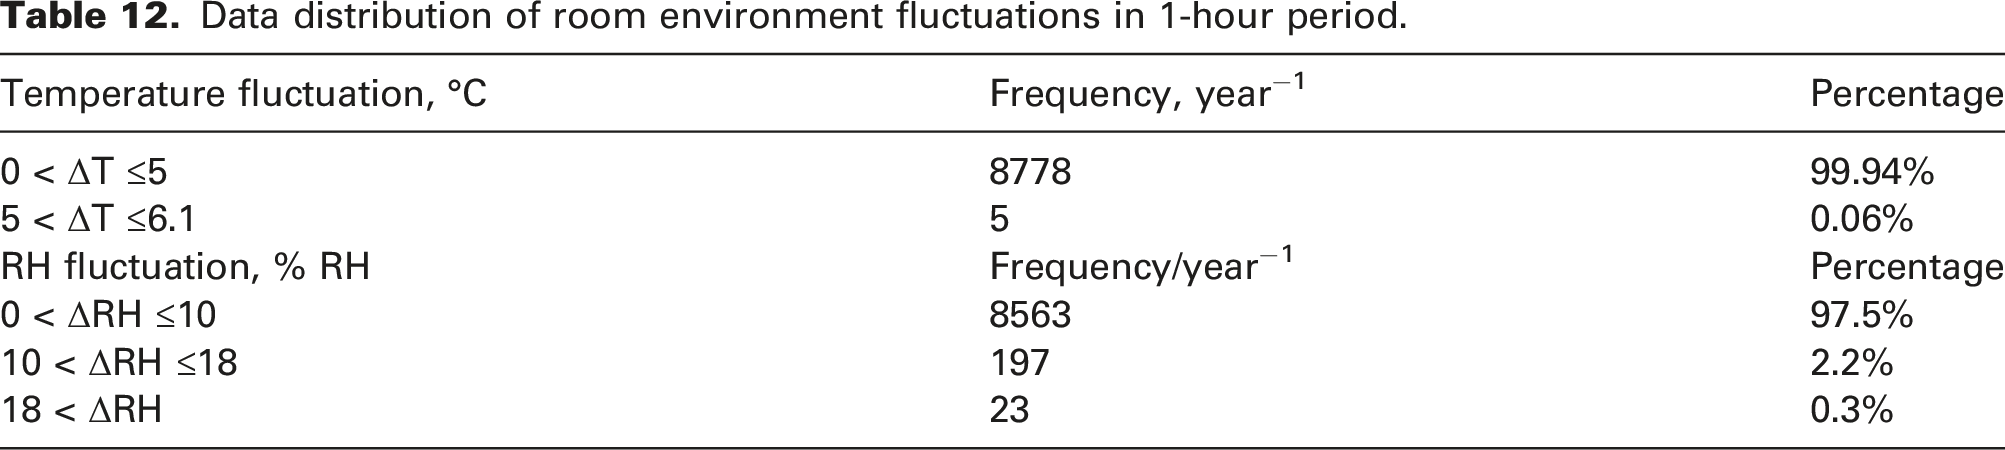
The precondition for utilising the enclosure was the implementation of an appropriate ACR to prevent the chemical damage associated with the greenhouse issue and high-concentration off-gassing accumulations. In addition, it was necessary to quantify the buffering capacity and calculate the duration of its effectiveness to accurately evaluate the benefits. In detail, there are three parts of the feasibility analysis: firstly, to assess the greenhouse problem by comparing mean values of temperature and RH in the micro-environment with the ones in the macro-environment; secondly, to assess the off-gassing problem based on conservators’ experience; and thirdly, to analyse one collection-year macro-environment data of on-site monitoring in a typical collection storage scenario with 1-hour fluctuations. The analysis of 1-hour fluctuations revealed that the buffering effect persisted when the on-site fluctuations exceeded 5°C and 10% RH. Therefore, any fluctuations equal to or greater than 5°C and 10% RH were deemed indicative of the existence of a buffering effect. Furthermore, the total duration of the buffering effect was summed up to quantify its benefits.
Results and discussions
Microstructure of the material
The scanning electron microscopy (SEM) images taken as the first step in the study (Figure 5) reveal the three-layer structure made of meshes of fibres and voids. The size of the voids increases from the outer-layer (1–5 μm) to the mid-layer (4–10 μm) and the inner-layer (5–15 μm). In the outer-layer, polypropylene is fused into the fibre surface, which creates hydrophobic properties and low water vapour permeability to avoid water damage from the ambient environment.
41
In the next two layers, cotton pulp, allowing spherical calcium carbonate particles to attach the fibre structure, turns them into thermal insulation layers.
42
The diameter of the particles is about 2 μm. The mid-layer is overlaid by multiple extra-fine membranes to increase the tortuosity of the micro-porous channels. The porous structure with grounded calcium carbonate regulates the uptake and retention of moisture.
43
Moreover, the small gaps between the membranes also increase vapour retention to enhance the moisture buffering capacity.
44
The inner-layer is one single mesh of cotton fibres. Apart from the voids in the mesh, the fibres have oval pores. These pores are about 1 μm on the short axis and 2 μm on the long axis. Both the voids and pores form micro-passages that makes vapour transfer easier here than in the mid-layer, thus decreasing the response time of moisture absorption and desorption. The microstructure of the specially fabricated paper is the key in regulating the heat and mass transfer through the enclosure. SEM images of the material.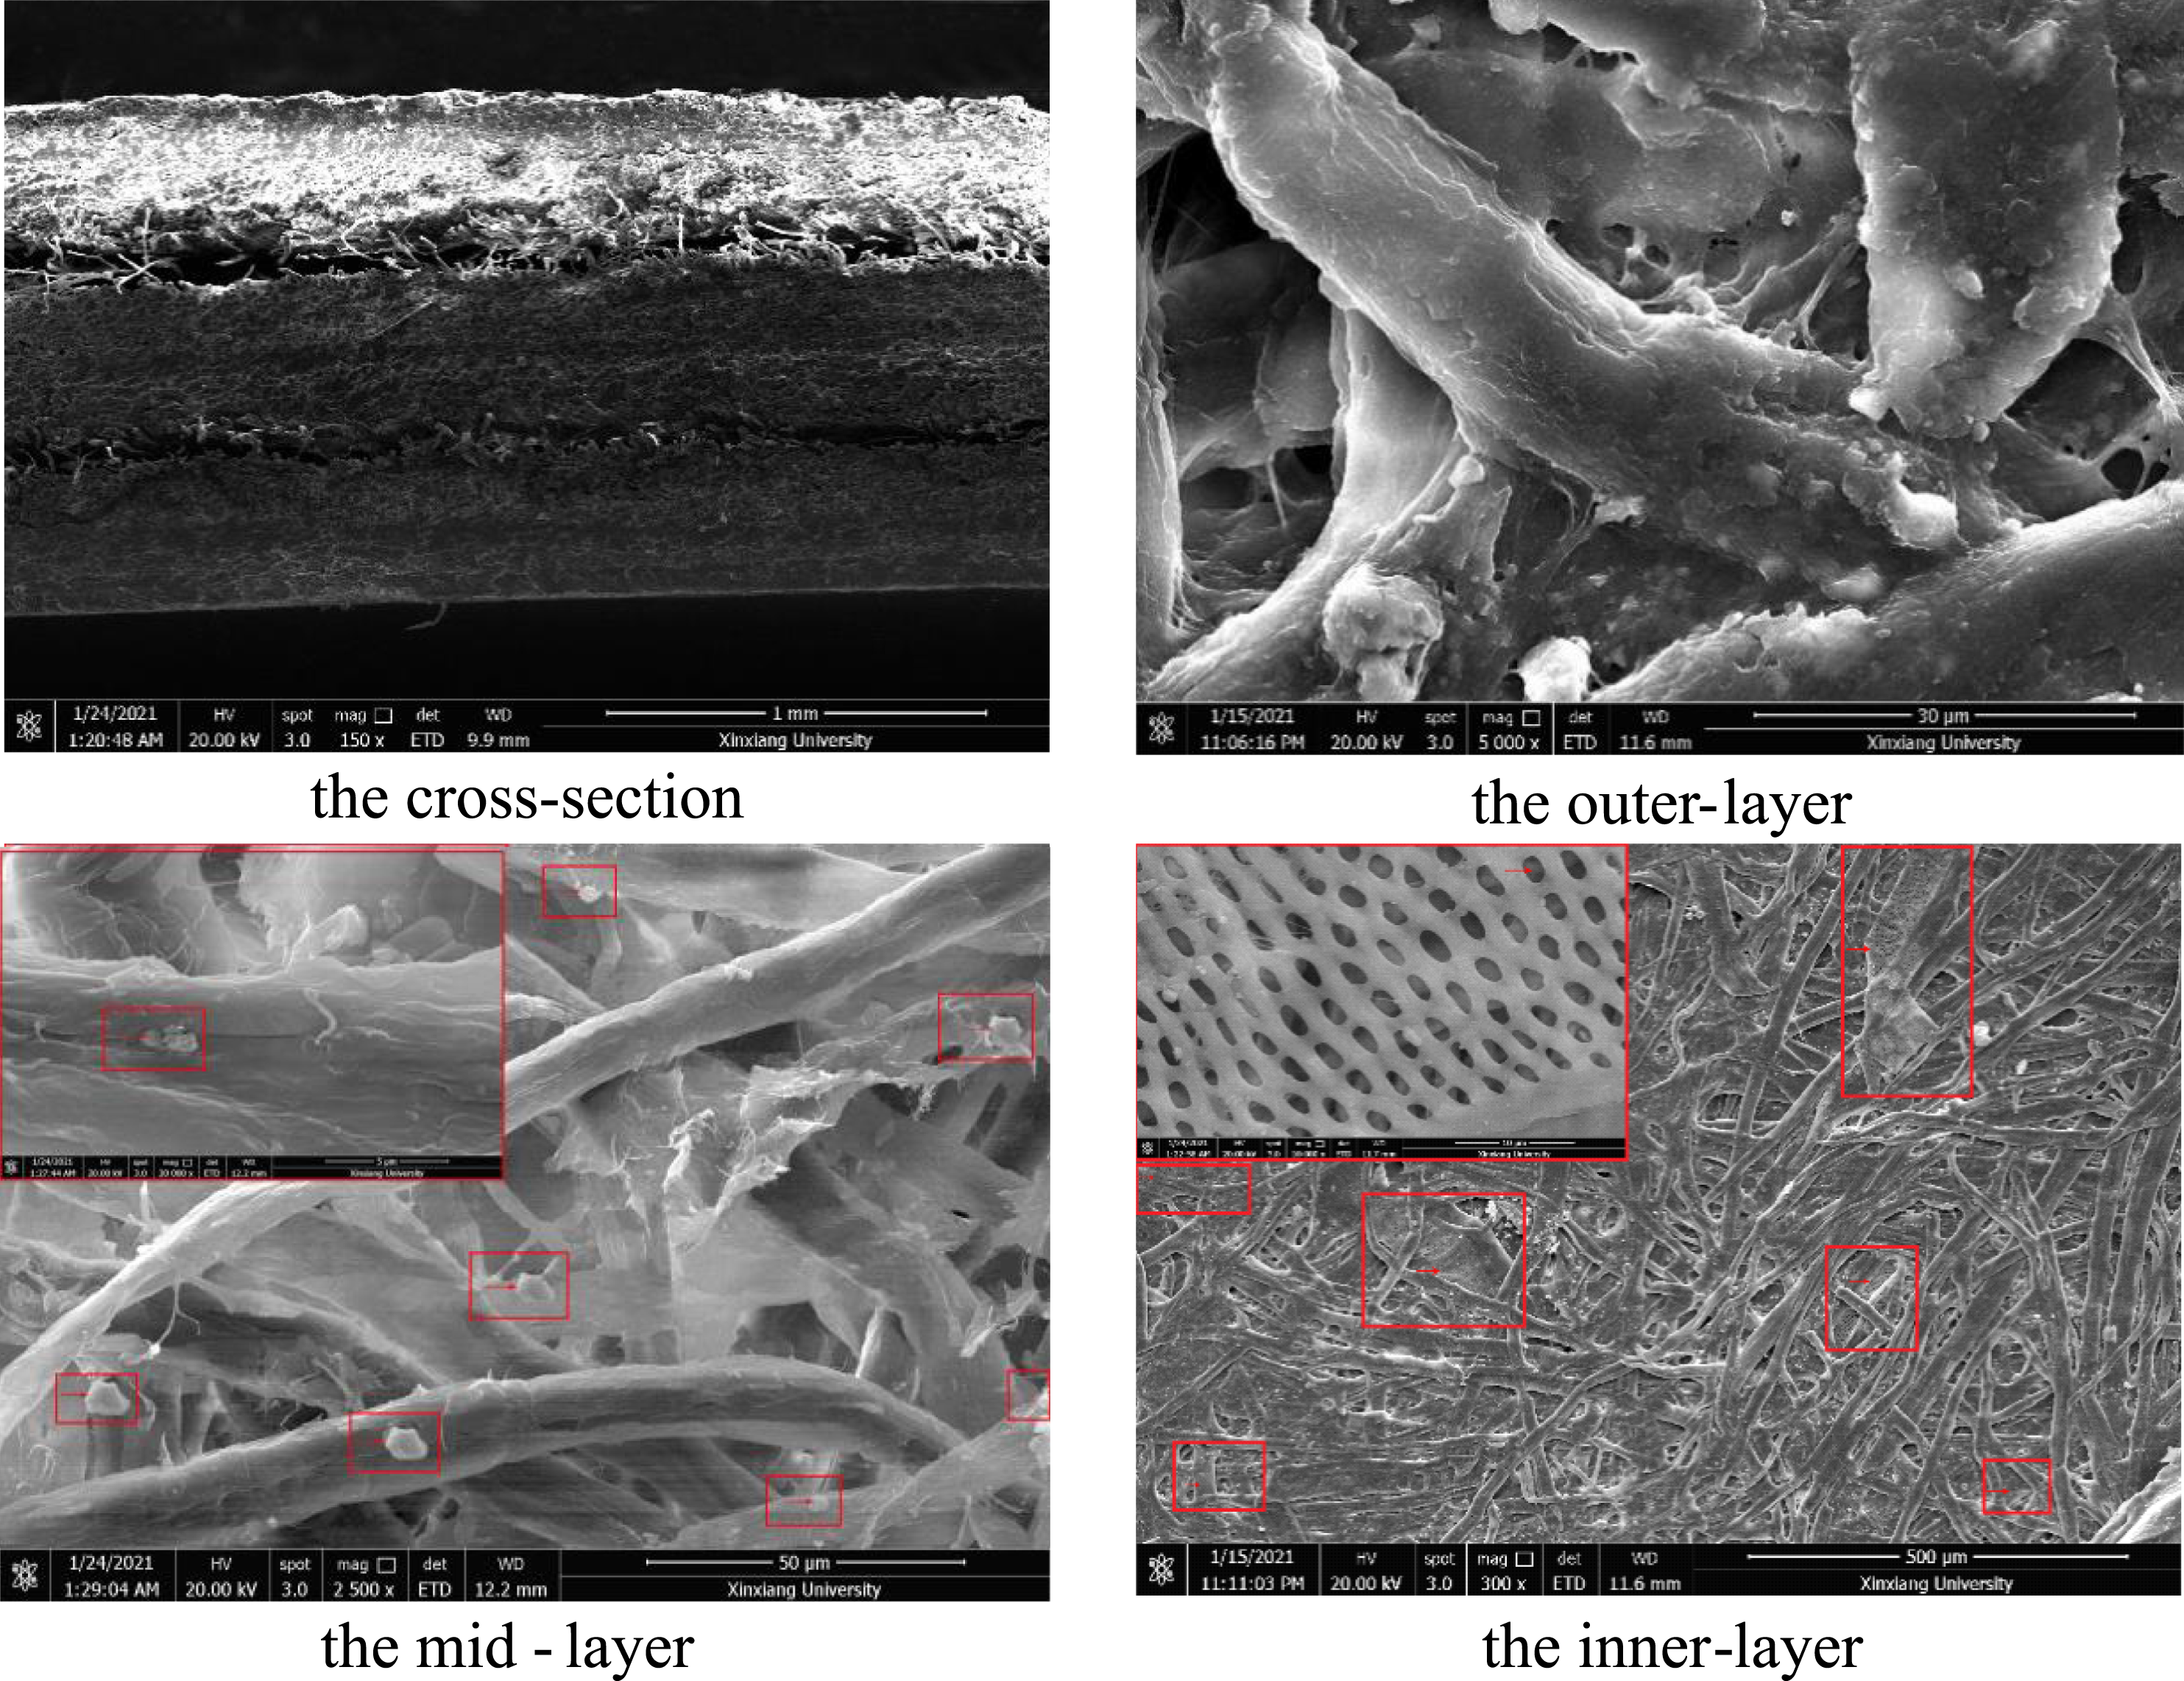
Figure 6 illustrates three functional layers of the material. The outer-layer provides low water vapour permeability to repel water vapour from passing through the tiny voids on the external surface. The mid-layer is a barrier stopping heat/cold from conducting through the material. The inner-layer is an excellent moisture absorbent to absorb ‘sweat’ inside the enclosure. Simultaneously, the ‘sweat’ can be seeped into the macro-environment because the size distribution of the gaps in the fabric structure creates the driving force of water vapour concentration gradient. Depending on the appropriate ACR, coupling between passive control (hydrothermal behaviour of the enclosure) and boundary control (the macro-environment control)
45
could create the buffering effect required for safe collection storage. Functional structure of the material.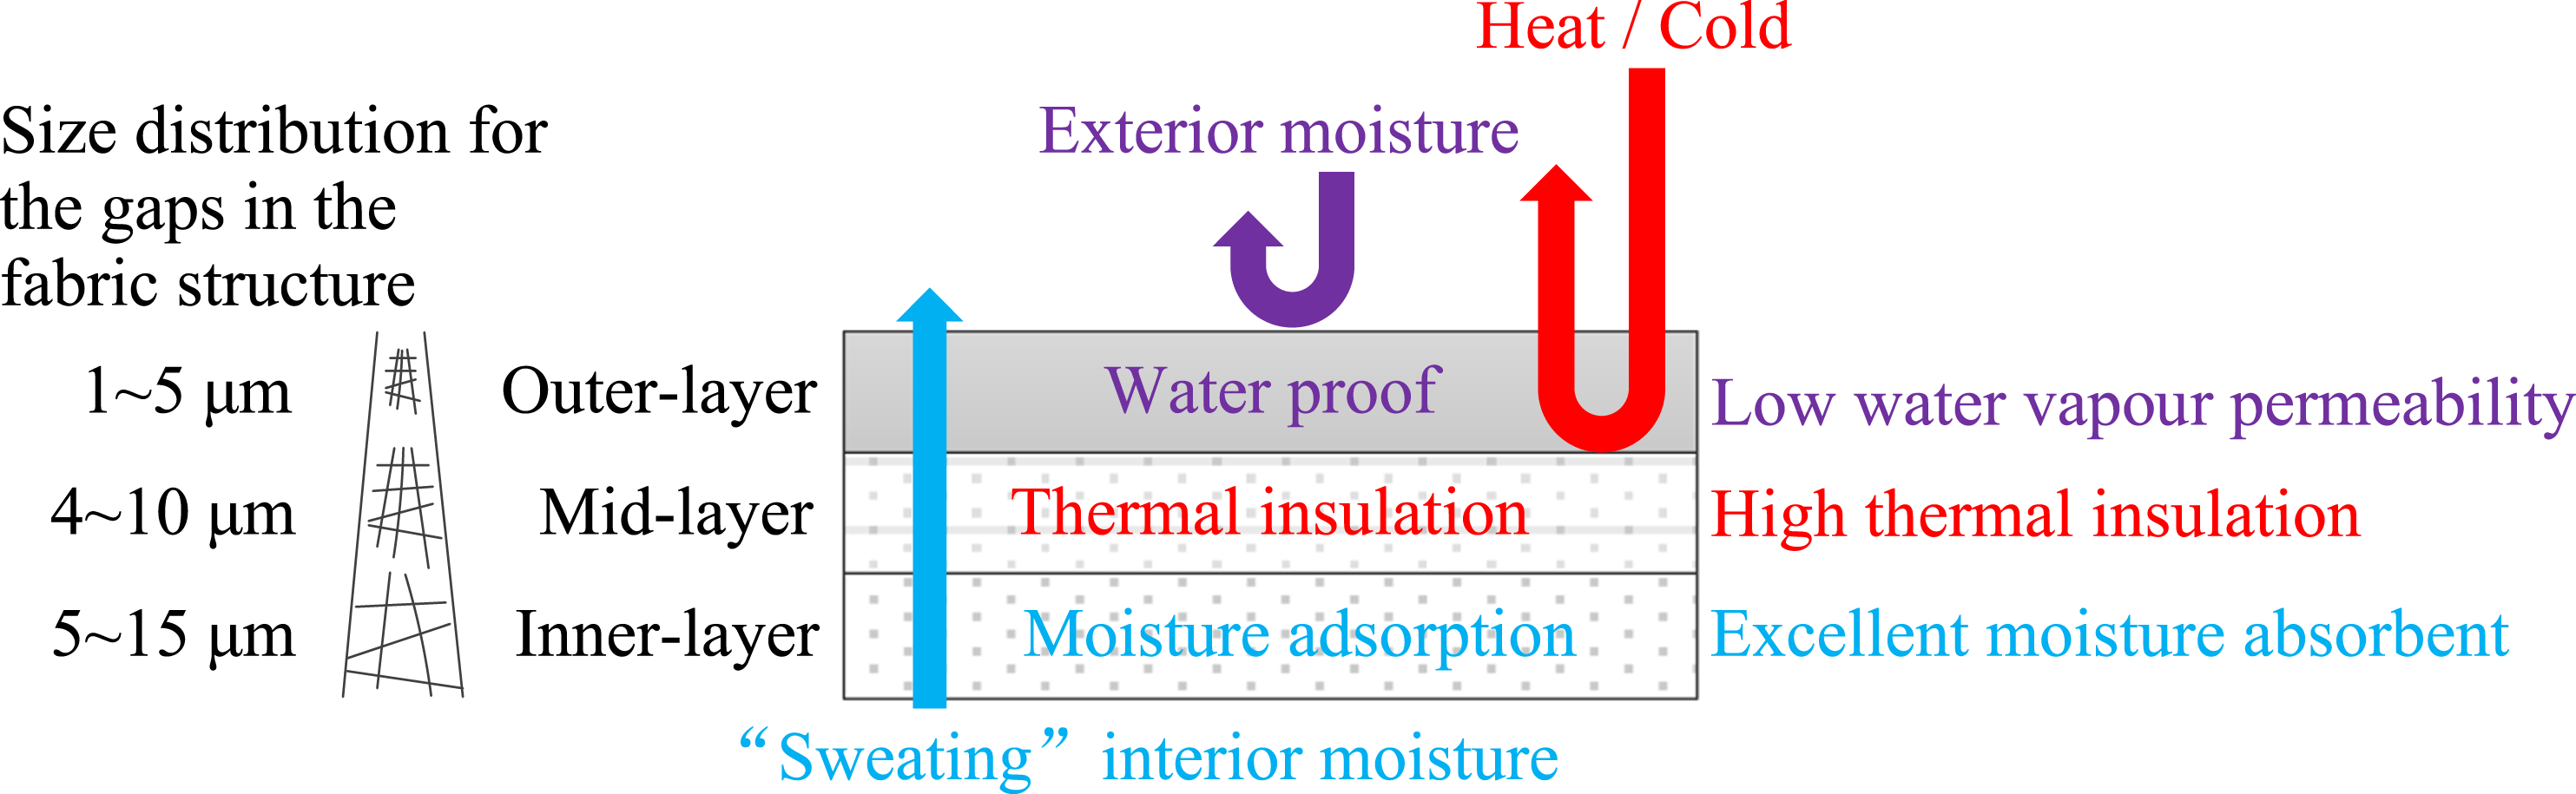
Thermal properties of the material
Thermophysical parameters of the material.
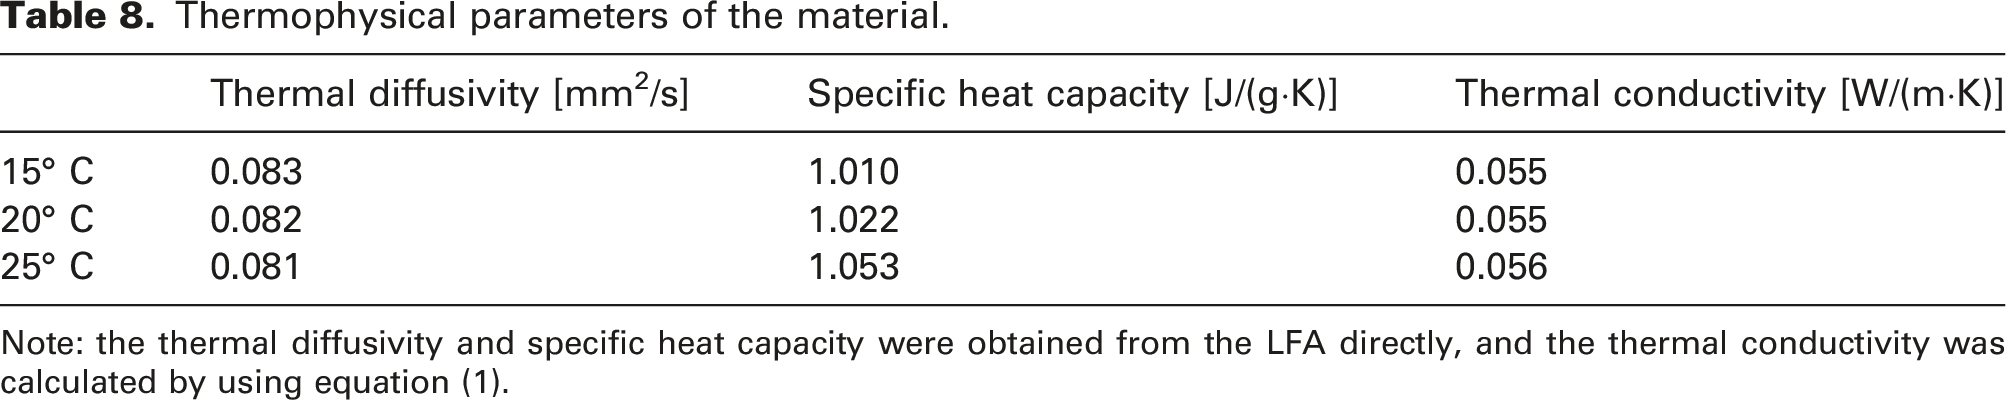
Note: the thermal diffusivity and specific heat capacity were obtained from the LFA directly, and the thermal conductivity was calculated by using equation (1).
Hygroscopic properties of the material EMC
Figure 7 shows the measurement results of EMC (equilibrium moisture content) curves. The curves are almost linear, which suggests that they are categorised as the linear middle section of reversible type II in major physisorption isotherms without hysteresis loop for moisture adsorption and desorption. This physical process occurs between the time when monolayer coverage is completed and capillary condensation begins to occur.
48
The linear correlation between EMC and RH suggests that the mass of moisture content absorbed or released from the material is constant in each degree of RH fluctuation (ΔEMC/ΔRH = approx. 0.12). This constant capacity of regulating moisture from the surrounding air helps to control a stable absolute humidity (AH) in the micro-environment. The decline in the AH could produce shrinkage of the collection materials due to moisture desorption; conversely, a rise in the AH could produce expansion of materials due to moisture adsorption.
49
Equilibrium moisture content at different temperatures.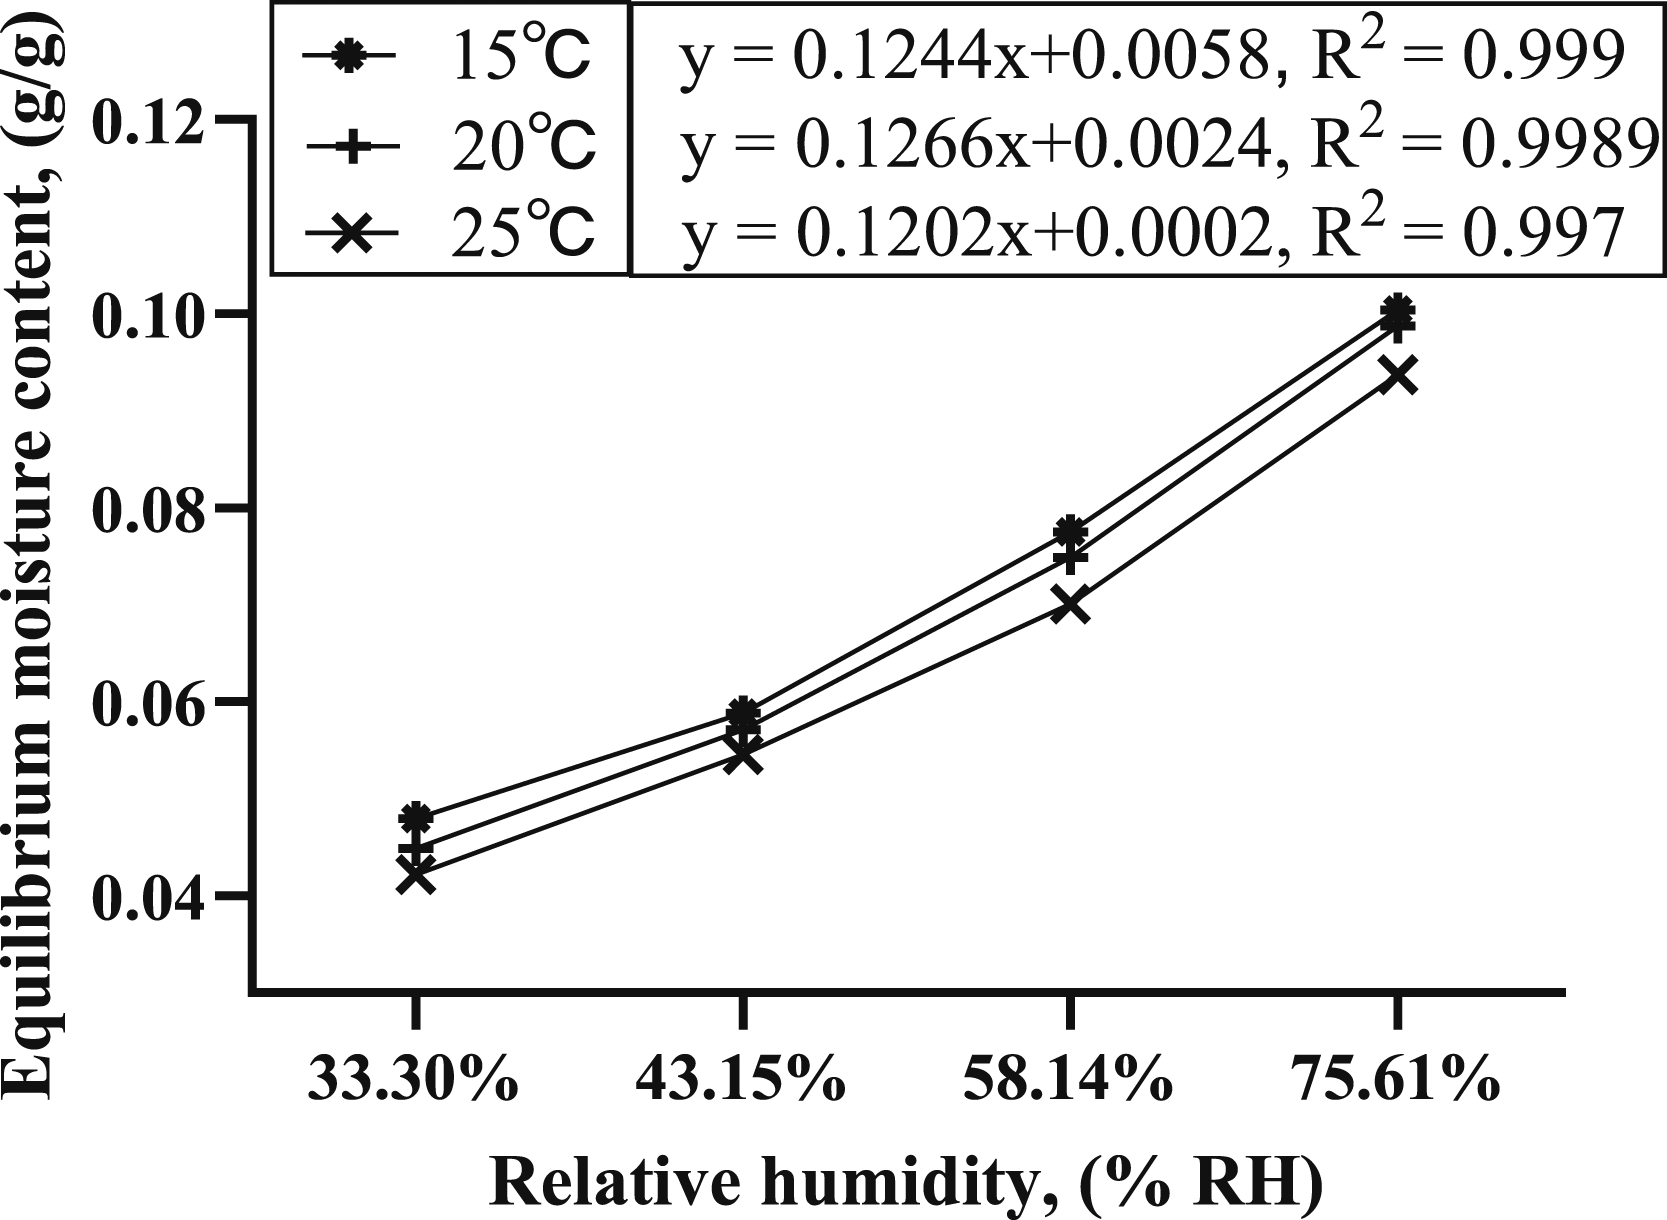
Comparing the EMC at different temperatures, the EMC at low temperatures is greater than that at high temperatures. Moisture retention of the material is slightly better at low temperatures than at high temperatures. EMC range is 0.048–0.080 g/g in 15–25°C and 40%–60% RH. Ideally, the maximum release or absorption of moisture can reach 3.586 g to regulate the micro-environment humidity in a complex process of moisture transfer. 50
Water vapour diffusion resistance coefficient
The mass change in the final six aligned points (unit: mg).
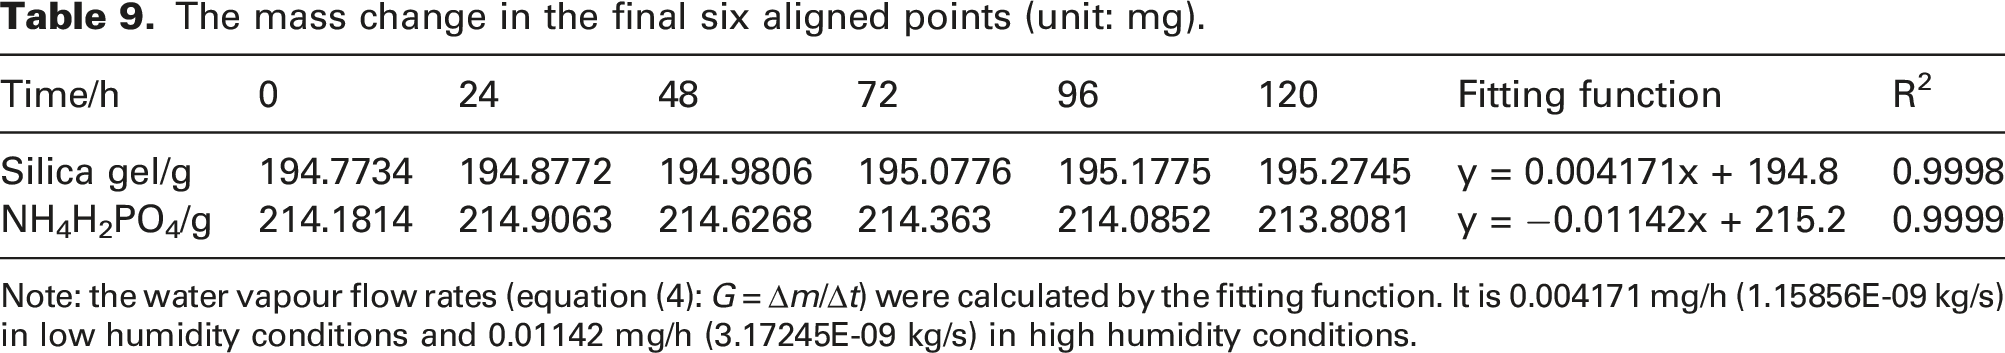
Note: the water vapour flow rates (equation (4): G = ∆m/∆t) were calculated by the fitting function. It is 0.004171 mg/h (1.15856E-09 kg/s) in low humidity conditions and 0.01142 mg/h (3.17245E-09 kg/s) in high humidity conditions.
Calculation of water vapour (wv) diffusion resistance coefficient.
Water vapour diffusion coefficient
Calculation of water vapour diffusion coefficient.
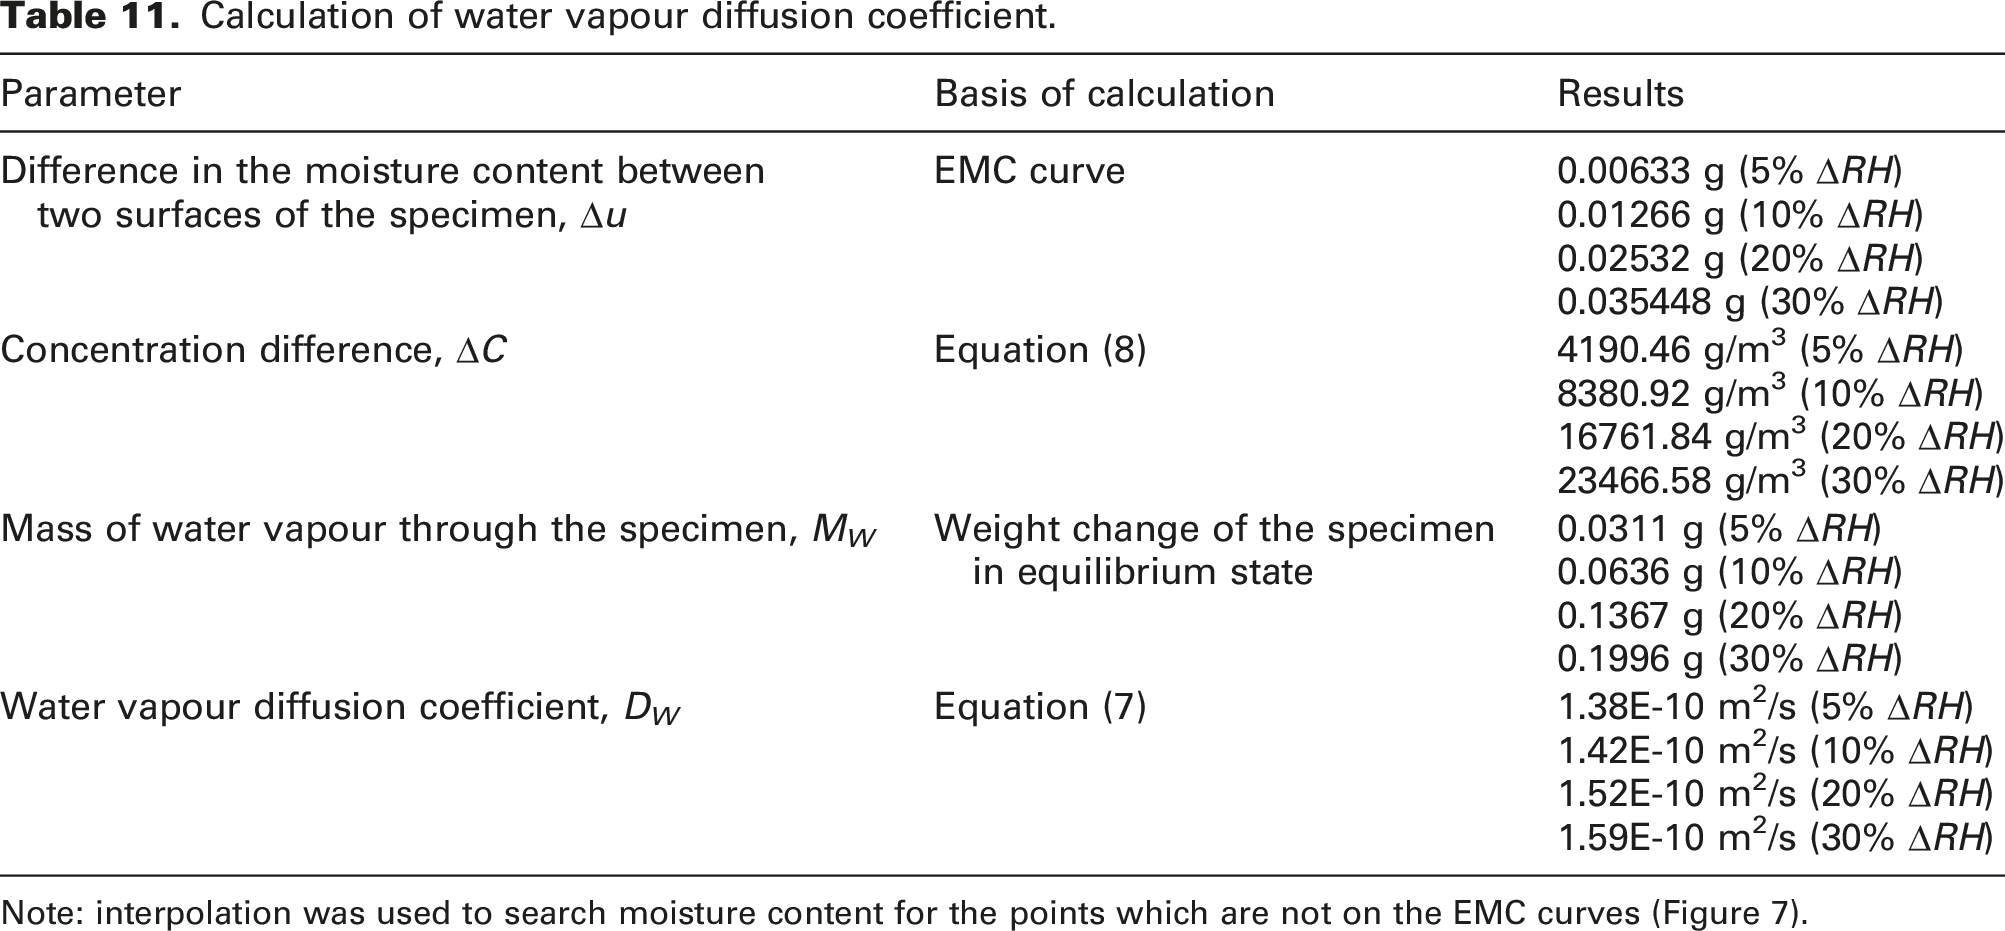
Note: interpolation was used to search moisture content for the points which are not on the EMC curves (Figure 7).
Air change rate of the enclosure
Figure 8 shows the concentration decay curves (background CO2 has been deducted). By fitting the measured decay curve into the custom format of equation (9) (R2 = 0.9998), 19.5 air changes per hour (ACH) were obtained. This suggests that, theoretically, all air in the micro-environment can be replaced with the air in the macro-environment for approx. 185 s. CO2 concentration decay inside the enclosure.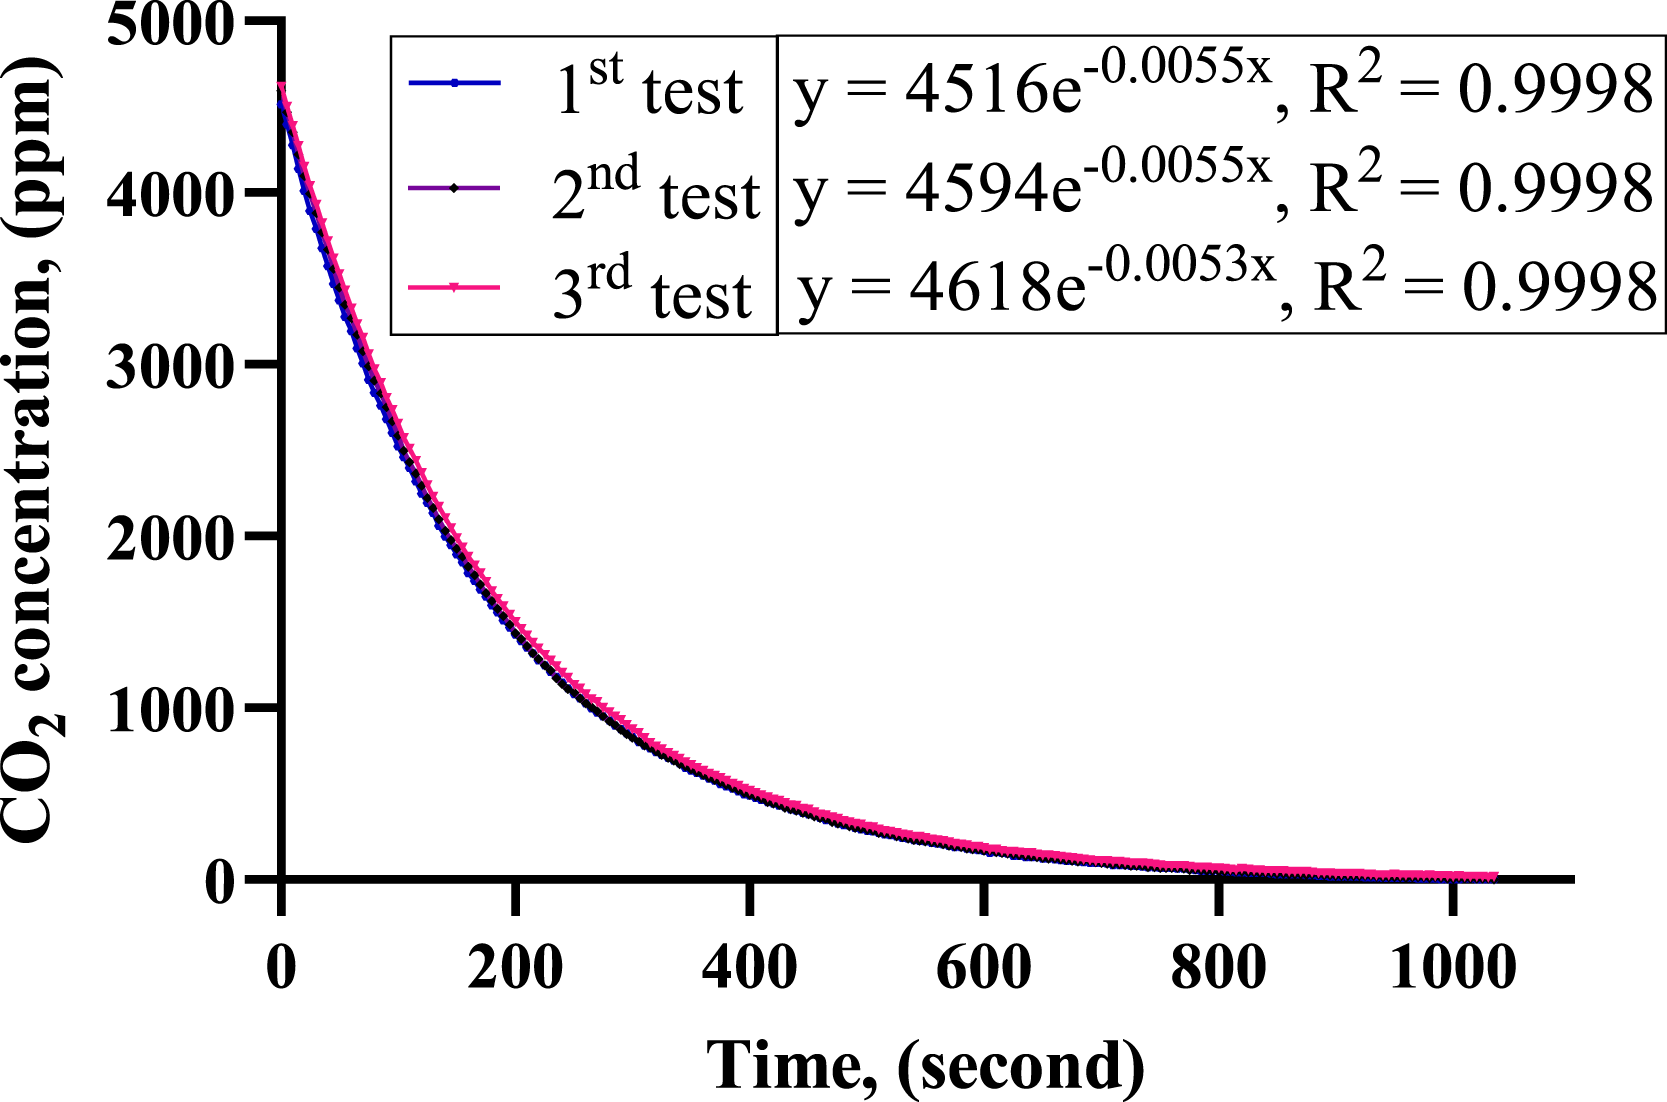
The ACR (air change rate) of this enclosure appears to be very high when compared to display showcases.52,53 However, this difference can be attributed to the fact that the showcases were tightly sealed to isolate their micro-environment from the macro-environment, including the hygrothermal conditions of the exhibition areas that visitors can affect. Additionally, the micro-environment in each showcase was actively monitored and controlled by a mini air-conditioning device inside. In contrast, the enclosure discussed here was used in a storage room where visitors’ behaviour does not impact the hygrothermal conditions. Furthermore, it needs to be breathable to dilute the concentration of off-gassing released by the collections. This practice is necessary for collection care, and a relatively high ACR is considered normal, even though no assessment has been conducted to determine a specific ACR that would prevent pollution-related damage.
It would be interesting to find the acceptable ACR based on the upper limit of the off-gassing concentration to safeguard the collections. However, the limit is considered on a case-by-case basis due to complex chemical reactions in various collections materials.54,55 The previous observation did not find noticeable chemical damage amongst the collections stored in such type of enclosures over years. Hence, we accepted the current level of ACR in the enclosures in testing the buffering effect.
Temperature and humidity buffering effect of the enclosure
Figure 9 shows recorded temperature and RH fluctuations. The results demonstrate that micro-environment fluctuations are 1–2°C and 2%–8% RH smaller than macro-environment ones with approximate 2–7 min (temperature) and 4–9 min (RH) time lags. By increasing the fluctuation period, temperature and RH differences between micro-environment and macro-environment are reduced until heat and mass transfer reach a relatively steady state. The differences are <0.5°C and <1% RH when their fluctuation periods are longer than 180 min and 600 min, respectively. Considering the measurement errors, the buffering effect was detected in 5°C fluctuations at 17–22°C and fixed 50% RH during <180 min period and 10% RH fluctuations at 50%–60% RH and fixed 20°C during <600 min period in the similar simulation test. Temperature and RH in the chamber and enclosure: (a) No. T1 60-minute period; (b) No. T2 120-minute period; (c) No. T3 180-minute period; (d) No. RH1 60-minute period; (e) No. RH2 240-minute period; and (f) No. RH3 600-minute period.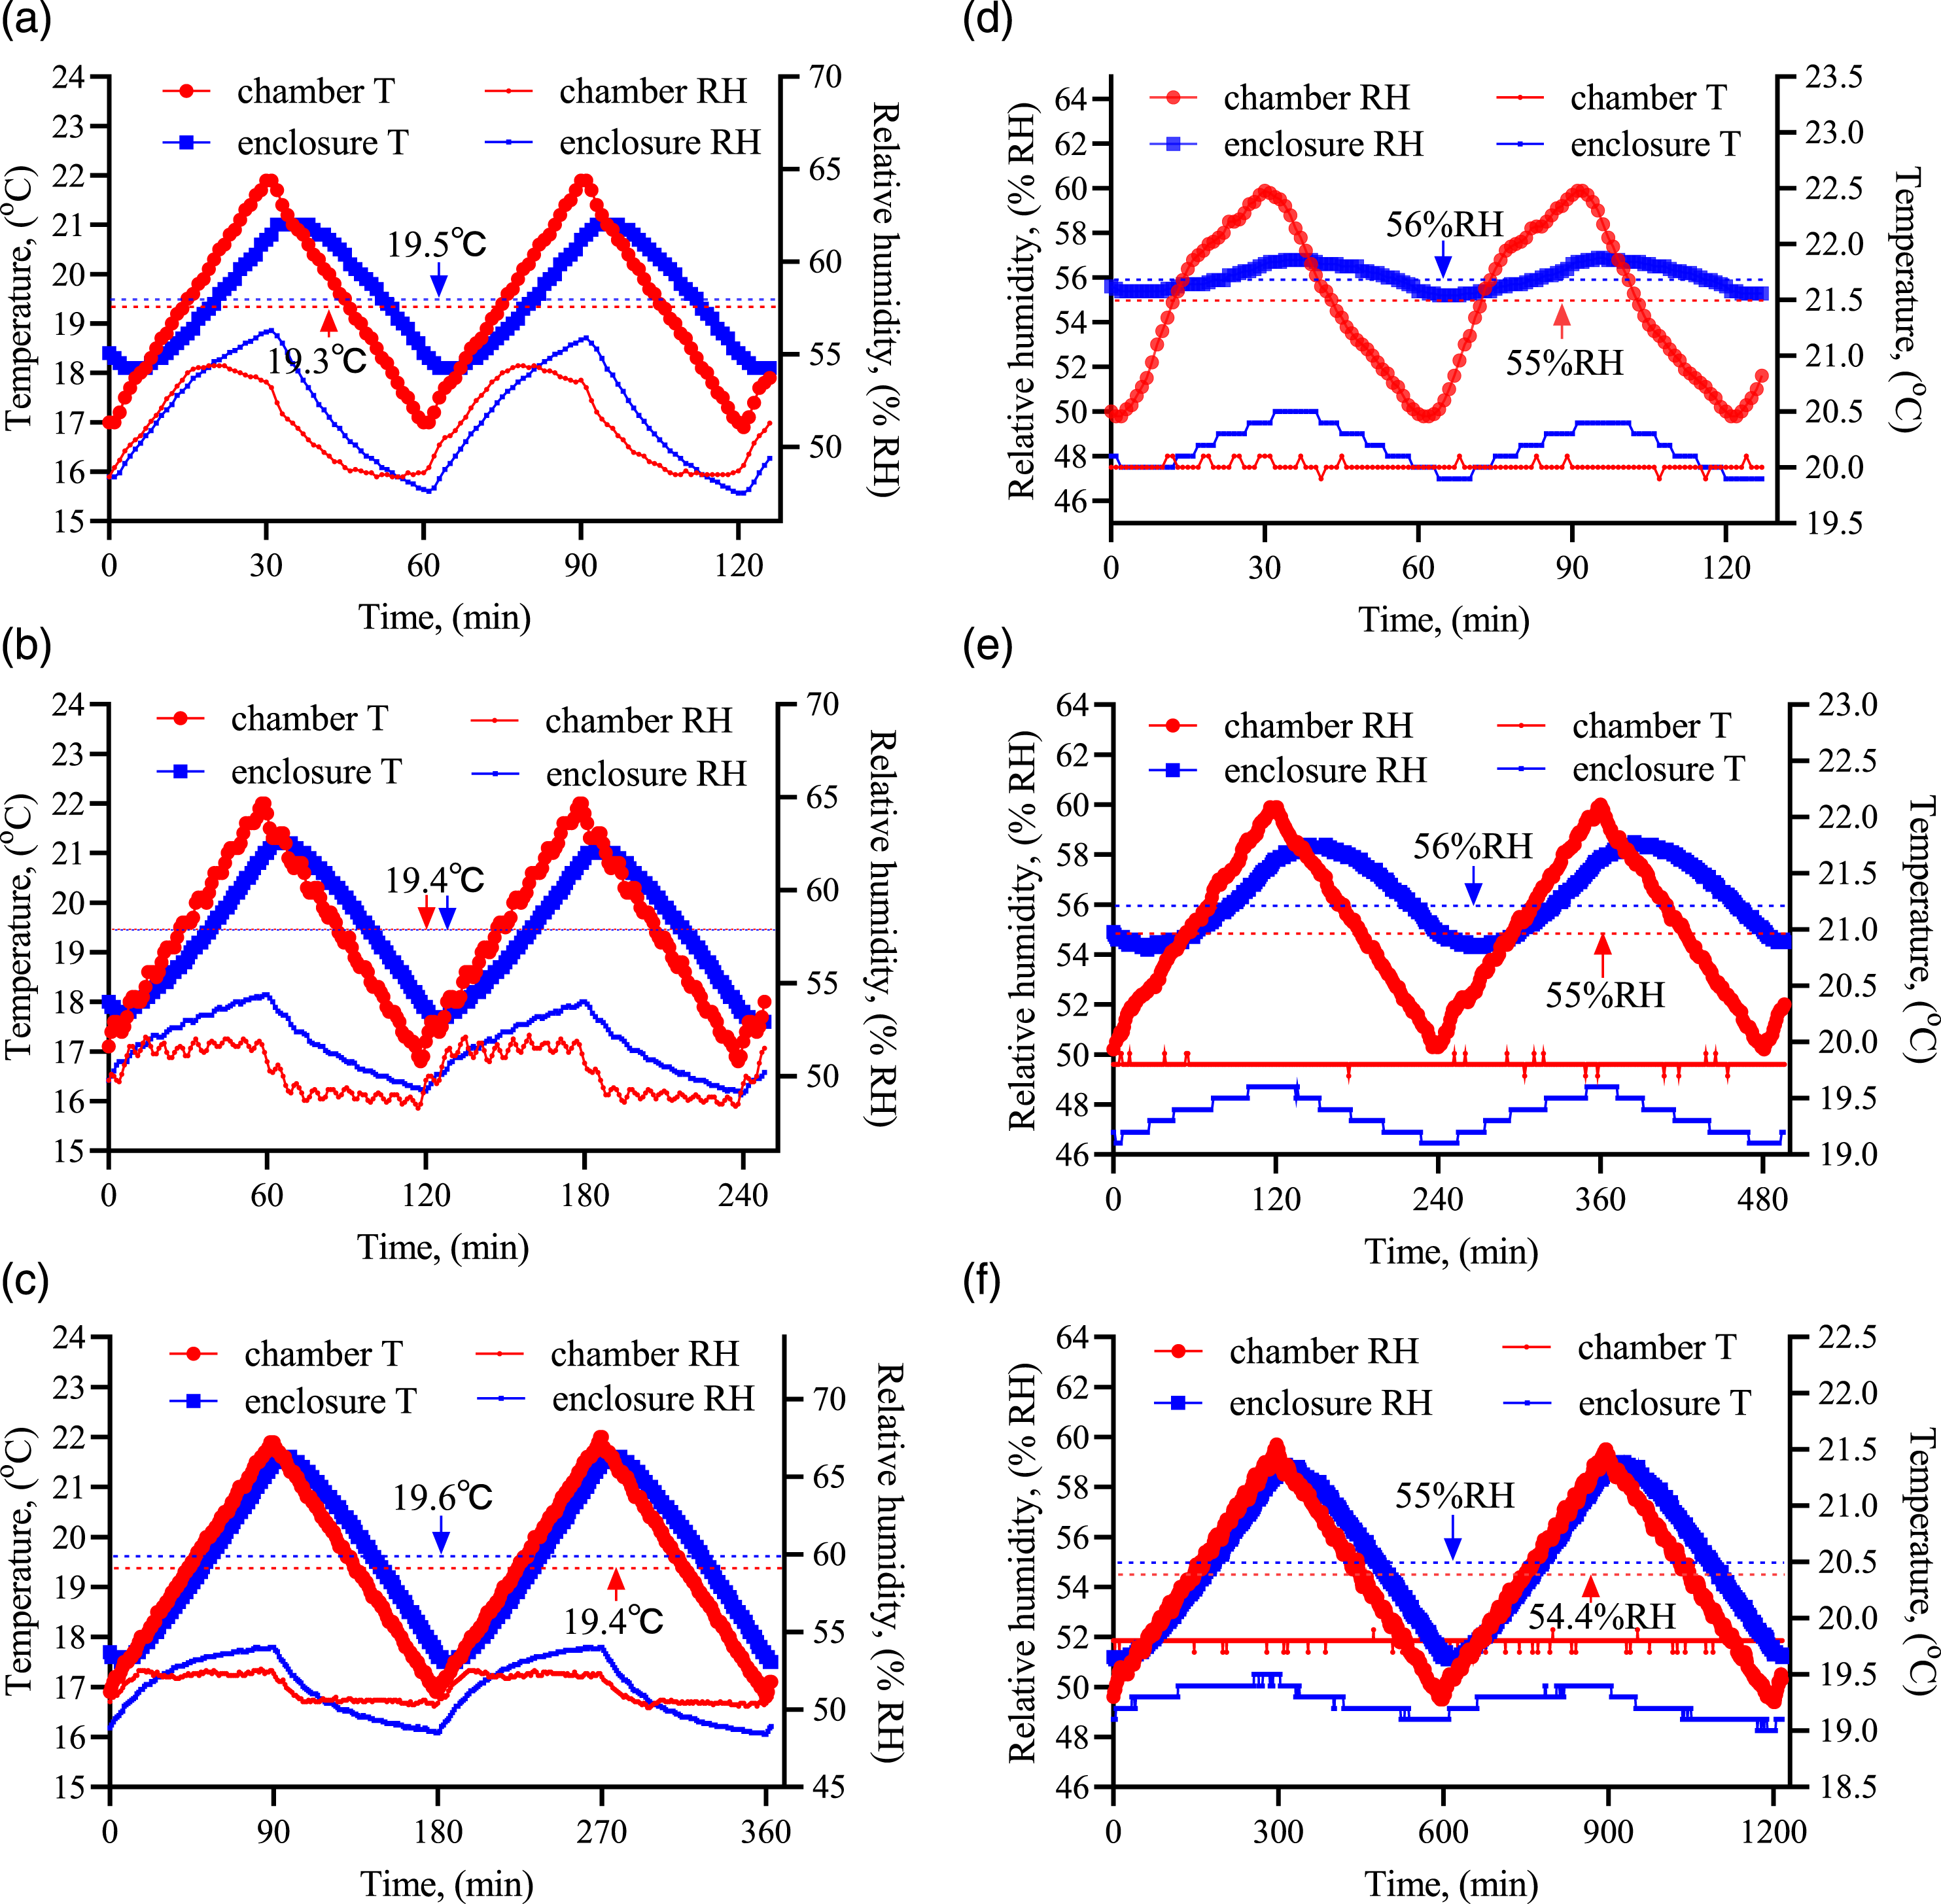
Figure 10 shows the quantitative results: the values of TB (temperature buffering) and AR
T
are 2°C and 0.6, 1.6°C and 0.68 and 1°C and 0.8 for ↑↓5°C macro-environment fluctuation during 60 min, 120 min and 180 min periods at fixed 50% RH. The values of HB (humidity buffering) and AR
RH
are 8% RH and 0.2, 6% RH and 0.4 and 2% RH and 0.8 for ↑↓10% RH macro-environment fluctuation during 60 min, 240 min and 600 min periods at fixed 20°C. The time lags between their extremums are 2–7 min for temperature fluctuations and 4–9 min for humidity fluctuations. These quantitative results prove that a degree of buffering can be created by using the enclosure for short-term macro-environment fluctuations. Due to pure curiosity, a few extra tests were carried out for the enclosures with some paper-based collections. The results showed increased buffering capacity. This supports our earlier assumptions. Quantitative indicators for buffering effect: (a) temperature buffering and (b) humidity buffering. Note: MiF is micro-environment fluctuations; macro-environment fluctuations (MaF) were fixed at 5°C for TB test and 10% RH for HB test; time lag is time between the peaks/troughs of MiF and MaF.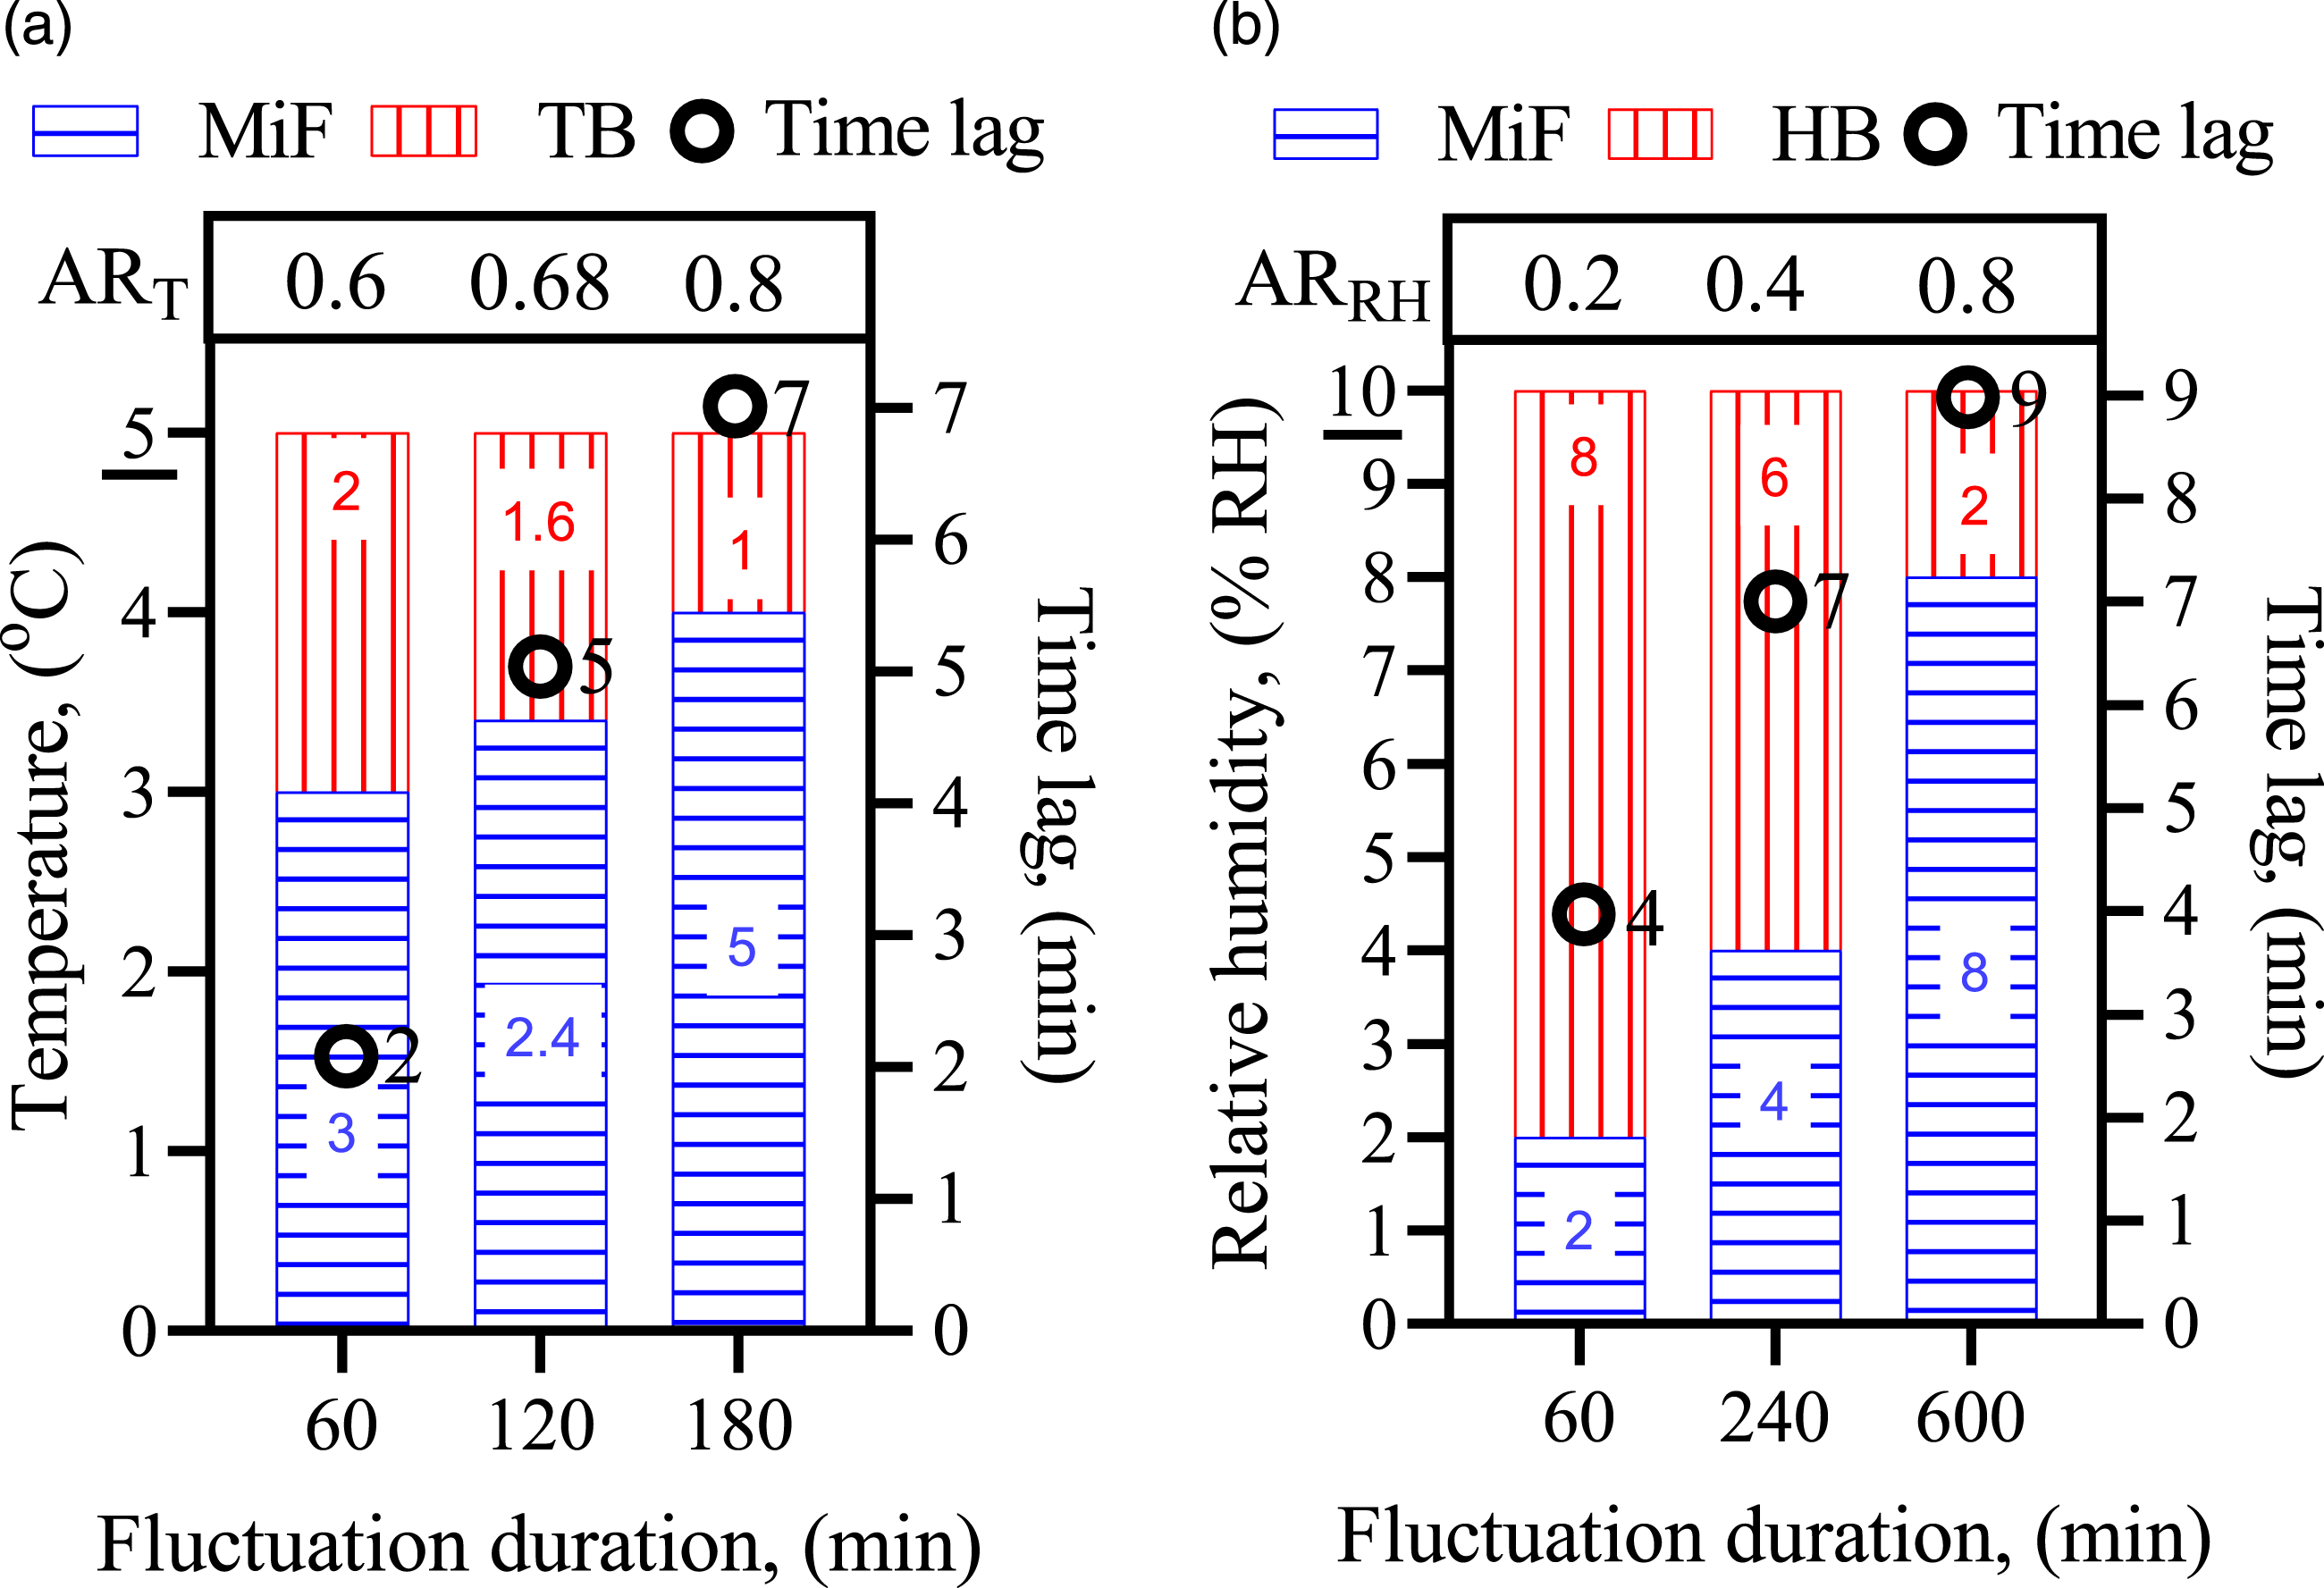
Maximum deviations of average temperature and RH between the micro-environment and macro-environment are 0.2°C and 1% RH. This suggests that the average temperature and RH in the micro-environment can follow the macro-environment while the fluctuations are mitigated. Hence, the greenhouse problem can be avoided. The desired micro-environment can be maintained without the need for any additional real-time monitoring solutions inside the enclosure.
Data distribution of room environment fluctuations in 1-hour period.
The buffering capacity can provide a more stable micro-environment for preventive conservation when the macro-environment temperature and RH are within the allowable fluctuations. If we focus on the micro-environment rather than the macro-environment for environmental regulation, the tight control of the macro-environment can be relaxed for energy saving in theory.
However, we recognise that our study has the following limitations: (1) There is a lack of scientific assessment for off-gassing accumulation levels under this ACR. However, measurement of this is beyond the scope of this research because the pollutant interactions are too complicated to quantify and manage even in the field of preventive conservation. (2) The frequency analysis of in-site temperature and RH fluctuations focused on hourly fluctuations only. The main reason for this is how the setting of sampling intervals in the BMS (building management system) needs to be done. In this instance, it was pre-set, and if fixed at 15 min, 30 min and 45 min, fluctuations would be quite small when they were compared with the accuracy of the temperature and humidity logger. (3) The minimum duration was also 1 hour in a similar simulation test. The shorter duration should be considered for further study when there is a sufficiently accurate climate chamber for this work. (4) Because of the limitation of chamber control for de-coupling temperature and RH, the fixed parameters cannot be stabilised at the setpoint. Comparing fluctuations of the fixed parameter between the micro-environment and macro-environment, there is an unexplainable phenomenon: the micro-environment fluctuations were slightly greater than the macro-environment ones. This phenomenon may relate to some complex reactions inside the material, but it should be studied further. (5) It is difficult to conduct a standardised and long-term assessment of the enclosure’s life-cycle performance due to the unique usage patterns and random usage frequency. In practice, if an enclosure shows signs of appearance deformation, it is typically replaced with a new one.
Conclusions
A storage enclosure made from functional paper-based materials was investigated to assess its feasibility in collection storage. Four kinds of property measurements (thermophysical property, hygroscopic property, ACR and buffering effect of temperature and RH) were conducted and two aspects of contents, safeguarding and buffering capacity, were analysed. The following conclusions were derived: (1) Using the storage enclosure can achieve an improvement of the micro-environment without the environmental risks caused by undesirable temperature and RH fluctuations, greenhouse problems and off-gassing concentration. (2) The properties of the paper-based material were essential in providing a buffering effect with waterproofing and thermal insulation. An appropriate ACR helped to dilute the off-gassing concentration and regulate the average temperature and relative humidity within the enclosure for collection care purposes. (3) Two types of indicators, absolute reduction of fluctuation and relative ratio of the amplitude, were proposed to quantify the buffering capacity. (4) It is feasible to use the enclosure to mitigate short-term temperature and RH fluctuations of the macro-environment in the storage room.
This study has a great significance for evaluating the buffering capacity of the enclosure and gives us an assurance to continue boxing our collections in storage as a common practice. With paper-based collections inside the enclosures, the buffering effects would be stronger. In addition, it provides boundary conditions for further numerical simulation study of heat, air and moisture transfer between micro-environment and macro-environment, which might open up an opportunity to relax environmental controls and consequently reduce the energy use in the service operation.
Footnotes
Author contributions
BH: methodology, data acquiring and analysing, writing – original draft and writing – review and editing. FW: conceptualisation, methodology, writing – review and editing and supervision. XQL: methodology, resources and supervision. JB: conceptualisation and writing – review and editing. IS: conceptualisation. All authors have read and agreed to the published version of the manuscript.
Declaration of conflicting interests
The author(s) declared no potential conflicts of interest with respect to the research, authorship, and/or publication of this article.
Funding
The author(s) disclosed receipt of the following financial support for the research, authorship, and/or publication of this article: The work was a part of 3-year PhD study, funded by the Energy Technology Partnership, Scotland (ETP 173-2019).