
Abstract
Indoor air quality (IAQ) is an important aspect of maintaining human health and well-being, particularly since people spend most of their time indoors. Carpets, with their large surface area and dense fibre piles, have the potential to significantly impact IAQ by emitting and absorbing volatile organic compounds (VOC) from building materials and human activities. The cleaning effect of wool carpets regarding the sorption of odours from two sources of pollution: hardboard and sweaty underwear (as a proxy for bio-effluents), was investigated with an untrained panel of subjects assessing the odour intensity and the acceptability. Tests were performed in three different test environments, including a sniffing table, CLIMPAQs, and full-scale test chambers. The outcome showed that wool carpets can potentially clean the air of odours in small-scale environments, where the wool carpet covers the floor and walls of the test environment, and the odour sources are in contact with the wool carpet. However, the results were less conclusive in on scale scenarios where wool carpets only covered the floor. Overall, wool carpets have the potential to ad(b)sorb odorous emissions, but only when these emissions are near the wool carpet, and thus can have the opportunity to be ad(b)sorbed.
Introduction
Nowadays, most people spend between 80% and 90% of their time indoors. 1 Hence, indoor air quality (IAQ) is crucial for maintaining human health, comfort, and well-being since indoor environments expose residents to a variety of pollutants for extended periods. 2 In addition, most pollutants have consistently higher indoor concentrations than outdoor concentrations, especially in situations with reduced ventilation (including infiltration) due to energy-saving measures in buildings.3,4 A major part of these pollutants are organic chemical gases, including volatile organic compounds (VOC), very volatile organic compounds (VVOC) and semi-VOC (relatively low volatility VOC), which can cause a number of health issues, including irritation of the nose, eyes and throat, loss of coordination, headaches, nausea and damage to the kidney, liver and central nervous system. 5 Several sources of volatile organic compounds can be encountered indoors, namely: emissions from building materials, furnishing and furniture; people and their activities (such as bioeffluents through exhaling and skin emissions, heating, cooling, cooking, using printers, cleaning, etc.); and outdoor sources.2,6
Flooring materials can significantly impact IAQ because they usually cover large surfaces and consist of multiple layers of different materials. 4 Amongst flooring materials, carpets probably have the largest potential to affect IAQ due to their large surface area of dense fibre piles. About 10 million fibres per square metre make up the carpet piles, which offer a variety of pollutants for emission and sink effects of indoor air pollutants. 7 As a result, several studies have reviewed how carpets affect indoor air quality regarding emission, sink and transformation of VOC from carpets.8,9
The introduction of several voluntary standards for monitoring VOC emitted by carpets has stimulated the manufacturers to produce carpets with less primary emissions.10,11 However, information on secondary emissions as well as the sorption of VOC by carpets is lacking. 8 Carpet materials have been shown to be able to ad(b)sorb VOC.4,12–18 Moreover, from the carpets available, it has been seen that wool carpets are the most promising.13,19 These studies used chemical measurement techniques such as gas chromatography-mass spectrometry (GC-MS), gas chromatography system equipped with a flame ionization detector (GC-FID), proton transfer reaction mass spectrometry (PTR-MS) and solid-phase microextraction (SPME) to evaluate the ab(d)sorption and desorption of VOC on carpets.4,12–18 In most cases, only one or two chemical compounds were used as sorbents for experiments with concentrations higher than in real-life settings such as living rooms and workplaces. However, these chemical analysis techniques come with challenges. They require sophisticated equipment, skilled personnel and time-consuming sample preparation steps, which can introduce experimental errors. Additionally, detecting and quantifying VOC accurately in real-life settings, where mixtures of VOC are present at low concentrations, can be challenging using standard analytical methods. 18 In such cases, sensory assessment can be used to determine the overall perception of indoor air. 20 Sensory assessment is relatively cost-effective, non-intrusive and captures the overall sensory experience in real-life settings. It should be noted, however, that sensory assessments are subjective and influenced by individual variations. They cannot provide specific information about the chemical composition of VOC. Nonetheless, sensory evaluation has been used in studies to assess the impact of ozone elimination using building materials and to predict the perceived IAQ when multiple materials simultaneously contribute to indoor air pollution. 21 In addition, in another study, a trained panel of judges was used to predict how indoor air is perceived when polluted by different materials simultaneously; the results indicated that the total sensory pollution load in a space, as a first approximation could be predicted by the simple addition of the values of the single sources. 22 Therefore, sensory assessments are beneficial in determining variations caused by indoor chemistry, especially when conventional analytical methods for evaluating indoor air cannot detect those variations. 23
Considering the current need for improving IAQ, it seems therefore important to study in depth whether low-emitting wool carpets can contribute to ‘cleaning’ the air by ad/absorption.
Materials and Methods
Study Design
This study was performed to answer the following question: Can low-emitting wool carpets ‘clean’ the air? To answer this question, the wool carpet with the lowest odour intensity and highest acceptability was chosen from eight wool carpets by sensory evaluation using a sniffing table (pilot test). All the carpets comprised 100% wool in loop piles and had a backing of polyester felt, polypropylene or jute. Then, the odour of the combination of the carpet and an odour source (i.e., hardboard or sweaty underwear) as well as only the odour source, were assessed by a panel of untrained subjects to determine whether the carpet can ad(b)sorb the odour emissions of that pollution source. Experiments were performed in different test environments by sensory evaluation and total VOC (TVOC) monitoring.
Test environments
For this study, three different types of ‘test environments’ were used as follows: 1. Two of the four full-scale test chambers (each with a volume of 11.38 m3, floor area 5.37 m2 × 2.12 m height) of the SenseLab,
24
with mechanical air supply (filtered by an F7 and a HEPA filter) and overpressure-based exhaust grilles. For assessing the air in the chambers without entering them, a flexible aluminium duct (funnels) (125 mm in diameter) is attached to the exhaust grilles (Figure 1(a)). 2. Two 50 L CLIMPAQs (Chamber for Laboratory Investigations of Materials, Pollution and Air Quality), mainly made of glass – an inert material, placed in the third full-scale test chamber (Figure 1(b)). A single internal fan moves air horizontally through the glass chamber with the test specimens inside.25,26 Air can be assessed through a sniffing funnel. 3. A sniffing table for assessing odorous sources is placed in plastic containers, located in the fourth test chamber. Air from the container can be assessed through a sniffing funnel in the lid of the container, which comprises a small fan ventilating the air via another hole in the lid of the container (Figure 1(c)).
24
Test environments: (a) test chambers; (b) CLIMPAQs; (c) sniffing table.
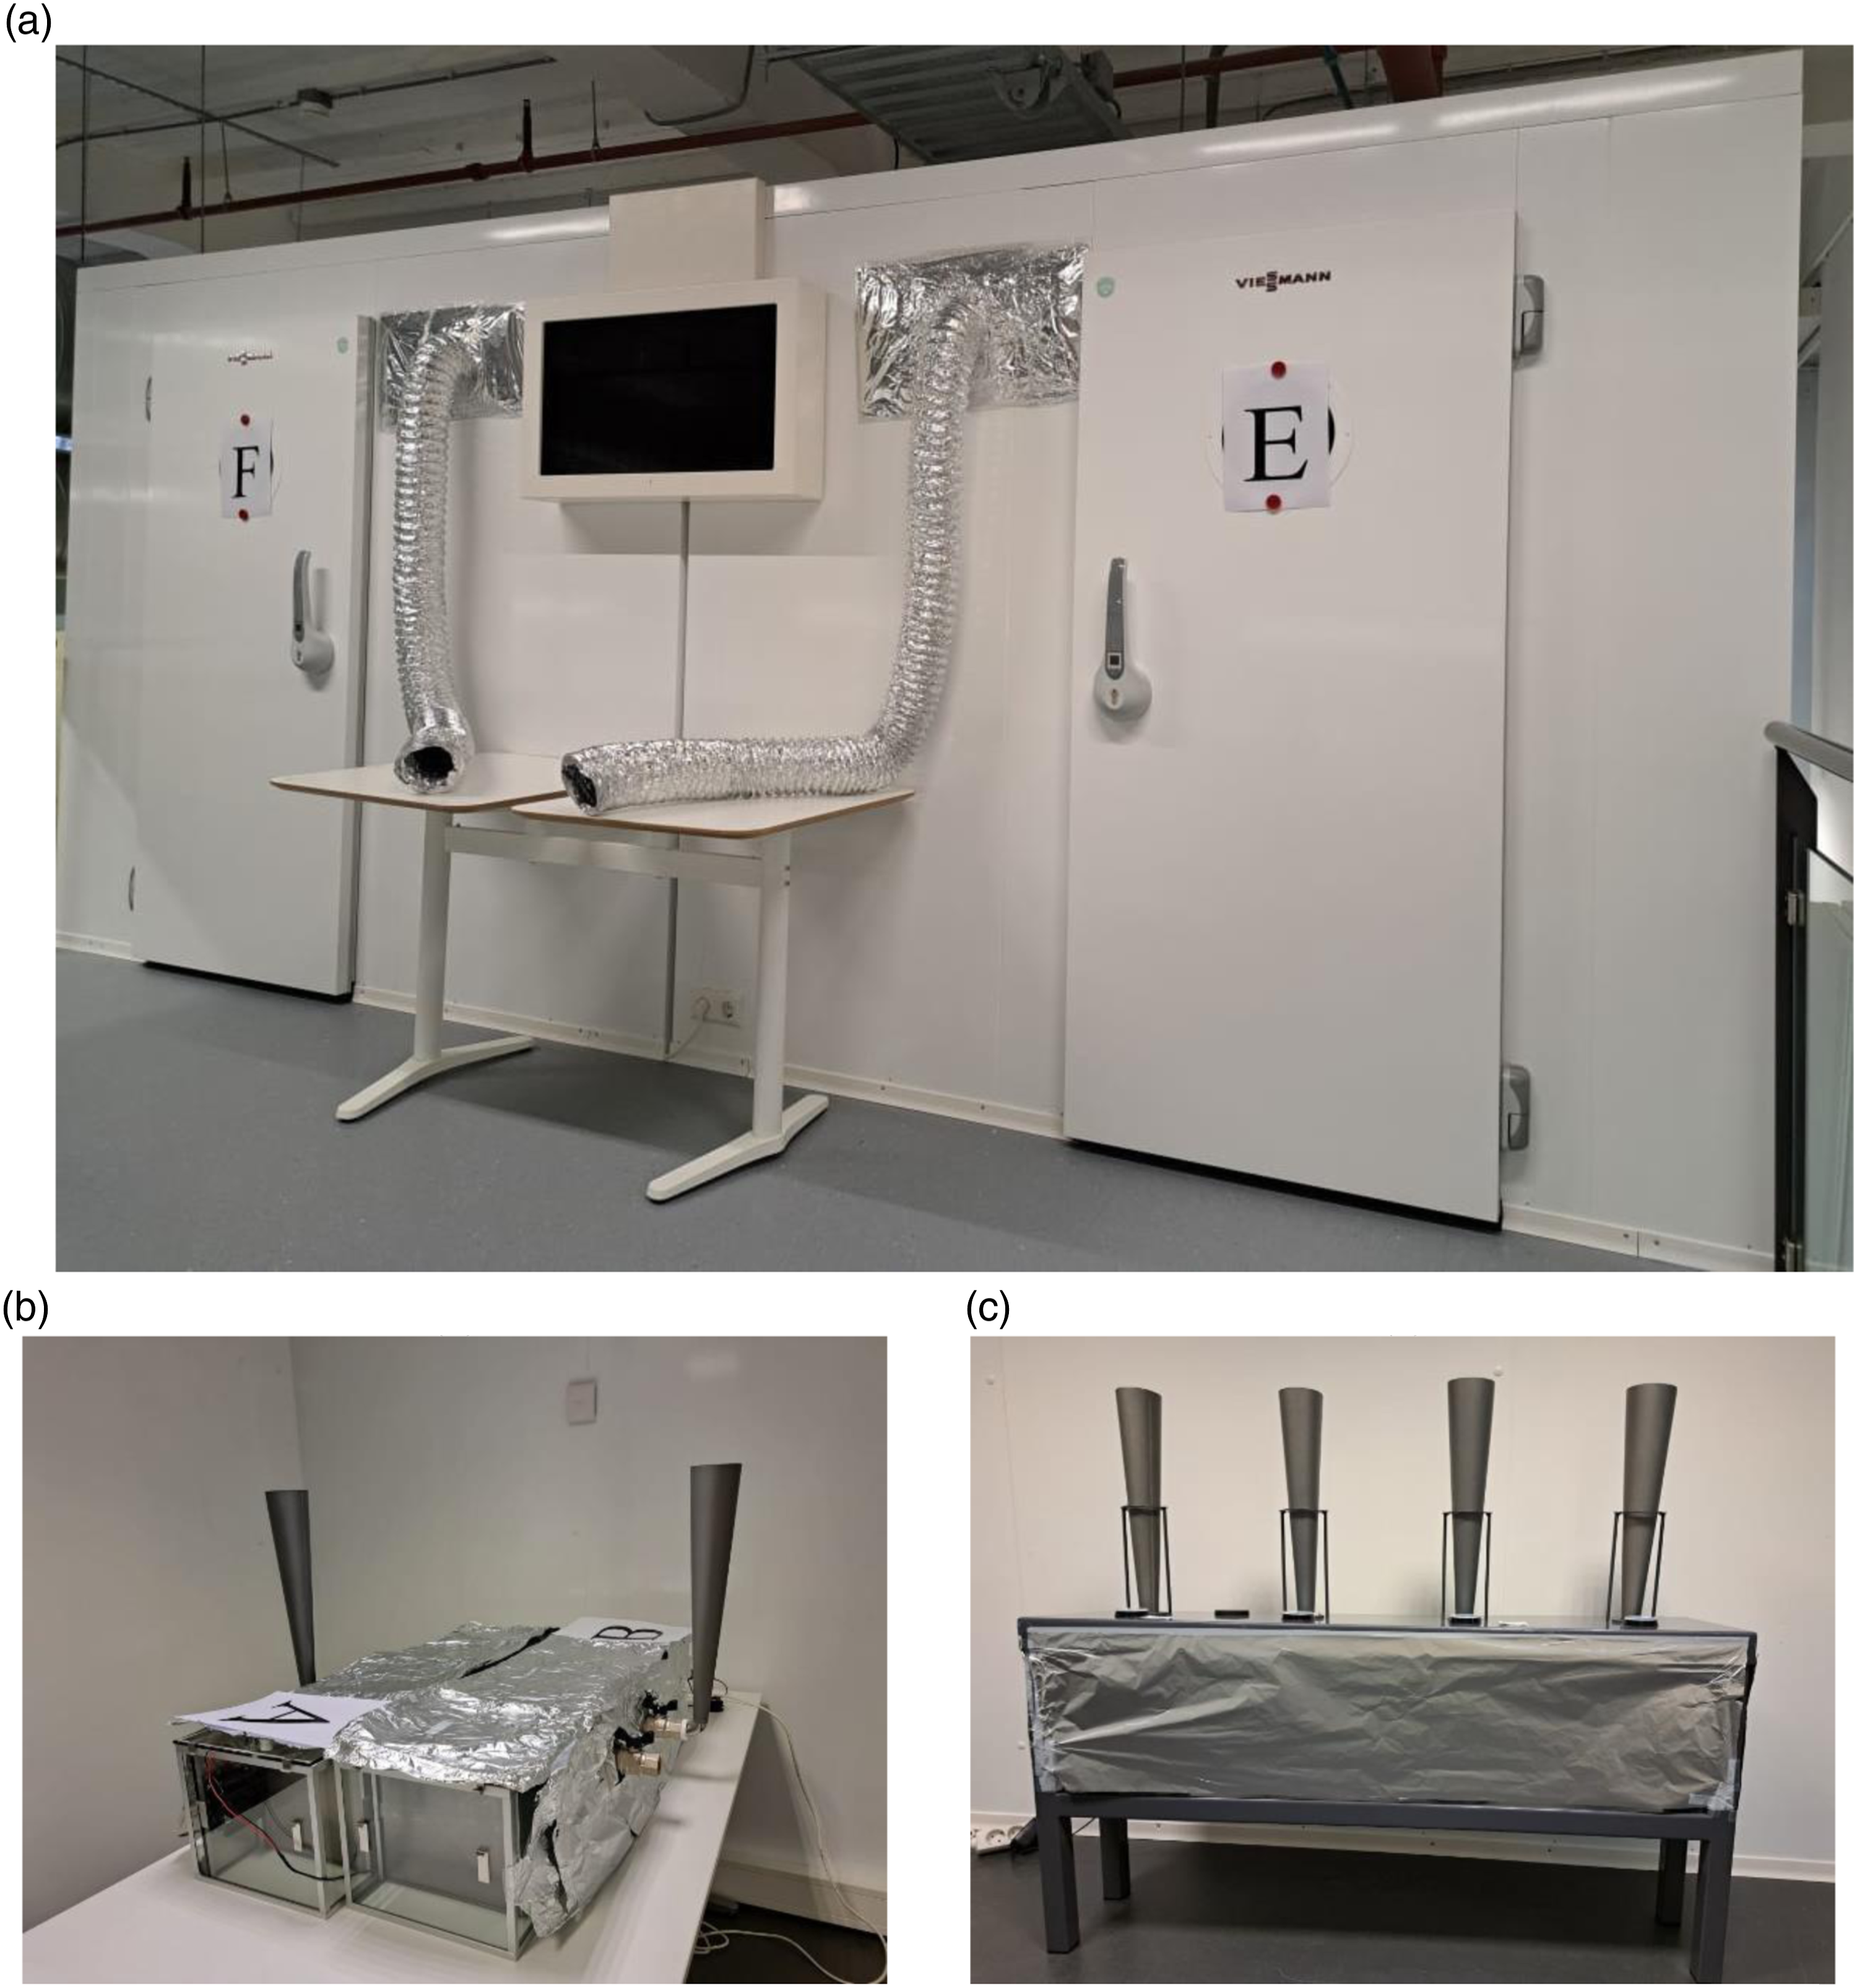
The sniffing table and two CLIMPAQs were used to simulate the odour sorption behaviour of the wool carpet in small-scale environments, while the two test chambers were used to assess the sorption effect of the wool carpet in a “real-life” environment. In this study, the temperature and relative humidity (RH %) levels in all test environments were the same on the day of the experiment since all air was supplied by the same air handling unit. 24
An airflow rate meter (balometer) (model: ACIN FlowFinder-mk2) and an omnidirectional hot wire anemometer (model: DANTEC Dynamics ComfortSense 54T33) were used to measure the air supply in the test chambers and air velocity in the funnels, respectively. The air velocity at the centre of the sniffing funnel (with a diameter of 8 cm) of both the sniffing table and the CLIMAPQ amounted 0.14 m/s resulting in 2.4 m3/h. The air supply rate of the test chambers was fixed at 62 m3/h to maintain an air velocity of 1.3 m/s in each flexible duct (with a diameter of 0.125 m), resulting in an airflow similar to a previous study. 27 The airflow pattern inside the test chamber was determined using CFD simulation. OpenFOAM’s 28 buoyantBoussinesqSimpleFoam solver was used to conduct a steady-state RANS simulation. The mesh used contains around 3,000,000 cells with more refinement around the inlet and outlet where the cell size is around 2.5 × 2.5 × 2.5 mm.
Odour sources
A pilot test was conducted to determine the lowest odour-emitting wool carpet amongst eight wool carpets by sensory evaluation (see Appendix A). All the carpets comprised of 100% wool in piles and had a backing of polyester felt, polypropylene or jute. The outcome showed that the wool carpet comprising 100% hank dyed wool in loop piles with polyester felt backing and VOC-free adhesive had the lowest odour intensity amongst the samples, according to the panel of subjects, and thus was selected for this study.
Amount and size of the wool carpet and odour source in different test environments for each test.
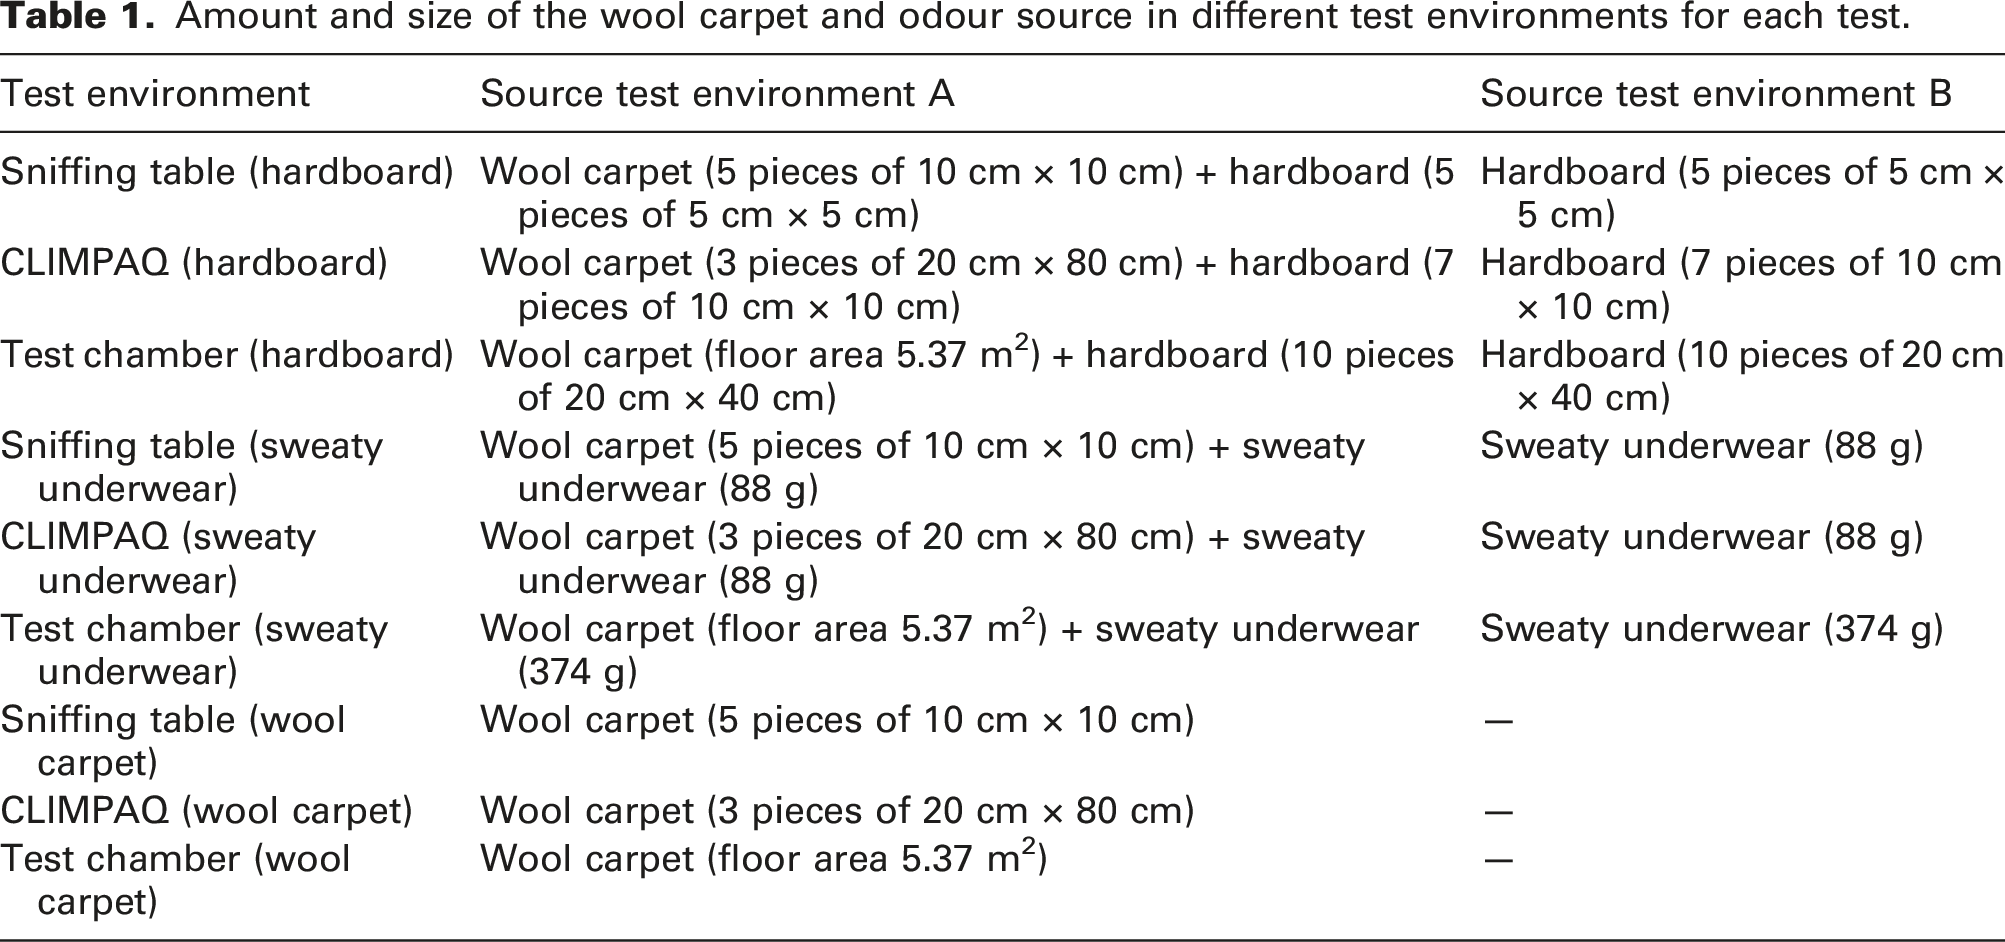
Two sources of odour emission were selected: hardboard and sweaty underwear. Hardboard was chosen because it is a composite wood material commonly used in furniture. Wood-based products are one of the primary sources of VOC and odour emissions amongst building materials. 29 The selected hardboard panel comprised fine fibres of wood pressed together under high pressure, giving the board a smooth side added with one white side painting. Sweaty underwear was chosen as a surrogate for bio-effluents emitted by people. Clothing, especially underwear, acts as a reservoir for transporting pollutants from one environment to another. 30 Three females and three males worn cotton underwear (t-shirts and socks) for 2–3 days to produce sweaty underwear. Before each experiment, each item was cut into two equal pieces to obtain similar quantity and quality of odour sources for each test environment. Table 1 presents the amount and size of the sources placed in the different test environments for each test. To determine the appropriate ratio of the pollution source to the wool carpet in each test environment, another pilot test was conducted. The aim of this pilot test was to find a balance where the offensive odour was minimized to reduce participants' discomfort. Based on the results of this pilot test, it was determined that the odour intensity level of hardboard should be between 2–3, and the odour intensity level of sweaty underwear should be between 1–2. These intensity levels were chosen to ensure that the odour was present enough for evaluation but not overpowering or uncomfortable for the participants.
For test environment A, the wool carpet covered the walls and floors of the container in the sniffing table and the CLIMPAQ. The hardboard pieces or sweaty underwear were placed on the wool carpet. In the full-scale test chamber, the wool carpet covered the floor with the hardboard pieces placed on top of it or with the sweaty underwear hanging on a rack (Figure 2). For test environment B, everything was the same but without the wool carpet. The hardboard or sweaty underwear was placed in the test environments at least 2 hours before each experiment. To avoid bias, the test environments were covered with aluminium foil so that their content was invisible to the subjects. (a) Combination of wool carpet + hardboard versus hardboard in containers of the sniffing table, CLIMPAQs and test chambers; (b) Combination of wool carpet + sweaty underwear versus sweaty underwear in containers of the sniffing table, CLIMPAQs and test chambers.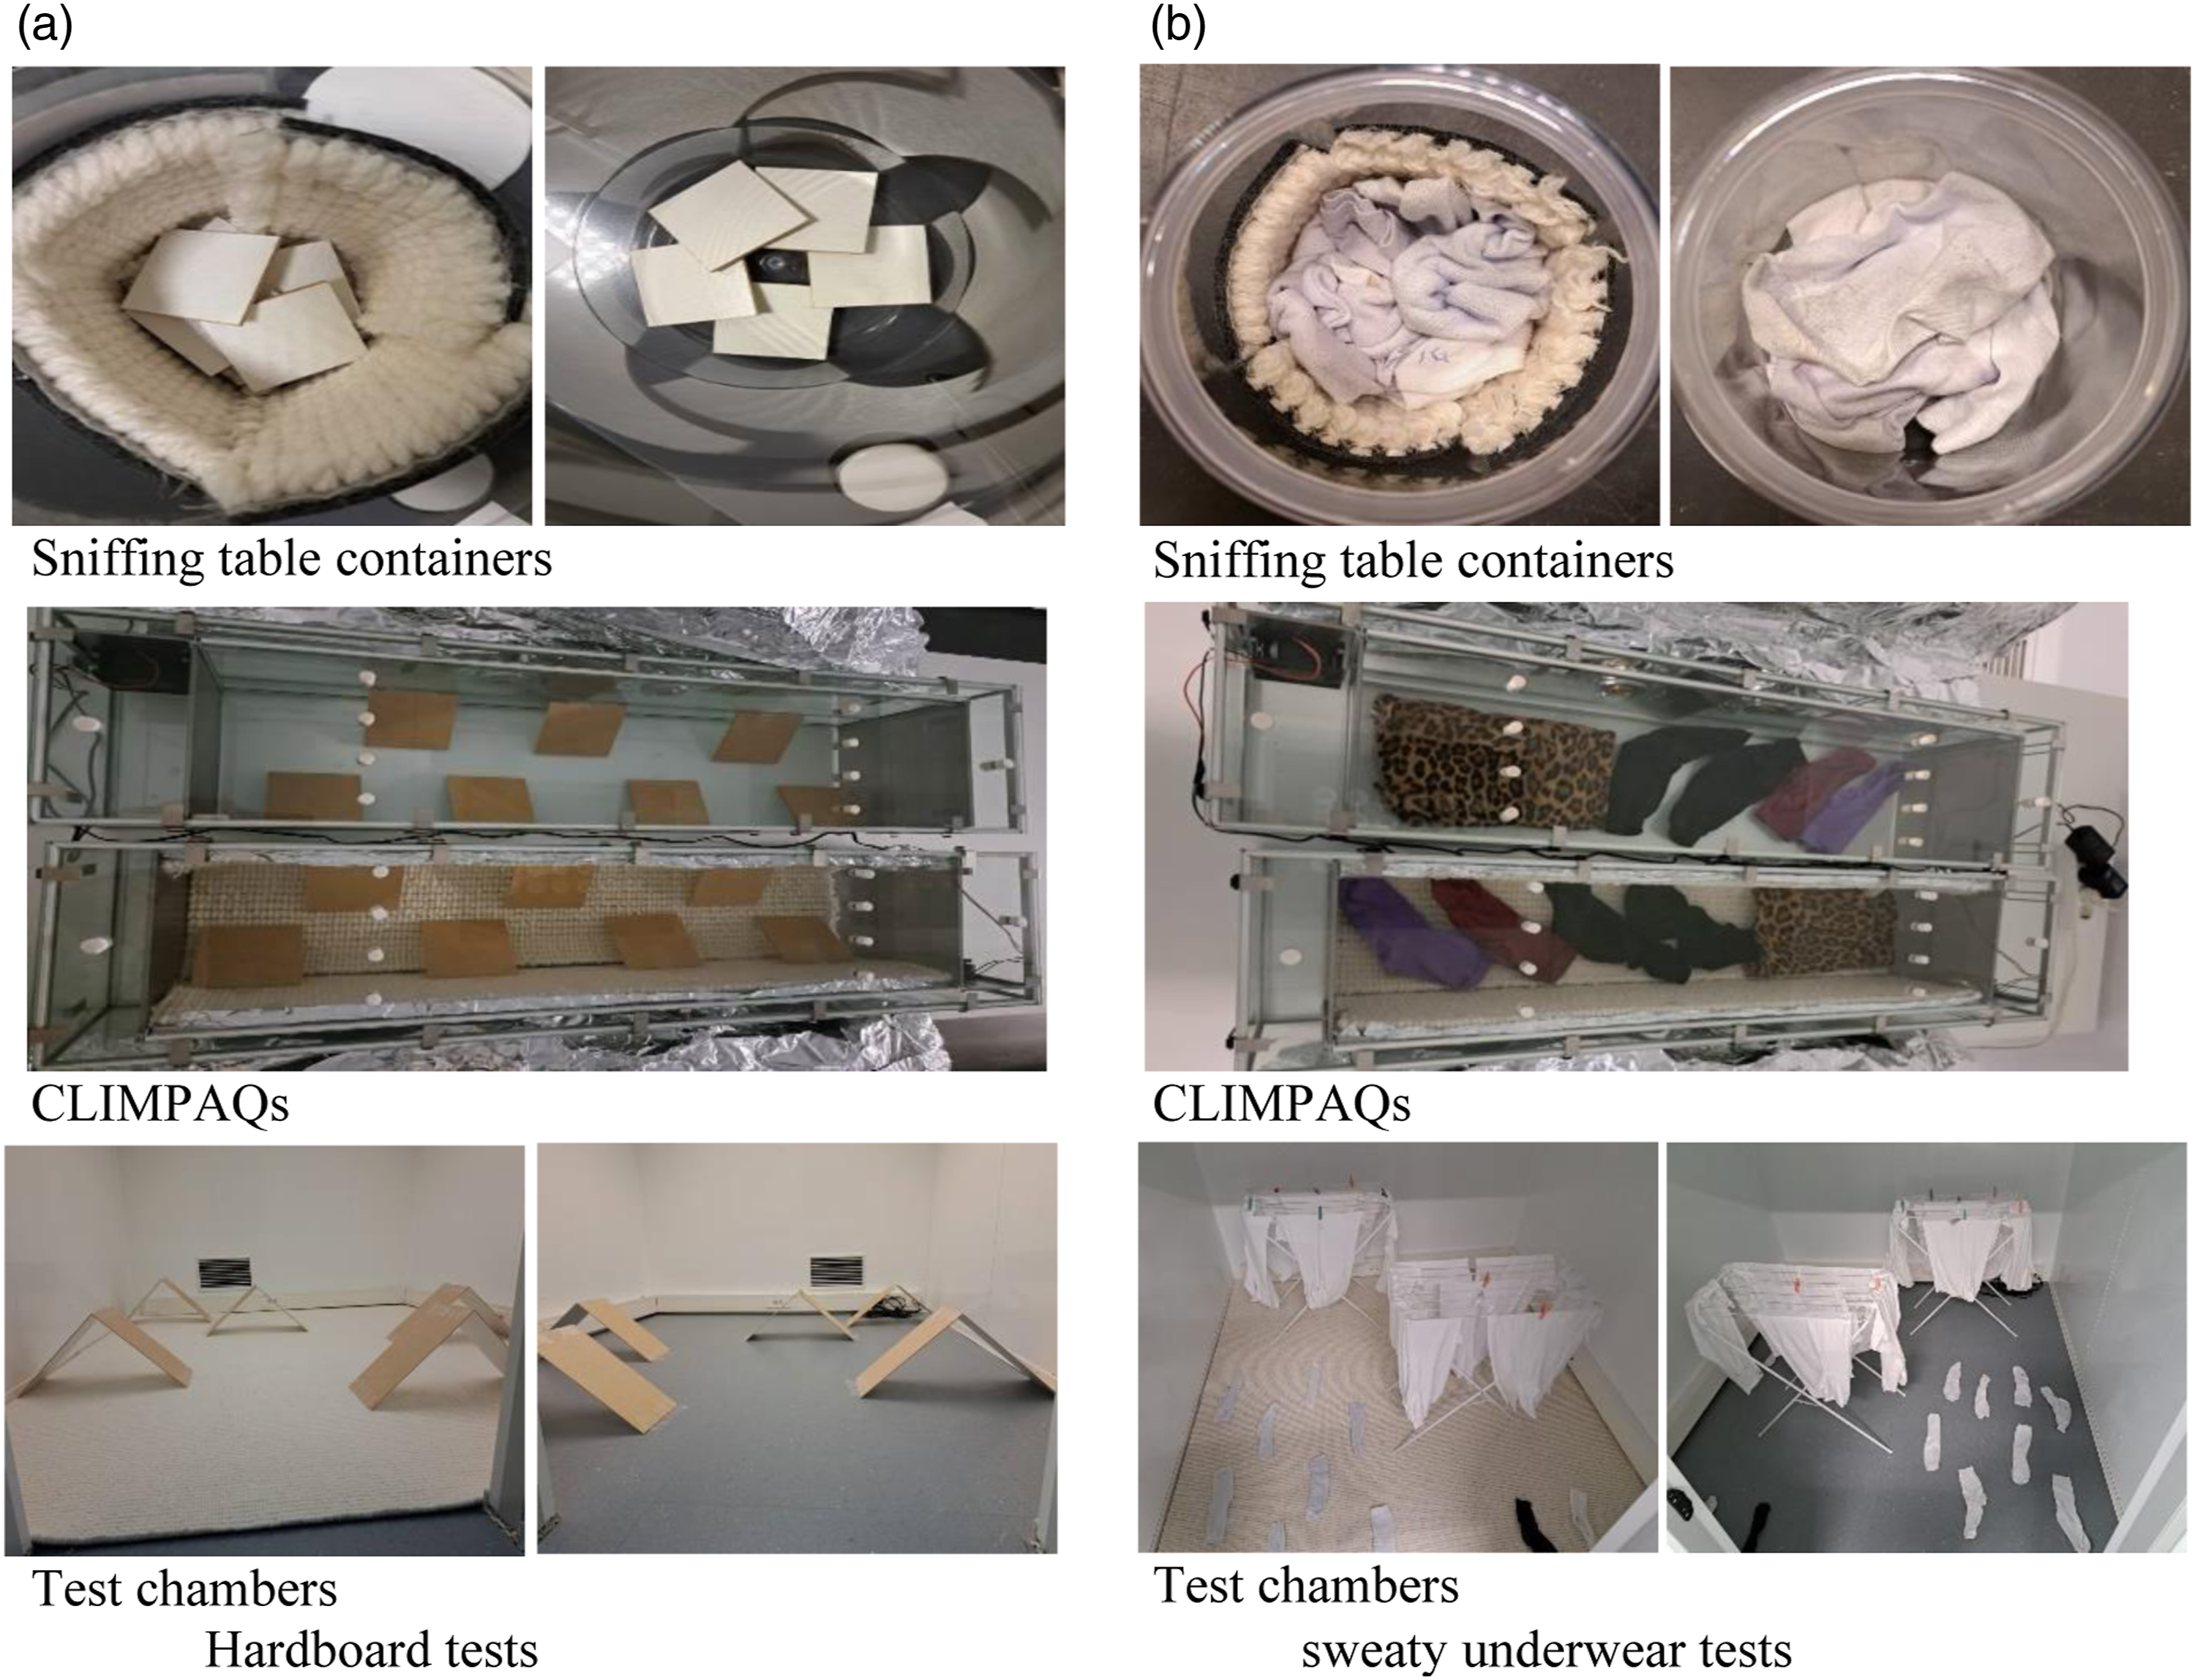
Sensory assessment
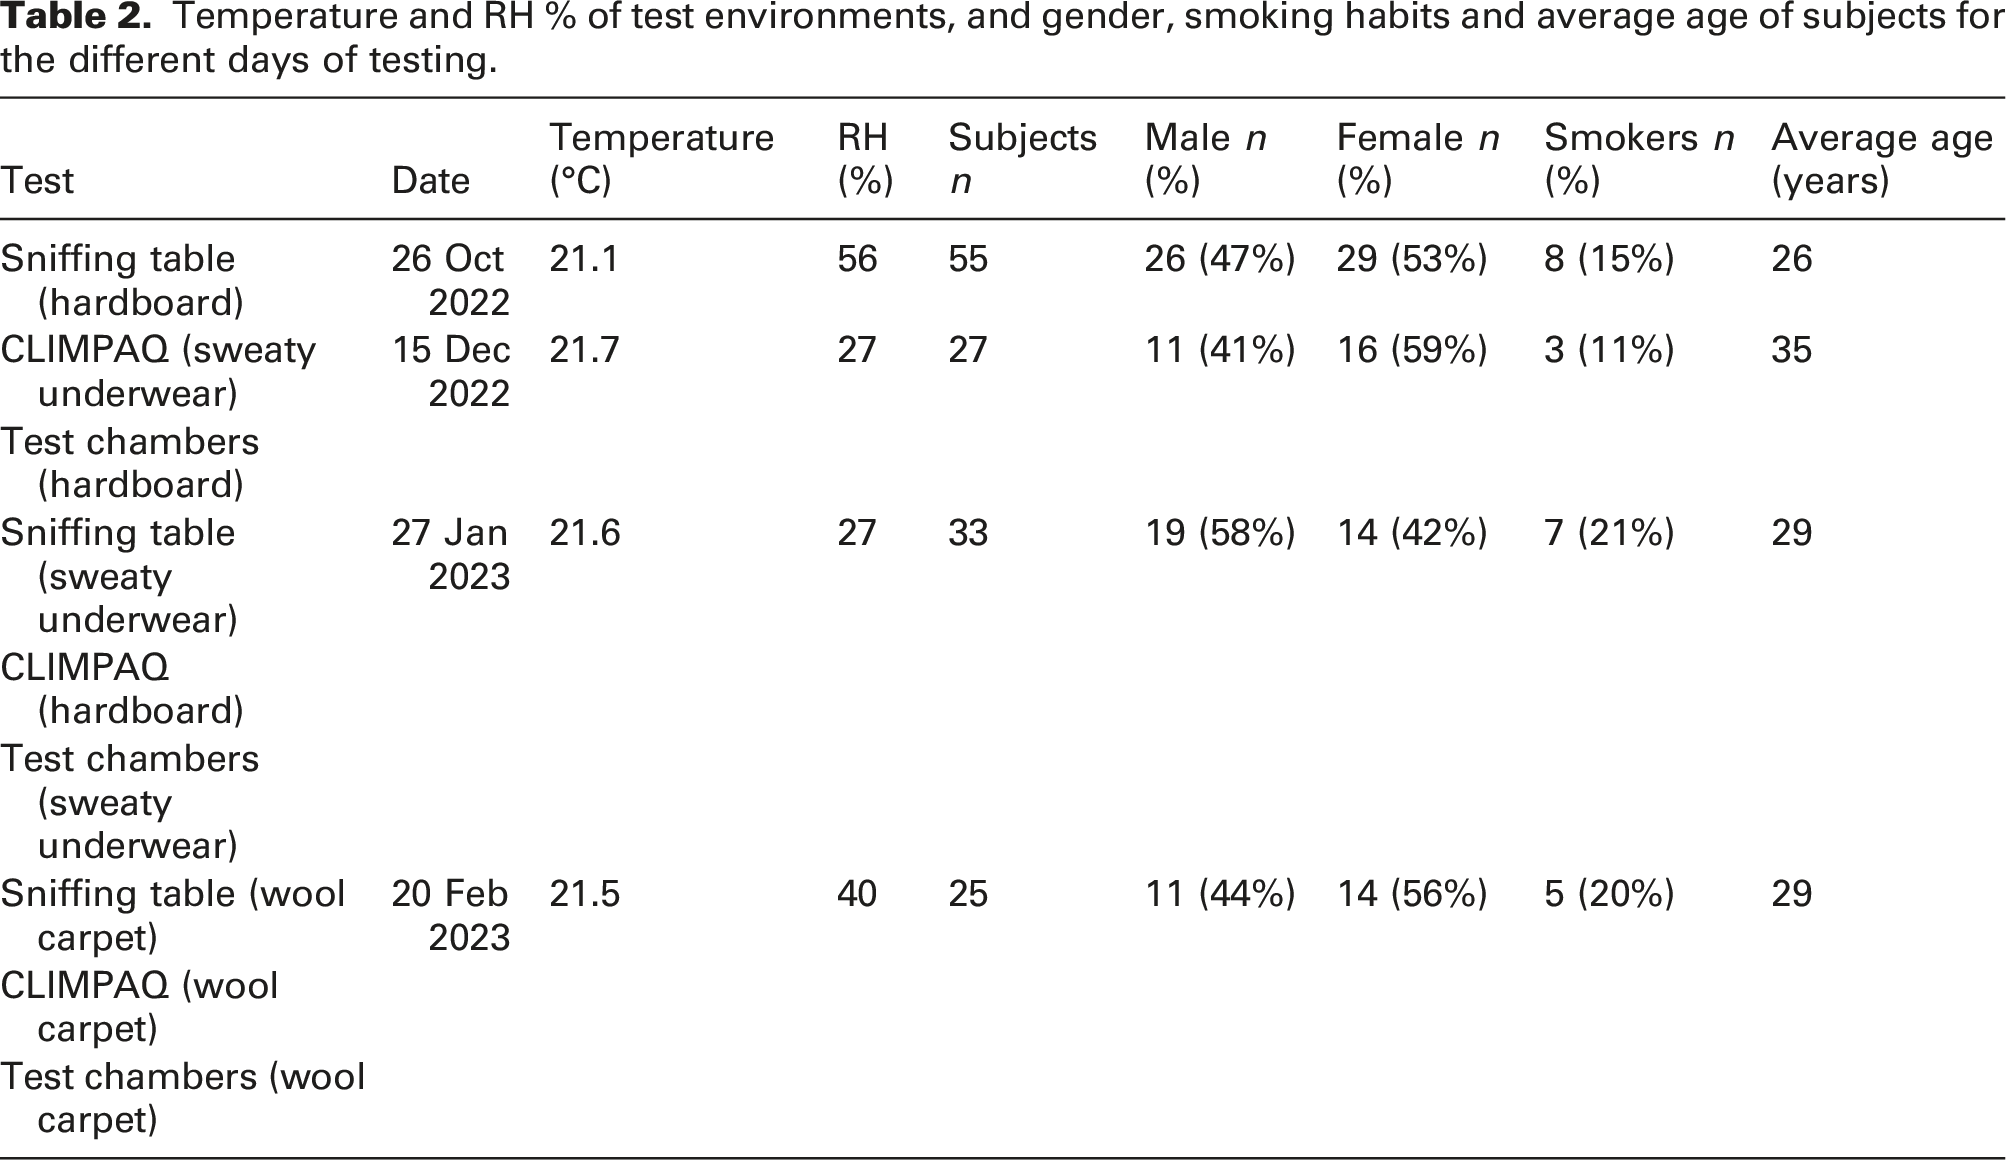
Temperature and RH % of test environments, and gender, smoking habits and average age of subjects for the different days of testing.
A questionnaire for assessing the odour intensity and acceptability of the air was developed based on the form developed by Gunnarsen and Fanger. 31 The participants were asked: “How strong is the odour that you smell? Give your opinion with a cross or a dash on the scale below (Intensity)” and “Imagine being exposed to this odour whilst sitting in your study place; how acceptable is the air? Give your opinion with a cross or a dash on the scale below (Acceptability).” The participants indicated their assessment on two continuous scales regarding odour intensity (0 no odour – five overpowering odour) and acceptability of the air (−1 clearly unacceptable, +1 clearly acceptable), respectively (see Appendix B).
Ethical aspects
The recruited panel members were sent an email with the information letter and a link to sign the consent letter 2 days before each test day. The research team reviewed the online consent forms on the day of the tests. Participants who did not sign the consent form electronically had to read it and sign it on paper before conducting the test. In addition, a subject could always decide not to continue and stop with the test. The TU Delft Ethics Committee approved the study on 6 October 2022.
Experimental procedure
The participants were randomly divided into different groups and notified through the mail of their assigned time slots for the assessments. At the beginning of the experiment, the subjects were given a short instruction on the operation of the test environments and the questionnaire. For each assessment, the subjects were asked to assess the air coming out of either a funnel of the sniffing table, one of the CLIMPAQs or one of the test chambers, with regards to the intensity and the acceptability; and repeat this for the other funnel in the sniffing table, CLIMPAQ or test chamber. If subjects wanted to repeat the sniffing, they were asked to inhale at least twice between each sniffing. The subjects were randomly assigned to the funnel of their first assessment (for example, funnel A (test environment A) or funnel B (test environment B) of the sniffing table). Each subject took 4–6 min to assess the air of funnel A and B in one test.
Before the tests, a photo-ionisation detector (PID) (ppbRAE3000 10.4 eV) was used to monitor the concentration of TVOC emitted by the materials. The VOC-monitoring instrument (utilising a 10.4 eV lamp) was calibrated before the experiments to respond to a broad range of compounds. TVOC is typically used as a parameter to evaluate VOC emissions. For all the tests, the VOC measurements showed a result of 0 ppb. Temperature and RH % levels were monitored during the experiments by using HOBO® MX loggers. Table 2 shows the data of the experiment, average temperature and RH % during the experiments.
Data management and analysis
All data extracted from the questionnaire were exported to IBM SPSS Statistics version 28.0. A second researcher systematically checked the input of the data. Then the data were summarised using descriptive statistics, including frequency and arithmetic mean with standard error. The descriptive analysis was also used to describe the general information on the subjects (including age, gender and smoking habit, as shown in Table 2). Finally, paired sample t-tests were used to determine whether there were statistically significant differences between subjects’ assessments of the two smells in the funnels per test environment. A p-value less than 0.05 was considered statistically significant. To study the correlation between intensity and acceptability assessments, linear regression was performed for all intensity and acceptability assessments per subject, per test environment and per type of odour.
Results
Tests of wool carpet
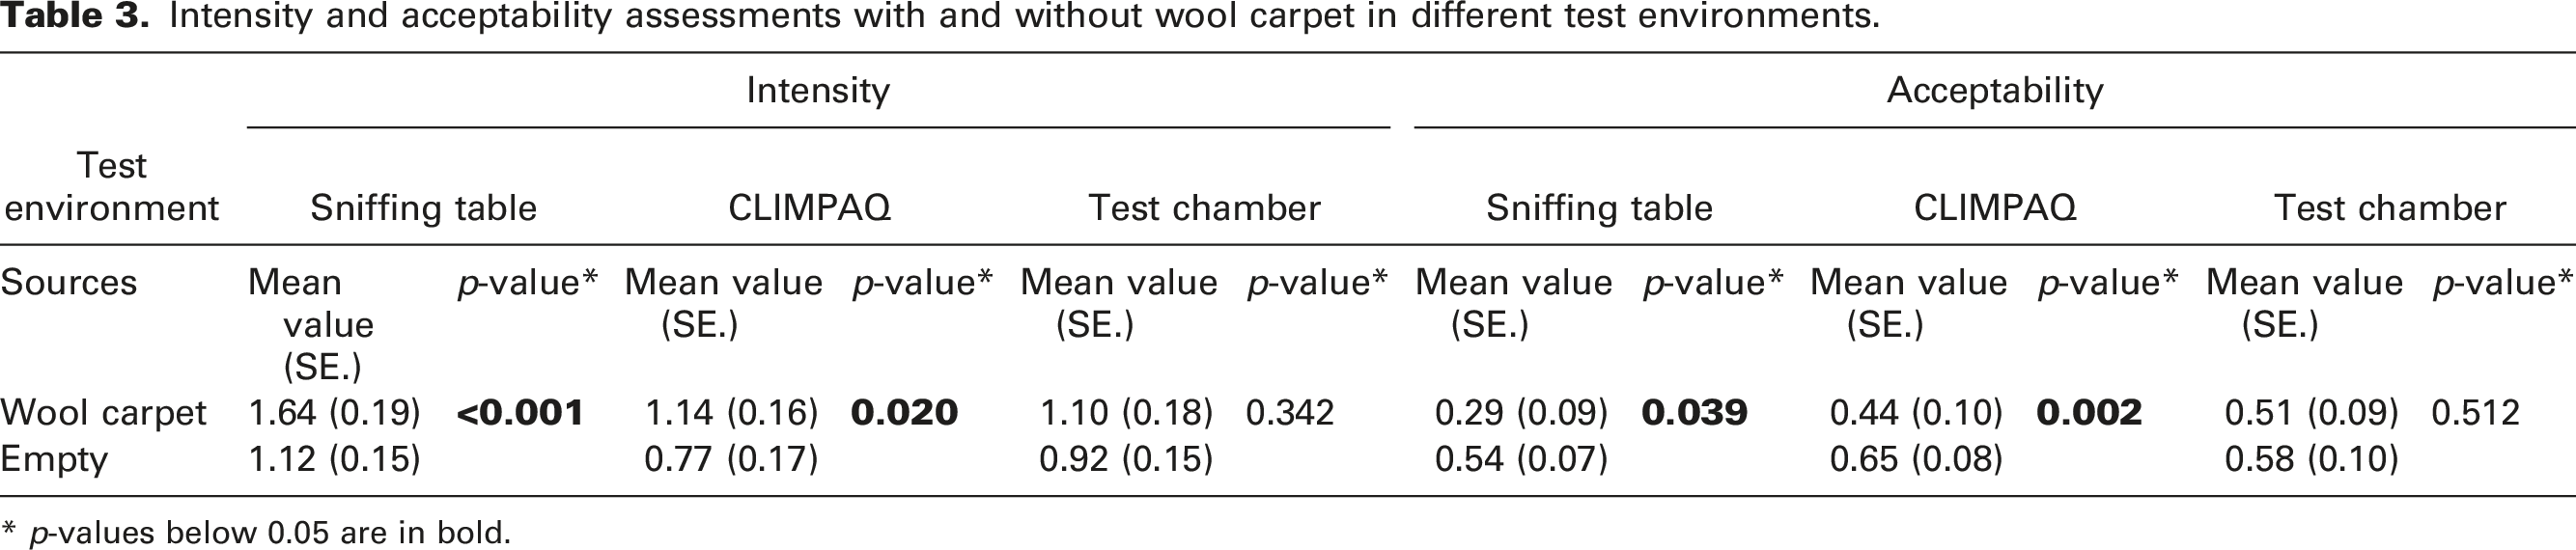
The average values and standard errors (SE) of the intensity and acceptability assessments of the air in the various test environments for the tests with wool carpet, are shown in Figure 3 and Table 3. Subjects assessed the odour intensity of the test environment with wool carpet as stronger than the odour of the empty test environment (Figure 3). Paired sample t-tests showed statistically significant differences in odour intensity between the test environments with and without the wool carpet in the sniffing table and the CLIMPAQs, while for the test chambers, no statistically significant difference was found (Figure 3). Figure 3 shows that in all test environments, the subjects assessed the acceptability of the test environment with wool carpet to be less acceptable than the perceived air quality of the empty test environment. For the sniffing table and the CLIMPAQs, paired sample t-tests showed a statistically significant difference between the acceptability with and without the wool carpet. For the test chambers, no statistically significant difference between the acceptability assessments was found (Figure 3). Intensity and acceptability assessments (mean values and SE) with and without wool carpet in: the sniffing table; CLIMPAQs; and the test chambers. Intensity and acceptability assessments with and without wool carpet in different test environments. * p-values below 0.05 are in bold.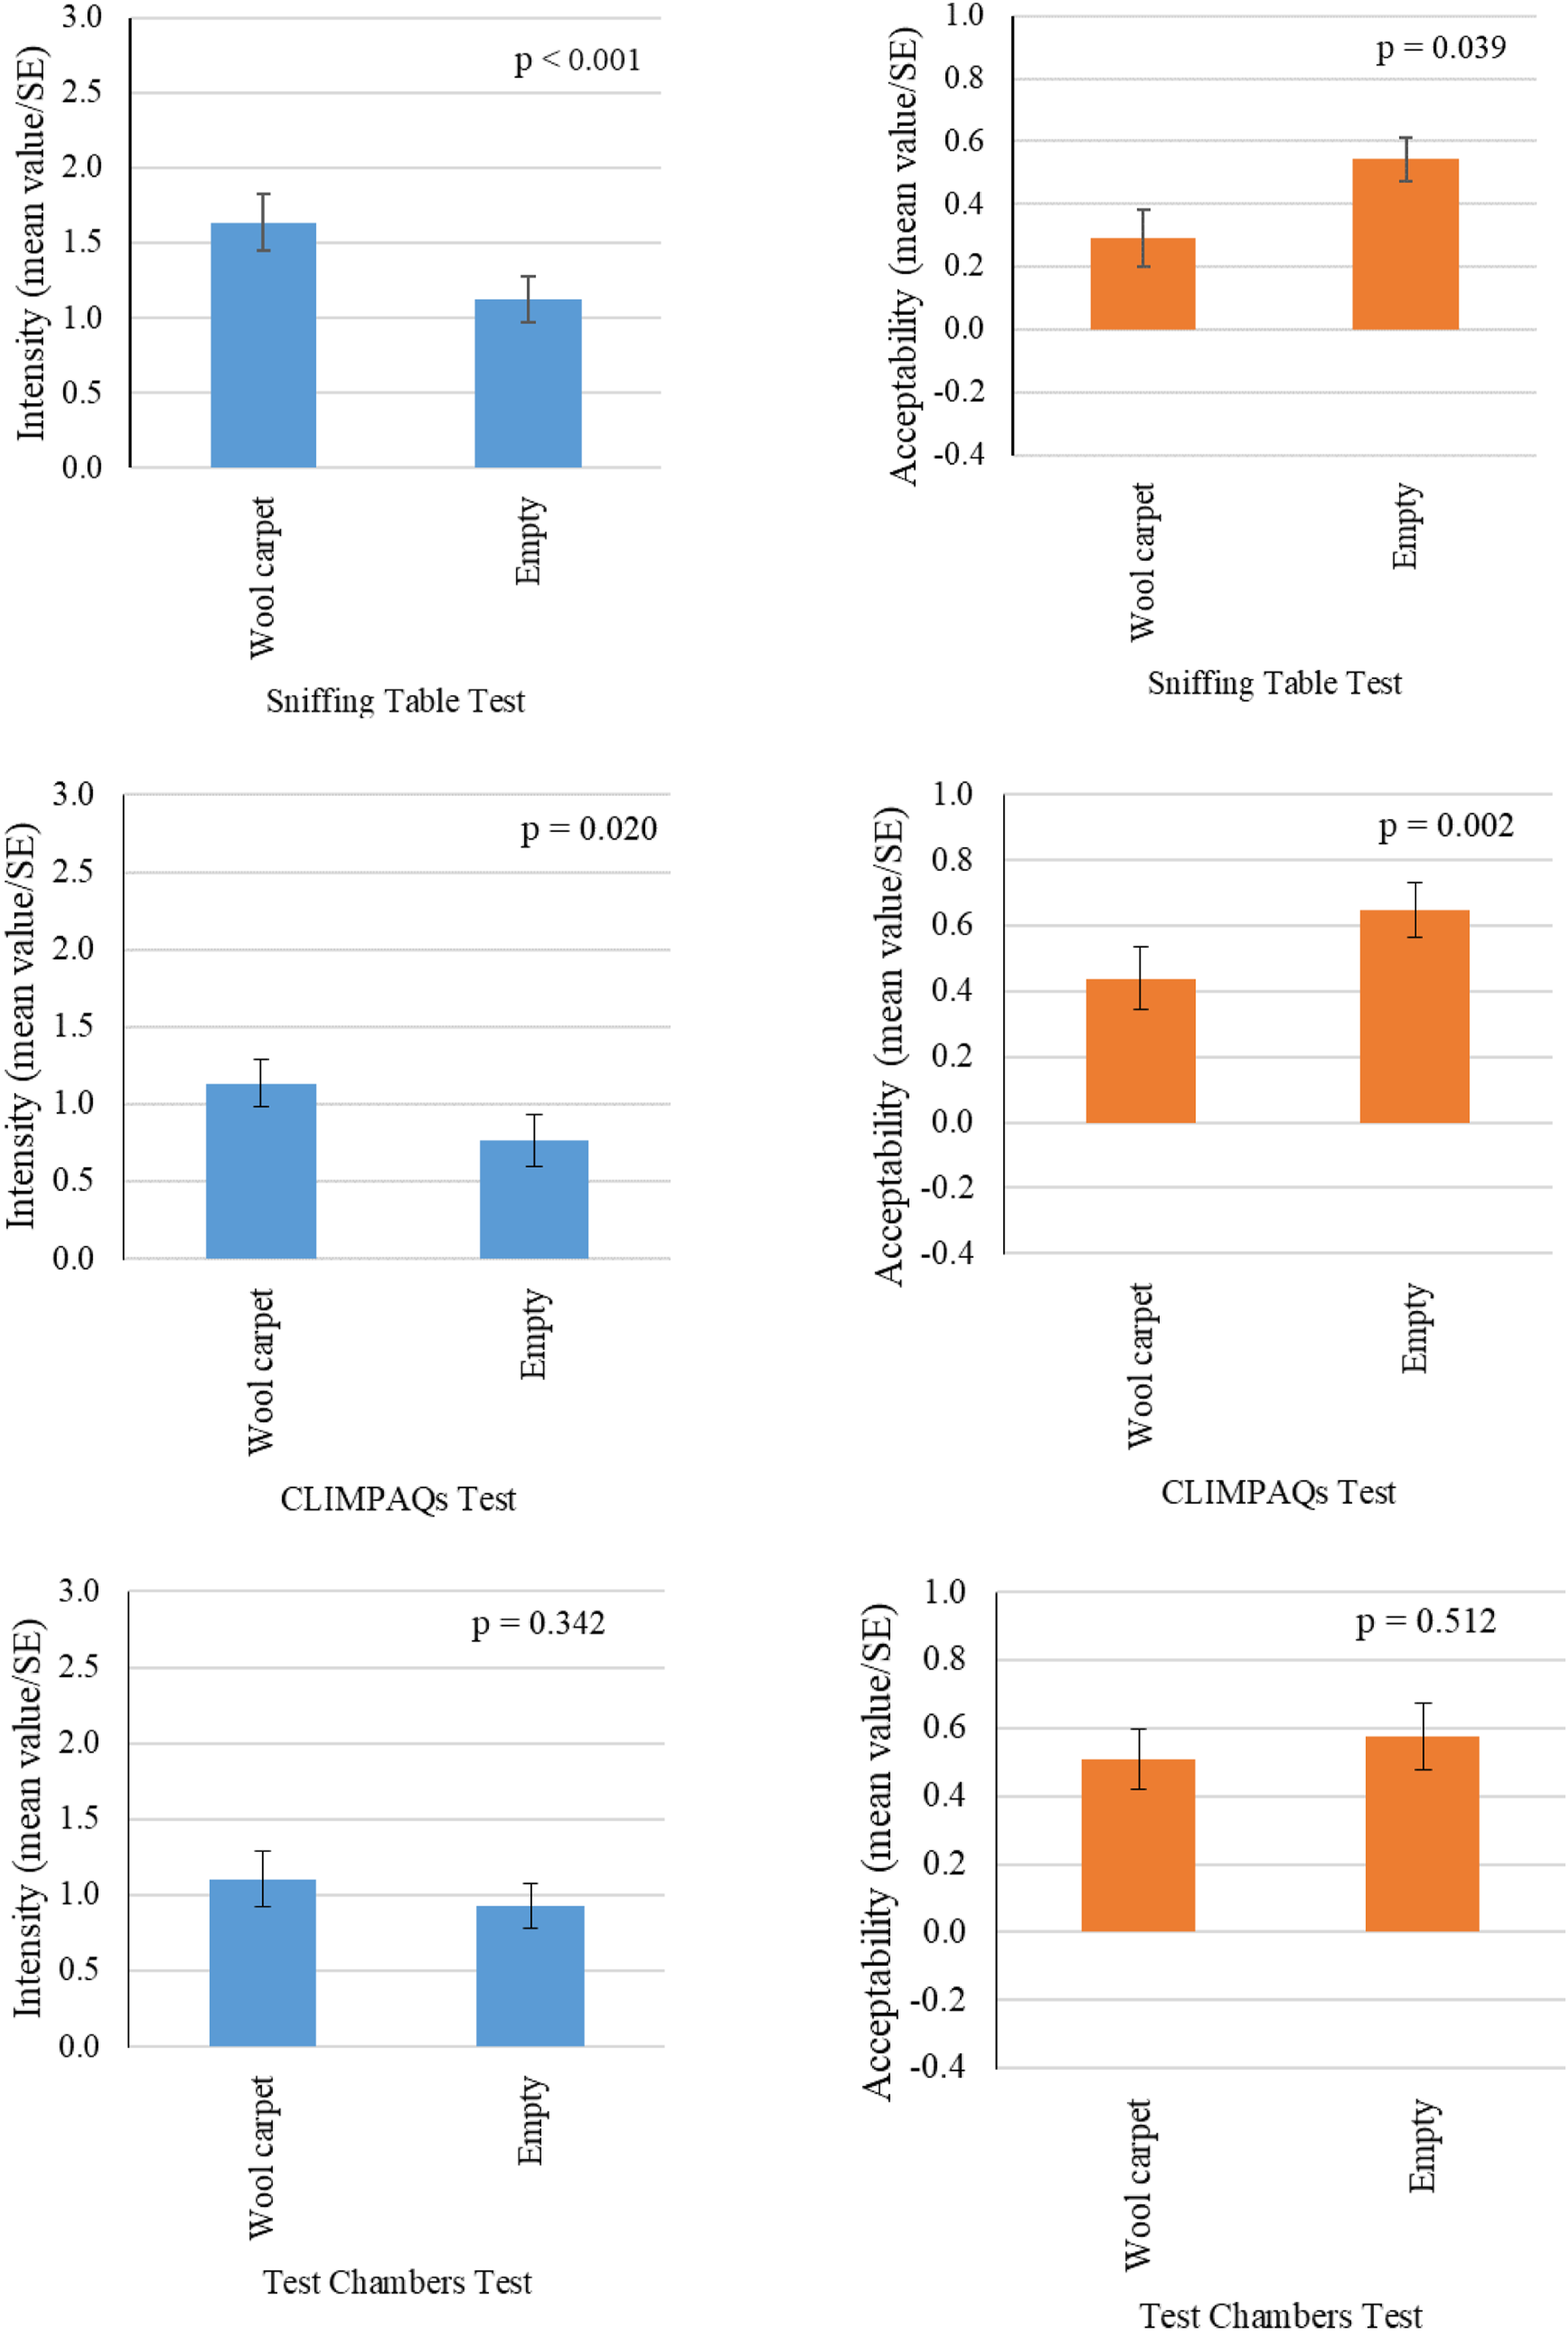
Tests of wool carpet with hardboard
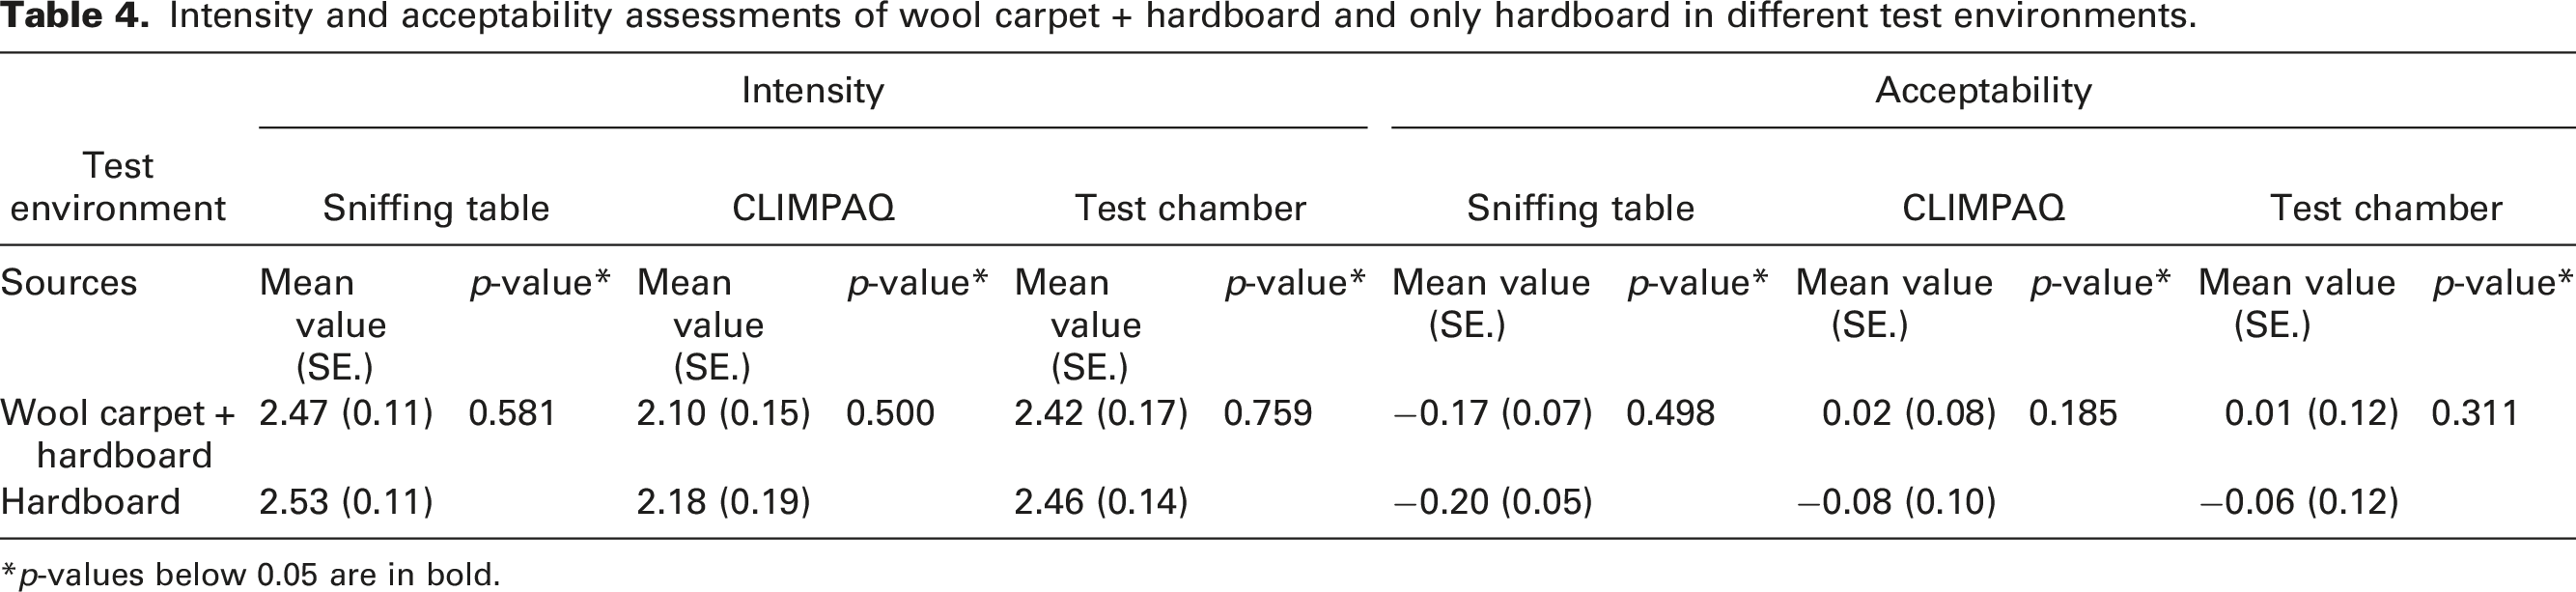
Figure 4 and Table 4 show the mean values and SEs of the odour intensity and acceptability assessments of the air in the different test environments for the tests of wool carpet and hardboard. Results show that the subjects generally perceived the odour intensity of the hardboard as stronger than the odour intensity of wool carpet + hardboard. Paired sample t-tests of the odour intensity assessments of wool carpet + hardboard and only hardboard showed for all test environments no statistically significant difference were observed (Figure 4). For all test environments, the subjects evaluated the acceptability of the hardboard as less acceptable than the acceptability of wool carpet + hardboard (Figure 4), yet no statistically significant difference was found according to the paired sample t-tests (Figure 4). Intensity and acceptability assessments (mean values and SE) of wool carpet + hardboard and only hardboard in: the sniffing table; CLIMPAQ; and the test chamber. Intensity and acceptability assessments of wool carpet + hardboard and only hardboard in different test environments. *p-values below 0.05 are in bold.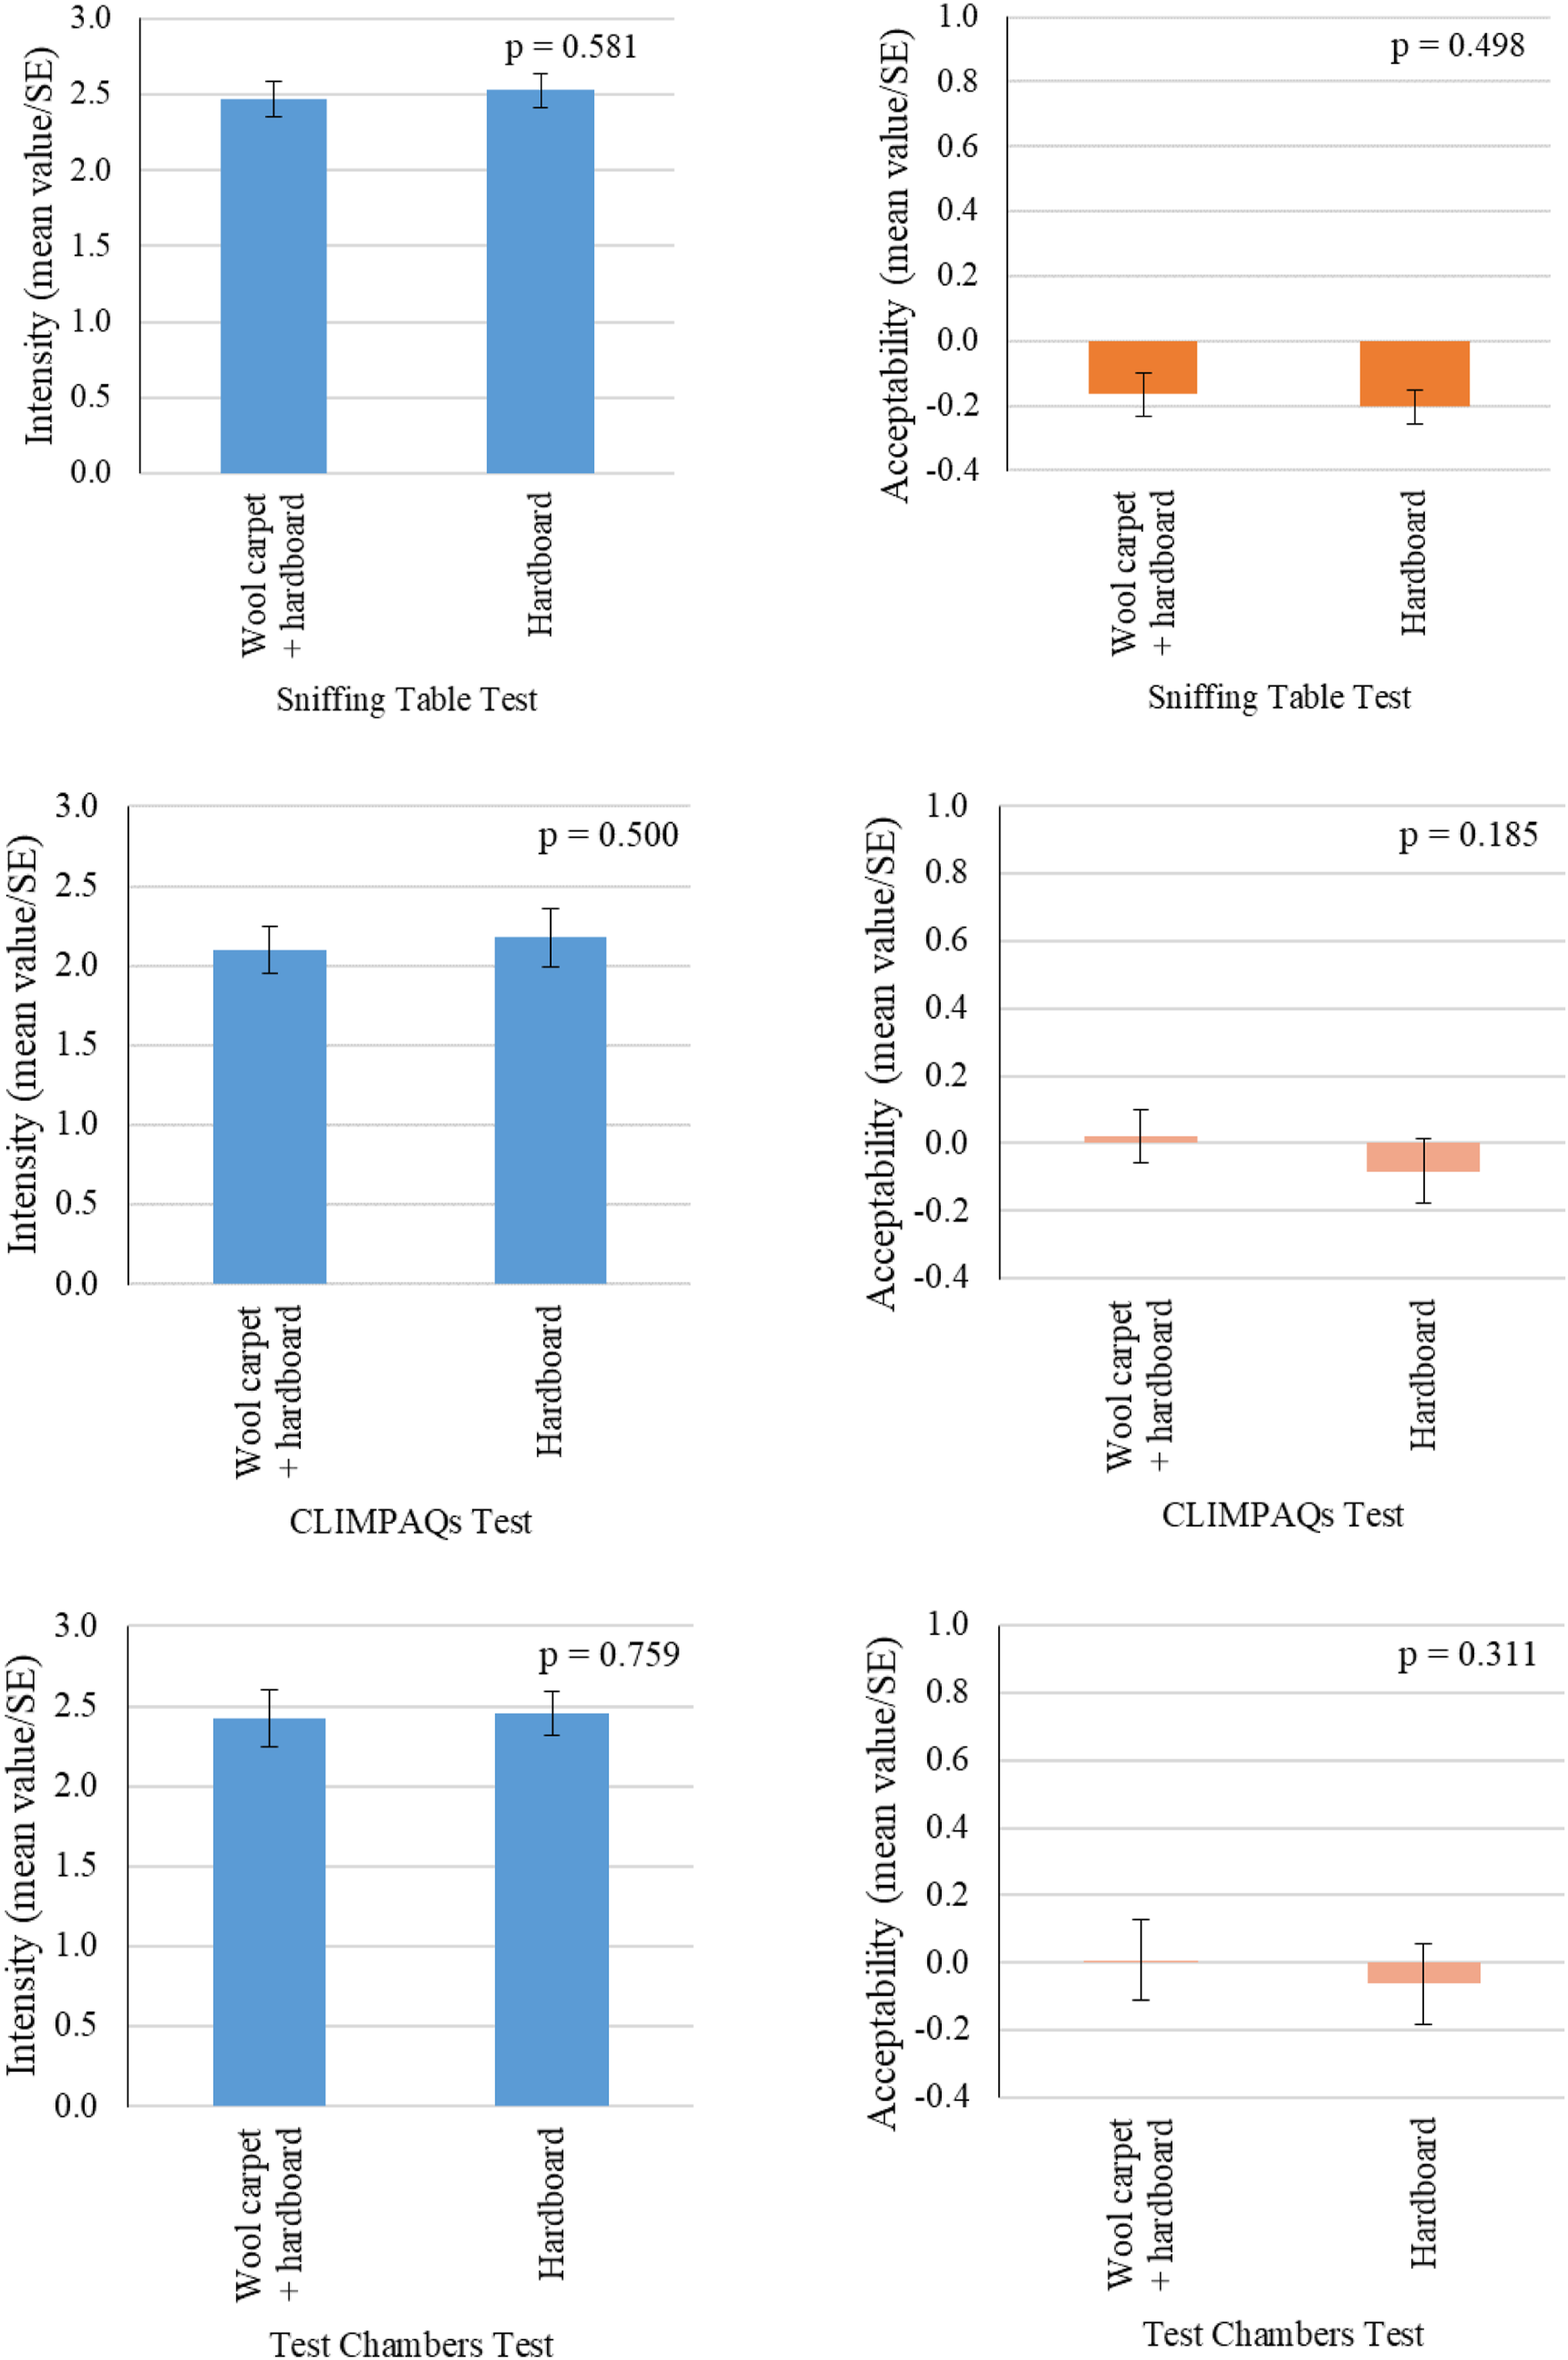
Tests of wool carpet with sweaty underwear
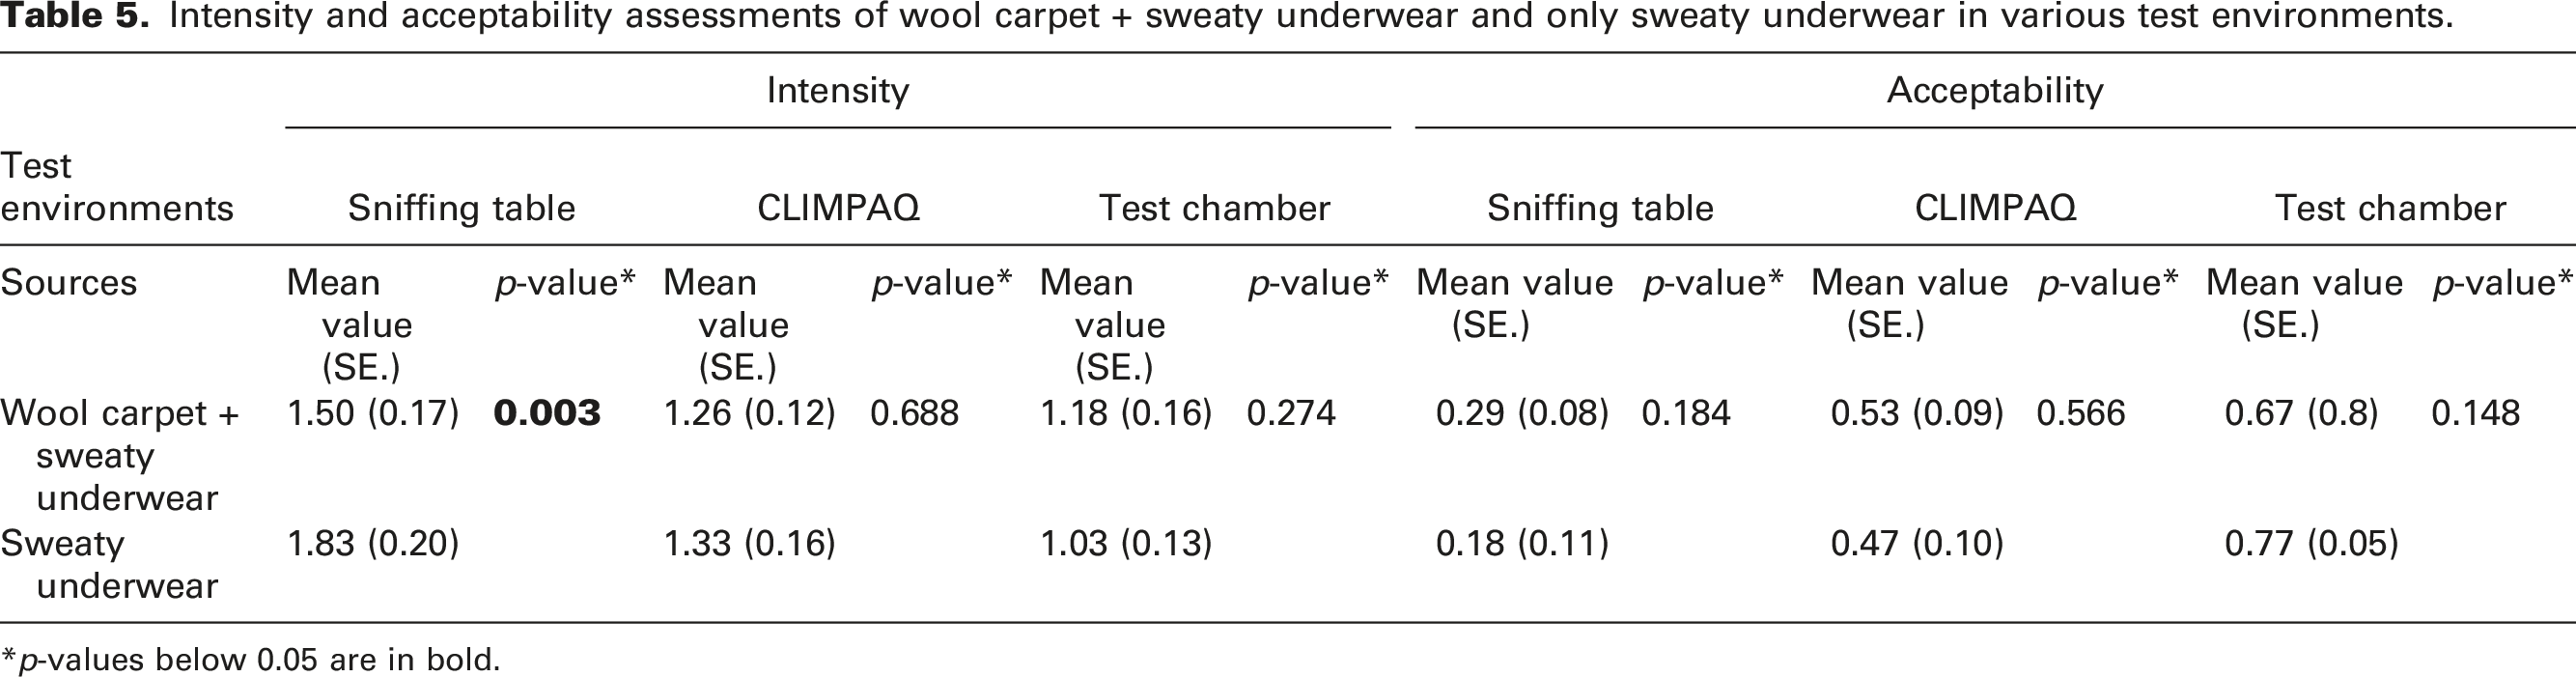
Figure 5 and Table 5 show the mean values and SE for the intensity and the acceptability assessments of the air in the test environments containing wool carpet + sweaty underwear and only sweaty underwear. From Figure 5 can be seen that subjects assessed the odour intensity of the sweaty underwear as stronger than the odour intensity of the wool carpet + sweaty underwear in both the sniffing table and the CLIMPAQs. In contrast, the odour intensity of the wool carpet + sweaty underwear was assessed as stronger than the odour intensity of the sweaty underwear in the test chamber. The result of paired sample t-tests between the intensity assessments of the wool carpet + sweaty underwear and sweaty underwear showed a statistically significant difference (p = 0.003) for the sniffing table test, indicating the odour intensity is stronger for only sweaty underwear. For CLIMPAQ and test chamber tests, no statistically significant difference between the intensities was found (Figure 5). Results showed that the subjects evaluated the acceptability of the sweaty underwear as less acceptable than the acceptability of wool carpet + sweaty underwear for the sniffing table and the CLIMPAQ tests (Figure 5). For the test chamber test, the subjects evaluated the acceptability of the wool carpet with sweaty underwear to be less acceptable than the acceptability of only the sweaty underwear. For all test environments, paired t-tests between the acceptability assessments of wool carpet + sweaty underwear and sweaty underwear showed no statistically significant differences (Figure 5). Intensity and acceptability assessments (mean values and SE) of wool carpet + sweaty underwear and only sweaty underwear in: the sniffing table; CLIMPAQ and test chamber. Intensity and acceptability assessments of wool carpet + sweaty underwear and only sweaty underwear in various test environments. *p-values below 0.05 are in bold.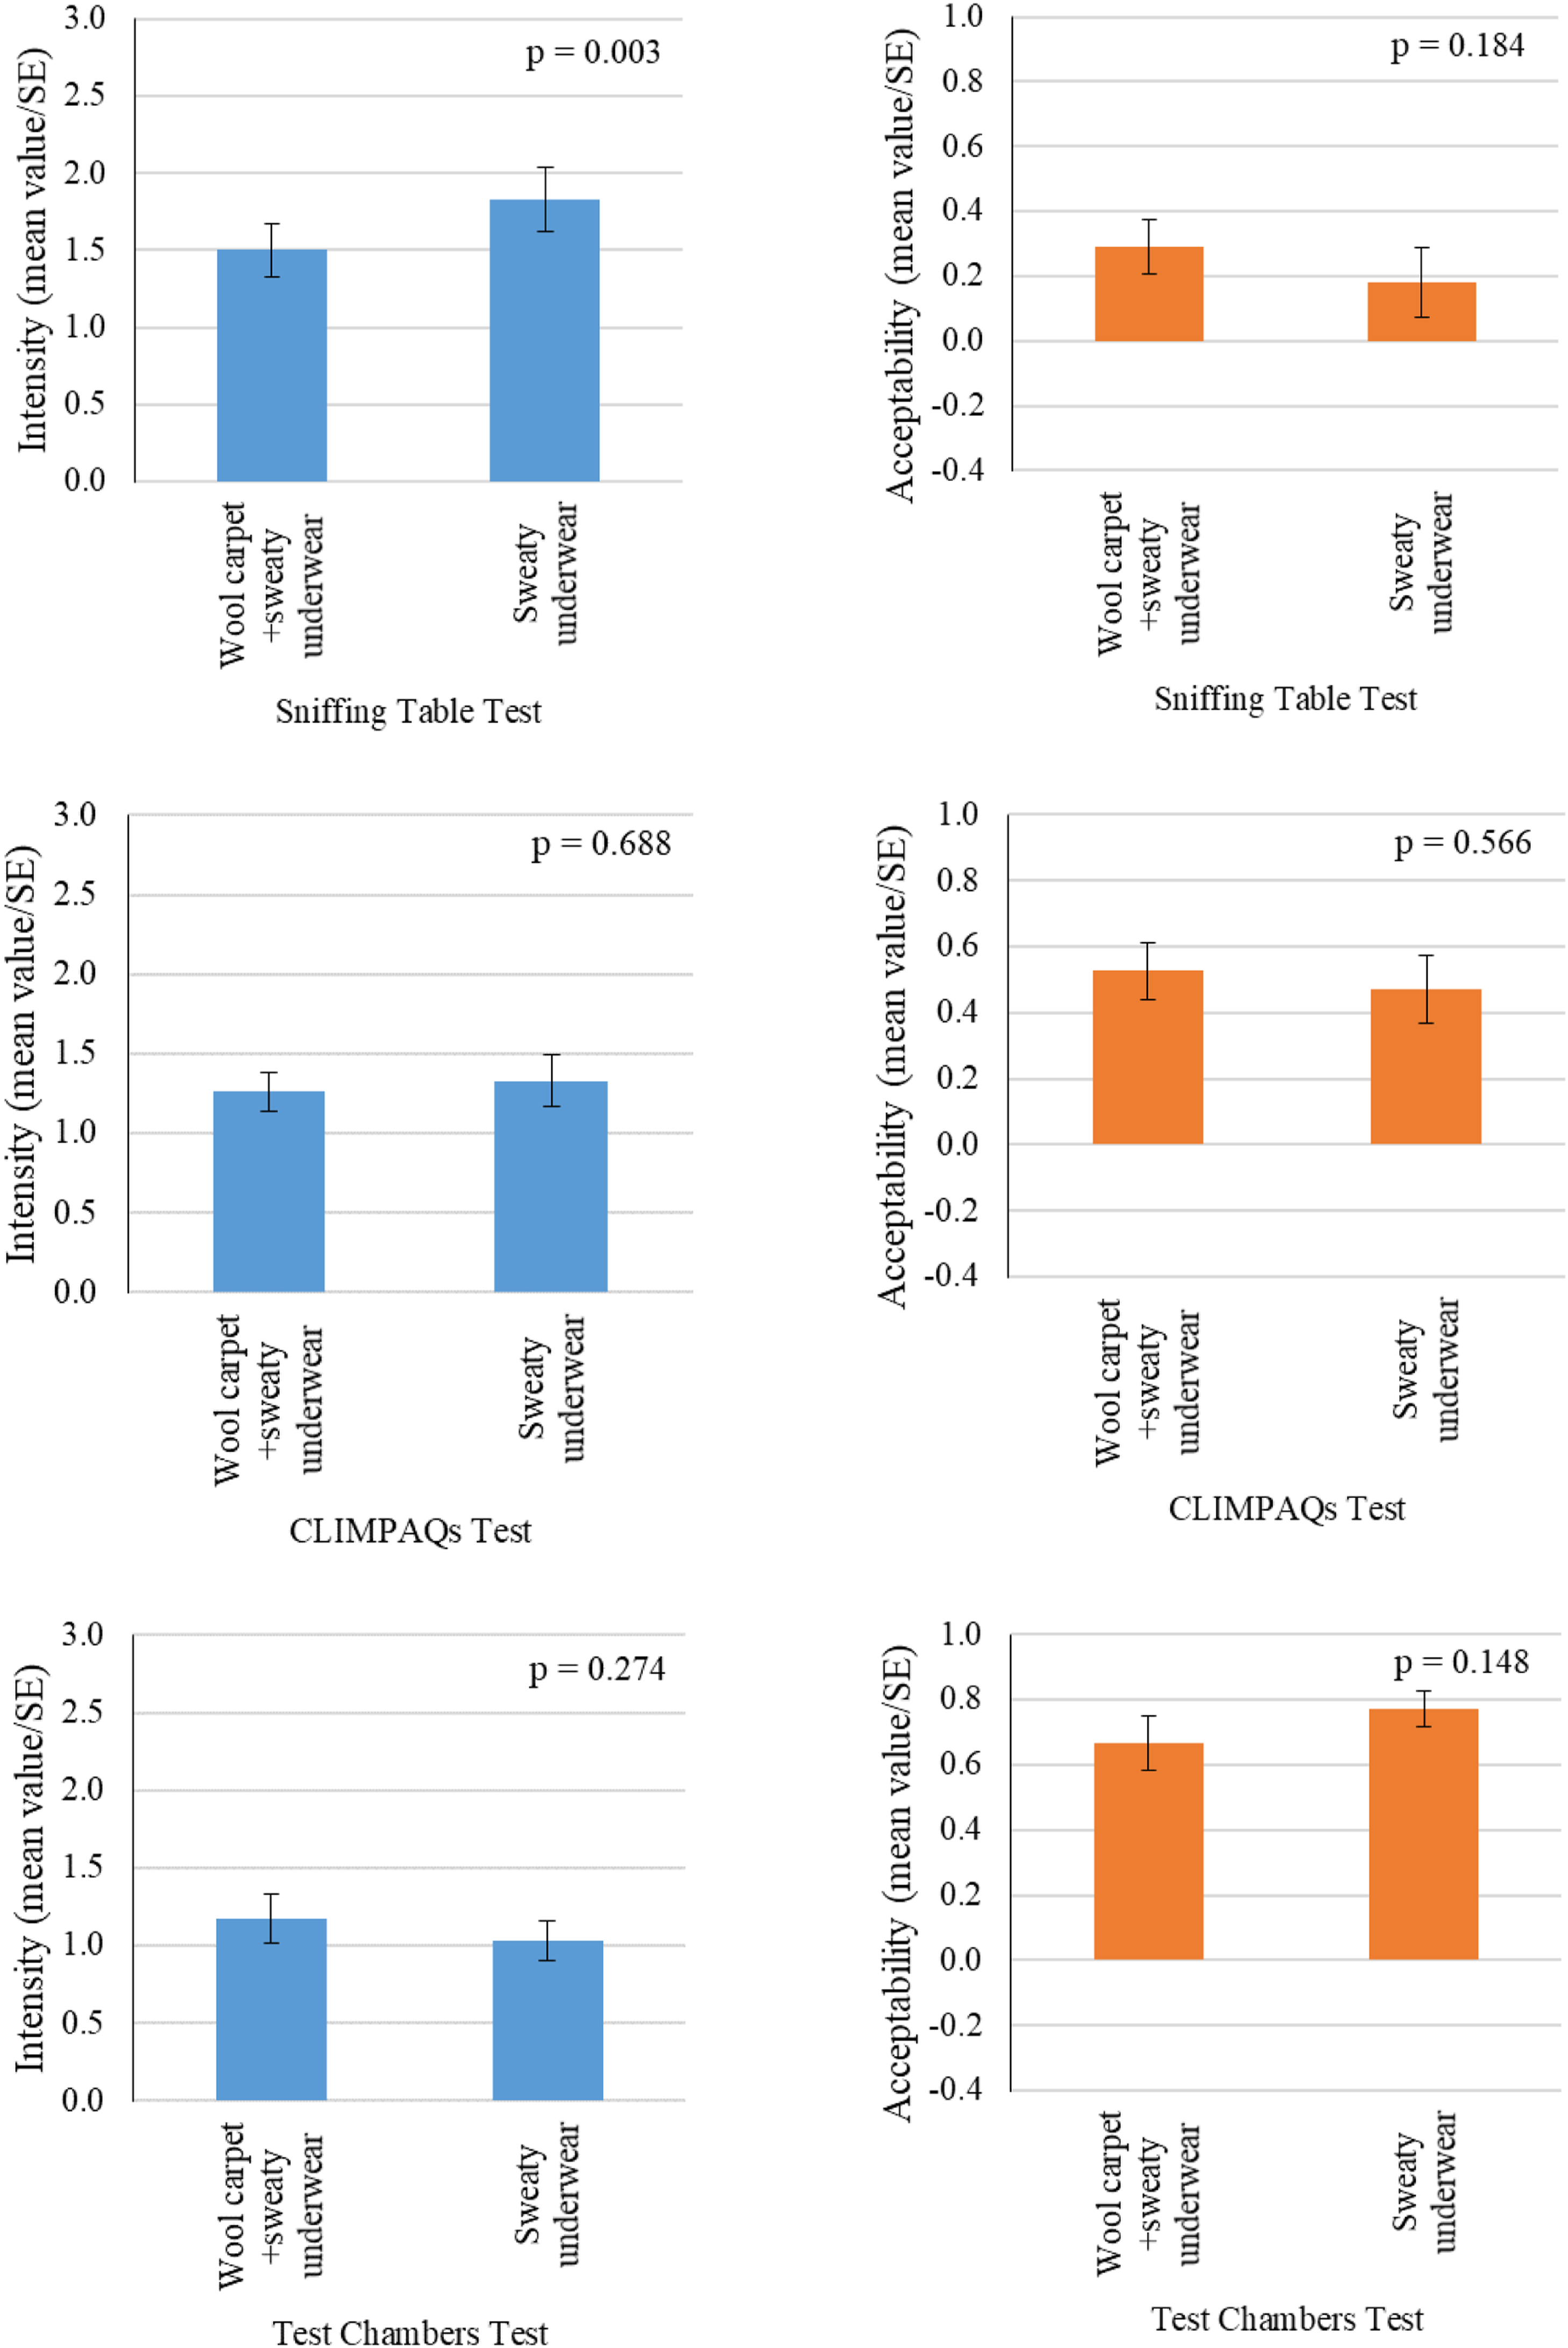
Intensity versus acceptability
To study the correlation between the odour intensity and acceptability assessments, linear regression was performed for all intensity and acceptability assessments per type of odour. The results are presented in Figure 6. Correlation between intensity and acceptability assessments of tests (a) with wool carpet; (b) without wool carpet; (c) wool carpet + hardboard; (d) hardboard; (e) wool carpet + sweaty underwear; and (f) sweaty underwear, for all test environments.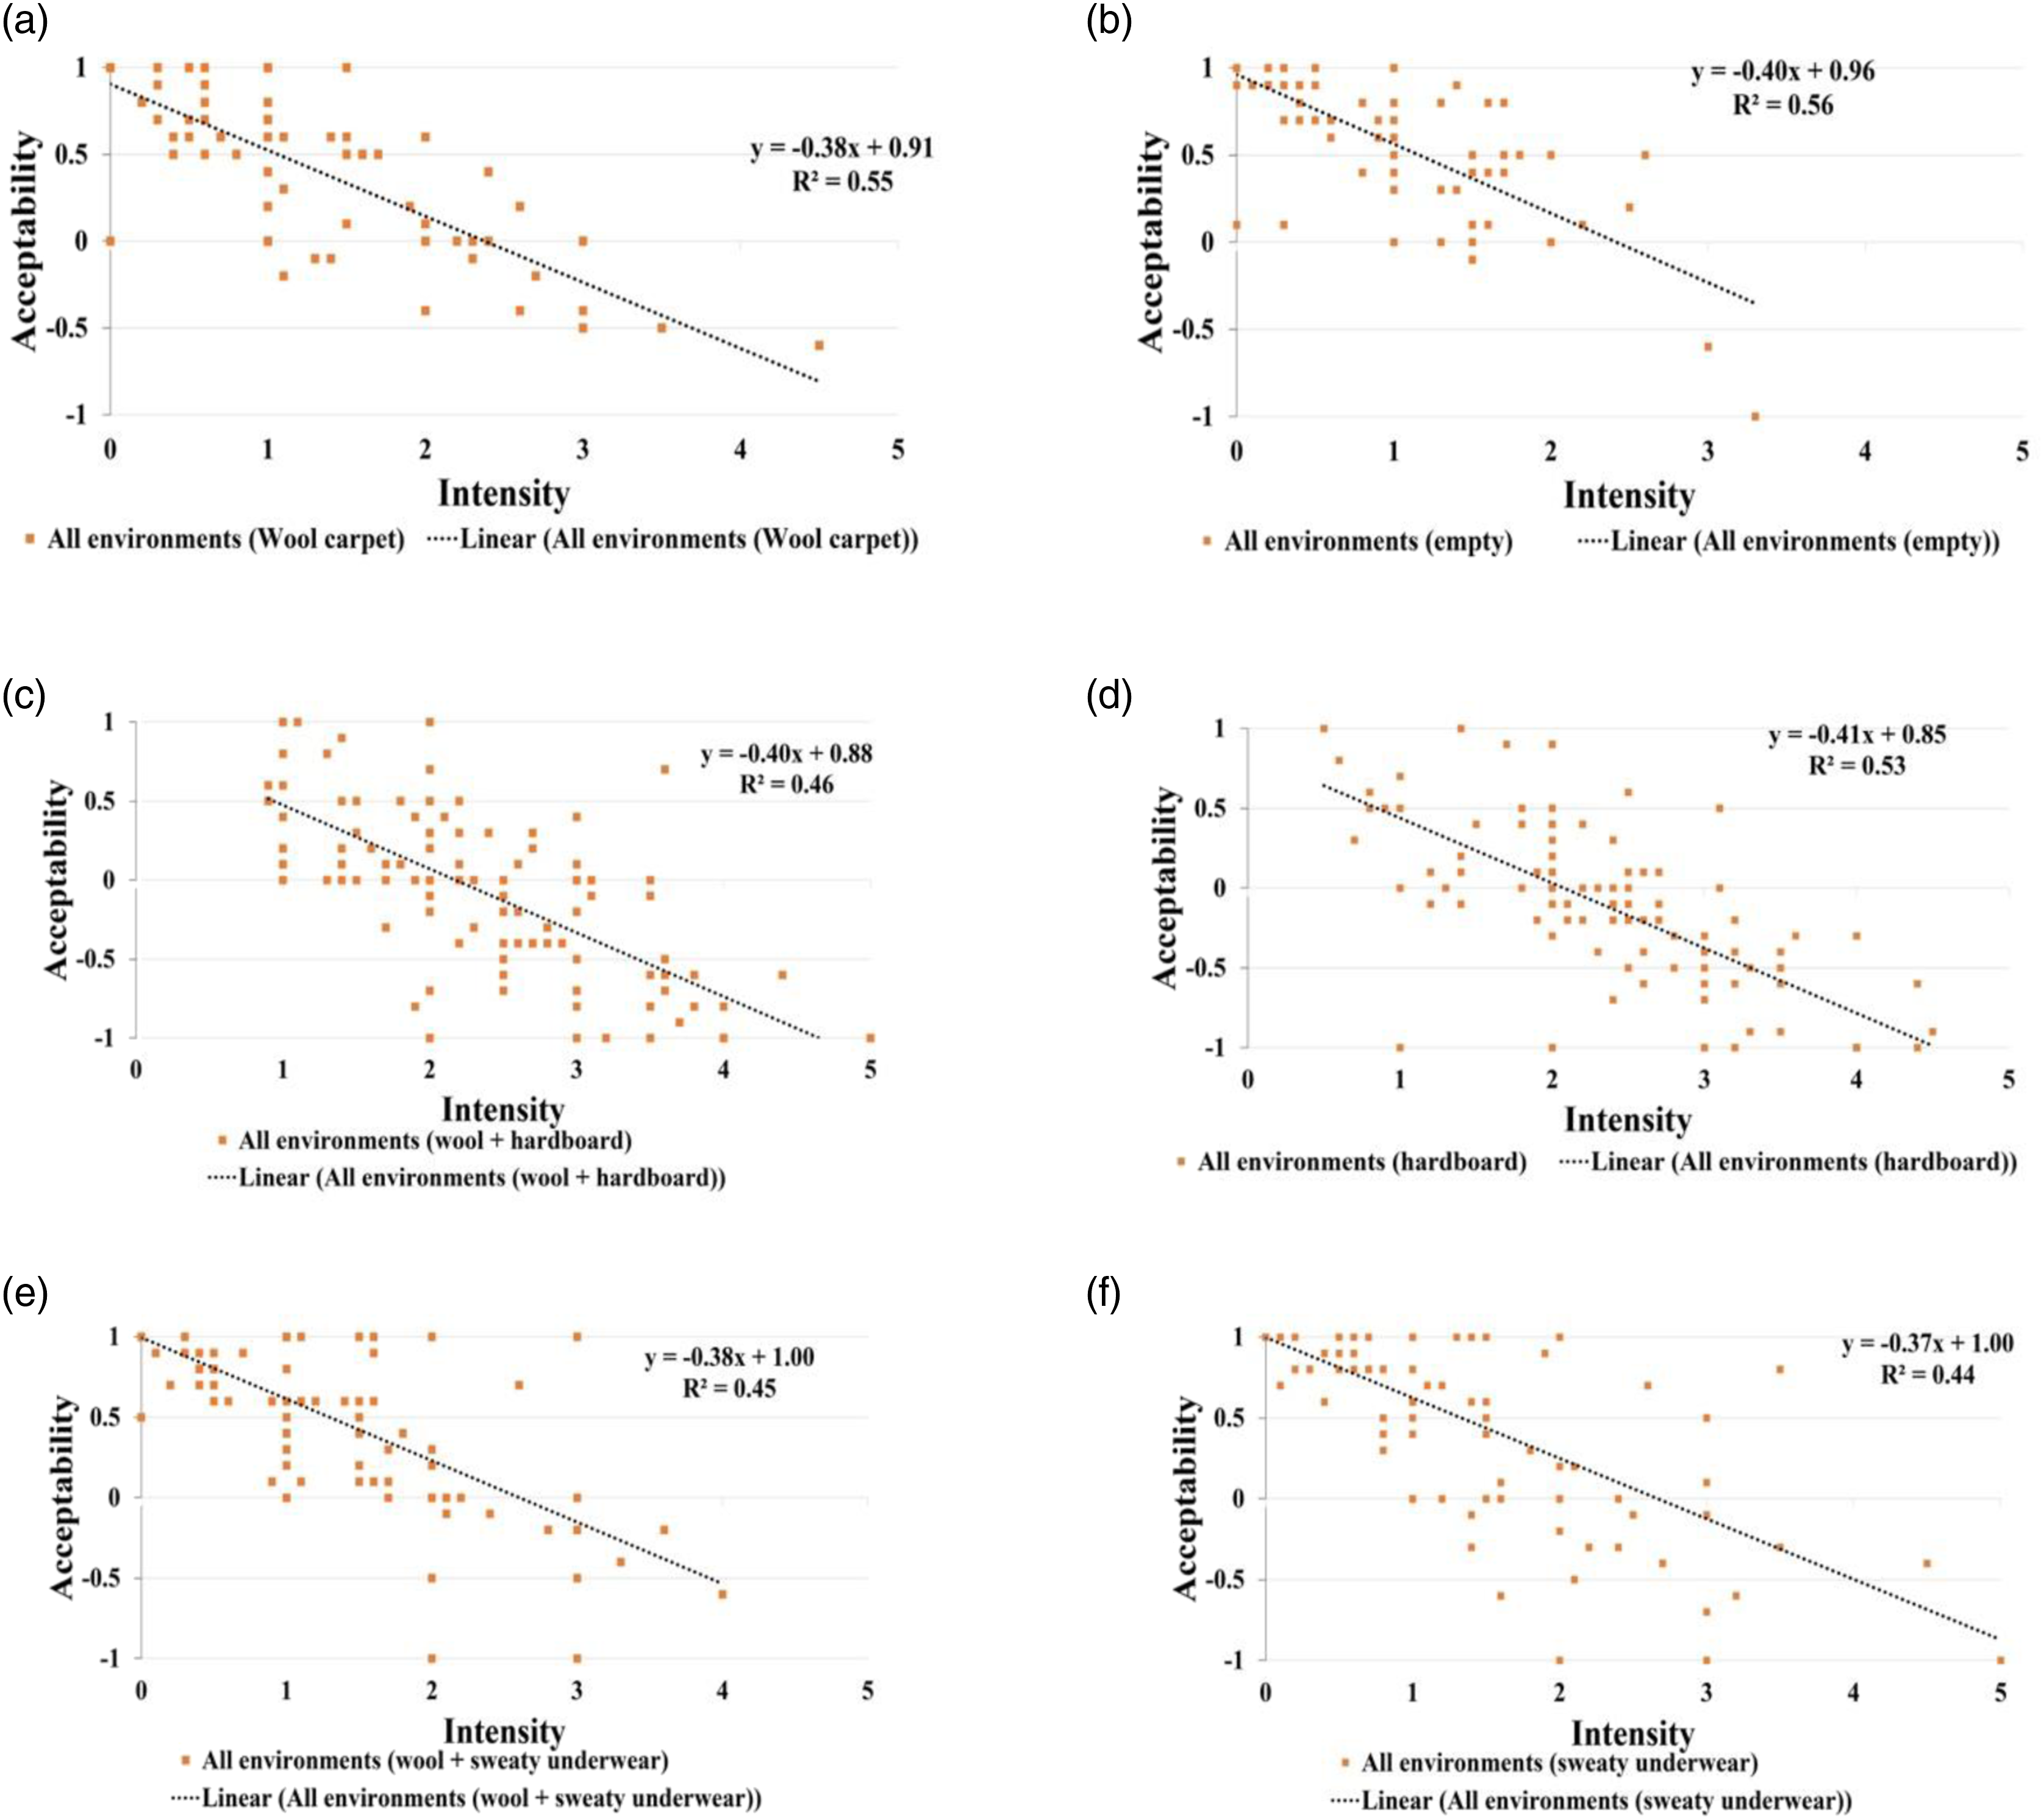
Discussion
Strengths and weaknesses
The main objective of this study was to test the effect of wool carpet on cleaning the indoor air through sensory evaluation and TVOC monitoring. Previous research has shown that the perceived air quality can be assessed using human sensory evaluation.32,33 It is well known that people can reasonably evaluate the perceived odour intensity of various materials using their noses where the chemical analyses are typically unable to sense the low concentrations of chemical compounds. 33 The present study supported this; while chemical monitoring revealed no VOC present emitted from the carpet, hardboard or sweaty underwear, the subjects detected odours in all the test environments.
The correlations between the odour intensity and acceptability assessments (Figure 6) show that when the subjects assessed the odour to be more intense, they also assessed it as less acceptable. This outcome justifies the use of the odour intensity assessments for studying the sorption effect of wool carpet.
To study the cleaning effect of the wool carpet, it was important to use a wool carpet with an as low as possible primary emission test. From previous studies, it is known that new materials always have a higher primary emission in the beginning,34,35 and therefore, the carpets tested were ventilated for at least 2 weeks before the experiments. Still, results showed that the odour intensity of the lowest odour emitting wool carpet, selected amongst eight different ones, was higher than an empty test environment. These primary emissions, therefore, might have affected the cleaning effect when the odour sources were added.
In this study, sweaty underwear was used to simulate human bio-effluents, which only partly represents the human emissions that include odours in breath as well as emissions of the skin. Real-life settings (for example a bedroom while sleeping) could provide a better understanding of the impact of wool carpets on human bio-effluents.
Comparison of test environments
Tests were performed in three different test environments. The outcome showed that for the small-scale environments (sniffing table and CLIMPAQ), the subjects evaluated the odour of the wool carpet + the odour source as less intense than only the odour source. Therefore, the results indicate that the wool carpets cleaned the air from odour emissions. Previous studies also showed that wool carpets could ad/absorb VOC in experiments by chemical analyses.13,19,36 However, previous studies used higher concentrations of VOC than those found indoors.
In the sniffing table and CLIMPAQ tests, the wool carpet covered the floor and walls of the test environment, and the odour sources were placed in contact with the wool carpet. Additionally, the wool carpet on the walls increased the surface area and the potential of the odour emission of the sources to come close to the wool carpet, thus increasing the possibility of sorption or the cleaning effect.
Particularly for the sniffing table, the odour sources are completely enclosed by the wool carpet. Before sniffing, the air in the container is filled with the emissions of the sources. During sniffing, a small fan exhausts the air of the container and, at the same time, creates a mixing condition (Figure 7(a)). After sniffing, the fan stops, and the condition in the container returns to the previous state. Consequently, the condition before, during and after the sniffing inside the container increases the possibility of sorption, shown by the large difference in the odour intensity between wool carpet + odour source and only the odour source. Setup and airflow pattern in (a) container of the sniffing table; (b) in the CLIMPAQ; and (c) in the test chamber.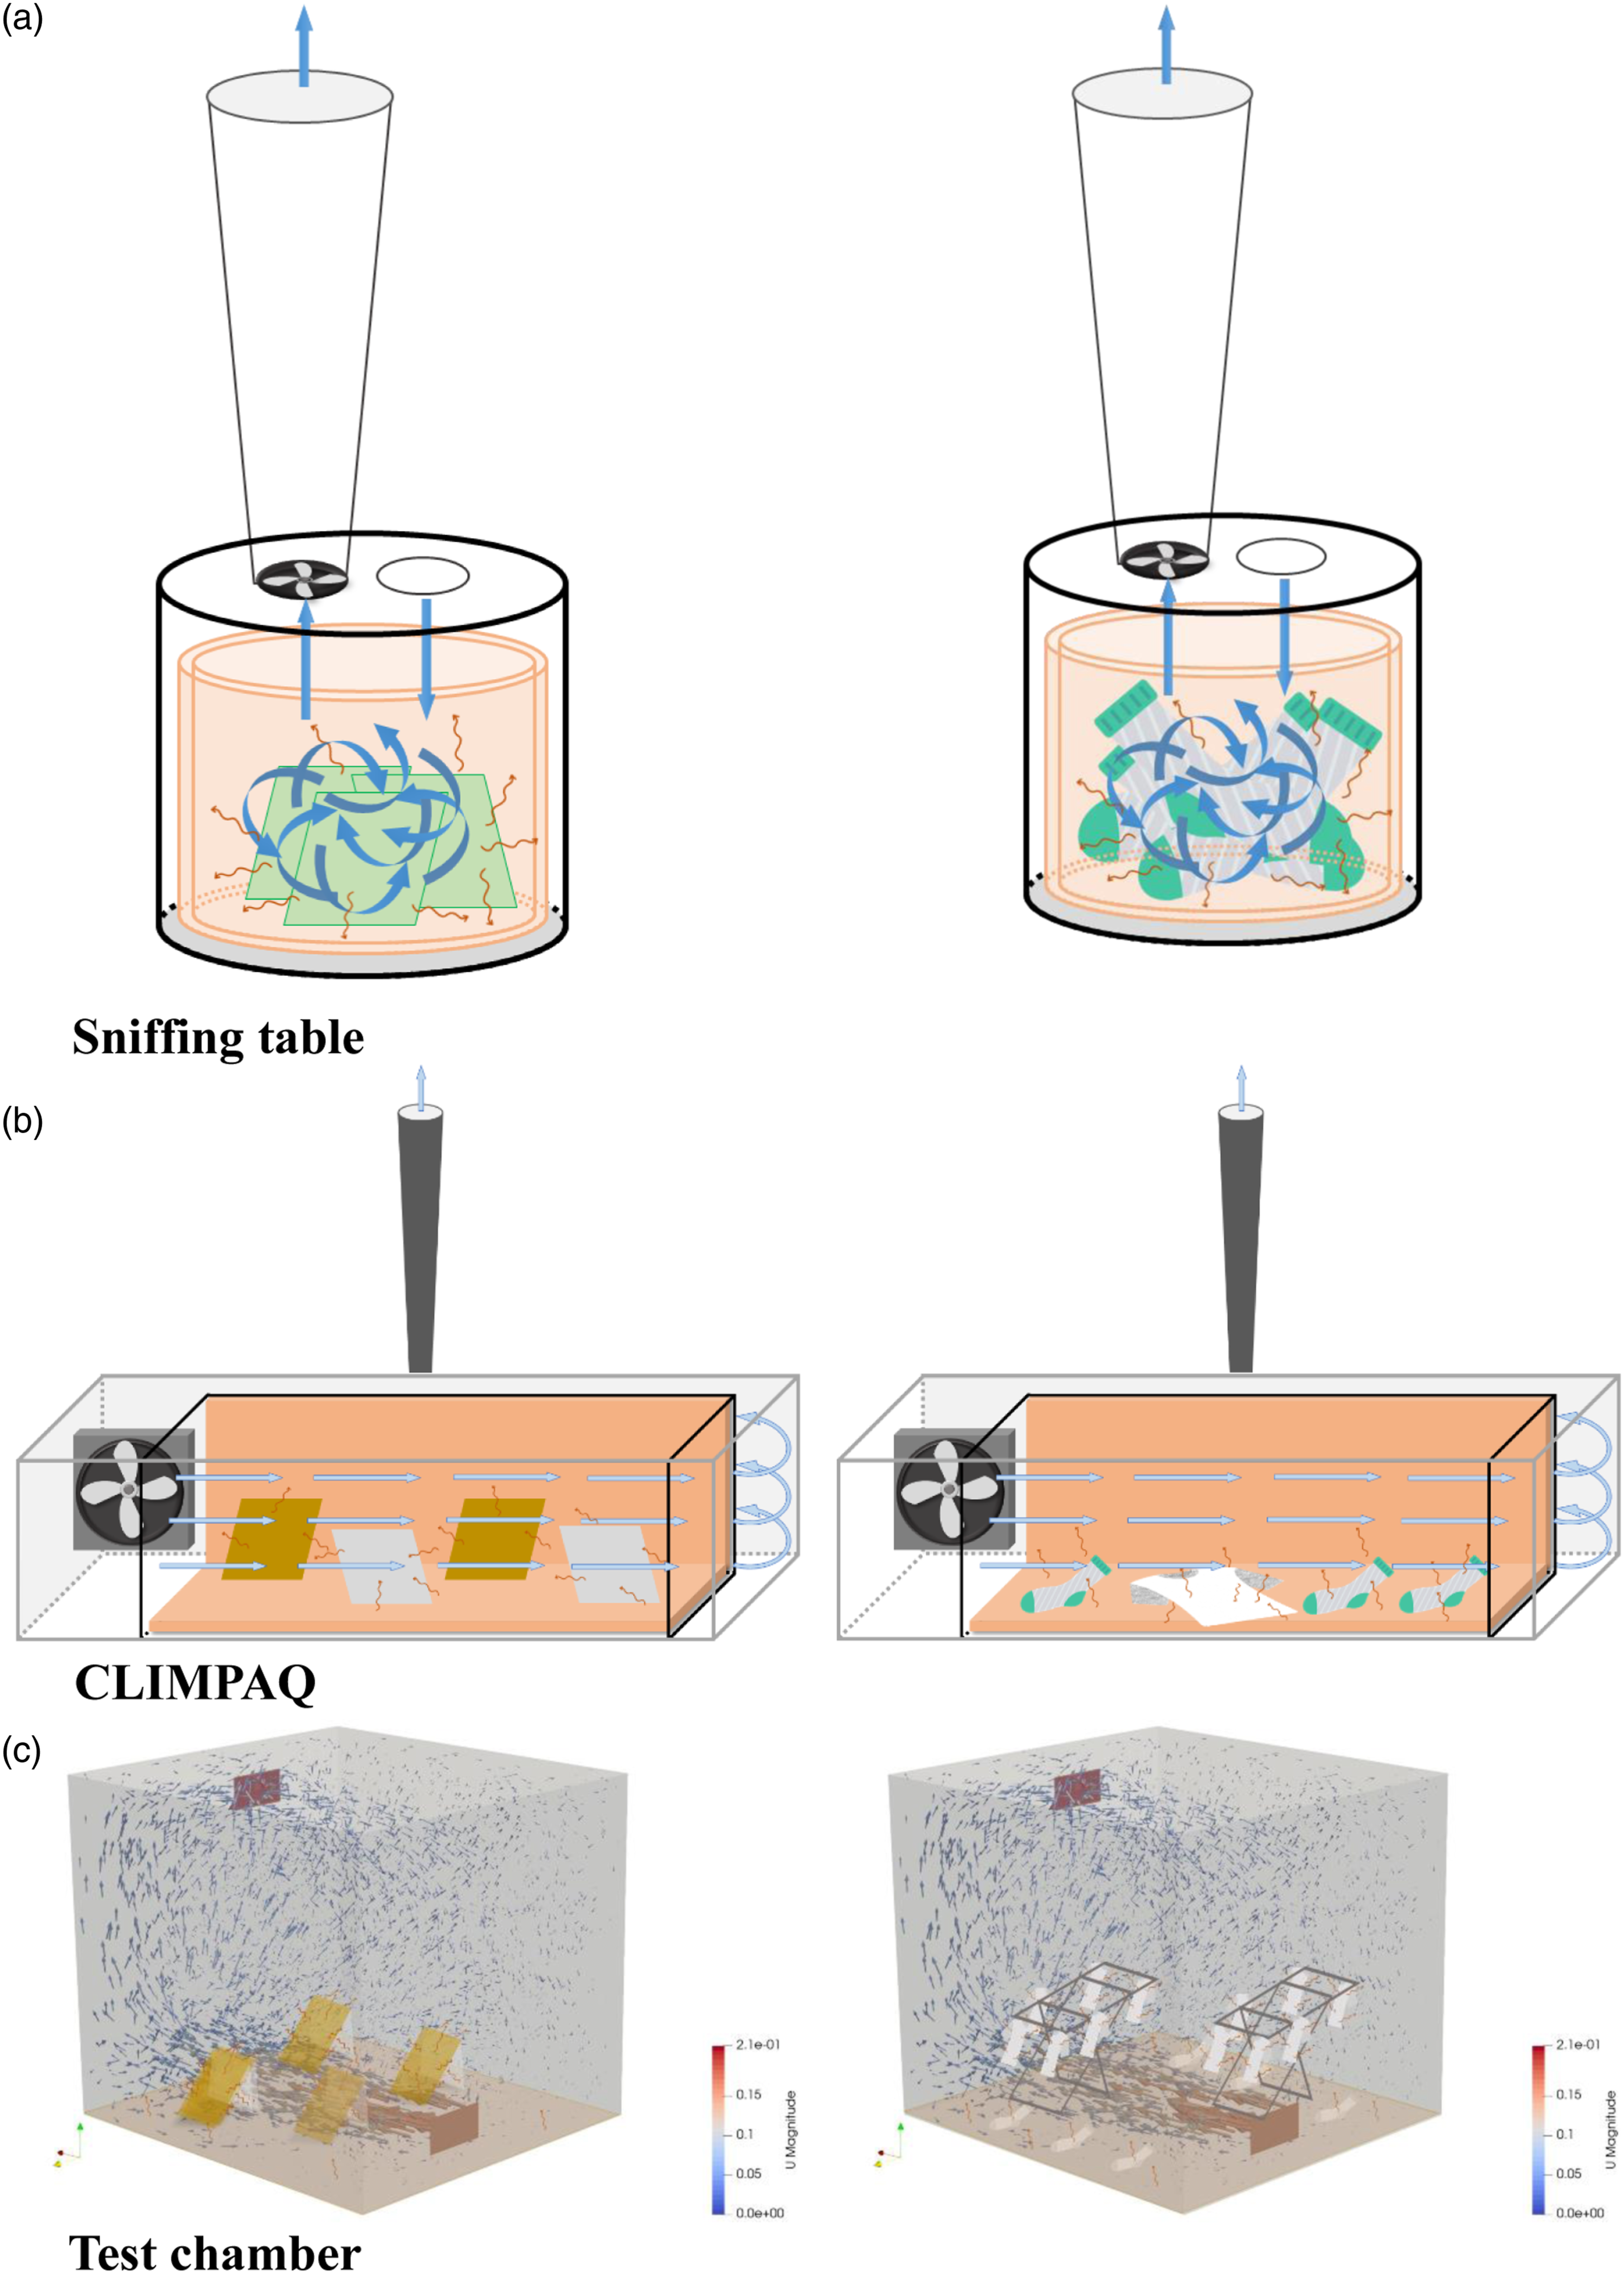
For the CLIMPAQ test, a small fan creates a continuous airflow horizontally through the CLIMPAQ passing the bottom and walls with constant air velocity (Figure 7(b)). The possibility of emissions from additional odour sources is less than in the sniffing table containers due to the limited possibility of contact of the emissions with the surfaces of the wool carpet. In the sniffing table the air is more mixed than in the CLIMPAQ.
In a real-life setting, however, a wool carpet usually only covers the floor. Therefore, to simulate a real-life scenario, tests were performed in the test chambers. The results showed that the subjects assessed the odour intensity of the wool carpet + hardboard and only the hardboard to be almost similar. Moreover, the odour intensity of wool carpet + sweaty underwear was stronger than only the sweaty underwear. To explain this outcome, a simple CFD simulation was performed to show the airflow pattern in the test chamber, using as input the measurements of airflow rate from the air supply grille (Figure 7(c)). The CFD simulation showed that the interaction of the source emissions with the wool carpet on the floor is minimal since the air passes the surface of the carpet and then mixes with the air in the test chamber before it leaves the test chamber via the duct. The emissions from the sweaty underwear, hung at the height of a seated person ((Figure 7(c)), are most likely moving horizontally and are not passing the floor but are mixed with the room air before being exhausted. The emissions from the hardboard are however most likely flow more vertically, towards the floor and above the hardboard, having more opportunity to be ad(b)sorbed by the carpet.
Comparison of odour sources
Besides the location of the source in the test chambers, another reason for the difference in the cleaning effect of wool carpet could be the type of odour compounds emitted by the two sources. The two sources of odours, hardboard and sweaty underwear, were selected to test the cleaning effect of carpets for two common sources of pollution indoors. These two sources emit different types of VOC. While hardboard emits formaldehyde and 44 compounds, including alkanes, (chlorinated) aromatic hydrocarbons, carbonyl compounds (i.e. aldehydes and ketones), alcohols, esters, etc., 37 sweaty underwear emits mainly skin emanation, comprising 64 C4-C10 chemicals including alcohols, aldehydes, ketones, alkanes, aromatics, esters, alkenes and acids.38,39 Aldehydes, especially hexanal and pentanal, were identified to be the main odour compounds emitted from particleboard due to their low odour thresholds, 37 and alcohols, aldehydes, ketones species contributed the most to emissions from the skin.38,39 Previous research showed that wool can physically and chemically bound with formaldehyde from indoor air and ad(b)sorb some VOC like toluene, α-pinene, 36 limonene, dodecane, 40 trichloro ethylene and VVOC like ethanol. 19 These studies showed that wool carpets can ad(b)sorb various polarity of VOC due to different functional groups in amino acids of wool fibre piles.
From the tests can be concluded that in the sniffing table (the test environment with the highest potential of ad(b)sorbing emissions due to the highest contact possibilities) the odour emissions from hardboard were ad(b)sorbed less than the odour emissions from the sweaty underwear. This difference may be caused by a stronger ad(b)sorption of odorant VOC (like alcohols, aldehydes, ketones) from sweaty underwear on the wool carpet. However, it is unclear whether the sorption effects on the wool carpet are due to chemical or physical bonding. Studying the sorption effects over a longer period with intermittent sources present, could give more insight into these processes.
Conclusions
From the sensory tests with two common sources of indoor pollution: hardboard and sweaty underwear, in three different test environments, it can be concluded that the wool carpet tested can clean the air of odours in small-scale environments, where the wool carpet covered the floor and walls of the test environment, and the odour sources are in contact with the wool carpet. However, the results were less conclusive in “real-life” scenarios where wool carpets only covered the floor. Overall, wool carpets have the potential to absorb the odours emitted from hardboard or sweaty underwear and improve perceived IAQ, but only when these emissions are close to the wool carpet, and thus have the opportunity to be ad(b)sorbed by the wool carpet.
Supplemental Material
Supplemental Material - Do wool carpets ‘clean’ the air or not? A study on the sorption effects of wool carpets by sensory evaluation
Supplemental Material for Do wool carpets ‘clean’ the air or not? A study on the sorption effects of wool carpets by sensory evaluation by Seyyed Abbas Noorian Najafabadi, Er Ding, Nadine Hobeika and Philomena M. Bluyssen in Indoor and Built Environment
Footnotes
Acknowledgements
The authors would like to thank Amneh Hamida from the Faculty of Architecture and the Built Environment of the Delft University of Technology, Delft, the Netherlands, and Soma Sugano from the Department of Architecture, Waseda University, Tokyo, Japan, for support during the experiments.
Author contributions
Seyyed Abbas Abbas Noorian Najafabadi: methodology; investigation; data analysis; writing-original draft preparation; writing review and editing; Er Ding: investigation; data analysis; writing-original draft preparation; writing review and editing; Nadine Hobeika: investigation; data-analysis; writing-original draft preparation; writing review and editing; Philomena M. Bluyssen: conceptualization; methodology; investigation; supervision; writing-original draft preparation; writing review and editing.
Declaration of conflicting interests
The author(s) declared no potential conflicts of interest with respect to the research, authorship, and/or publication of this article.
Funding
The author(s) disclosed receipt of the following financial support for the research, authorship, and/or publication of this article: This work was supported by the Best Wool Carpets (Best, The Netherlands) and The New Zealand Merino Company (Christchurch, New Zealand) through the New Zealand Ministry for Primary Industries Sustainable Food and Fibre Futures Fund.
Supplemental material
Supplemental material for this article is available online.
References
Supplementary Material
Please find the following supplemental material available below.
For Open Access articles published under a Creative Commons License, all supplemental material carries the same license as the article it is associated with.
For non-Open Access articles published, all supplemental material carries a non-exclusive license, and permission requests for re-use of supplemental material or any part of supplemental material shall be sent directly to the copyright owner as specified in the copyright notice associated with the article.