
Abstract
The air supply of the variable air volume (VAV) system could decrease with indoor load, resulting in reduced indoor comfort. An active diffuser is a good solution, but its adjustment process is often neglected. In most cases, the diffuser maintains the air supply velocity constant by controlling the air supply area. This traditional control method based on constant velocity (CMV) often fails to reach jet throw expectation due to the continuous change of airflow diffusion performance during the adjustment process. In this study, a new control method based on constant jet throw length (CMT) is proposed and applied in two typical rooms (office and conference). The results show that the CMT could increase the throw length in the spreading zone and enhances the airflow at the wall zone and ground zone, providing a more uniform temperature and more comfortable indoor environment. In 40% air volume condition, the air diffusion performance index (ADPI) in the office using CMT has improved from 89.66% to 95.69% compared to CMV, while ADPI in the conference improved from 92.11% to 97.37%. This study can help designers determine the optimal adjustment scheme to improve the adaptability of the active diffuser to the VAV system.
Introduction
HVAC accounts for a 30%∼60% of the total building energy consumption.1,2 Reducing the energy consumption of air conditioning system has become an important part of building carbon reduction. 3 Variable air volume air conditioning (VAV) is a system developed to achieve energy-saving operation by reducing the energy consumption of the fan when the indoor load decreases. It has the advantages of strong flexibility, low energy consumption and high air quality. 4 Compared with the constant air volume system, the power consumption of the VAV system can be reduced by 40%. 5 The minimum air volume setting value can affect the total energy consumption of the system.6,7 At present, the minimum airflow of VAV is usually set to 30%∼50% of the maximum. The research results of Kang et al. 8 provide a reference for setting minimum air volume below 20%. Due to the good energy-saving benefits caused by the reduction of air supply volume, the VAV system is widely used in various buildings such as shopping malls, offices and houses.9,10,11
Reduction of air supply can lead to lower comfort and indoor pollutant accumulation, directly affecting the health and work efficiency of personnel. 12 For cooling conditions, the reduction of air momentum caused by decreased air volume would lead to cold air subsidence. On the contrary, excessive air volume would cause draught problems in the work area. For heating conditions, thermal air floating at low wind velocity would lead to vertical stratification of room temperature, resulting in ‘warm head-cool feet’ discomfort. 13 Furthermore, some studies have shown that a lower air supply would reduce indoor pollutant removal efficiency. Indoor health problems caused by insufficient air supply exist in hospitals,14,15 office buildings,16,17 residences 18 and public places. 19
Reasonable air supply terminal can improve the indoor air distribution. Active supply diffuser is a type of air outlet with adjustable air supply area or variable geometry, which has unique advantages in coping with load changes. Previous studies have evaluated the indoor environmental performance of some terminals. Wu et al. 20 experimentally tested an active ceiling diffuser that can control the air supply area through a central baffle. The test results show improved indoor ventilation efficiency and comfort advantages compared with commonly used diffusers. Nina 21 proposed a nozzle controlled by three rings. When the air supply decreases, closing some rings can improve the jet velocity at low air volume. The computational fluid dynamics (CFD) simulation results show that it is suitable for large space environment construction. Rabani et al. 22 tested a radial diffuser that a sleeve coupling module can control to ensure constant air velocity when the air volume decreases. The test results show that when the air conditioner operates at the lowest air volume, the diffuser can provide 75% comfort of the scope.
The regulation mode of active diffusers is mainly divided into step adjustment (SA) and continuous adjustment (CA). SA means that the diffuser has several fixed states, and the air volume range is divided into several intervals to maintain the air outlet state unchanged in different intervals. The most basic step adjustment is divided into three operating states of maximum, minimum and partial air volume, and has three opening forms corresponding to them. 21 CA means that with the change in air supply, the air supply area can be continuously adjusted to ensure constant velocity. Few existing studies have focused on the optimization of the operation of active diffusers. The adjustment process of the outlet is accompanied by the change in the geometric shape and the outlet area, which leads to significant differences in airflow diffusion performance for different opening states.
Conventional control methods to keep the discharge velocity constant could cause the throw length to deviate from the design value. This problem has not received sufficient consideration. The control method of the active diffuser should be discussed to further improve its indoor environmental construction ability. This paper proposes an optimization method considering the full operation state diffuser to ensure the constant throw length. This method comprehensively considers the variation in the diffusion performance of the diffuser under different opening states. Taking into account the variation in the VAV system and set throw length, the optimal control strategy of active diffuser with air volume variation can be found.
The purpose of this paper is to study the air distribution of a new type of ceiling diffuser under two kinds of tuyere adjustment strategies: control method based on constant velocity (CMV) and constant jet throw length (CMT). Both full-scale experiments and numerical simulation were conducted, including two parts: (1) Jet characteristics tests of diffusers under different opening conditions. (2) Thermal comfort test of office and conference room. The indoor velocity and temperature distribution, Air Diffusion Performance Index (ADPI) and ventilation efficiency were used to evaluate the performance of CMV and CMT.
Methodology
Thermal comfort and jet throw
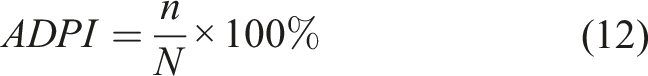
ADPI is defined as the ratio of the total number of points where the Effective Draught Temperature (EDT) in the workplace meets the requirements; EDT is a calculated temperature difference that combines air temperature difference and air velocity.
The diffuser selection method based on ADPI has been used by designers since 1970.
23
This method considers the diffuser jet throw length
Xiao et al.
25
and Sun et al.
26
studied the flow state of the ceiling diffuser jet. The common research results show that for the cooling condition of low outflow angle, the jet flow of the ceiling diffuser can be divided into three stages: free jet zone, transition zone and adherent jet zone. After the airflow is discharged from the diffuser at a specific angle, the development of the jet boundary is limited by the ceiling. The low pressure arising from air entrainment would cause the bending of the jet axis, and finally hit the wall at a certain angle. The airflow would gradually develop into an adherent jet after a brief transition. The jet throw length of the airflow

Wu
27
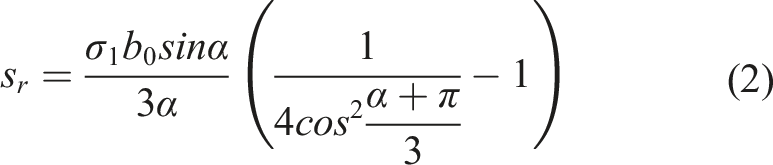
combined with Gortler solution of free turbulent jet and obtained the distance expression of the free jet zone of ceiling diffuser. Equation (2) shows that the length of free jet zone is related to the geometric parameters of the diffuser. It is not affected by the change in the air supply during operation.
The throw length of transition zone

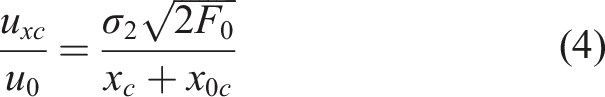
The fully developed zone of the flow can be described by attached plane jet, as shown in equation (4).27,30
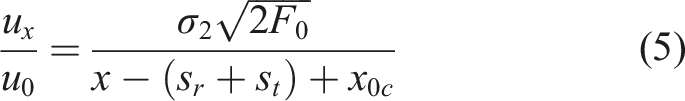
To describe the variation of the jet throw with the air supply volume, the average air velocity
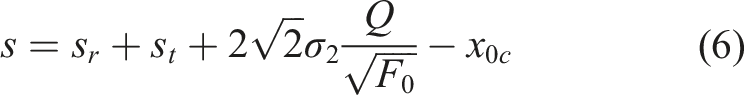
Equations (5) and (6) can be organized into the simpler expression as shown in equations (7) and (8).
Equation (8) shows that the jet throw length is mainly influenced by two dynamically varying parameters, the air supply area
Studied cases
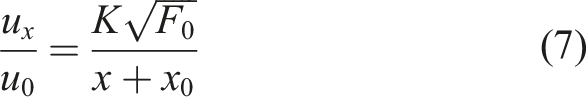
This paper proposes an active ceiling diffuser with variable air supply area, which can be adjusted through the sub-tuyere between the outlet blades. As shown in Figure 1(a). The outer edge of each sub-tuyere is equipped with a rotating shaft connected to the baffle. The opening and closing of sub-tuyere can be controlled by rotating the baffle, so as to adapt to the changing air volume of the VAV system. The sub-tuyeres can be divided into four categories according to the location (Figure 1(b)). The airflow characteristics under different sub-tuyere combinations are different, which are discussed in the following. Introduction to the diffuser: (a) geometric dimensions and operating modes and (b) sub-tuyere number and corresponding opening state.
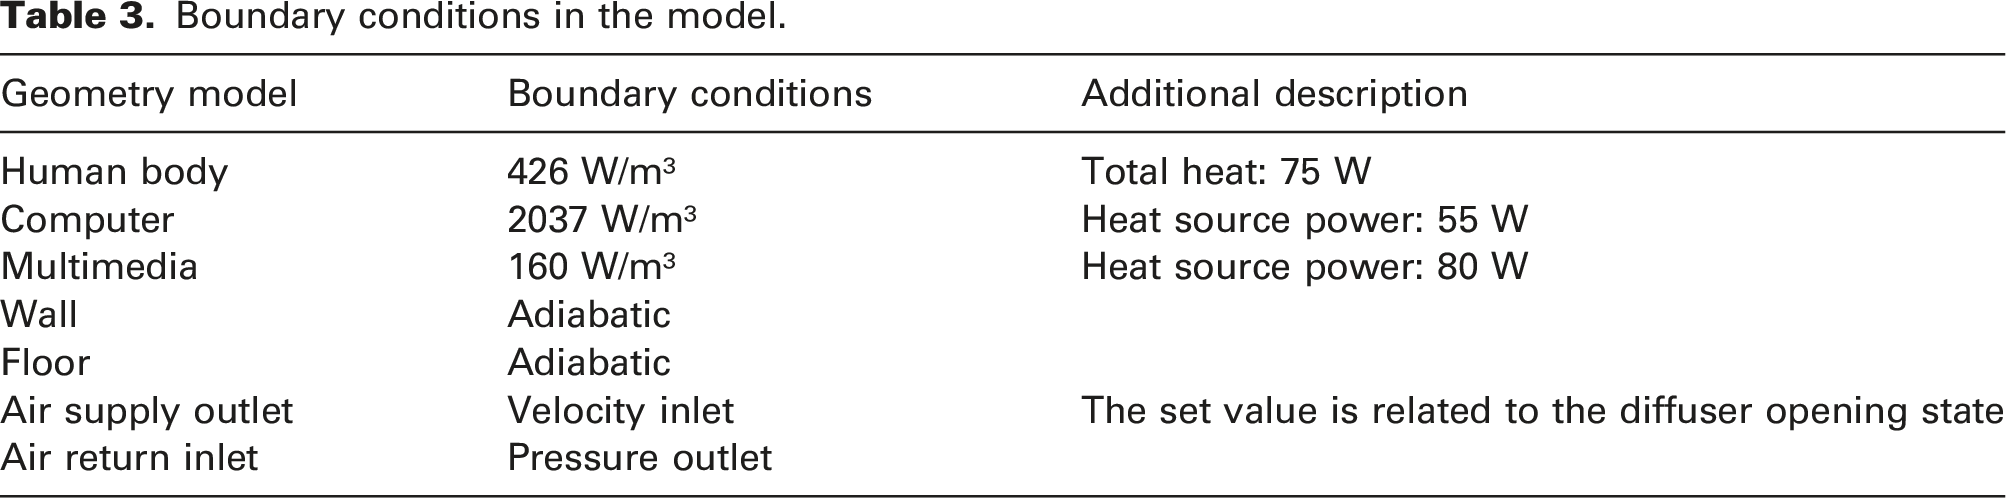
Two common room types, office and conference room, were studied and reported in this paper. Each room type considers two operating conditions, design load and partial load. The indoor heat sources in this study were considered only for the sensible heat load of occupants and equipment. The walls were considered to be adiabatic while the heat transfer from the external windows was taken into account. The power of all the heat dissipation equipment involved in the experimental process is controllable. Considering the lower limit of air supply volume commonly used for variable air volume systems, the partial load was set to 40% of the maximum value. The heat release
31
and the location of the heat source in the room are shown in Figure 2-S1. The arrangement of the indoor equipment is shown in Figure 2(a)-S2 and (b)-S2. Due to the limitations of the experimental conditions, the conference conditions were simulated in FLUENT. The models created in the program are shown in Figure 2(c)-S2 and (d)-S2. The appearance of room setting in cases: (a) office under design load; (b) office under partial load; (c) conference room under design load and (d) conference room under partial load. (The left part (S1) represents the plan view of the room layout and the right part (S2) represents the equipment layout in experiments or models in simulations.).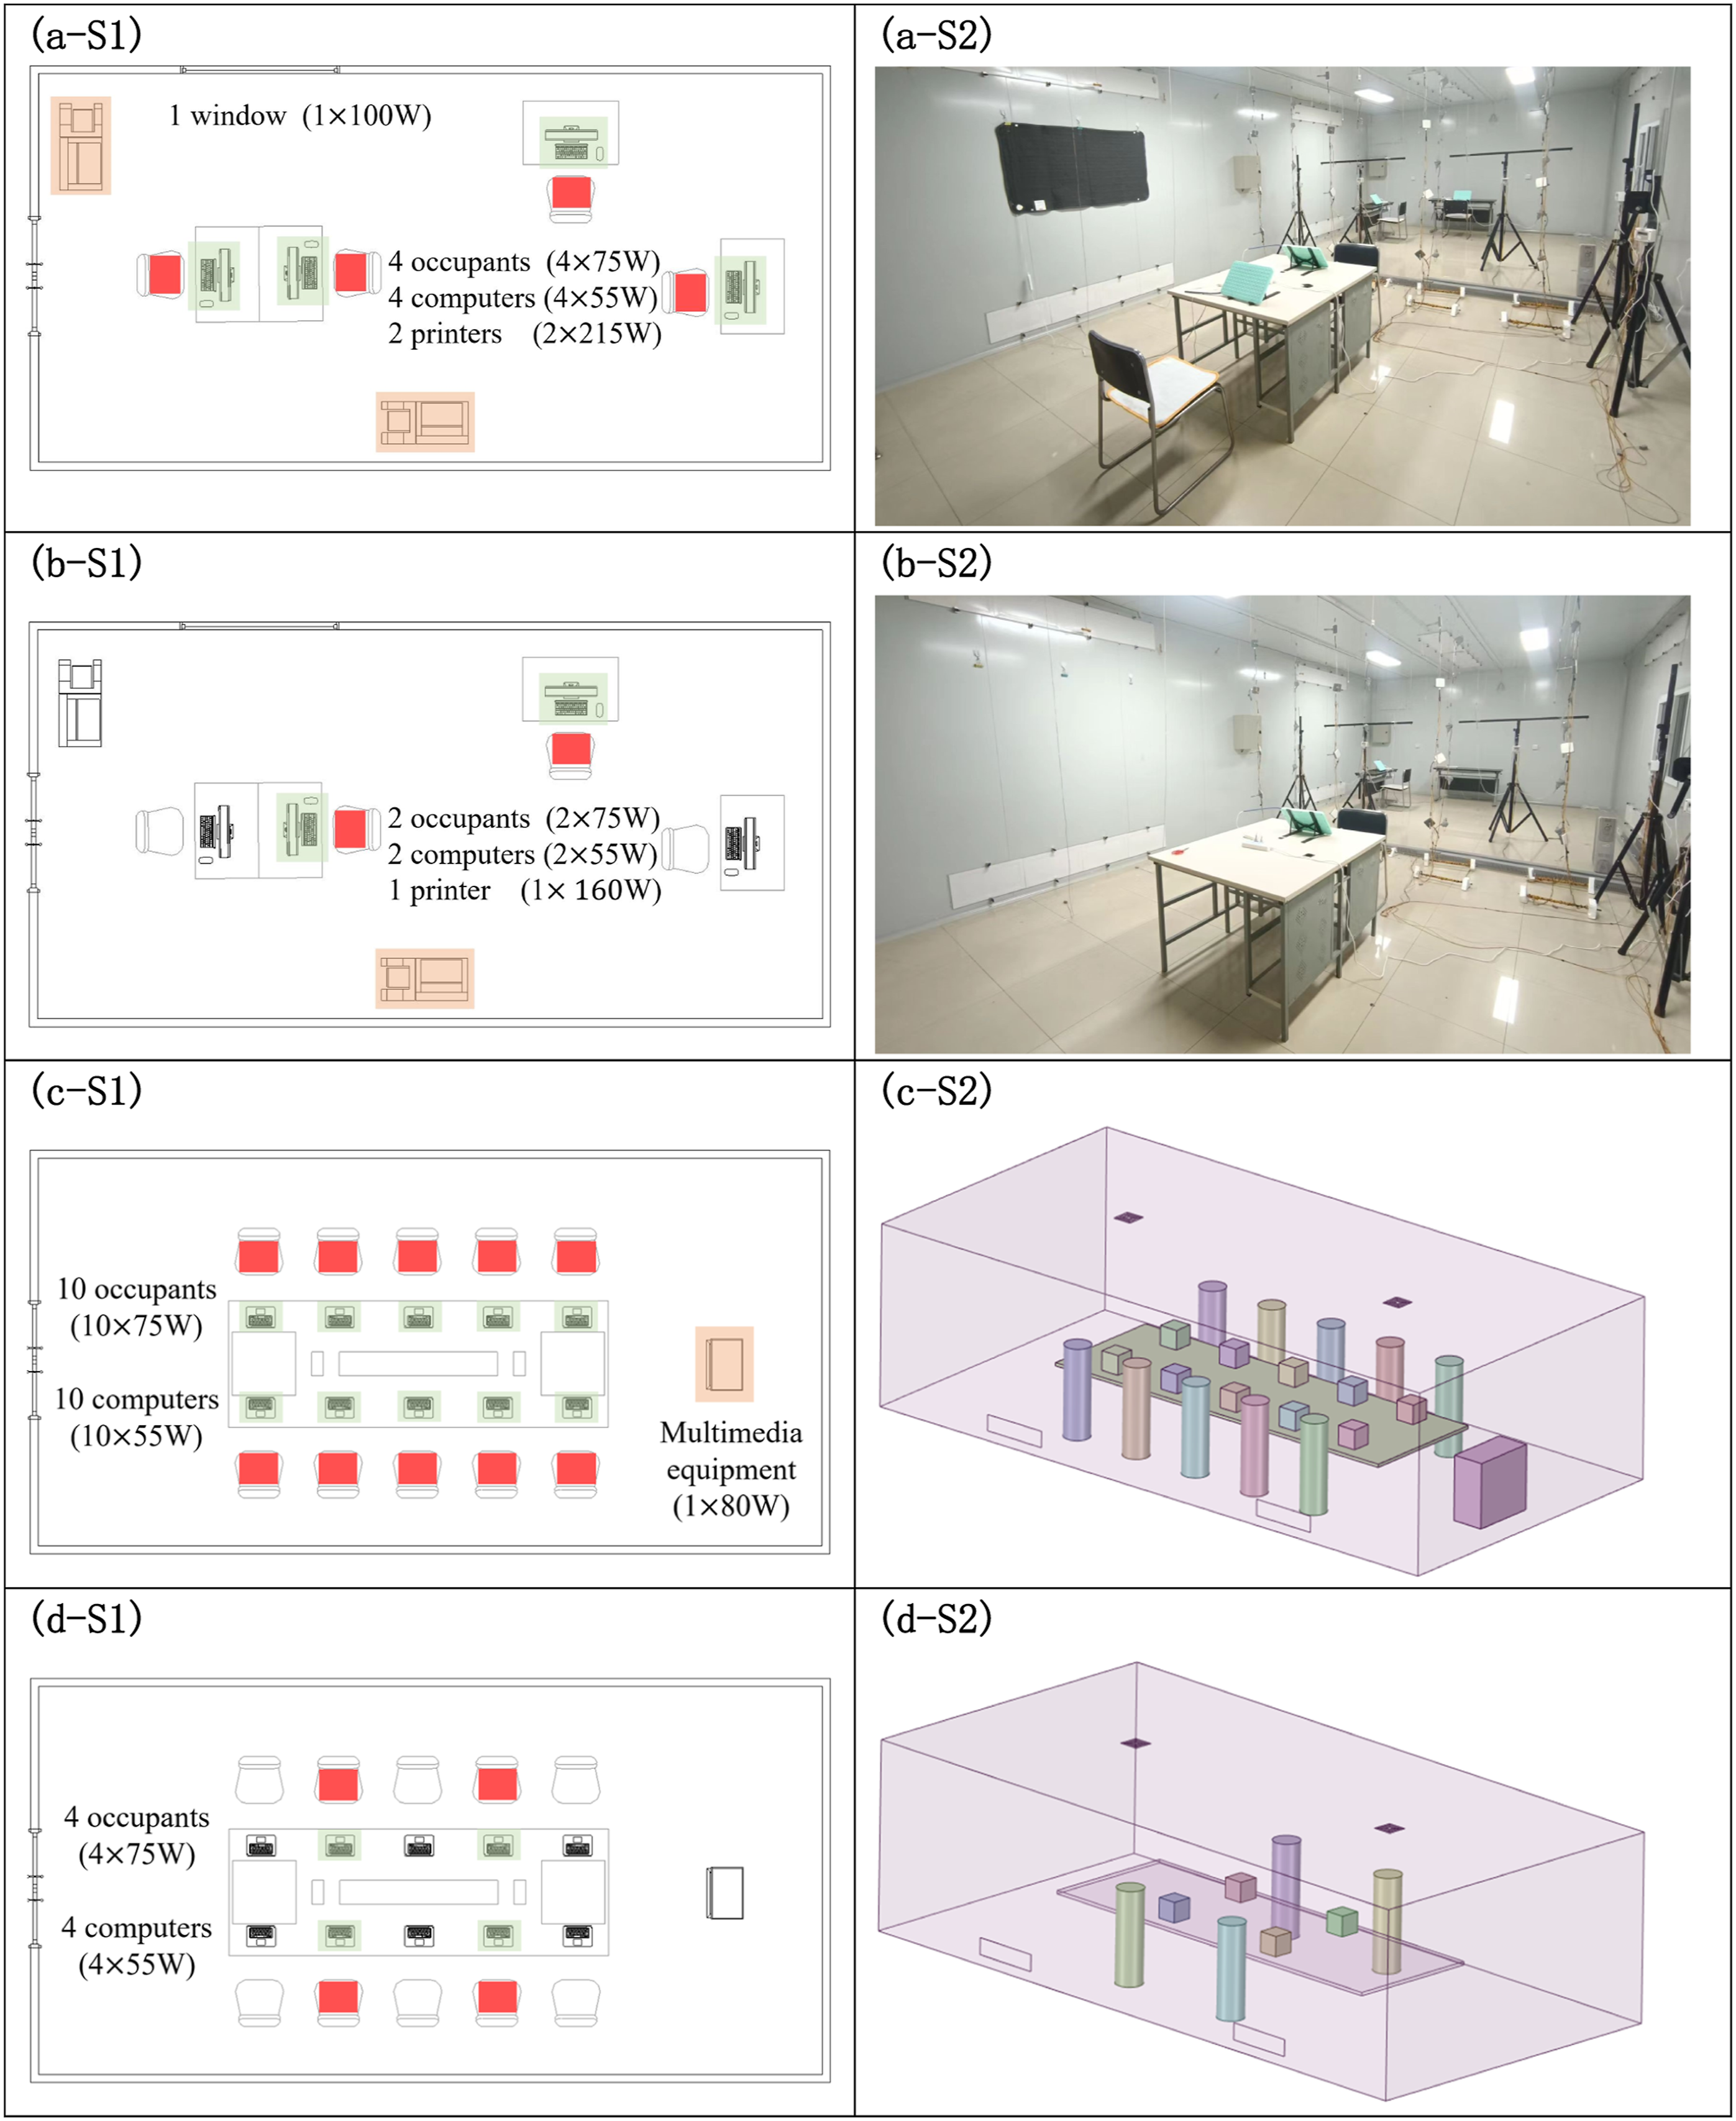
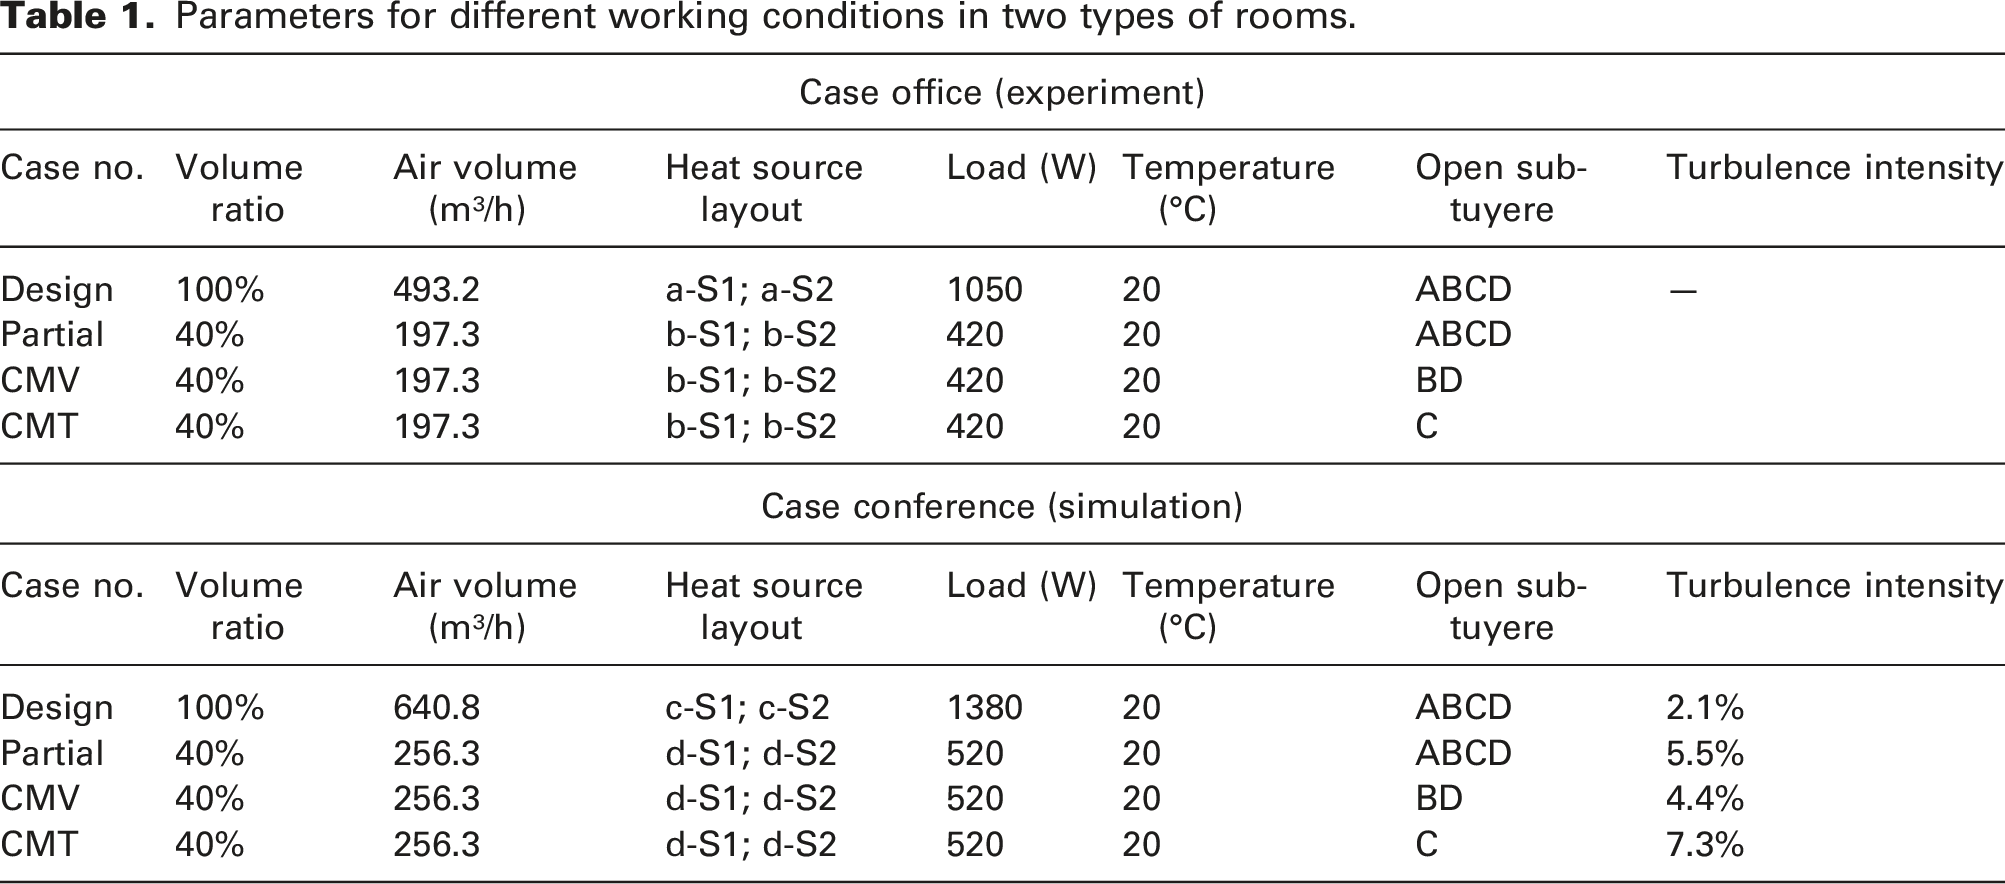
Parameters for different working conditions in two types of rooms.
Experimentation
The experimental measurements were performed in a 10 m × 5 m × 2.8 m (L
Two air supply outlets are installed at the centre axis of the laboratory ceiling (x = 2.5 m and 7.5 m, y = 2.5 m). The diffusers are connected to the static pressure box, which can ensure the stability of airflow and uniform air supply in all directions. Moreover, each branch duct is equipped with a damper, which can realize the balanced distribution of conditioned air between different diffusers. Figure 3 gives an overview of the laboratory. The layout of thermal charmer: (a) schematic illustration of the experimental system and (b) location of inlet and outlet.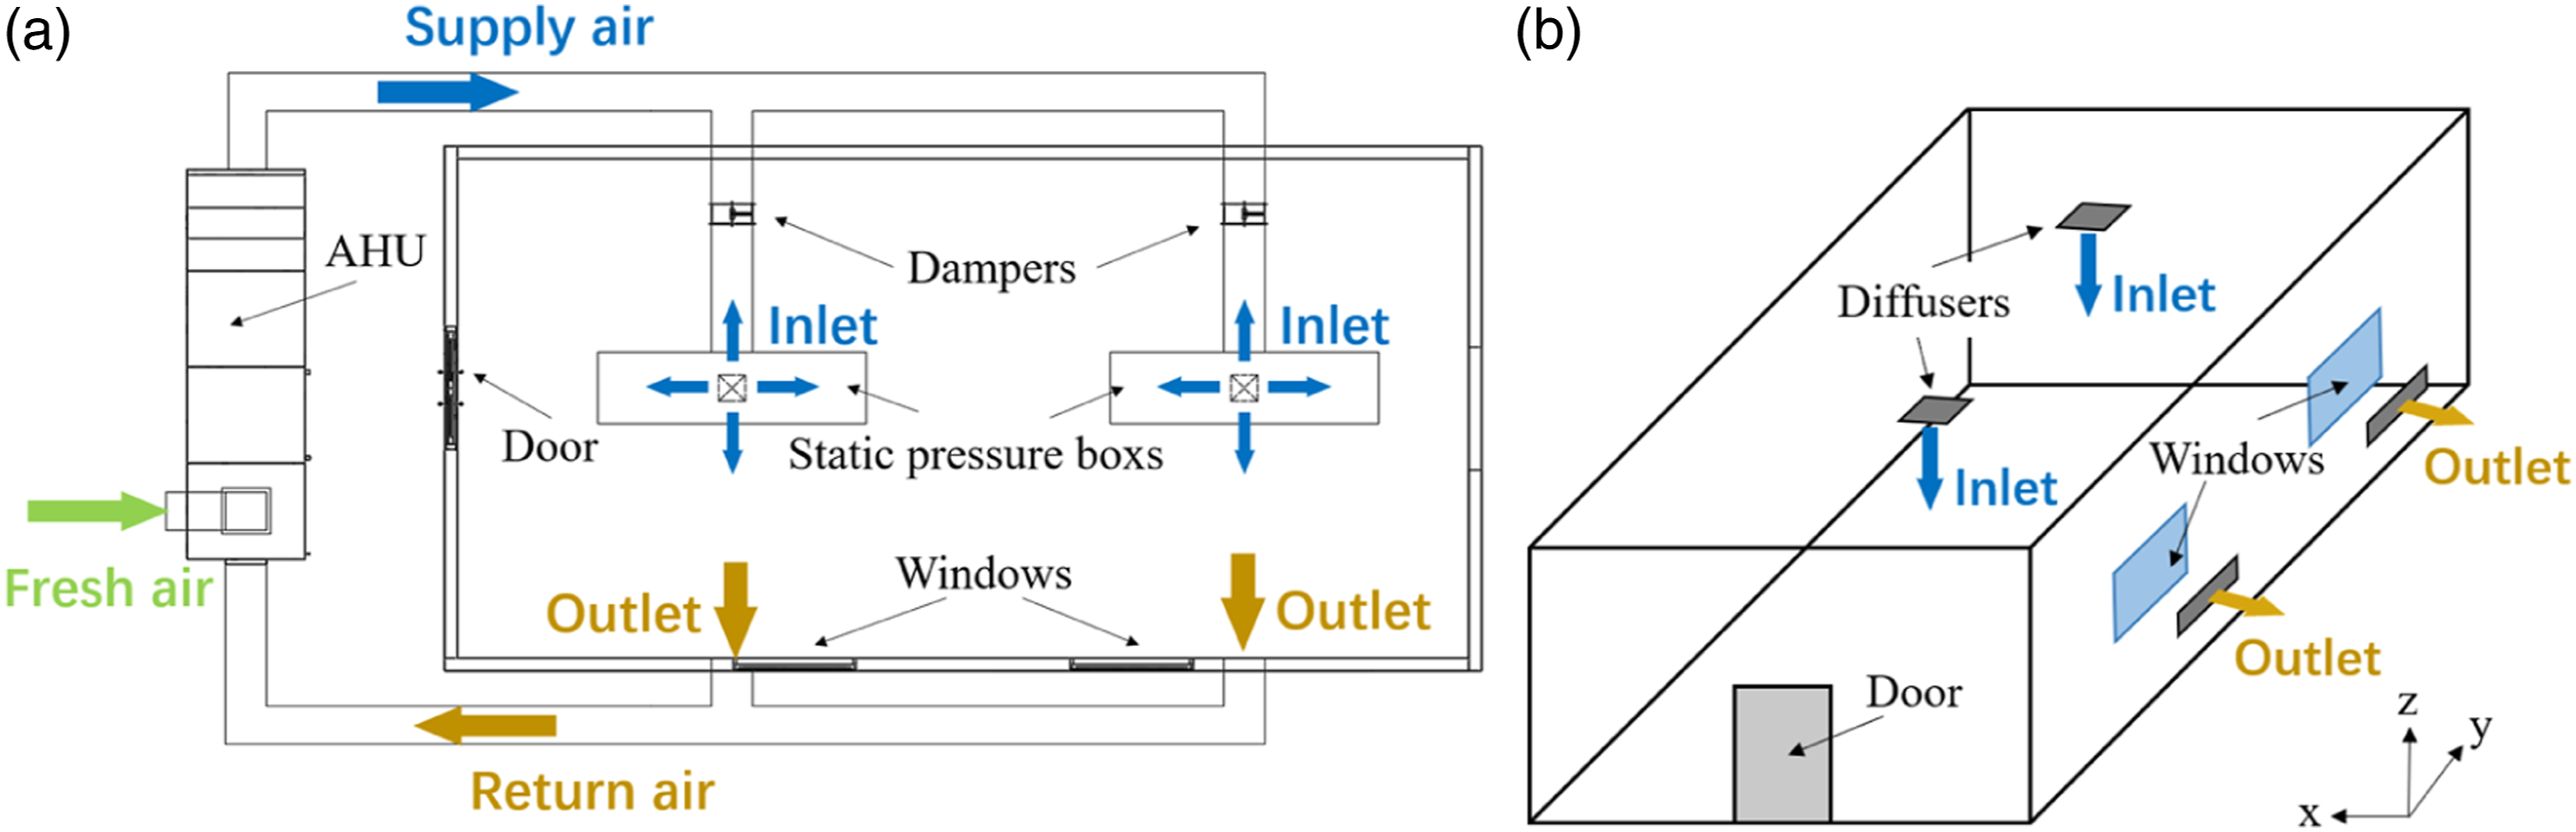
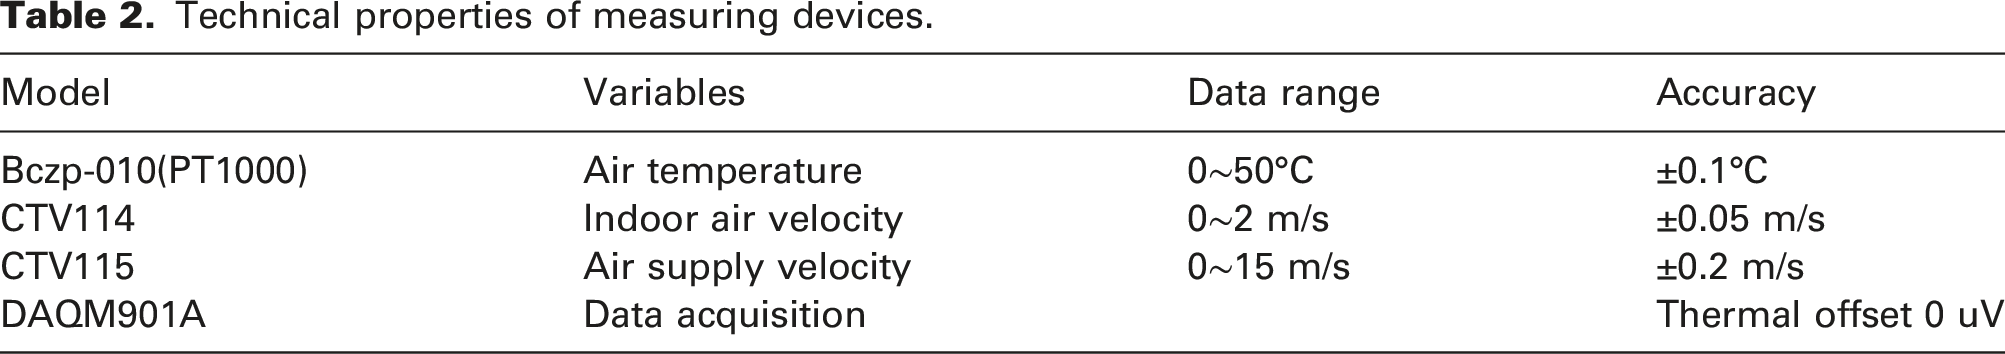
Technical properties of measuring devices.
(1) Jet characteristics tests
The jet characteristics tests were conducted under isothermal conditions, which consisted of two parts: (a) Determination of the jet axis position and (b) velocity attenuation tests under different sub-tuyere combinations. As the airflow is not affected by buoyancy during the movement, it can be considered that the jet axis is parallel to the ceiling. 32
Velocity tests are performed at four different distances of 0.01 m, 0.02 m,
33
0.05 m
34
and 0.08 m from the ceiling to determine the position of the attachment axis. 12 measuring points were arranged every 0.3 m along the jet direction from the diffuser (as shown in Figure 4(a)). The velocity transducers were fixed by a triangular bracket, and the position of the measuring points can be adjusted by the position of the bracket and the height of the vertical rod. Based on the test results of the axis position, the velocity attenuation curves of the diffuser under different open states were tested at the corresponding heights. Schematic of measuring locations arrangement: (a) velocity attenuation tests; (b) indoor environmental parameters test and (c) pictures of the measuring devices.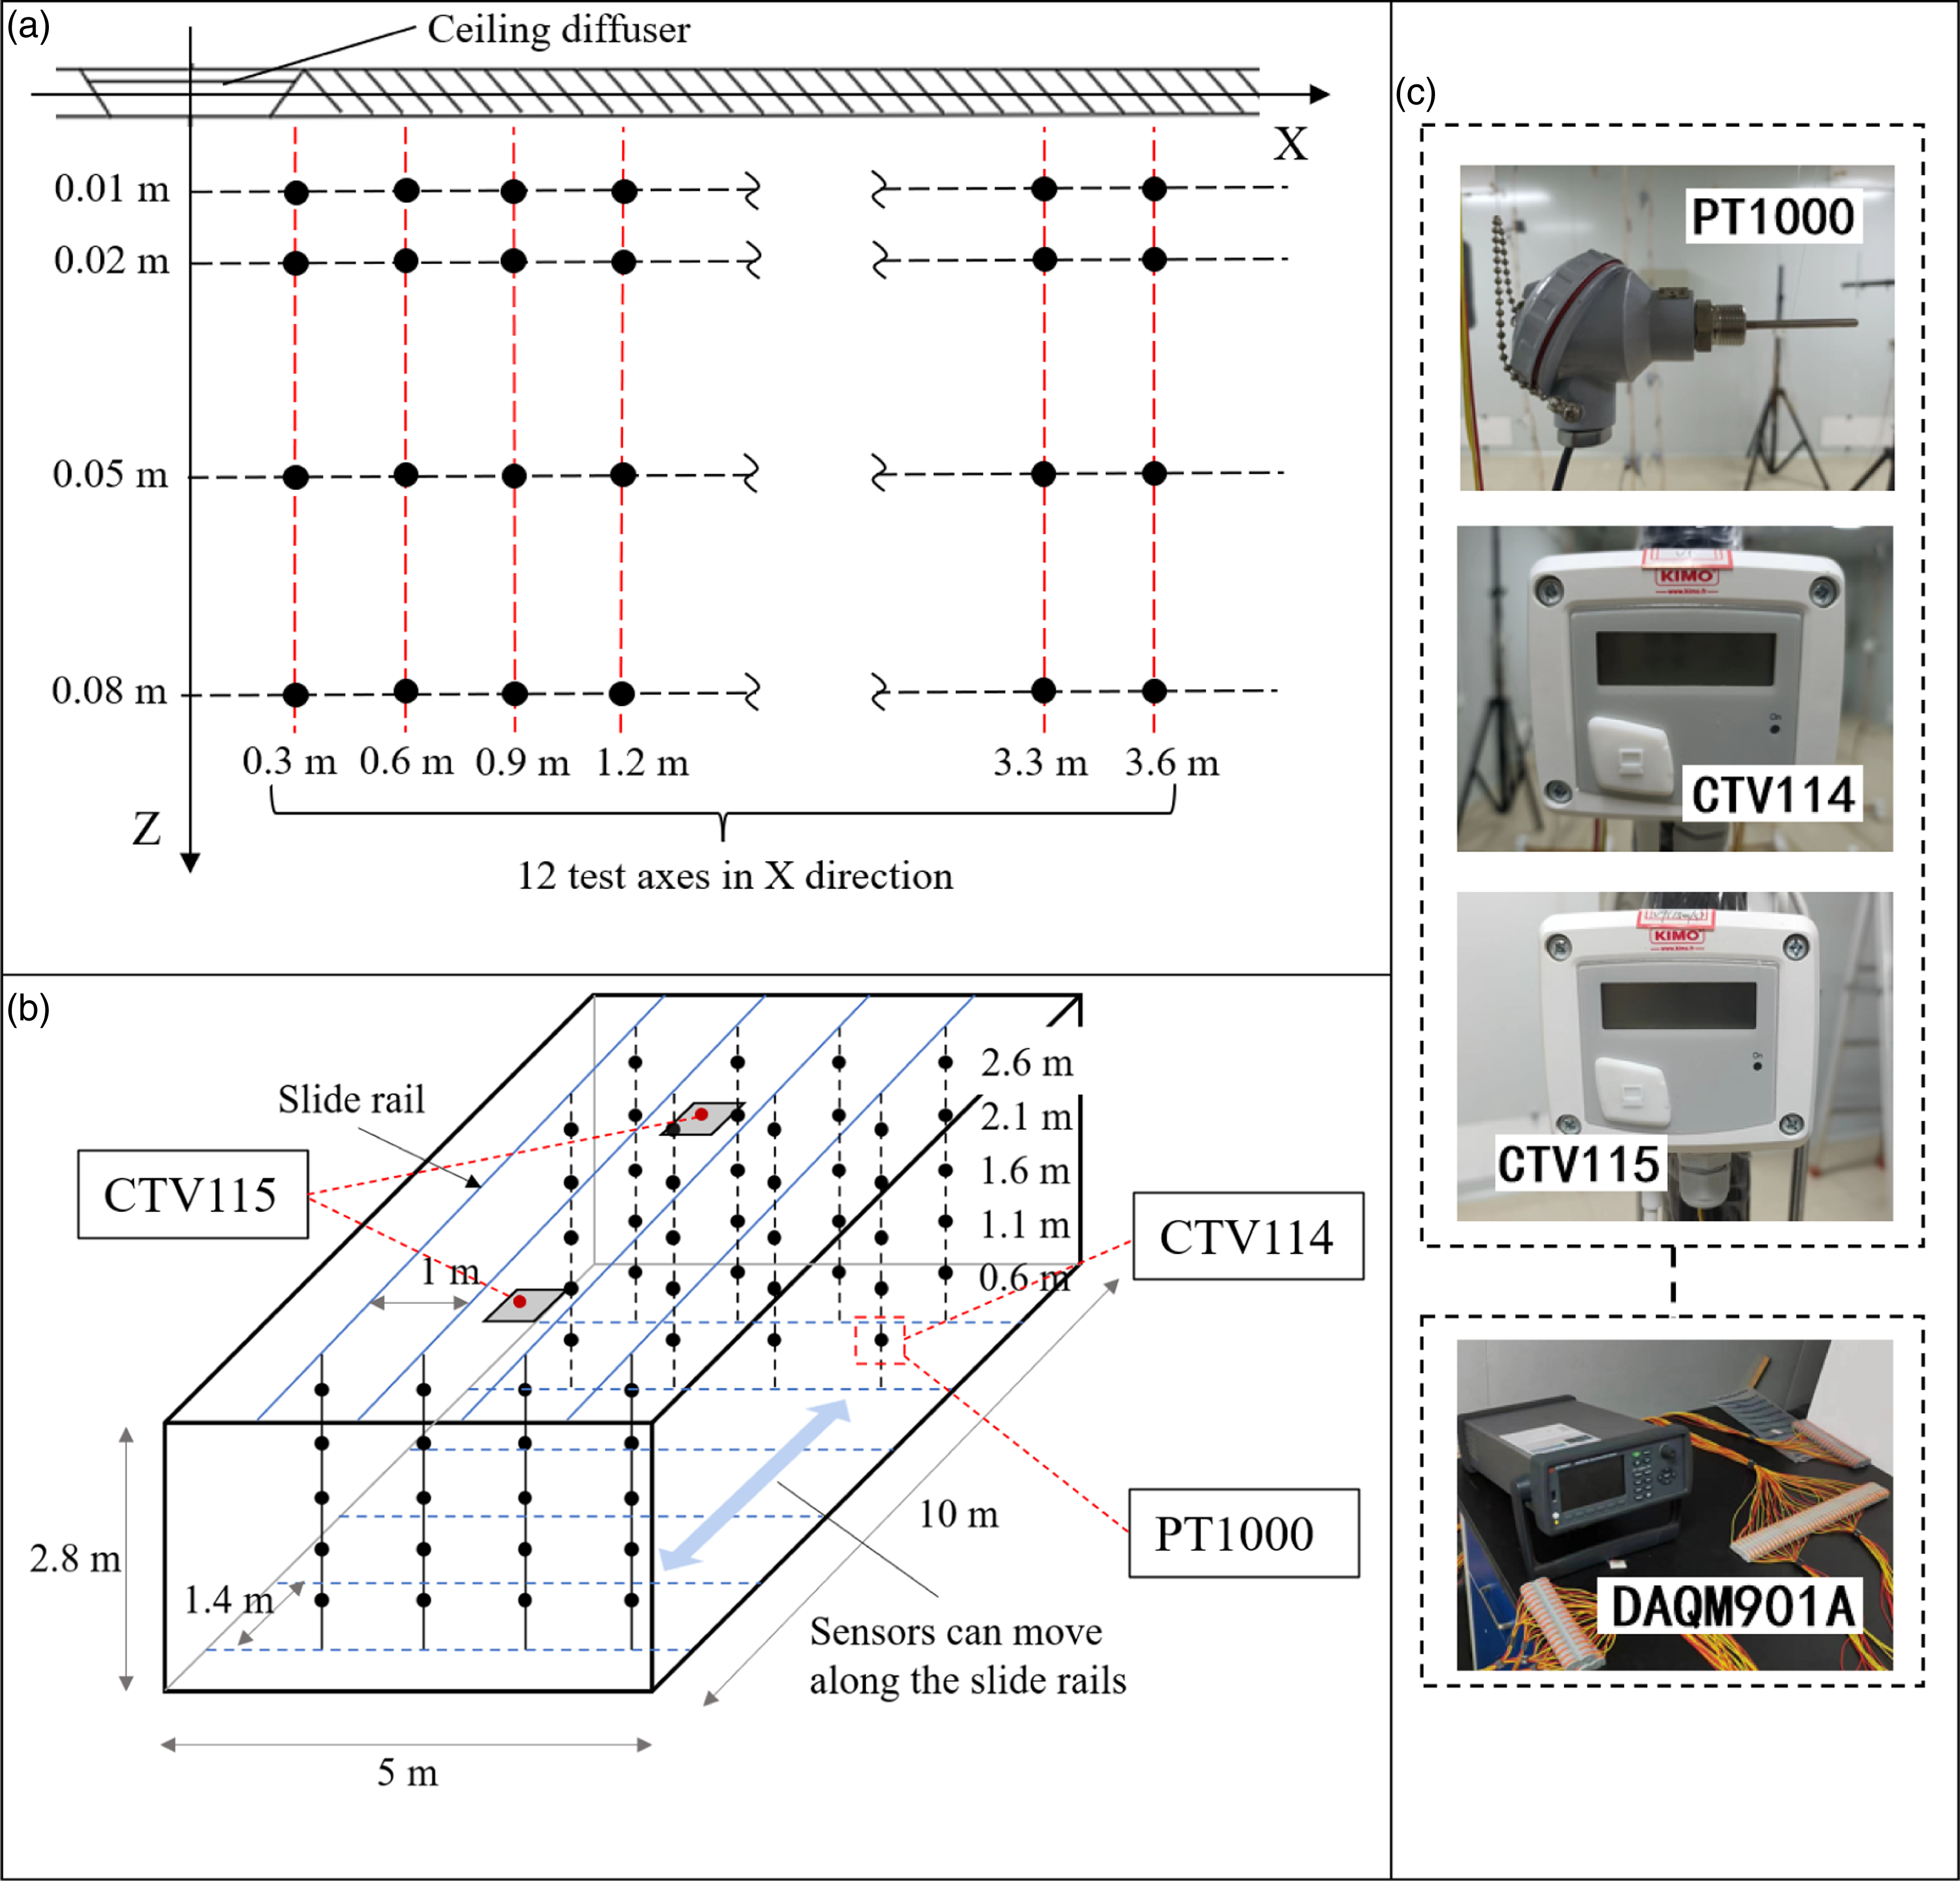
(2) Indoor environmental parameters tests
As shown in Figure 5, experiments for office conditions were conducted in the thermal chamber. The electric blanket was used to represent the heat dissipation from the external windows.
35
Printers and laptops were replaced by heat-controlled radiators and heating panels, respectively. The heat dissipation of personnel was undertaken by the heating pad with a controllable opening state. Heat source arrangement in thermal chamber.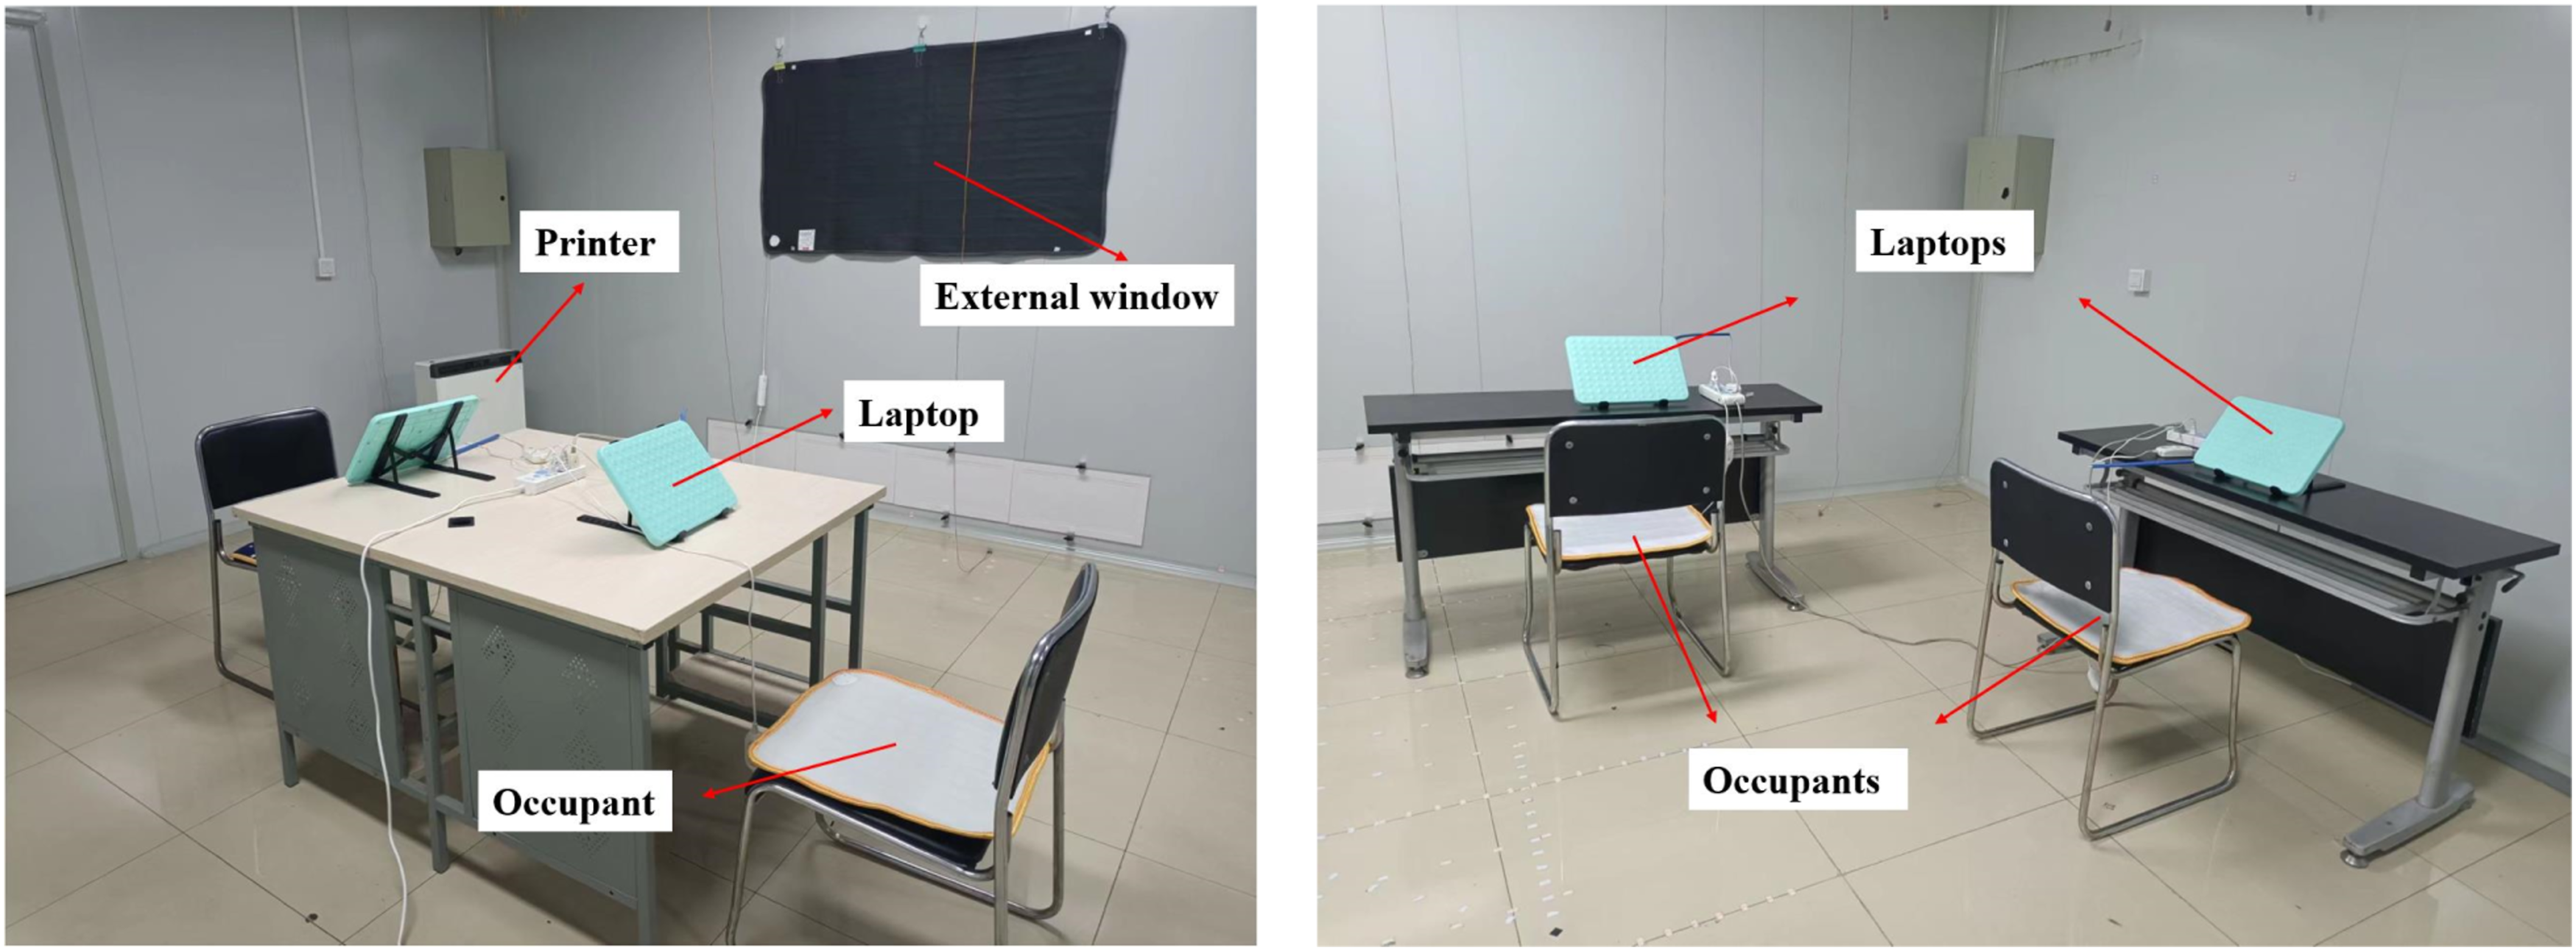
In the indoor environmental parameters’ tests, air temperature and velocity were measured. Each test condition of the thermal chamber was set in the previous evening. A data acquisition device (DAQM901A) was used to collect and monitor signals from different sensors. The thermal parameters were guaranteed to be stable for two hours before the test. After adjusting the sensor position each time, the next reading was performed after a 5-min interval to ensure the stabilization of sensor readings. 36 The data were read every 2°s and recorded continuously for 3°min, and the average value was taken as the final result. 20
Five temperature transducers were installed on the same vertical axis at heights of 0.6 m (sitting person, lower back level), 1.1 m (sitting person, head level), 1.6 m (standing person, head level), 2.1 m (upper space level 1) and 2.6 m (upper space level 2) as is shown in Figure 4(b), which represent the heights of different parts of the human body and the upper space of the room, respectively. Four sets of temperature transducers were arranged in the thermal chamber, and the position was controlled by moving the slide rail. There were 24 sampling axes in the room, evenly arranged along the slide rail direction, with a total of 120 sampling points.
Computational fluid dynamics (CFD) simulation
CFD prediction is an effective tool for spatial flow field analysis.37,38 In this paper, the airflow simulation of the diffuser was performed in the FLUENT program and the RNG k-ε turbulence model was used to describe the air jet.21,39 The SIMPLE algorithm was used to couple pressure and velocity.
The complex geometry of the diffuser created great difficulties for CFD model establishment and computer operations. 40 This study adopted the local definition method to establish the diffuser model. The velocity boundary condition was adopted for the air supply inlet. The outflow state of the diffuser was defined by the horizontal and vertical velocities in different areas. This method can be well adapted to the boundary condition settings of different sub-tuyere opening states and simplify the modelling process. 41 The air outlet has little effect on the indoor airflow distribution, which provided a pressure outlet for exhausting air.
The turbulence intensity of the initial jet has an effect on the airflow distribution, which is related to the characteristics of the diffuser.
42
In the velocity attenuation tests, the velocity and turbulent intensity (Tu) (as shown in equation (10)) of the diffuser were determined to achieve an accurate setting of the inlet boundary conditions.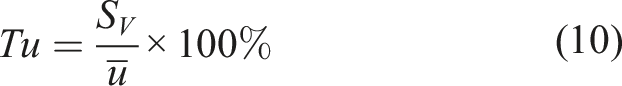
Boundary conditions in the model.
The quality of the mesh division determines the convergence of the calculation and the accuracy of the simulation.
43
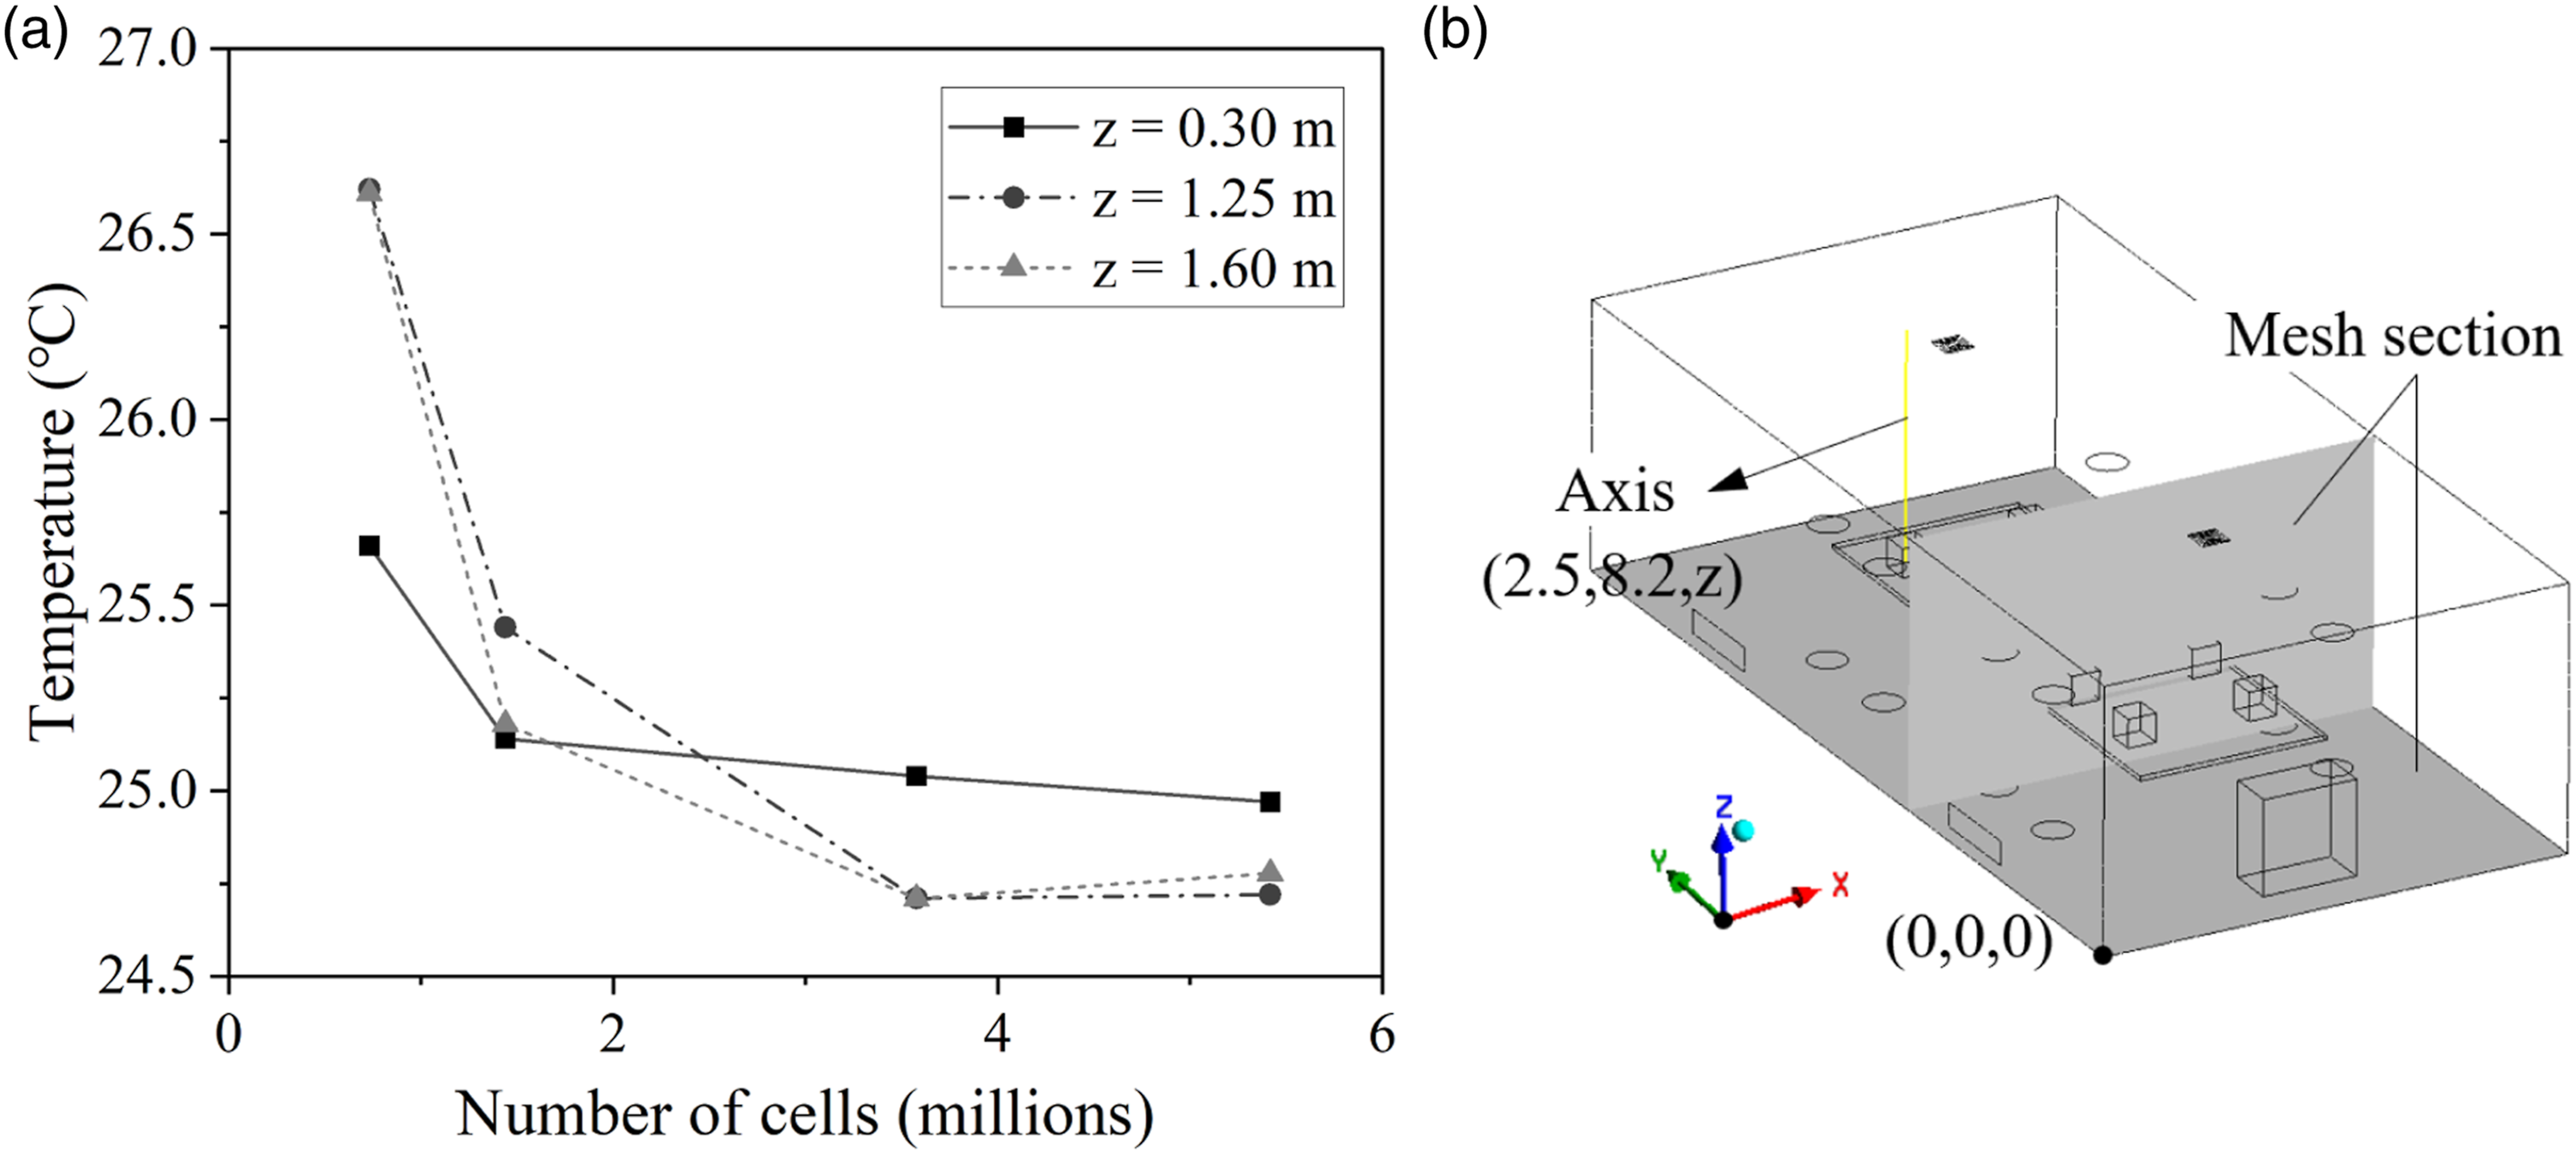
Unstructured tetrahedral cells were used to discretize the computational domain (Figure 6). The corresponding position of the mesh section is shown in Figure 7(b). The jet of ceiling diffuser would attach to the wall due to the Coanda effect, and the inflation mesh was set near the conference ceiling. In addition, the surface grid of the diffuser and the volume grid near the heat source were locally densified. Analyses were performed with four different tetrahedral mesh sizes (732026, 1438716, 3577393 and 5417328). The temperature in a typical axis was chosen as a parameter for the test (Figure 7). Results were observed to be unchanged more than 3577393 elements, but this could increase the computational cost. Therefore, the grid number of the conference room was set to 3577393. Sample of generated mesh: (a) bottom view of the mesh and (b) section view of the mesh. Grid independence test: (a) temperature distribution comparison between four meshes and (b) position of the selected axis and mesh sections.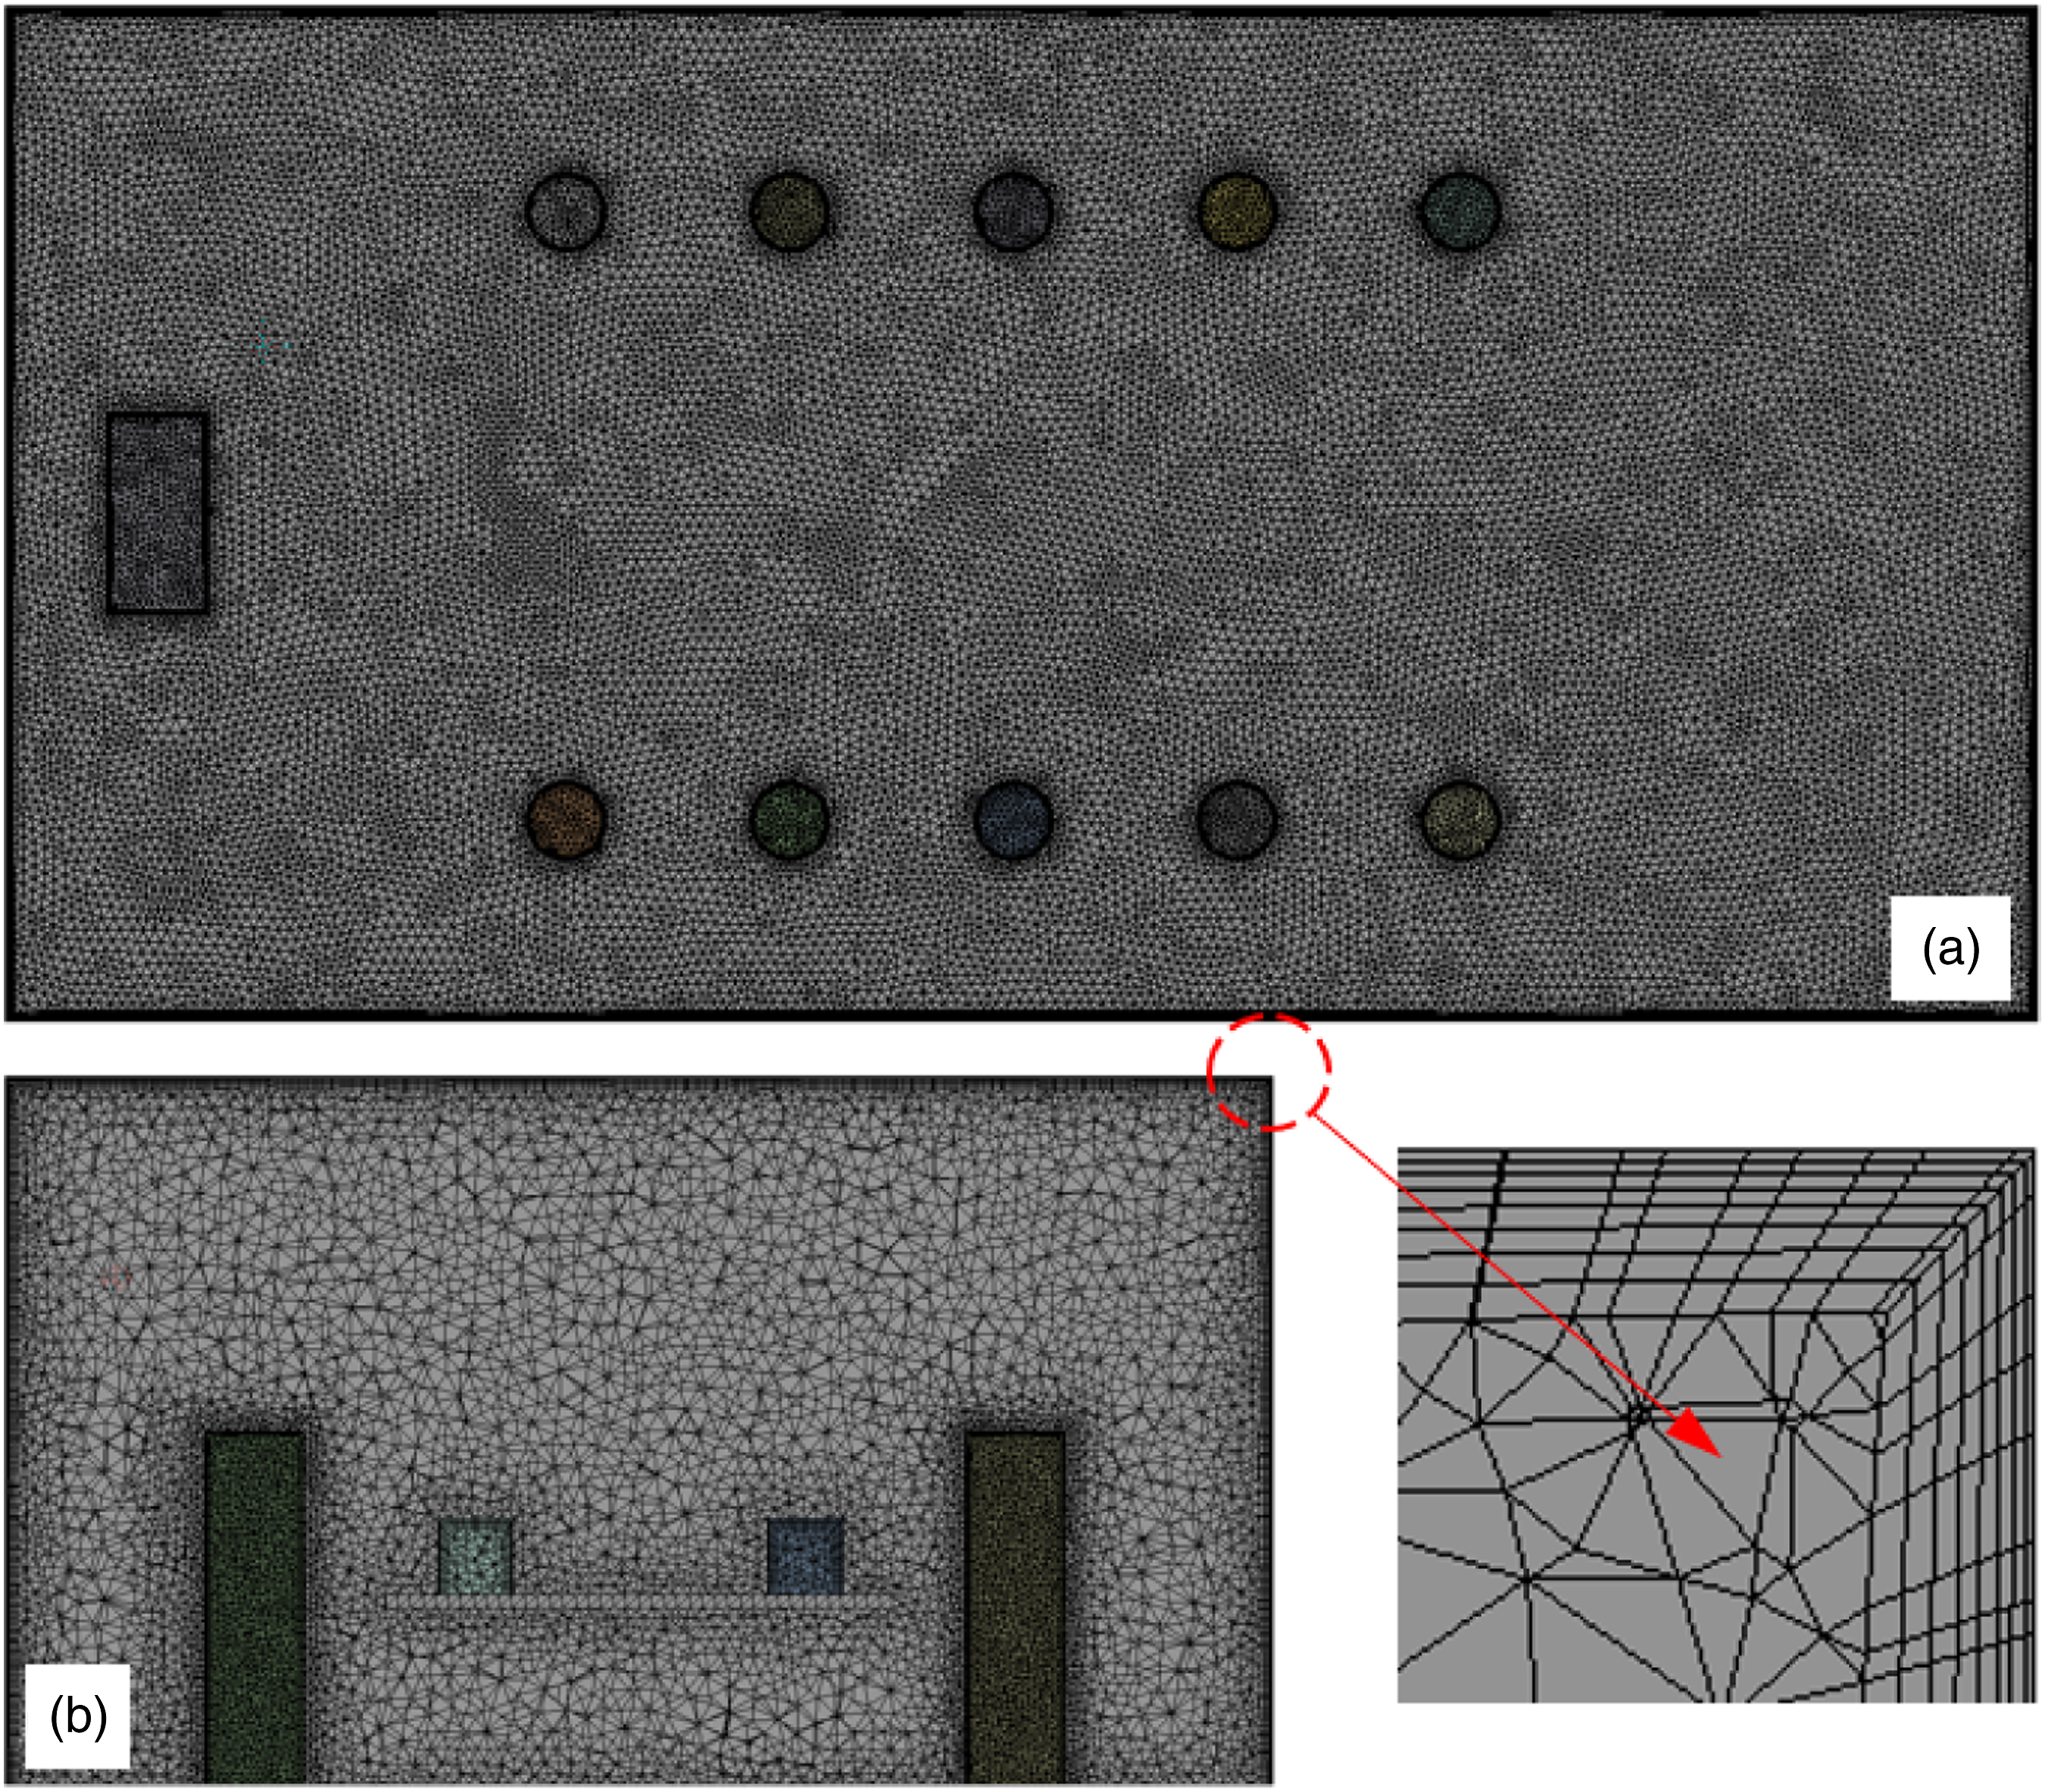
Evaluation criteria
Healthy and comfortable environment is an essential factor for personnel productivity.
44
To compare different control methods, this study evaluated the airflow organization using the following indicators: 1. Temperature distribution; 2. Velocity distribution; 3. Effective Draught Temperature (EDT); 4. Air Diffusion Performance Index (ADPI); 5. Ventilation efficiency.
The velocity and temperature distribution were obtained directly from the measured (or simulated) data at each point. The 
Ventilation efficiency 
Results
The results are organized as follows: (a) Validation of the numerical model in this study, (b) experimental results of airflow characteristics, including the determination of
Validation
The validation model used in this study is the office design scenario in Table 1. Figure 8(a) shows the experimental and simulated values of jet velocity at L1 position. The two are in good agreement in most positions, while the simulated value is relatively low in a position close to the diffuser (50% lower than the experimental value). This may be due to the inaccurate modelling of the experimental boundary condition at the simulation inlet.
48
Since the area near the diffuser was not the focus of this study, this deviation was ignored. Figure 8(b) shows the temperature distribution of L2 and L3, which indicates that the experiment agrees well with the simulation. The simulation method (turbulence model, mesh density and tuyere modelling) described in this paper can be considered reasonable. Comparison of simulated and experimental values: (a) velocity distribution of the horizontal line L1 at different air volumes (all sub-tuyeres open); (b) temperature distribution of vertical lines L2 and L3 and (c) the position of the selected lines.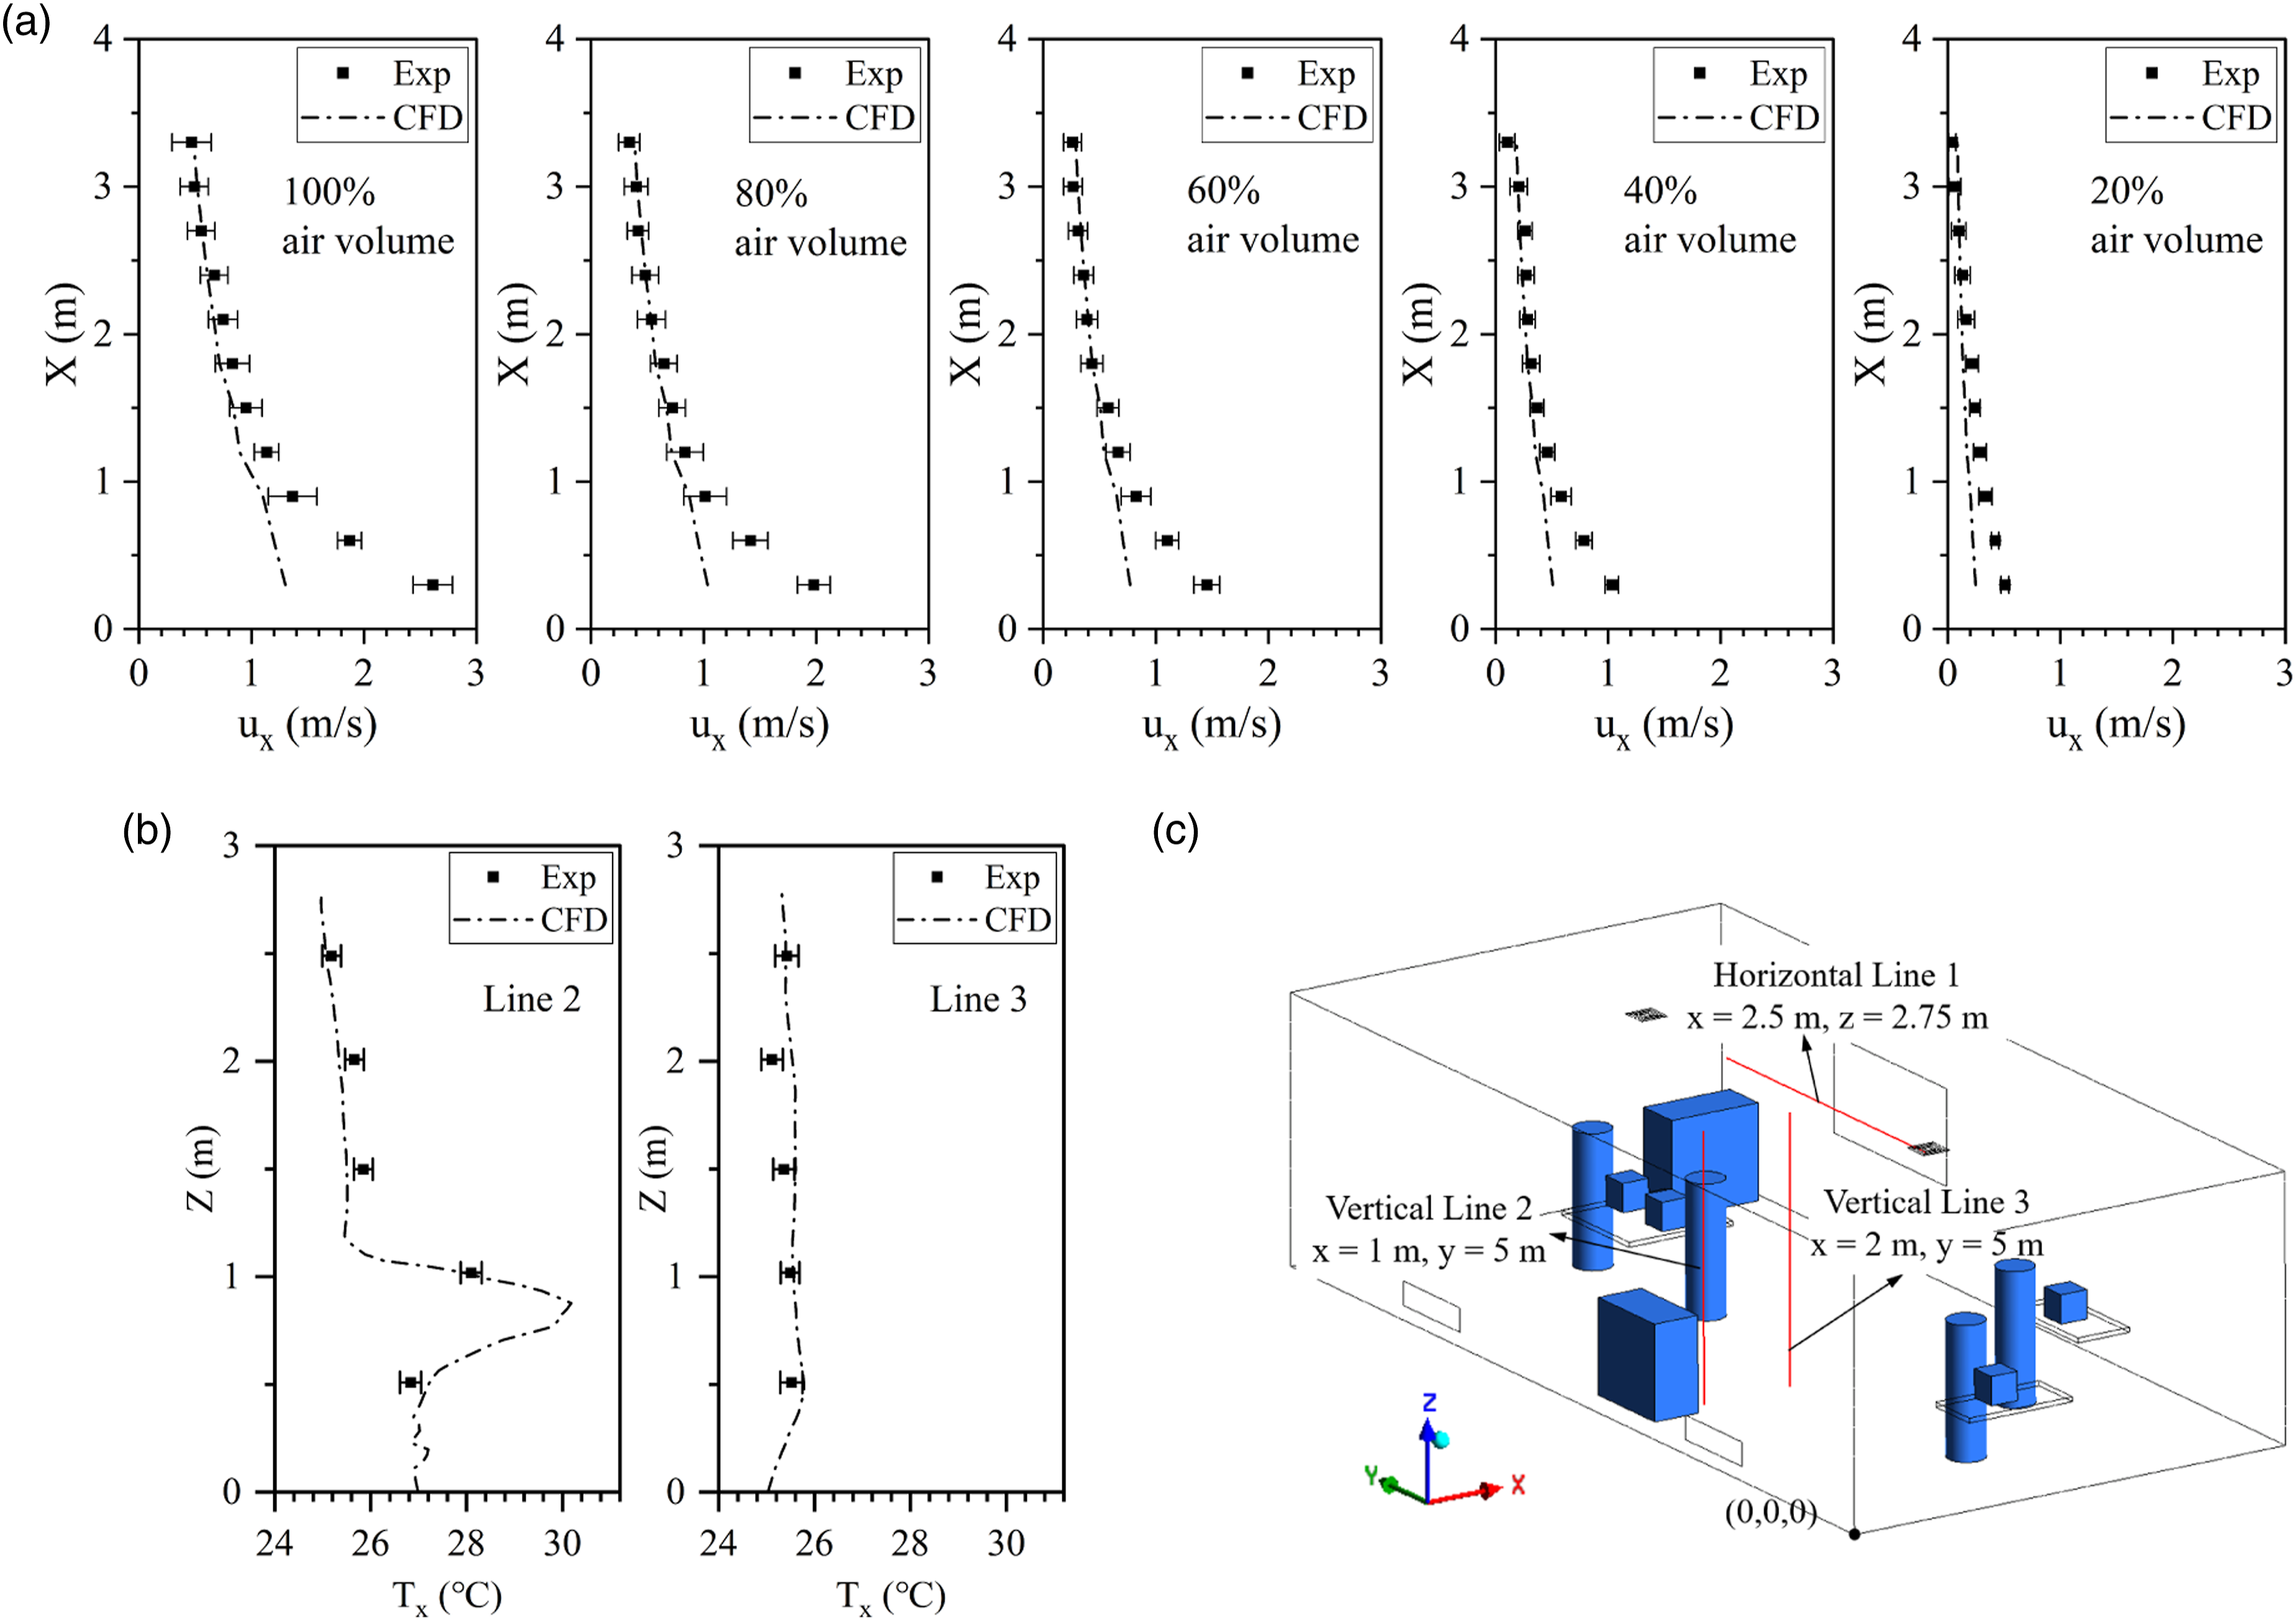
Jet characteristics
The experiments were carried out under isothermal conditions without arranging heat sources in the room. The design air volume was 328 m³/h. A single diffuser was tested in the thermal chamber by controlling the damper.
(1) Axis position
The experiment was conducted at the measurement points shown in Figure 4(a) to find the axis of the jet. The order of velocity at different heights is Velocity attenuation curves at different distances from the ceiling.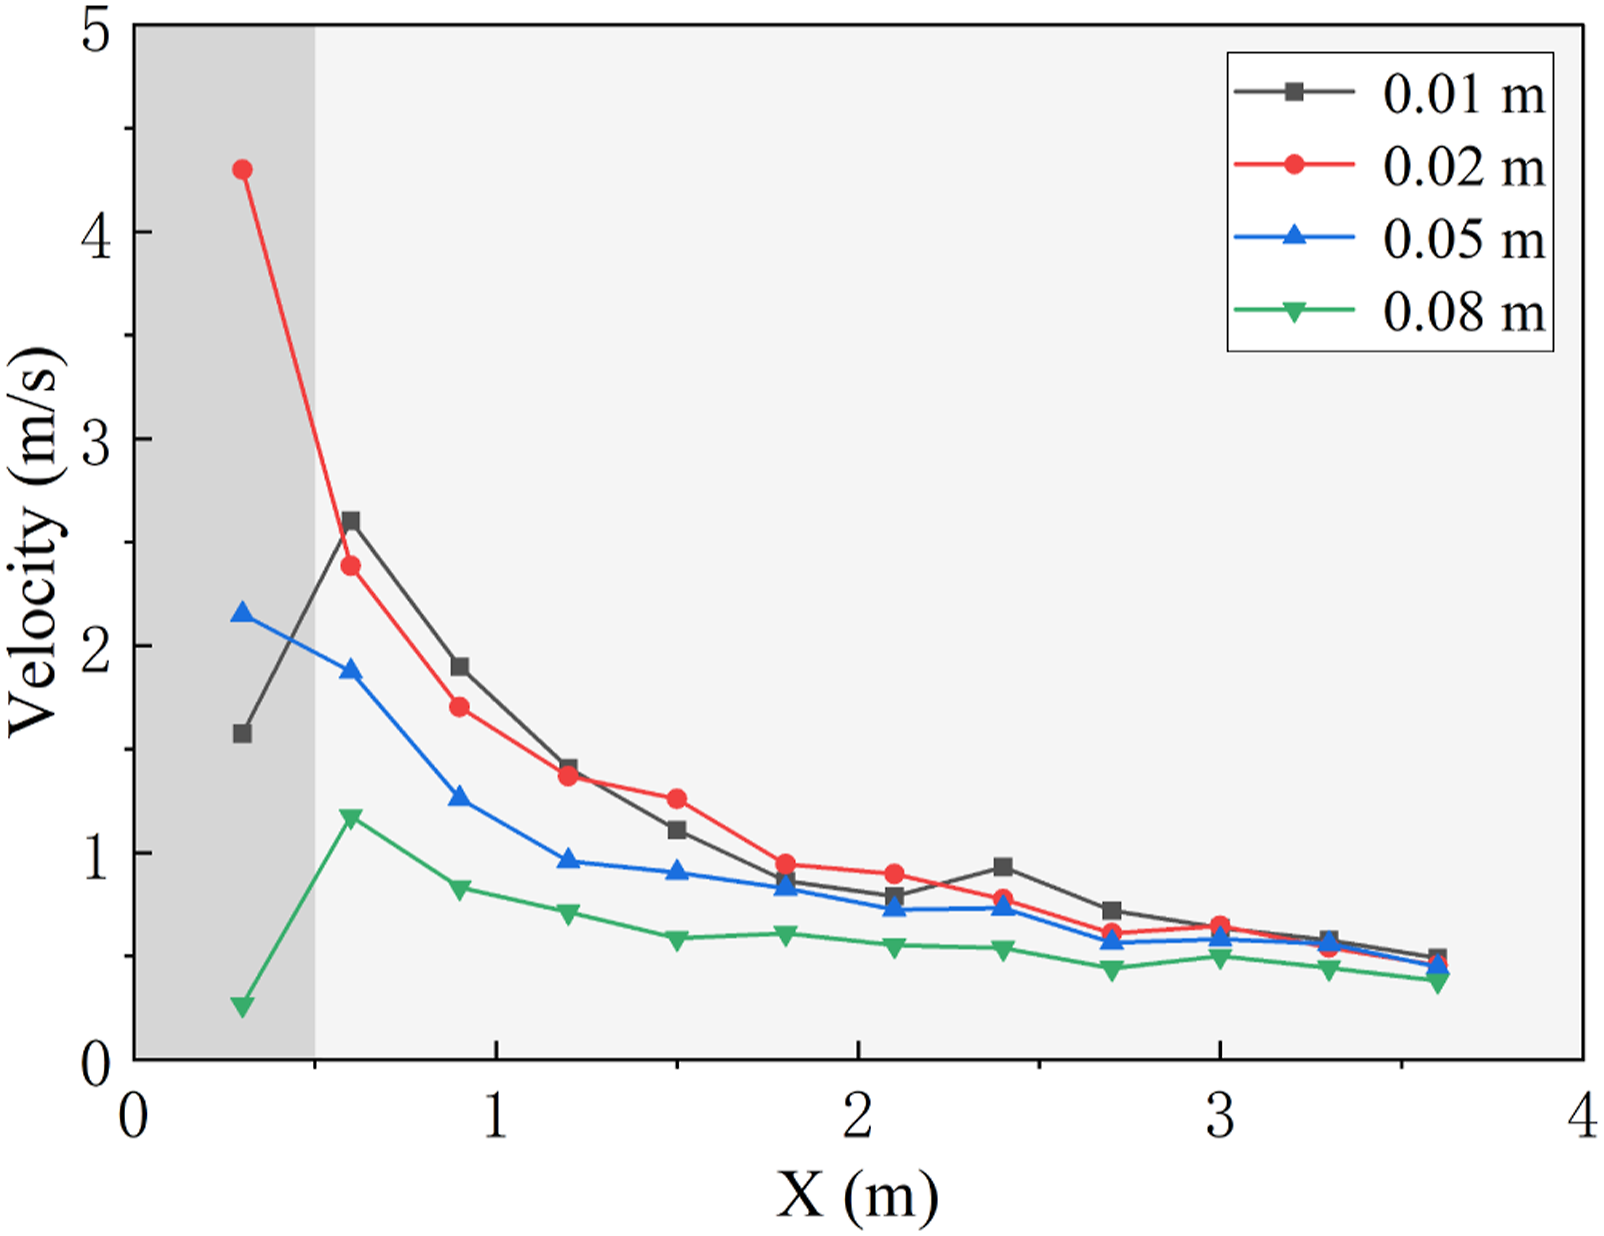
The velocity distribution at point 1 was different from others. This was because the position was in the free jet zone, there was a bend in the jet axis and a low-pressure air area. Velocity decayed regularly after point 2. The airflow was assumed to enter the adherent jet zone. From equation (7), the velocity decay coefficient
(2) Velocity attenuation
To consider the diffusion ability of the diffuser under different opening conditions, the velocity attenuation tests were conducted for all possible states involved in the diffuser operation. Each sub-tuyere corresponds to two states of ‘open’ and ‘closed’. There were 15 operating states of the diffuser, as shown in Figure 1, without considering the case where all sub-tuyeres were closed. These states included cases where the sub-tuyeres were fully open (ABCD), three sub-tuyeres were open (BCD, ACD, ABD, ABD, ABC), two sub-vents were open (AC, AB, AD, BC, BD, CD) and a single sub-tuyere was open independently (A, B, C, D). The dimensionless velocity Velocity curves of different opening states of sub-tuyeres.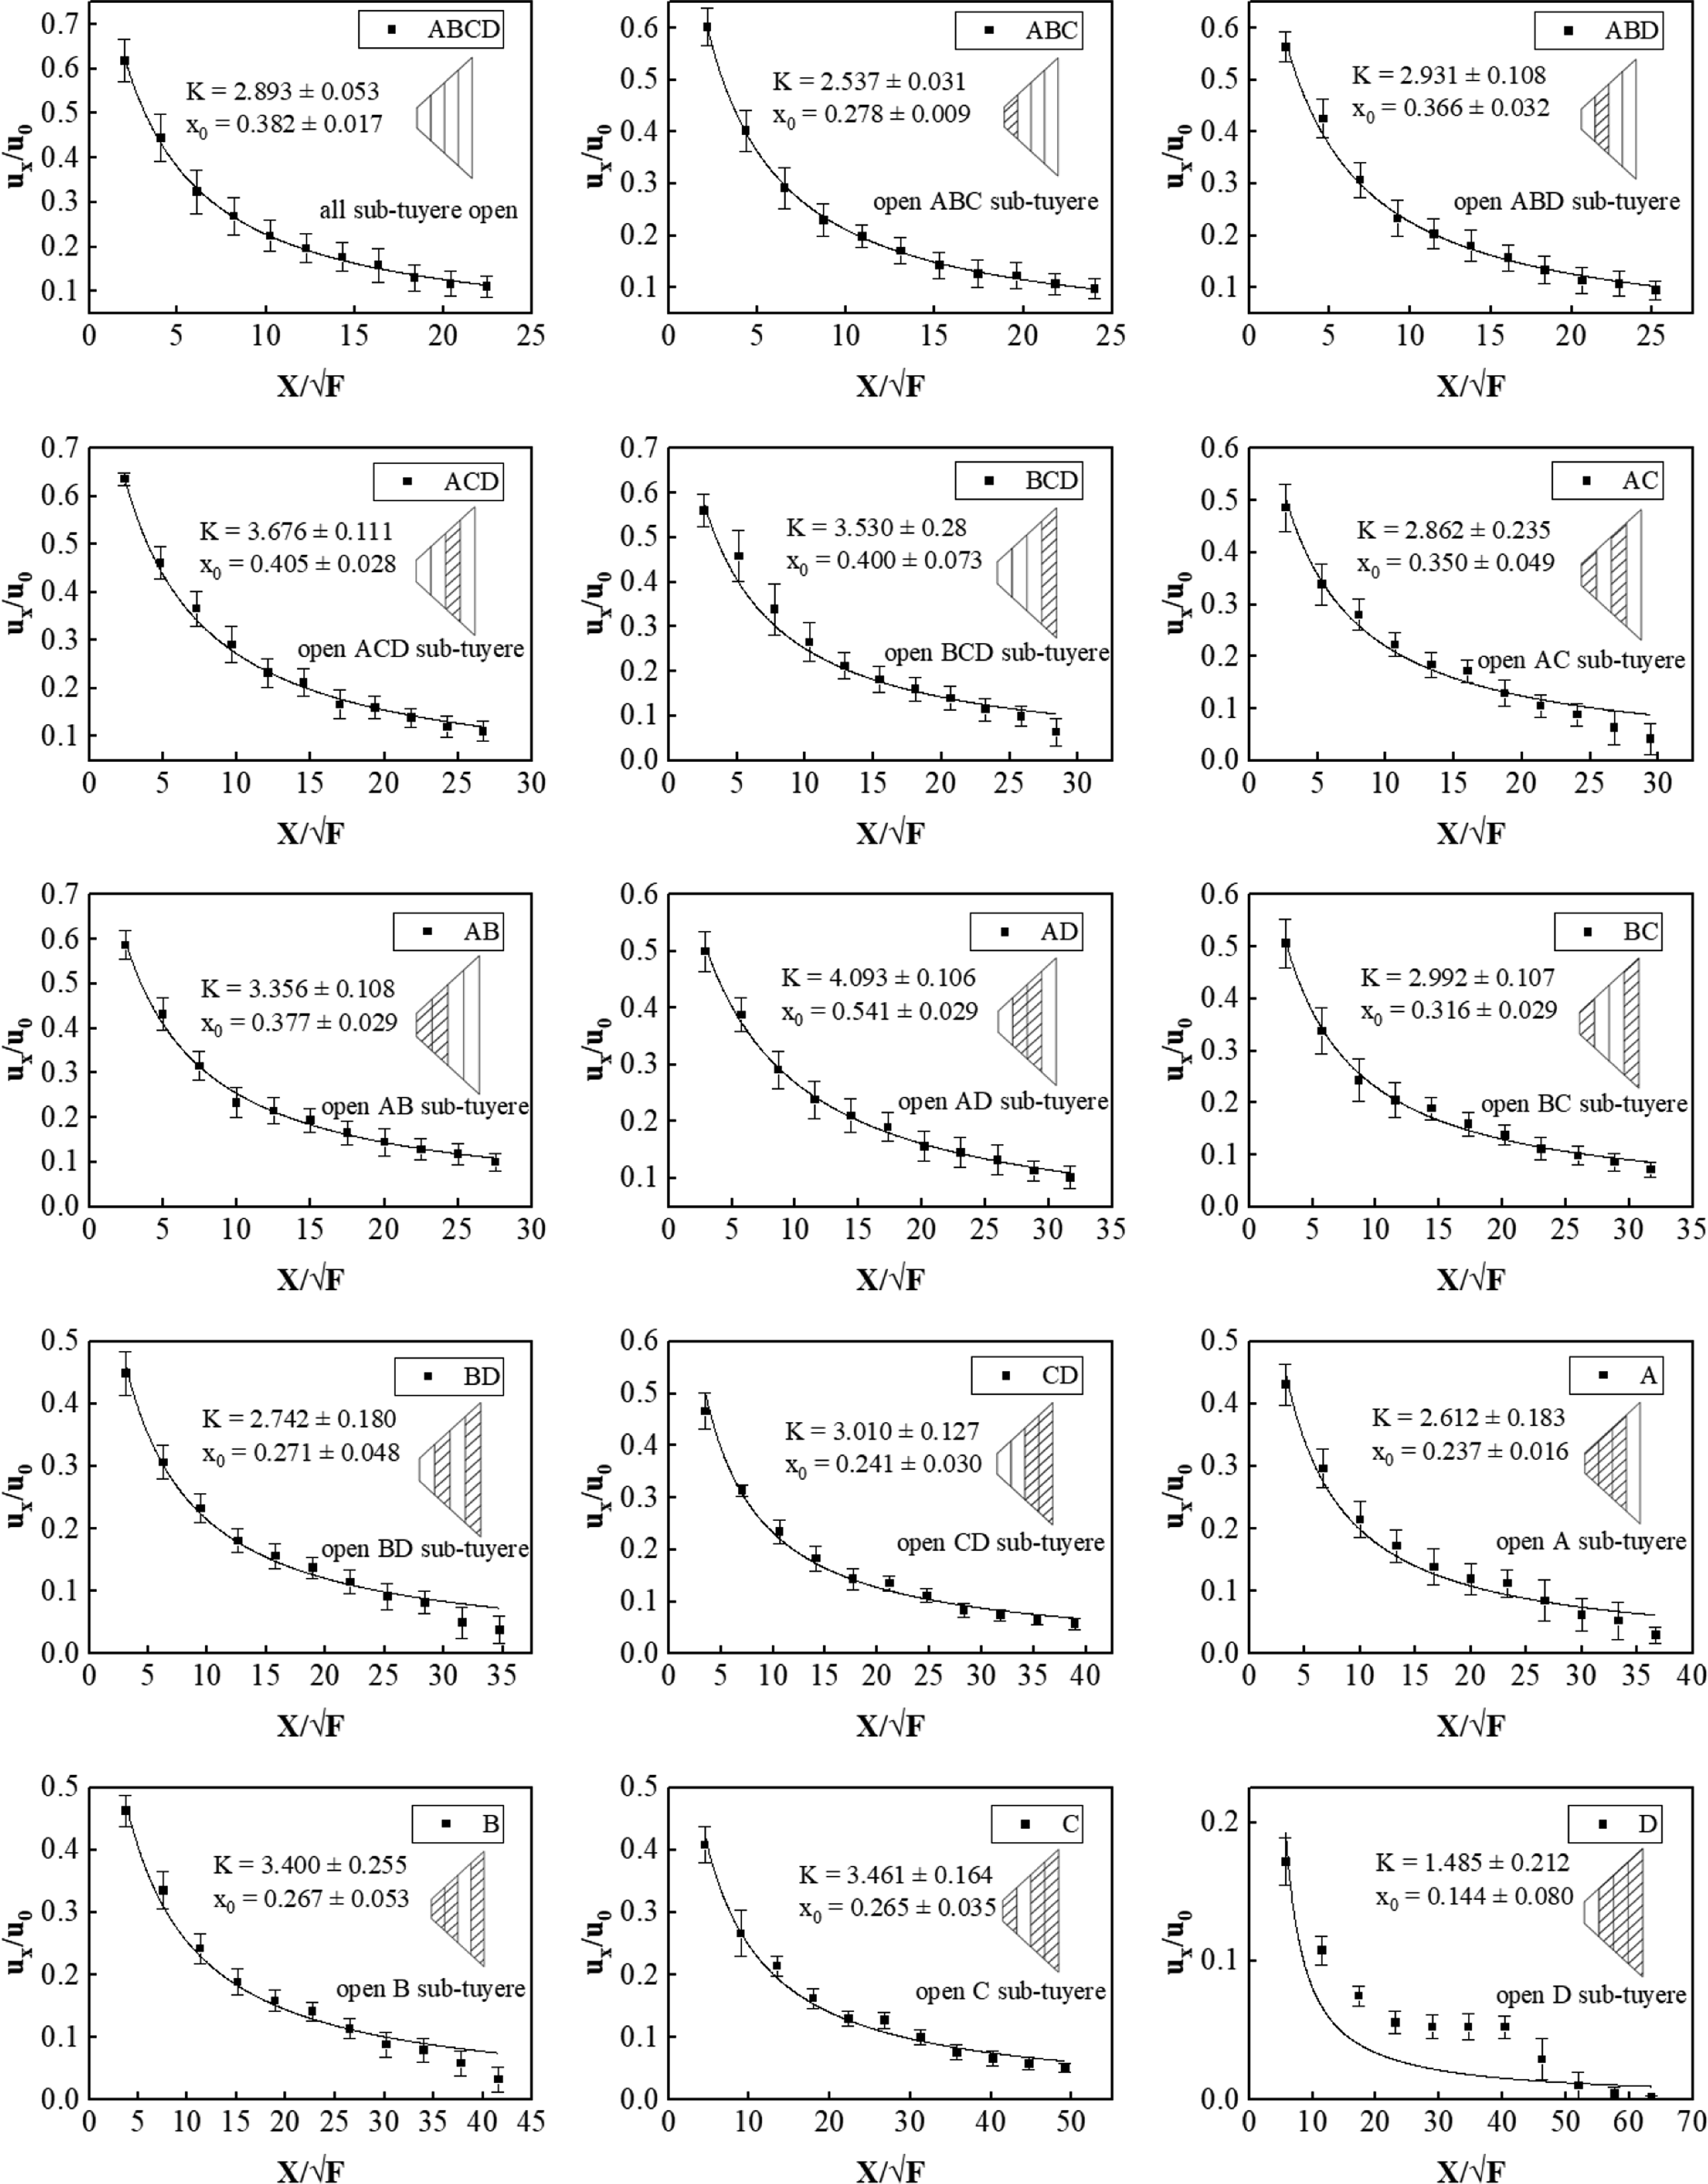
Figure 11 summarizes the velocity attenuation coefficient Velocity attenuation coefficient 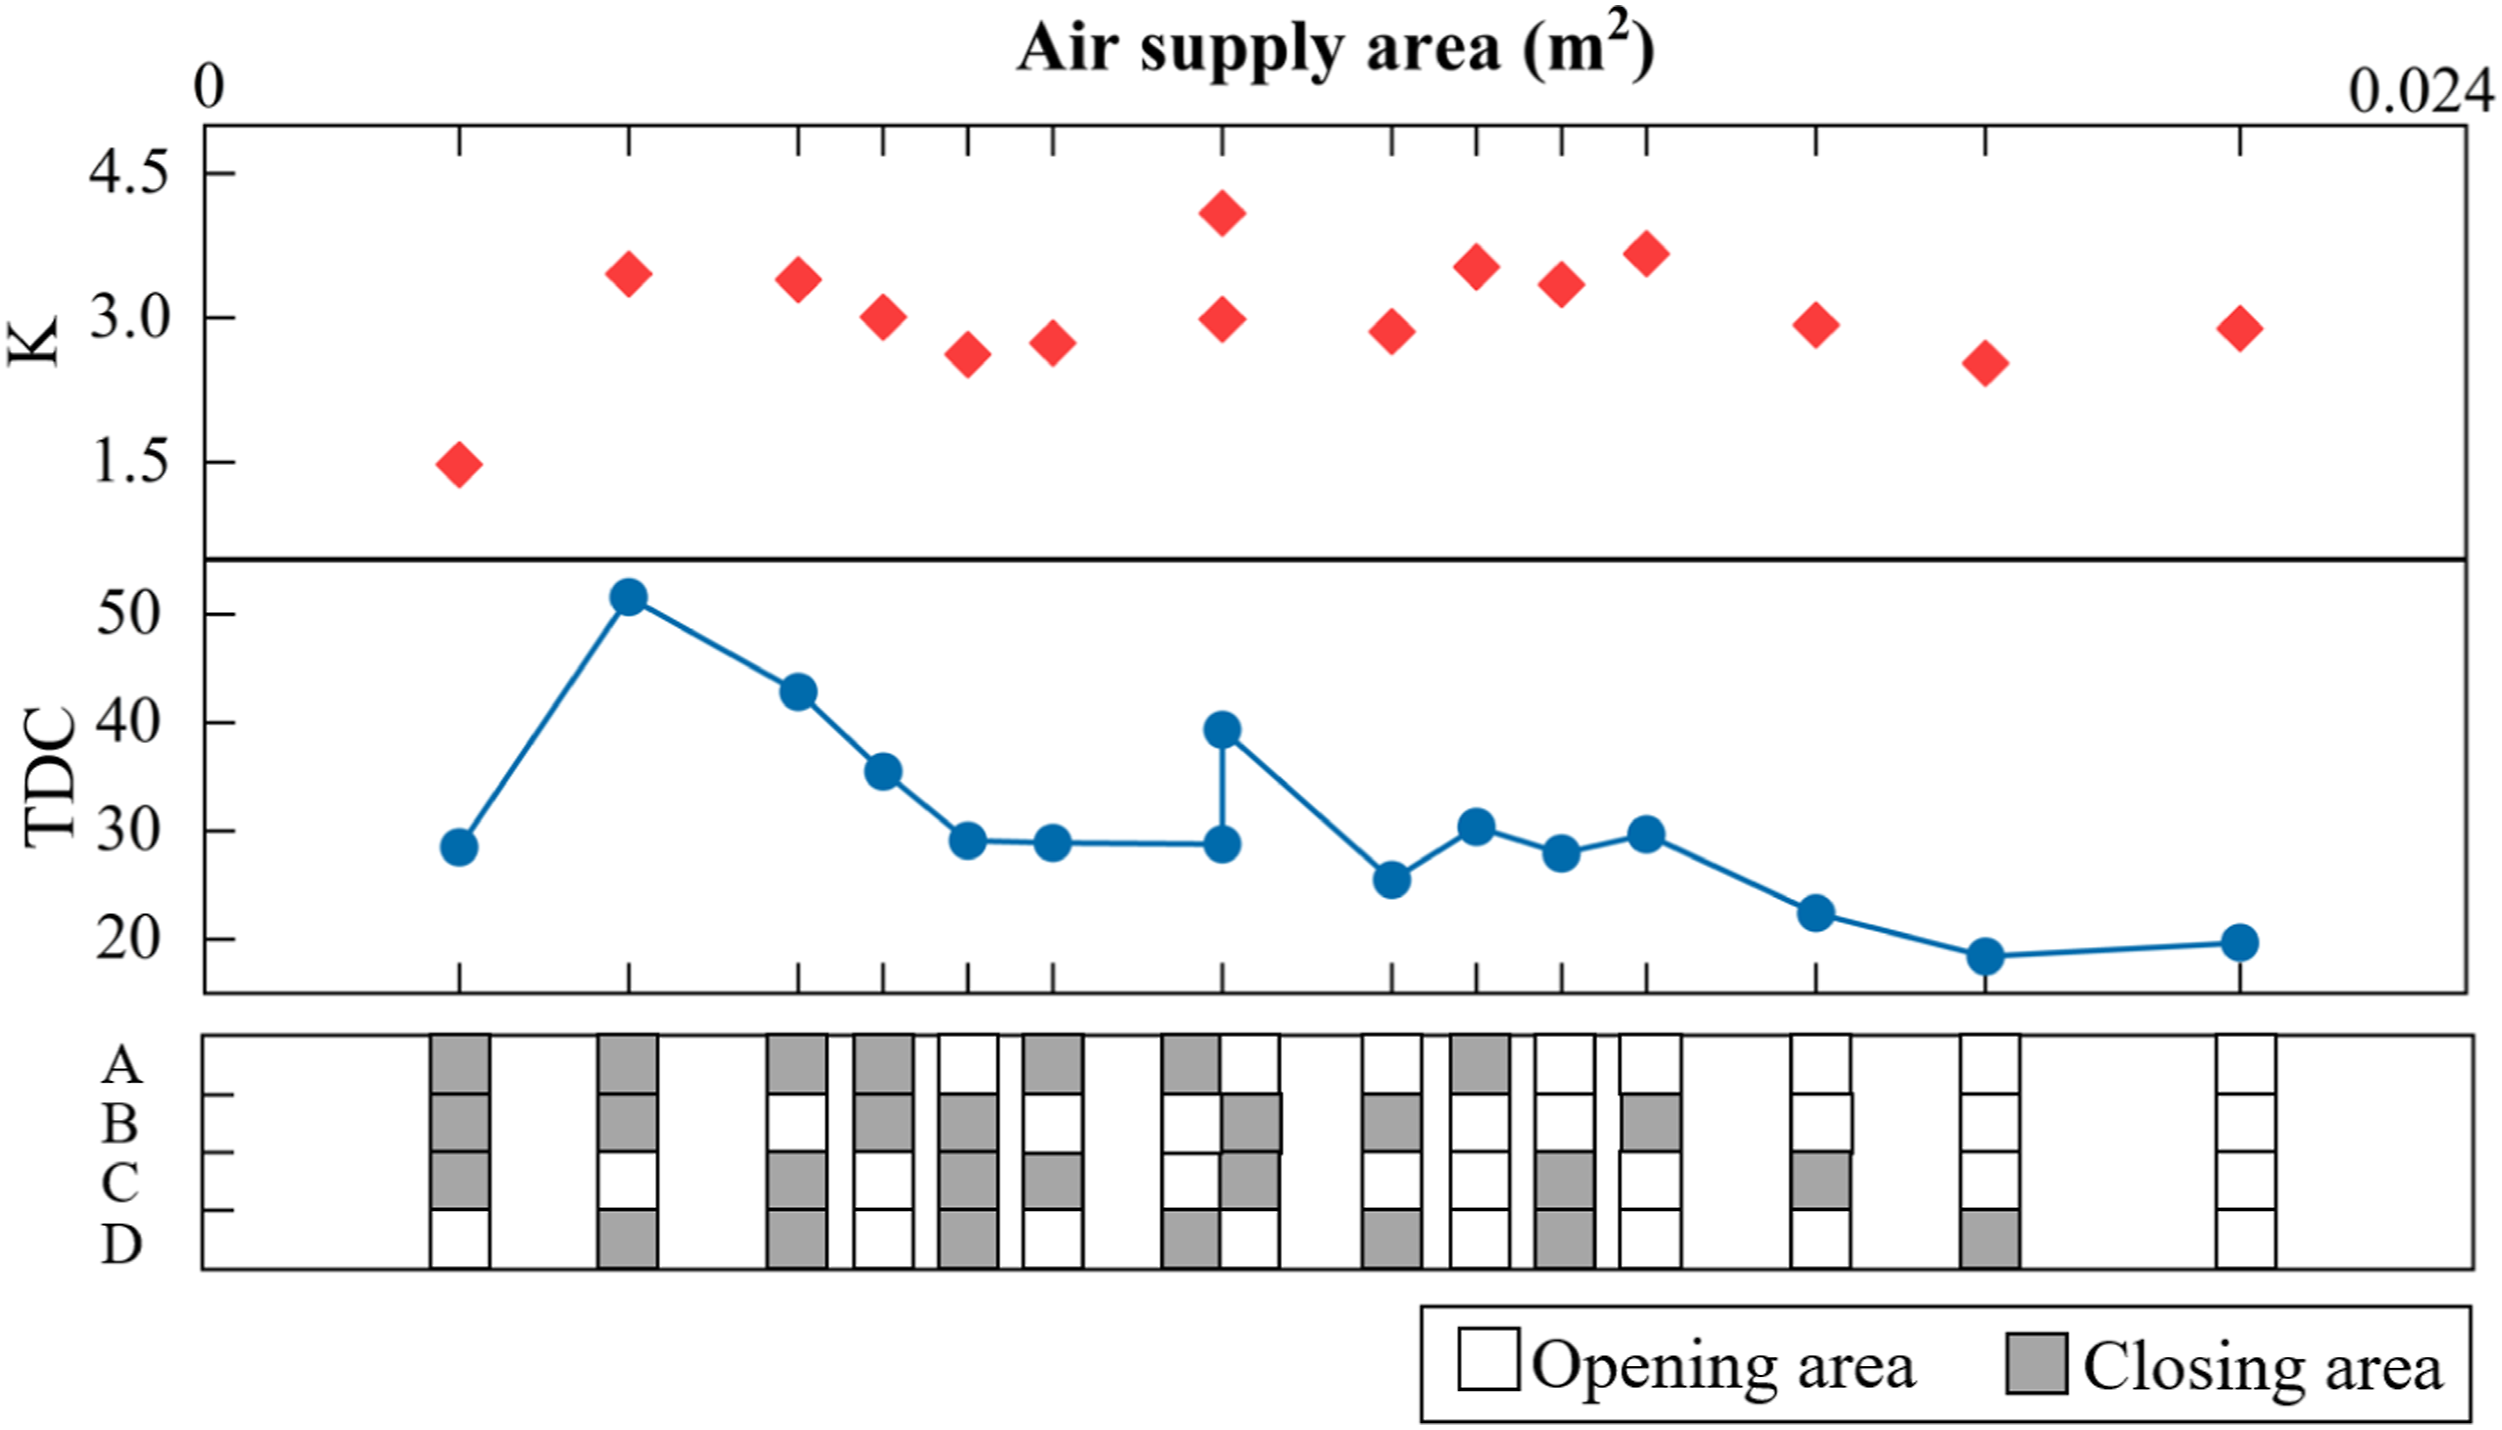
Proposal of CMT
The purpose of this section is to propose CMT and verify its feasibility, including the comparison of airflow jet throw and velocity contour. The CFD simulation process in this section does not involve heat transfer and there is no indoor heat source arrangement. The modelling is similar to Figure 2(c)-S2 and is not described in detail here. The air inlet and outlet were set as velocity inlet and pressure outlet, respectively. The turbulence density was calculated using equation (10).
(1) Jet throw evaluation
The opening sequence of sub-tuyere based on CMV.
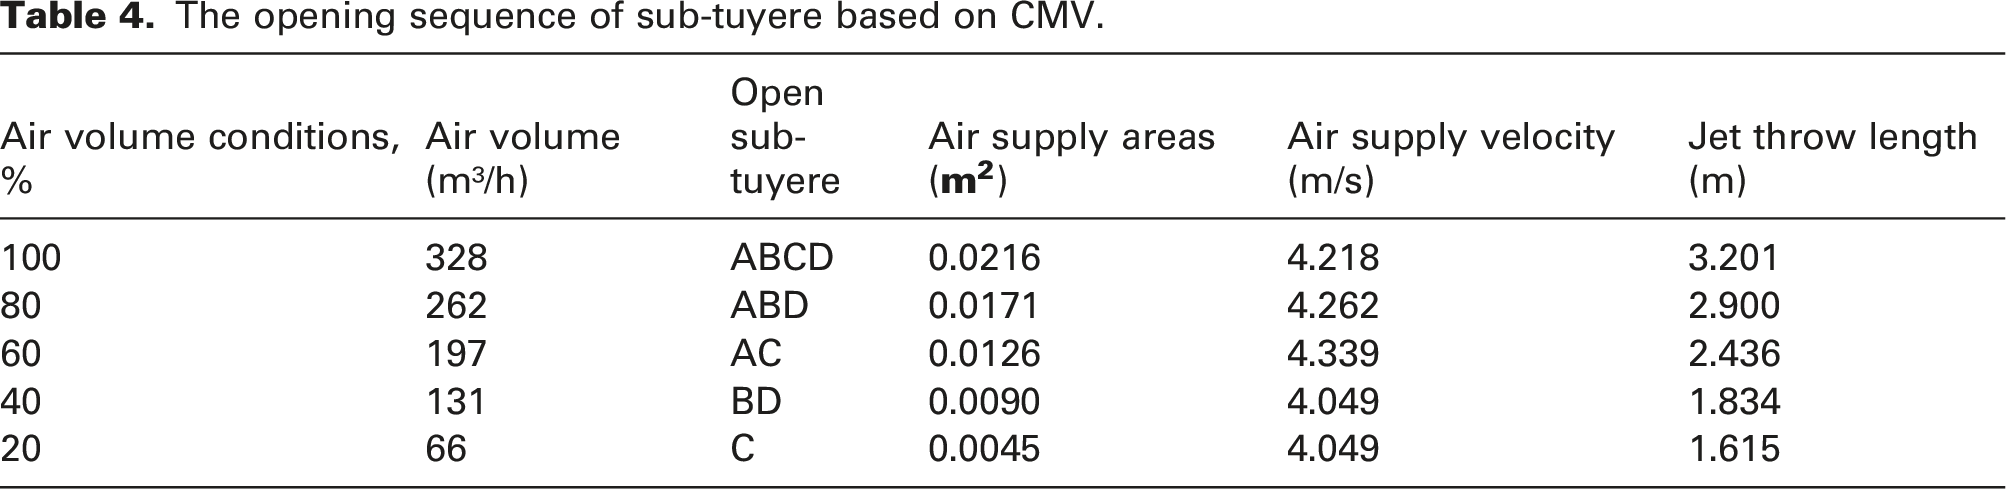
Equation (8) was used to calculate the range of throw length variation for each sub-tuyere opening condition. Figure 12 shows each working condition was divided into four ranges according to five air volumes. The red line represents the position of the rated distance 3.2 m. The points on the left/right side of it represent conditions that the jet throw length is less/greater than the set value. Variation of jet throw length with air volume for different sub-tuyere combinations.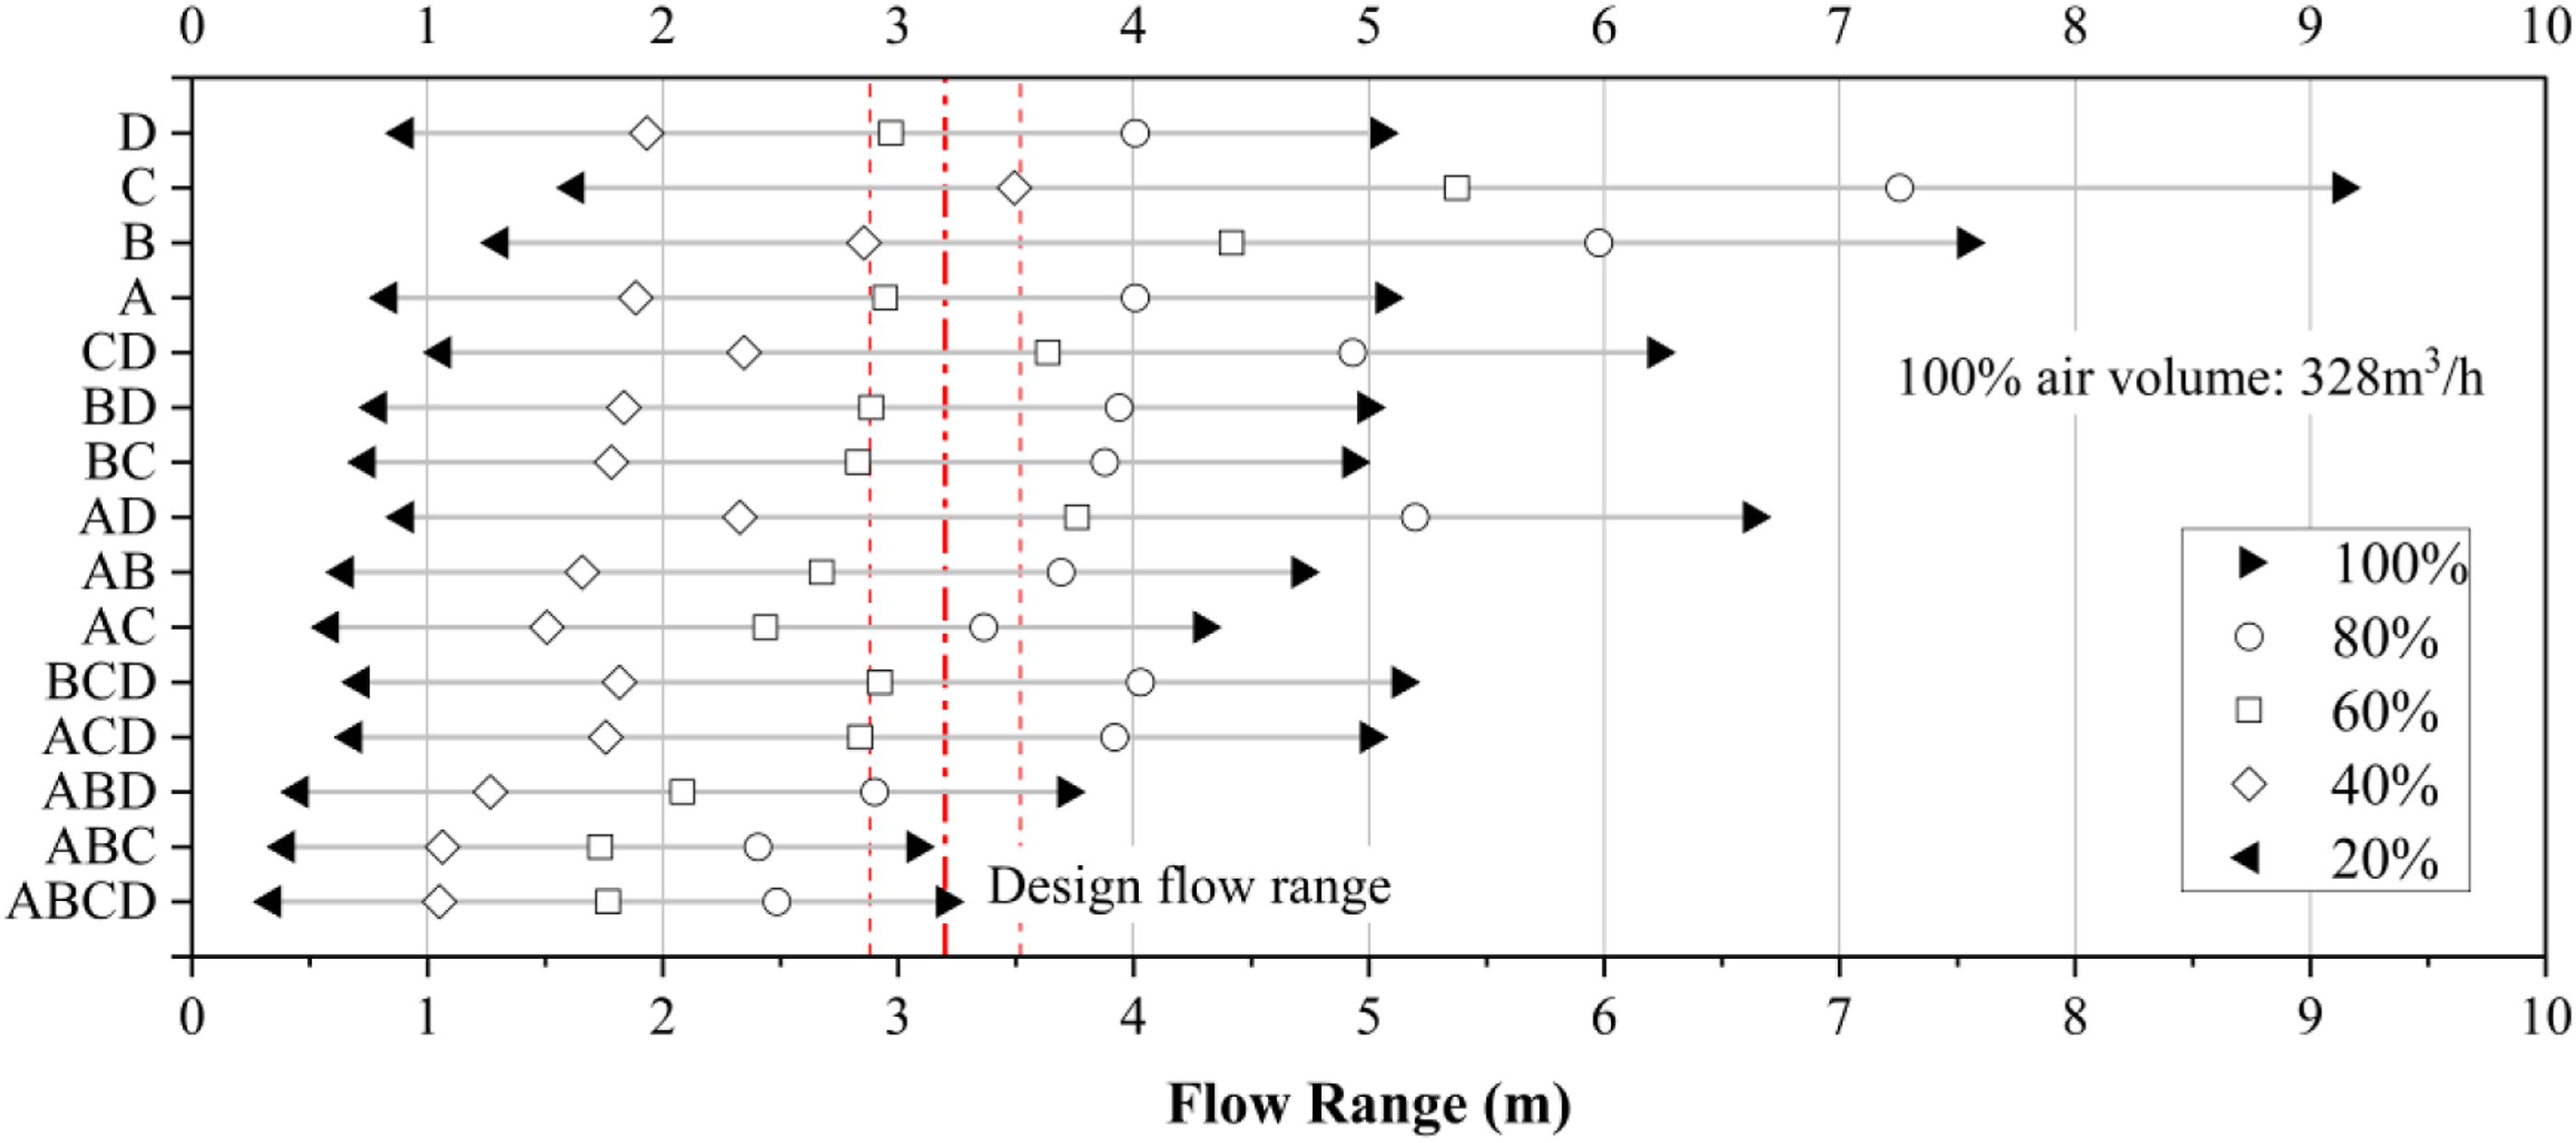
This paper defined the state points within 10% error range of the set value to meet the design requirements. The area of the sub-tuyere to be opened for different air volumes was selected as shown in Figure 12. When the air supply volume fell to 80%, the combination of ABD or AC sub-tuyere could ensure that the airflow range was maintained at about 3.2 m. When the air supply volume continued to fall to 60%, the combination of BCD, A and D sub-tuyere produced an ideal airflow improvement effect. When the air supply volume was 40%, opening B or C sub-tuyere alone could meet the requirements. For 20% airflow conditions, the diffuser could only open the C sub-tuyere to raise the range to 1.615 m at maximum, but could not reach the design value.
The opening sequence of sub-tuyere based on CMT.
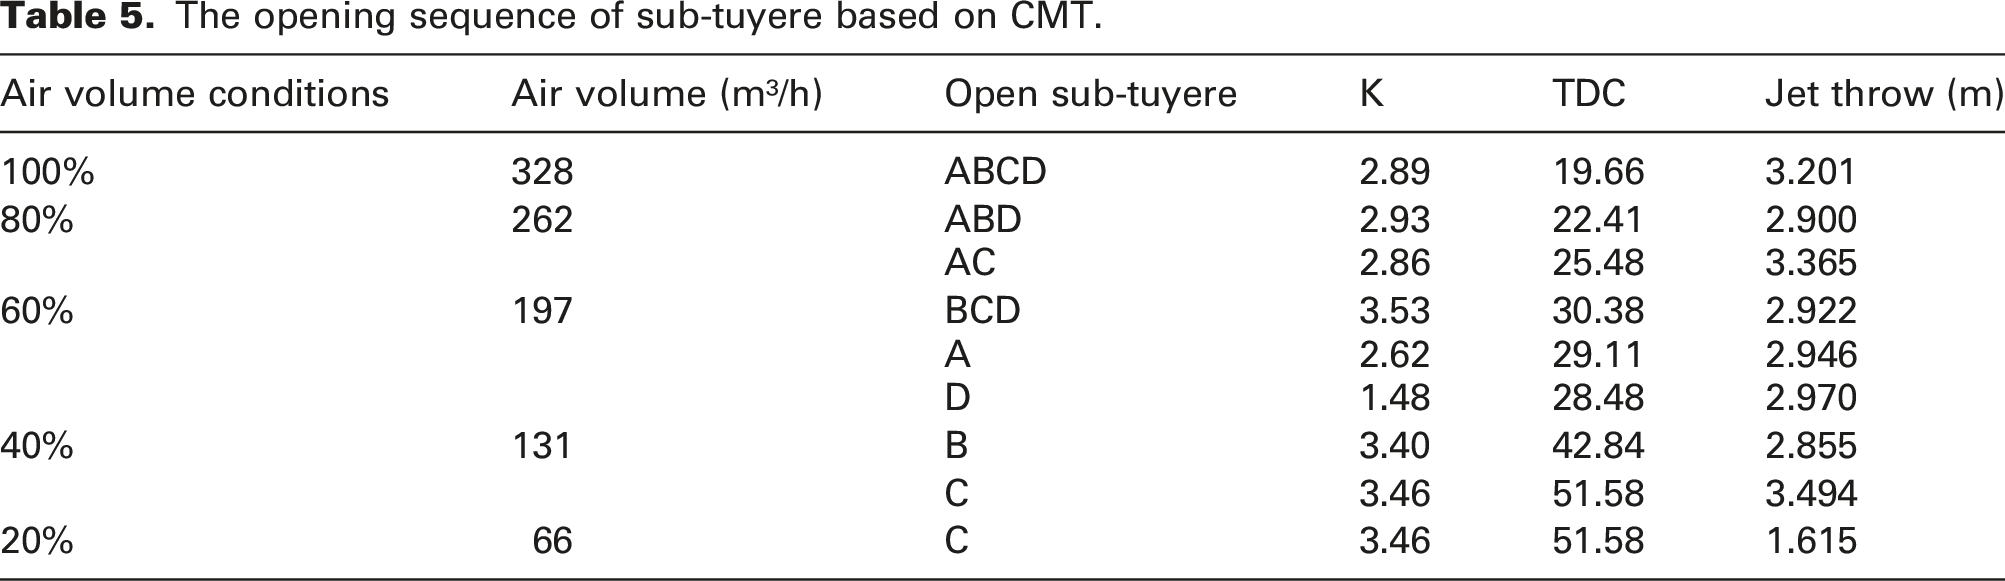
The results in Table 4 and Table 5 show that the increase in momentum caused by the reduction in air supply area illustrated that both methods could produce an improvement effect on the jet throw. The difference between the two was reflected in the 60% and 40% airflow operating conditions, where the CMT improved the throw length by 20% and 56%, respectively. Opening AC at 60% airflow produced a higher supply air velocity than BCD (
(2) Velocity contour evaluation
Figure 13 shows the velocity contour of different air volume. The airflow cover area was decreased significantly with the decline of air supply volume. When the air volume was reduced to 20%, the indoor air velocity was basically below 0.5 m/s. This means that fresh air could not reach most areas. In the absence of adjustment measures, indoor air quality and comfort under low airflow would be difficult to ensure. Velocity contours (plane 0.02 m from the ceiling) for different air volume ratio: (a) 100%; (b) 80%; (c) 60%; (d) 40% and (e) 20%.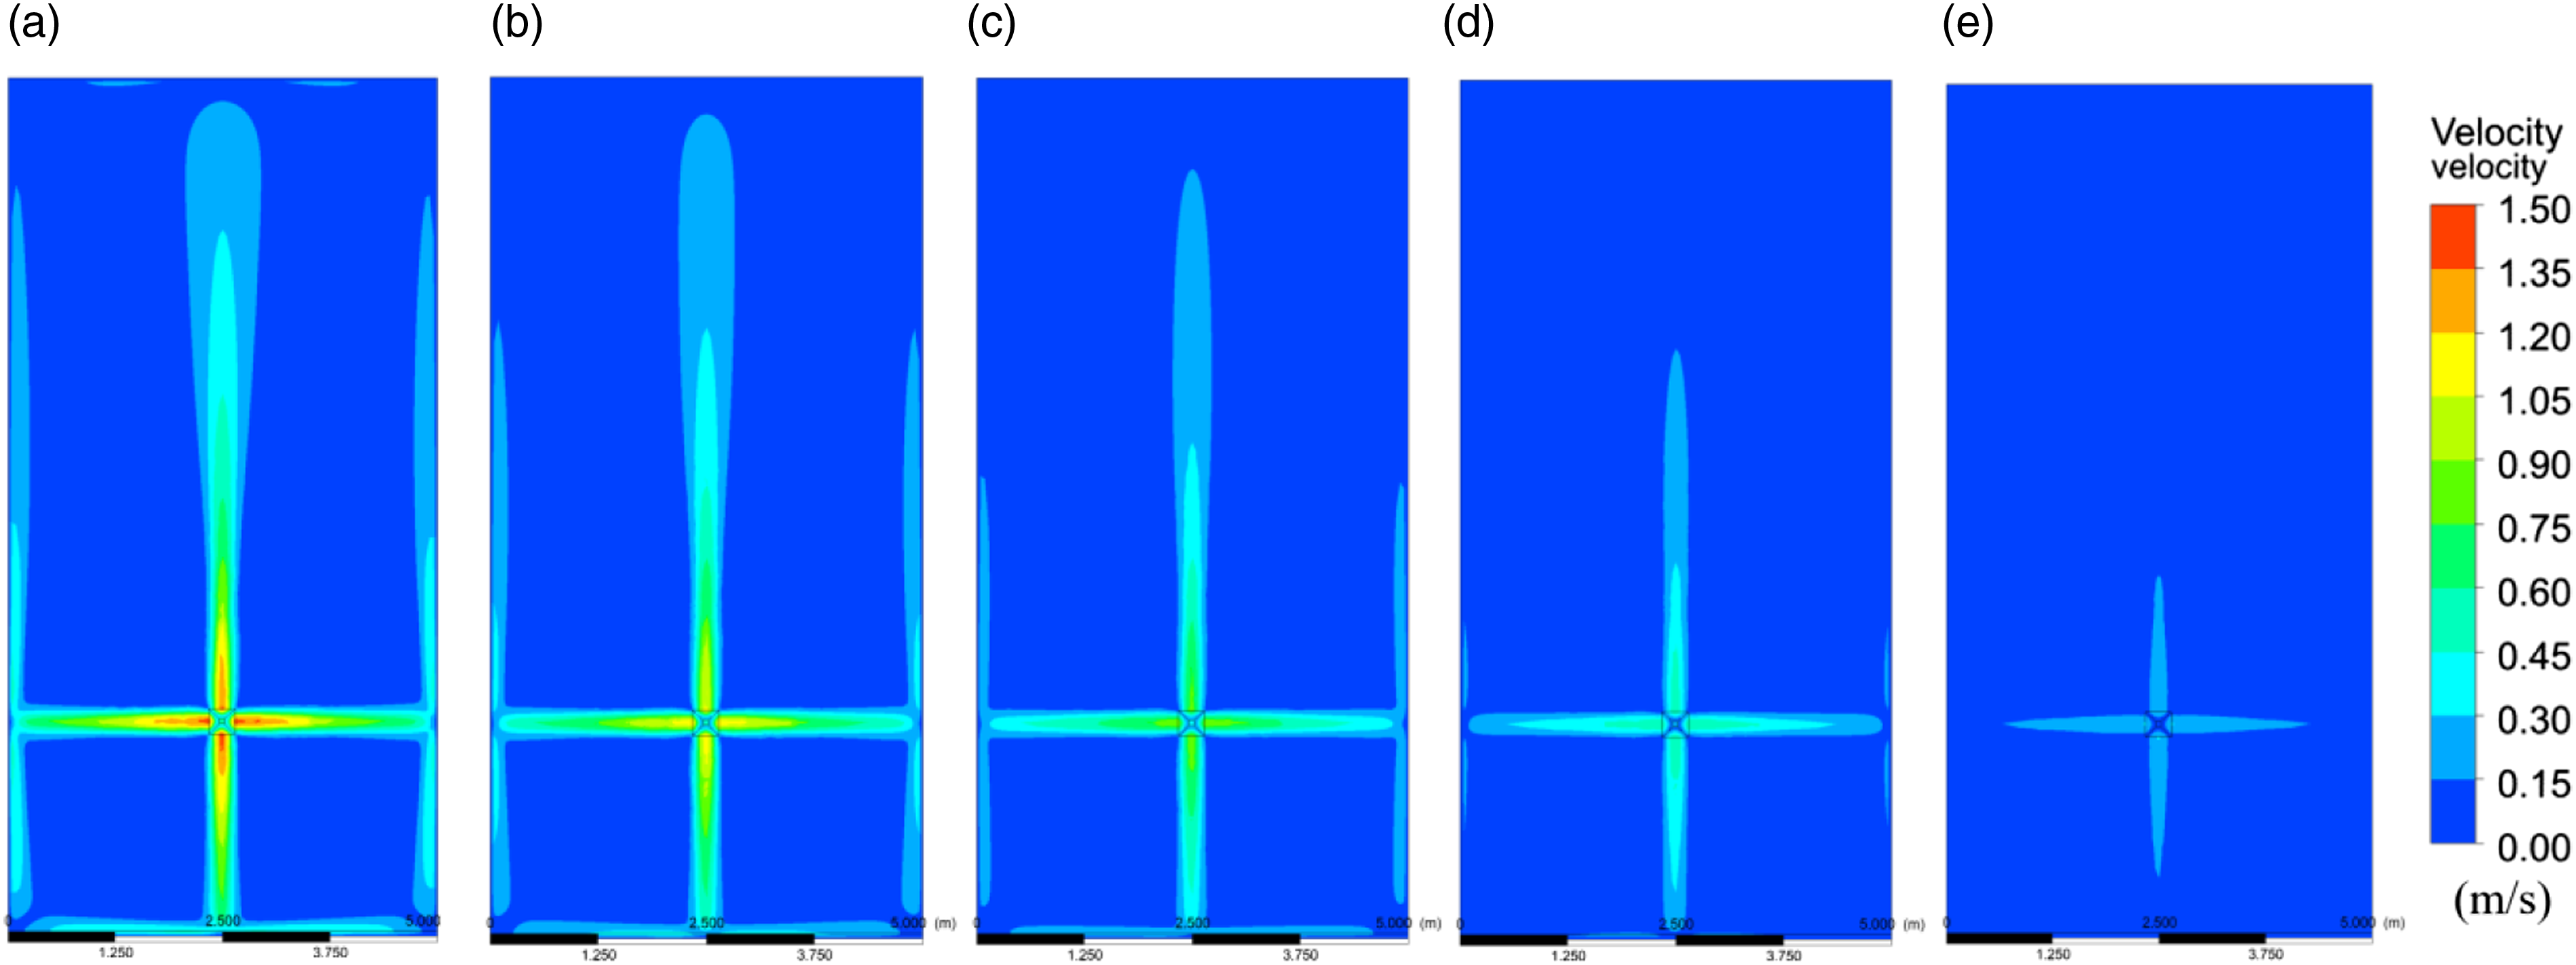
Numerical simulations were performed under the conditions shown in Table 4 and Table 5. Results in Figure 14 show that the throw length and diffusion width were improved by using CMT under 80% and 60% airflow conditions. This is mainly because the CMV does not consider the change in diffusion capacity and air supply area, and the actual working condition deviated from the design value. Furthermore, the comparison results of Figures 13 and 14 show that the new diffuser proposed in this paper has a significant enhancement effect on the airflow coverage area and can effectively improve airflow distribution at low airflow in the VAV system. Velocity contours (plane 0.02 m from the ceiling) under different air volumes: (a) 60% volume (CMV left and CMT right) and (b) 40% volume (CMV left and CMT right).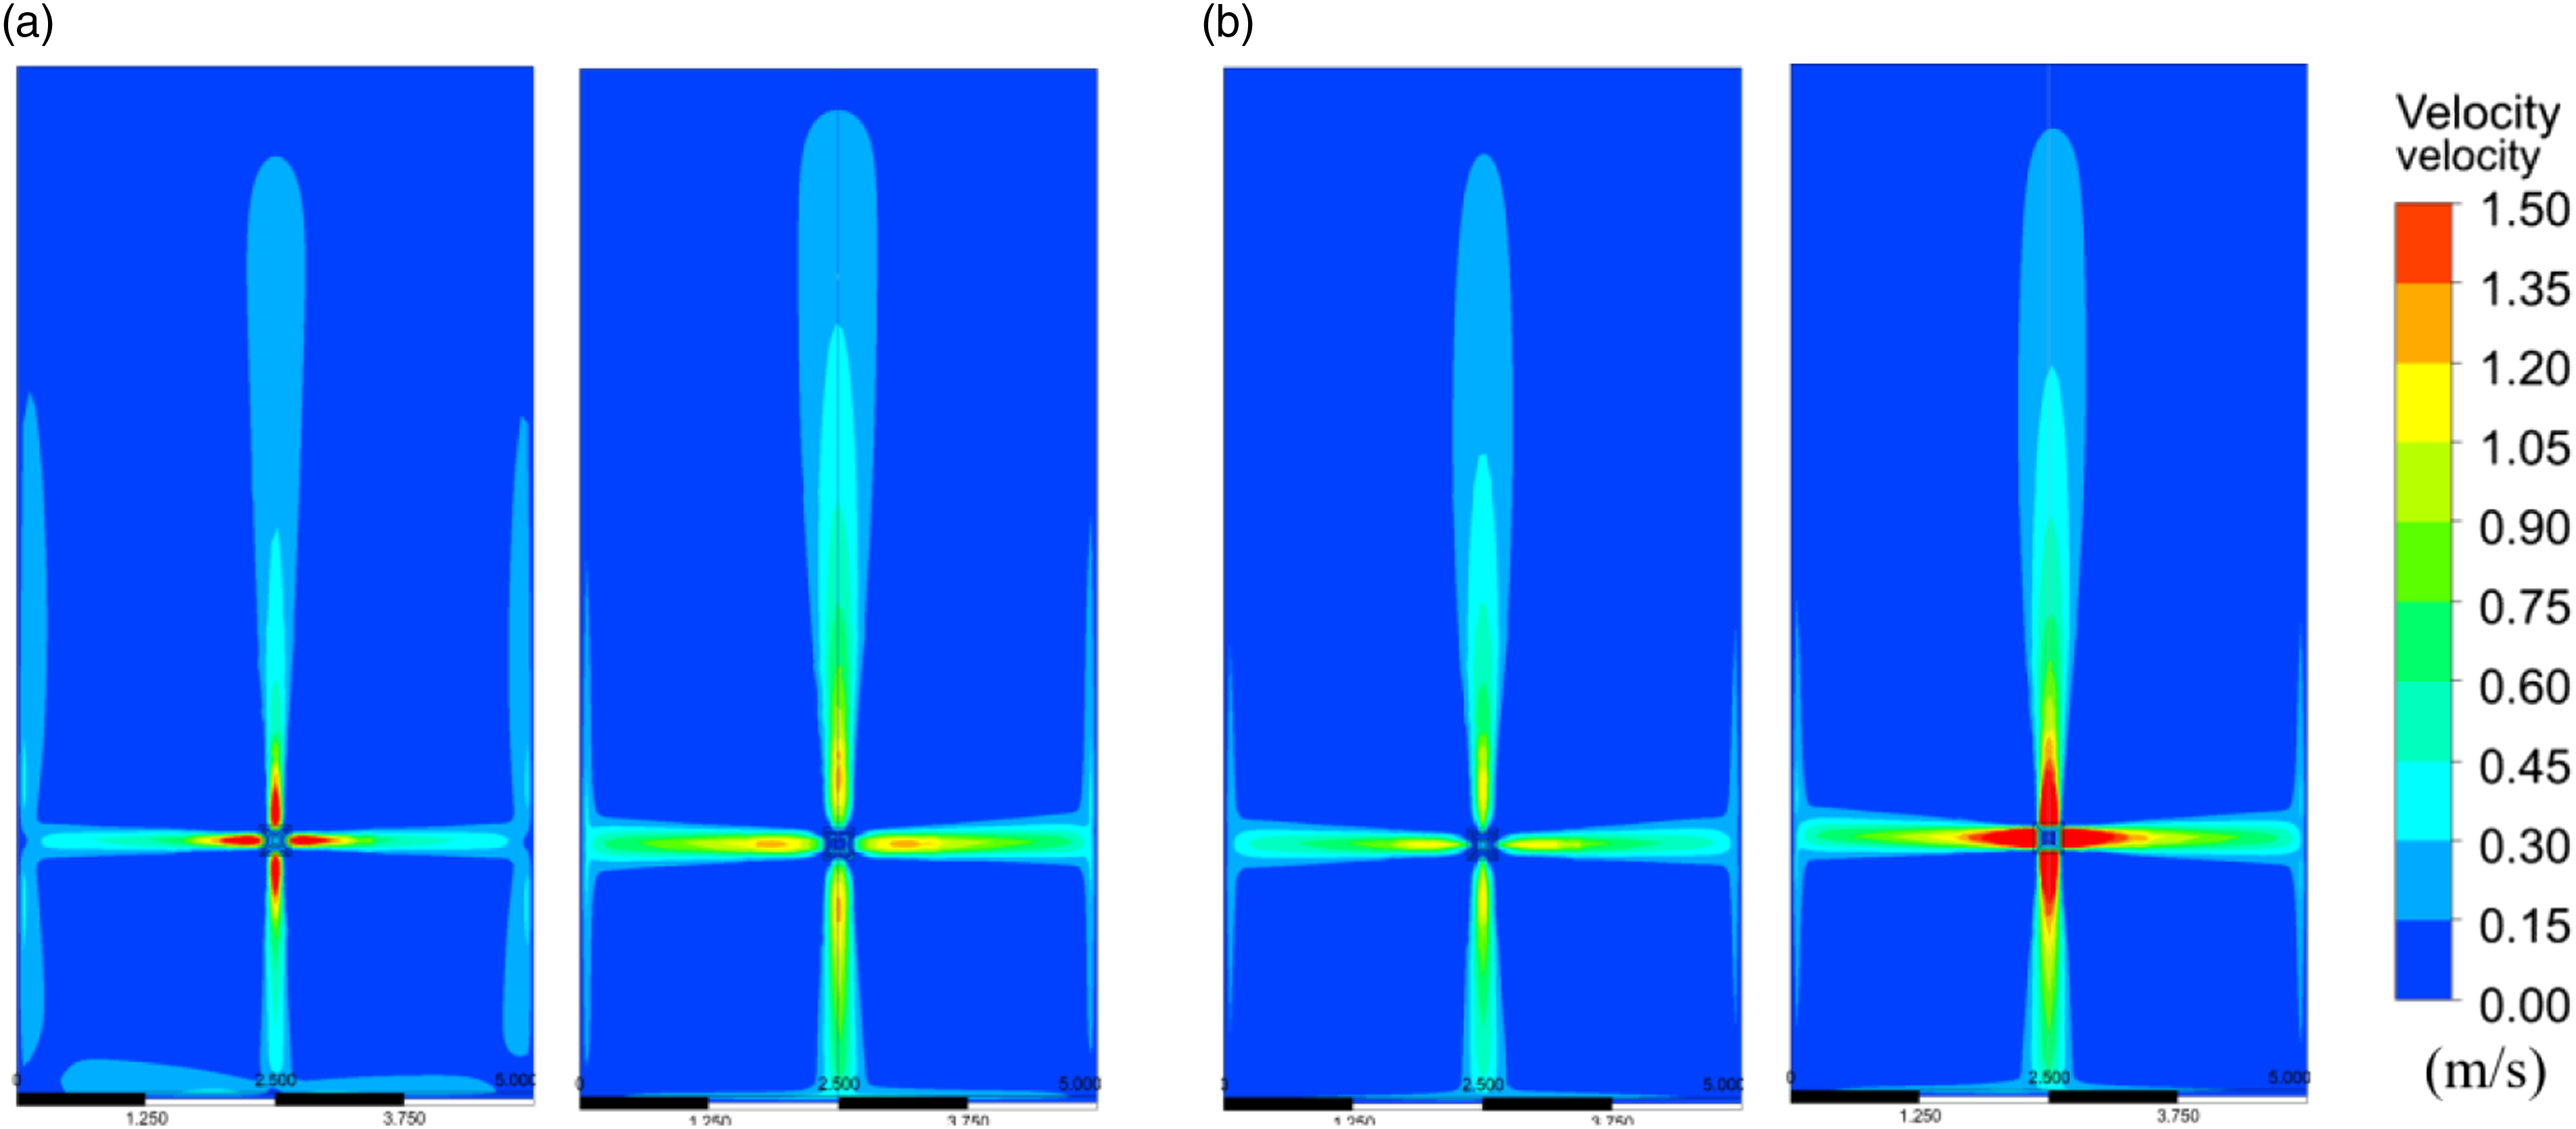
Application of CMT in improving indoor airflow distribution
(1) Air temperature distribution
The indoor temperature distribution for different operating conditions is shown in Figure 15. Generally, the average room temperature was maintained at about 26°C for different conditions. For the partial working condition, the room temperature of the office showed a significant inhomogeneity, with a difference of 6°C between the maximum temperature of 30°C and the minimum temperature of 24°C. This also showed a maximum temperature difference of 5°C in the conference room. The average room temperature in the office with CMV operating conditions was 1°C higher than the set value, which means that the heat in the room was not replaced effectively. Overall, CMT was able to significantly improve the room temperature uniformity while maintaining set points. Indoor temperature distribution of two types of rooms: (a) office and (b) conference room.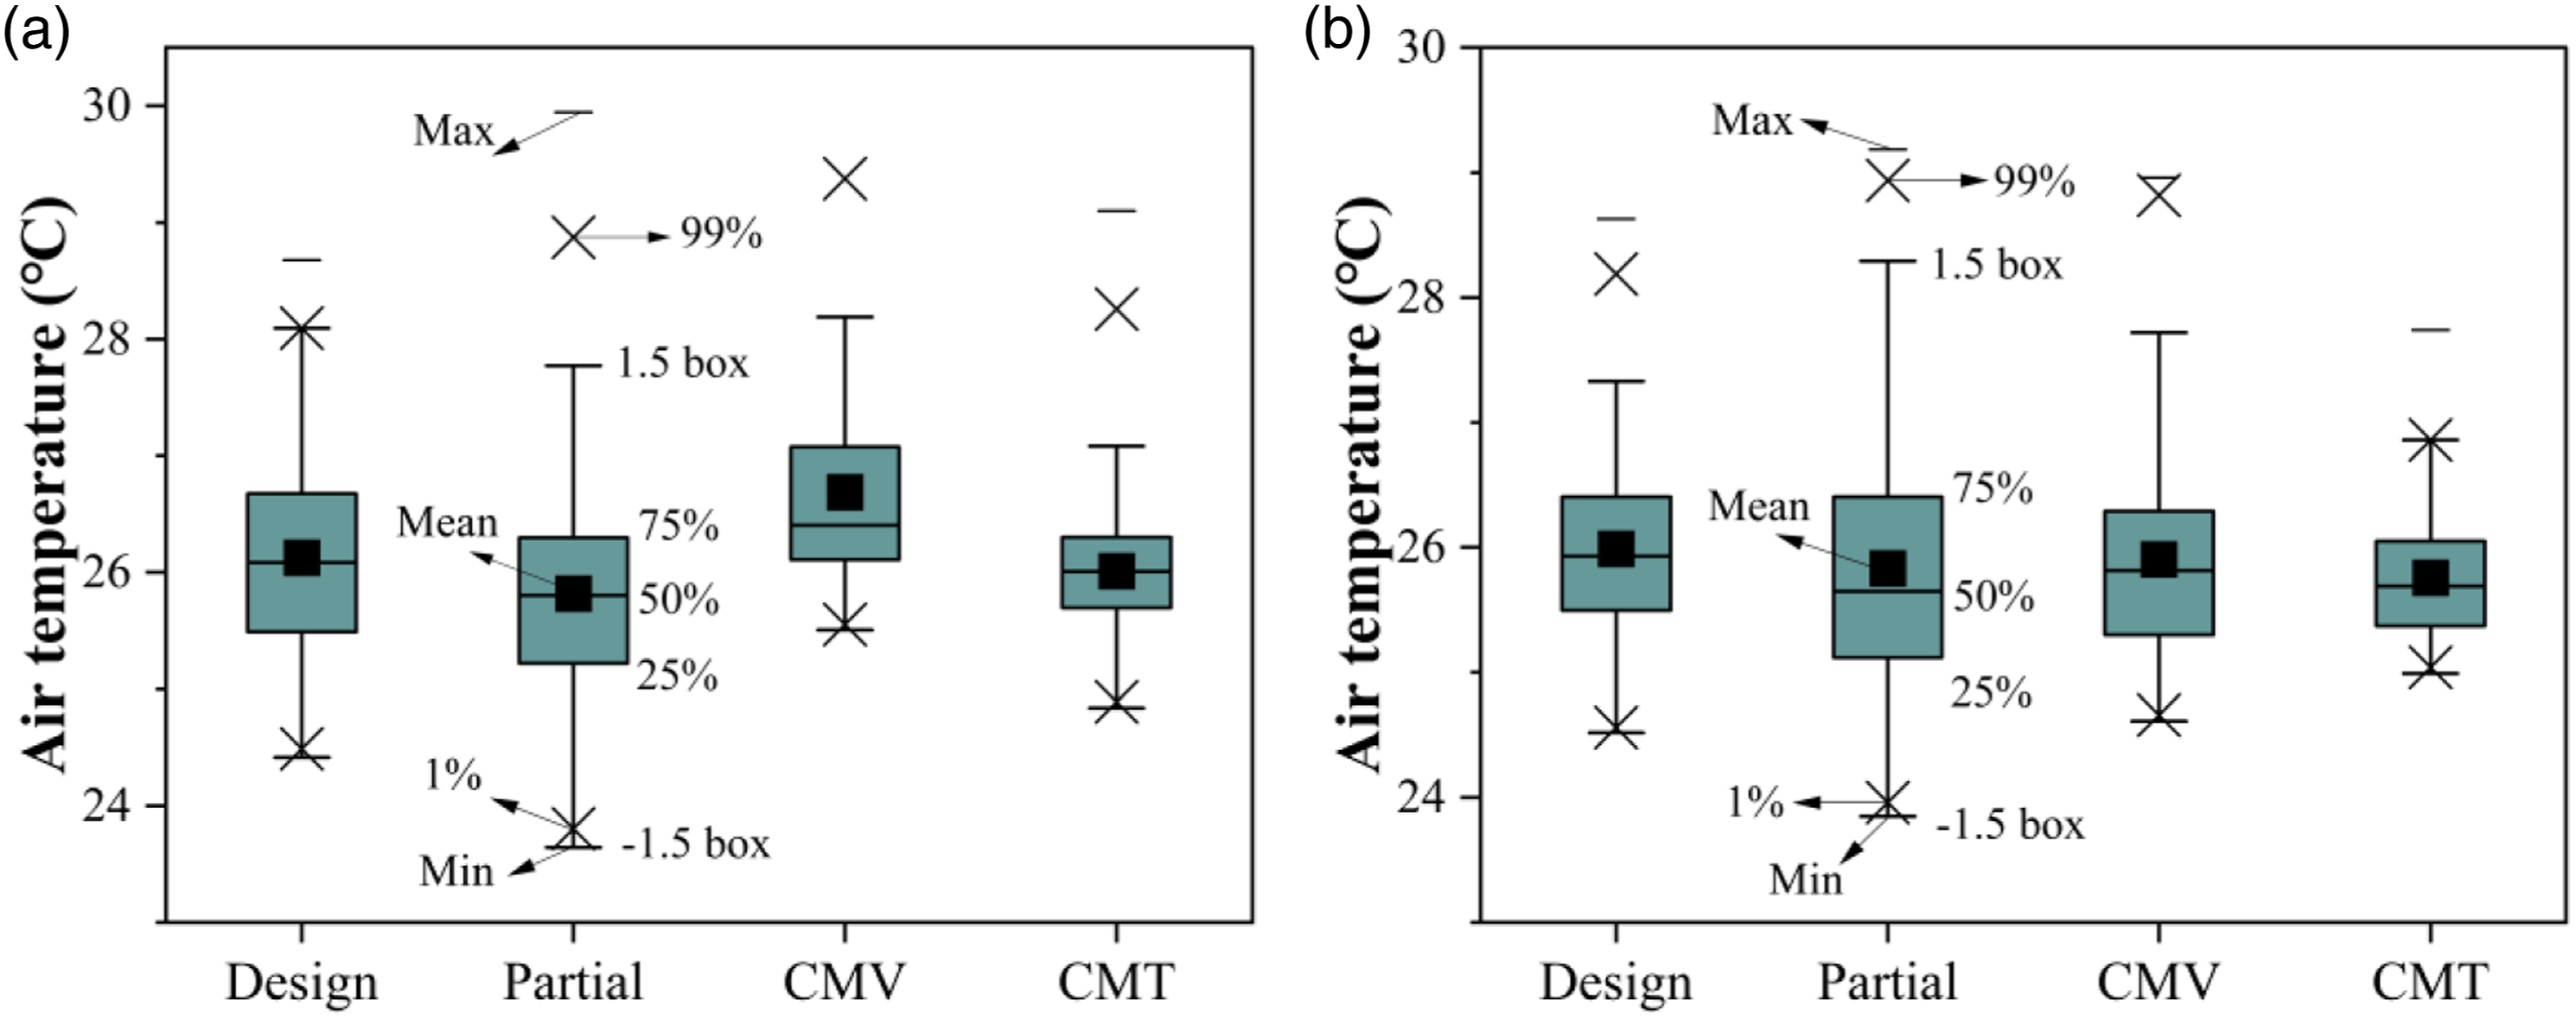
(2) Effective draught temperature (EDT)
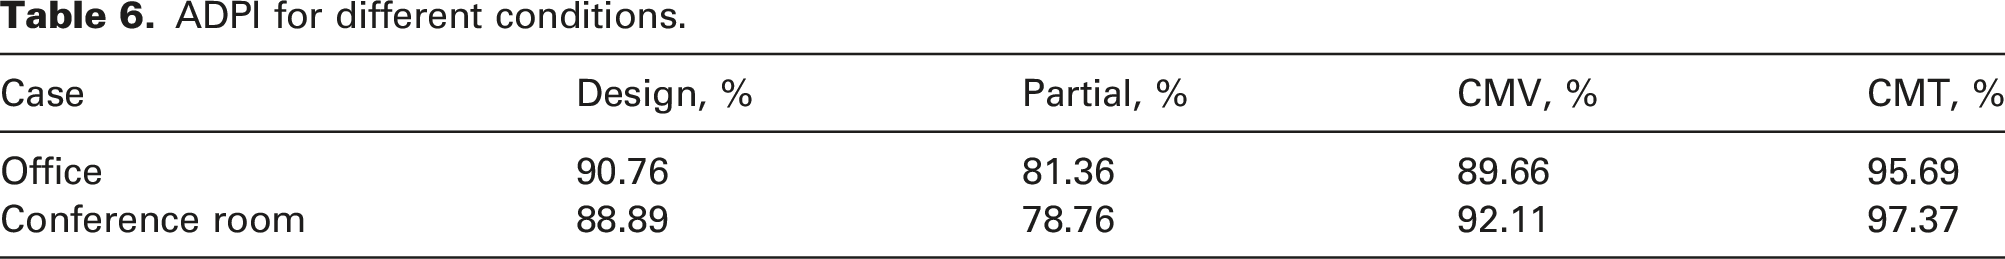
The environmental evaluation index, effective ventilation temperature (EDT), is shown in Figure 16. Considering that −1.7 < EDT < 1.1 is acceptable, the ADPI for different working conditions was calculated by equation (12) (as shown in Table 6). The results show that CMT can create a more satisfactory environment, which is reflected in both the office and conference room. For office conditions, compared to Partial and CMV working conditions 81.36% and 89.66%, CMT can achieve ADPI of 95.69%. In the conference room, ADPI was raised from 78.76% and 92.11% to 97.37%. Effective draught temperature of two types of rooms: (a) office and (b) conference room. ADPI for different conditions.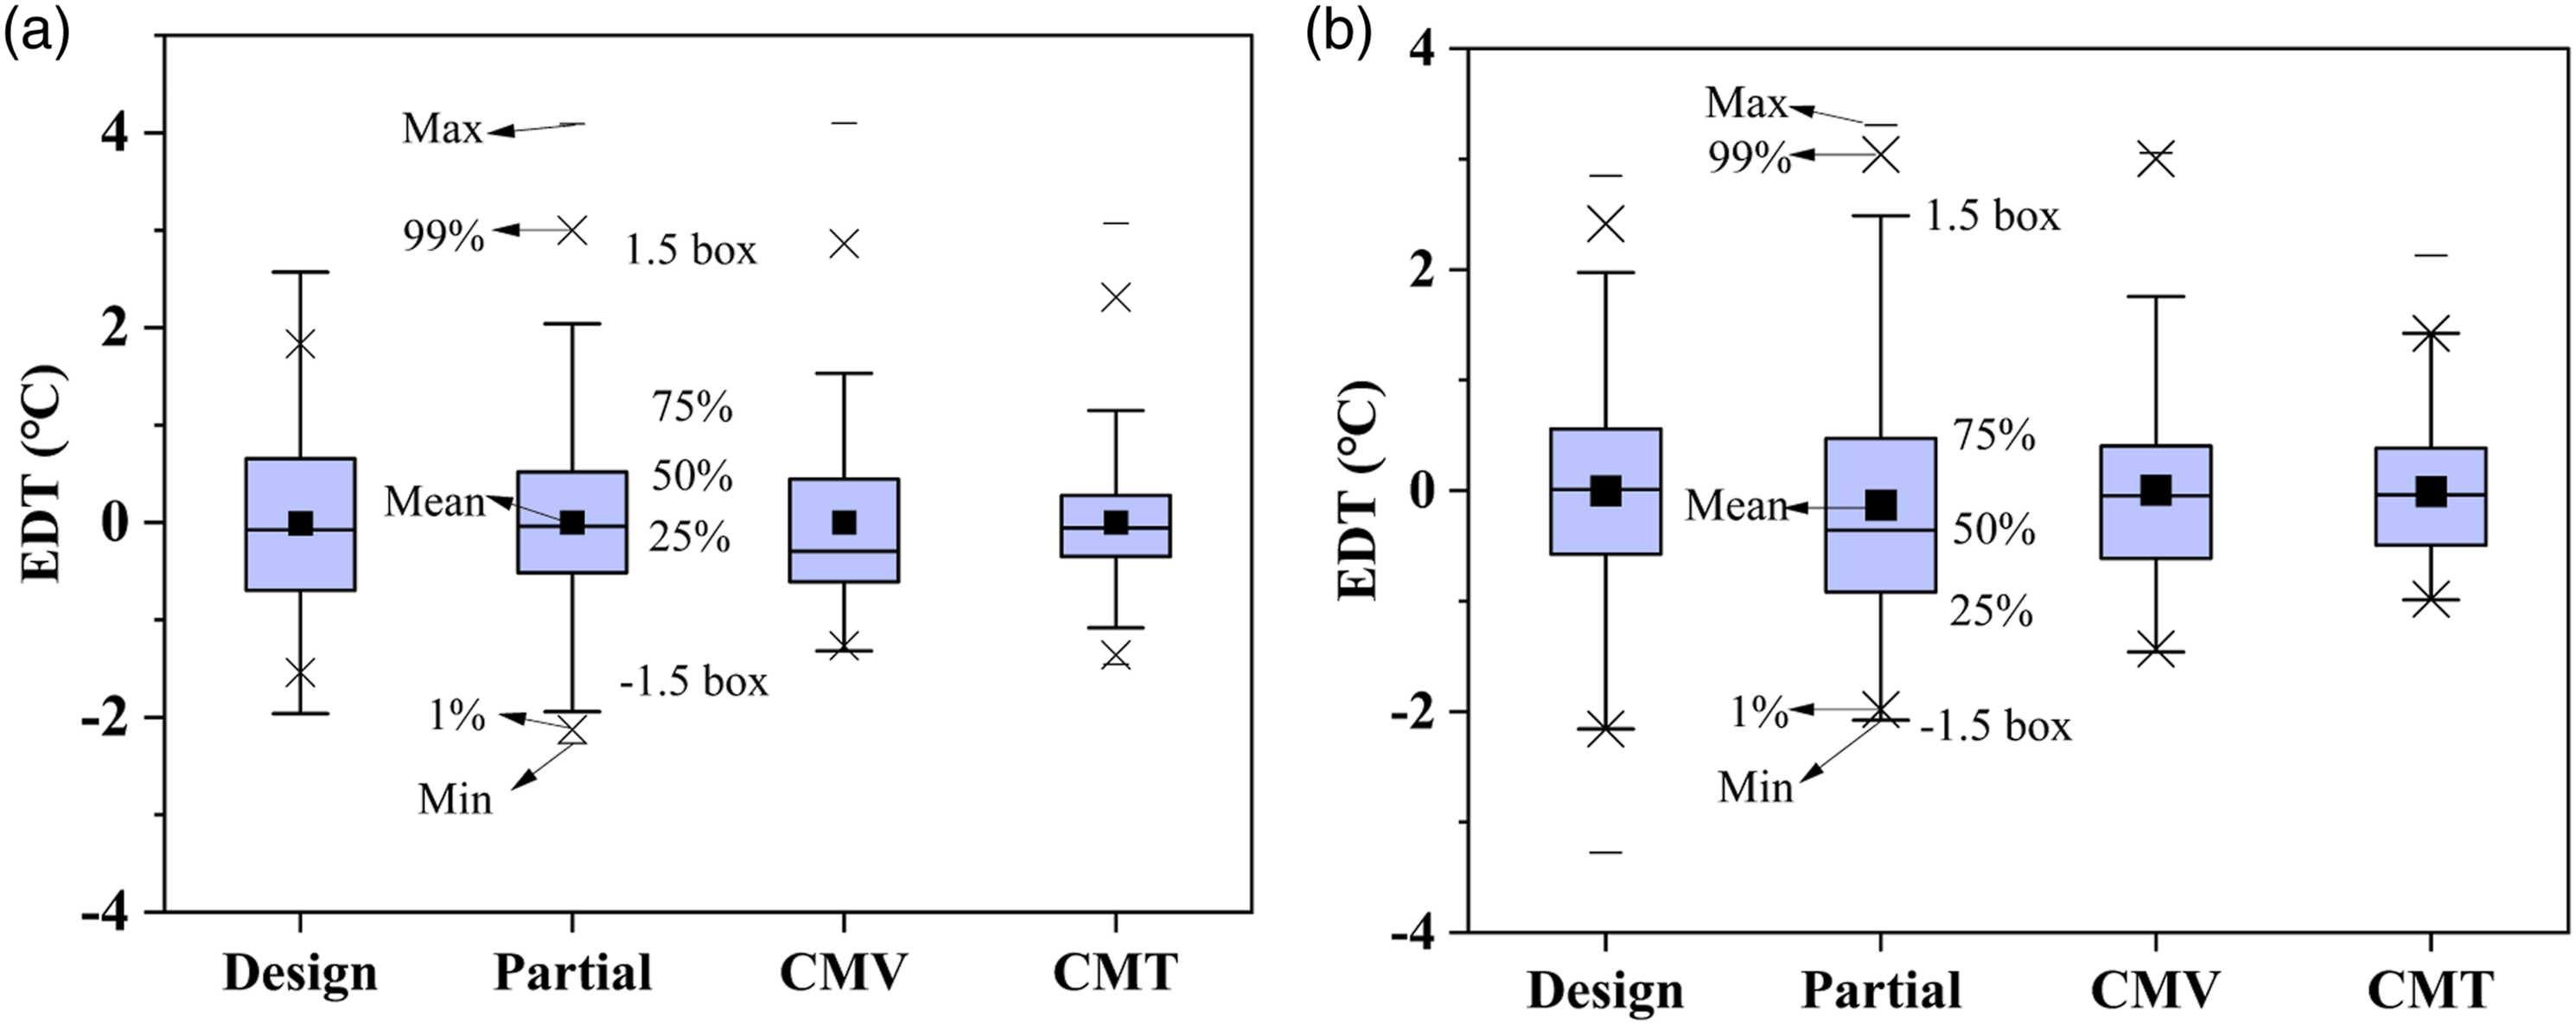
(3) Air velocity distribution
As shown in Figure 17, the velocity distribution characteristics of the ceiling diffuser under different working conditions are similar. The velocity is concentrated in the low velocity section of 0∼0.1 m/s. This is related to the ceiling diffuser airflow pattern, where the airflow reaches the occupant zone after adhering along the ceiling and walls, where the velocity decays to approximately 0 m/s.
50
Although CMT increases overall indoor velocity, this level is still acceptable (<0.1 m/s).
51
It is worth noting that for the air supply form (such as the corridor-wall grille) where the airflow directly reaches the work area, the draught sensation will be an important factor affecting the comfort.
37
Indoor velocity distribution of two types of rooms: (a) office and (b) conference room.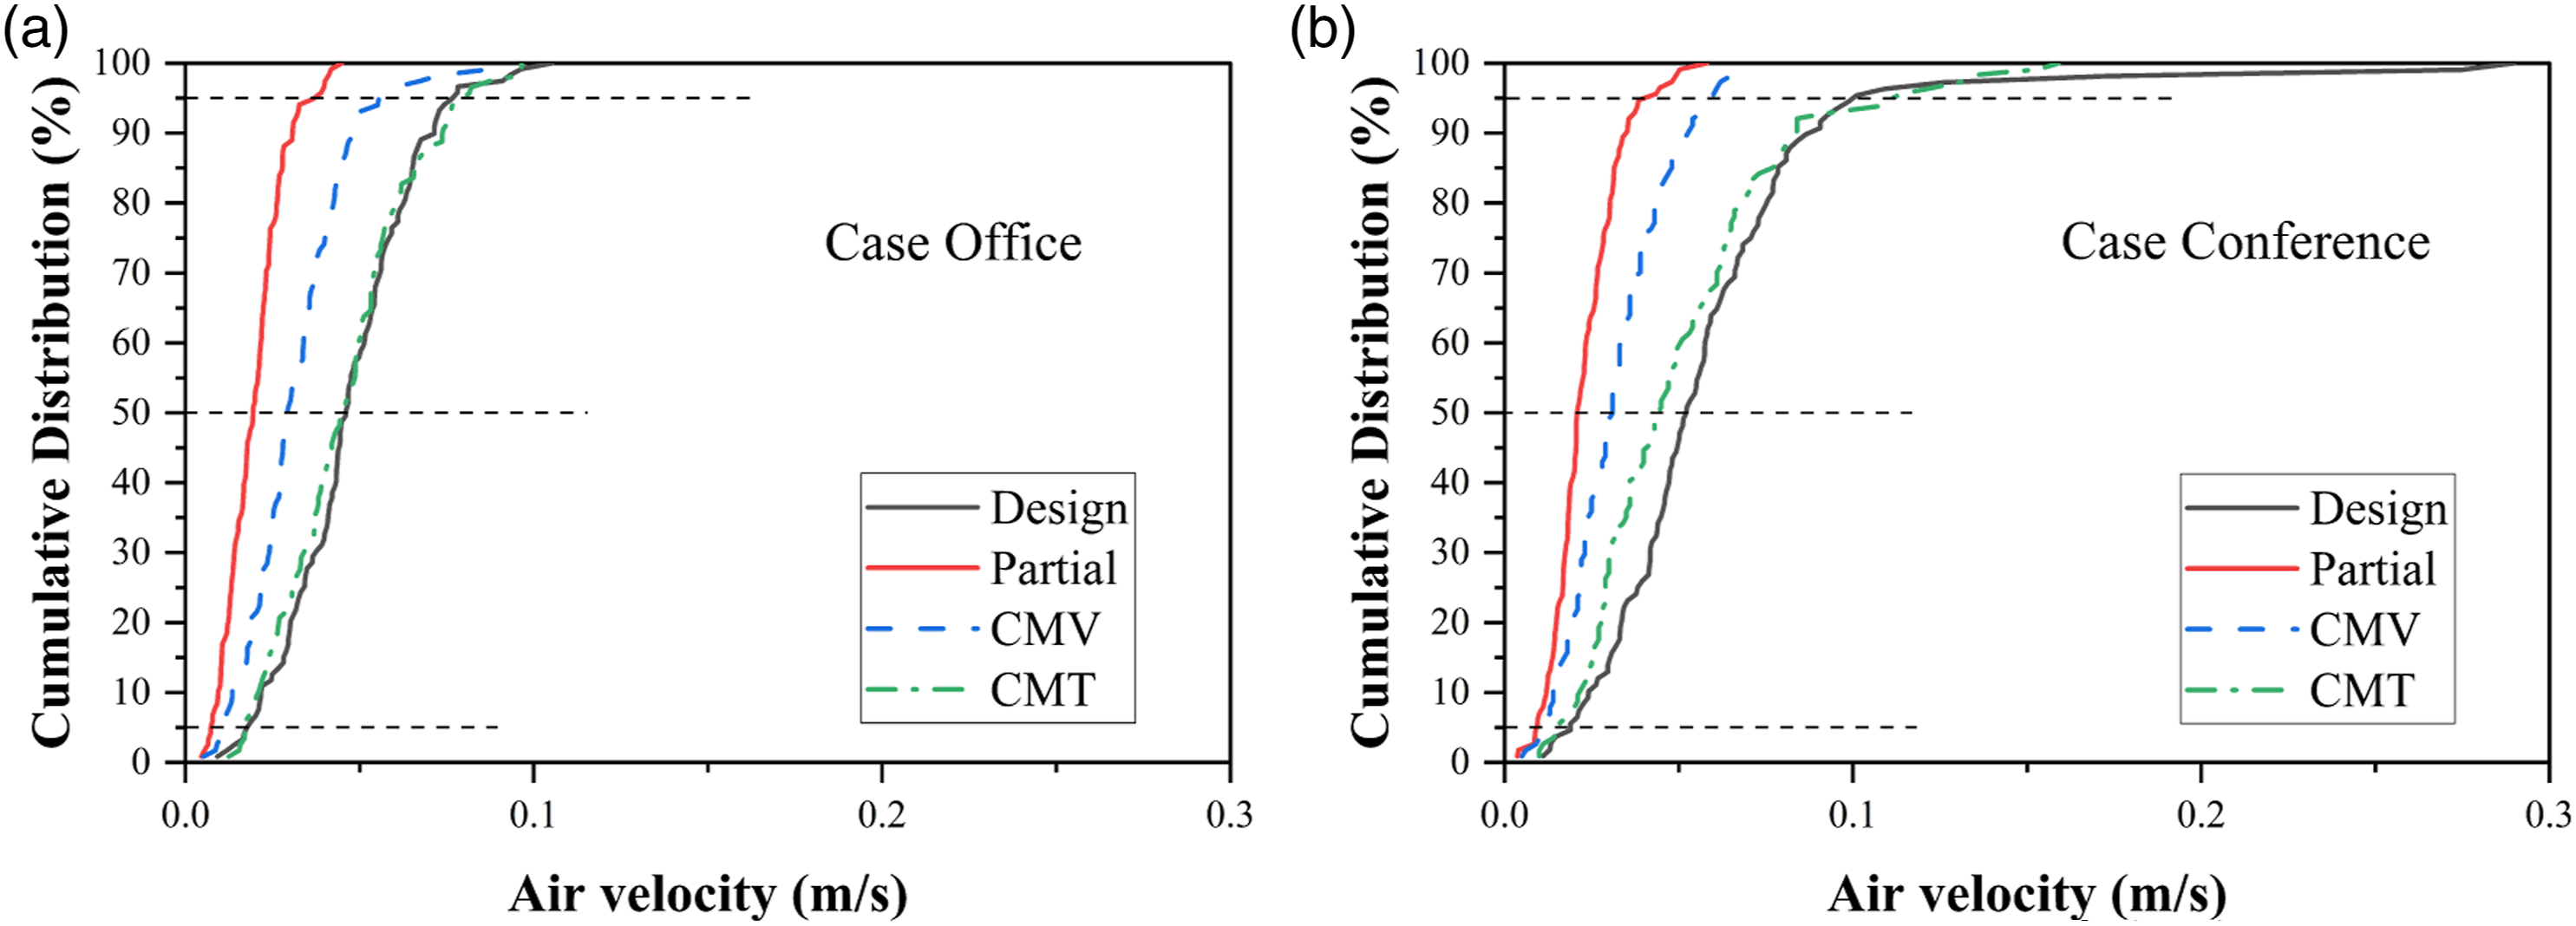
(4) Ventilation efficiency
Figure 18 shows that CMT has a lower ventilation efficiency compared to the other three conditions. The ventilation efficiency of the latter was around 1.0, while the CMT fell to near 0.9. These results are reflected in both office ( Ventilation efficiency of two types of rooms: (a) office and (b) conference.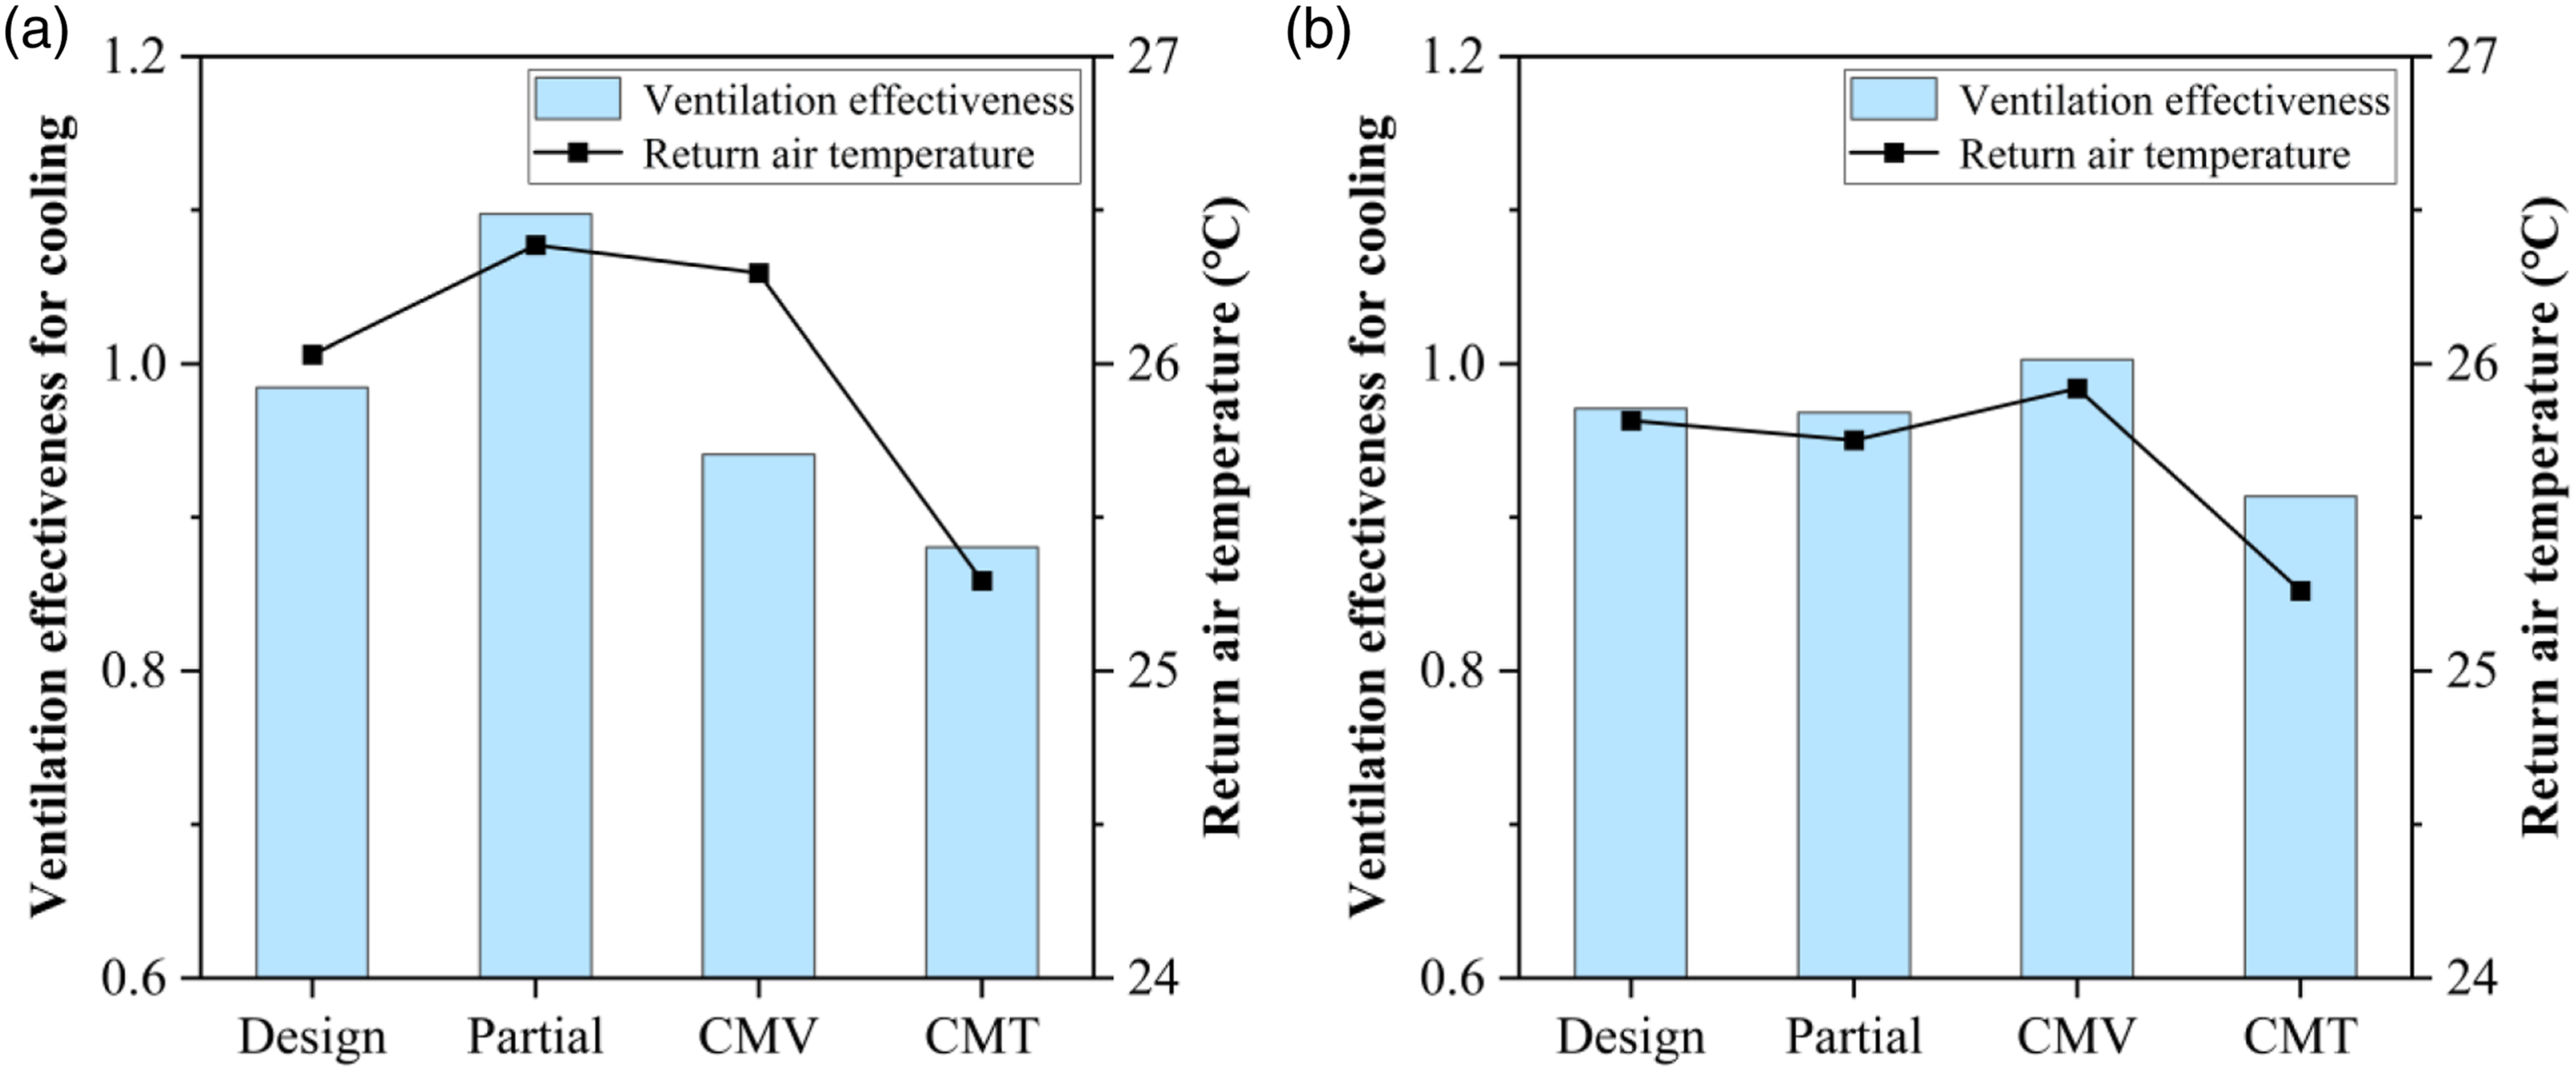
Discussion
(1) Analysis of airflow pattern
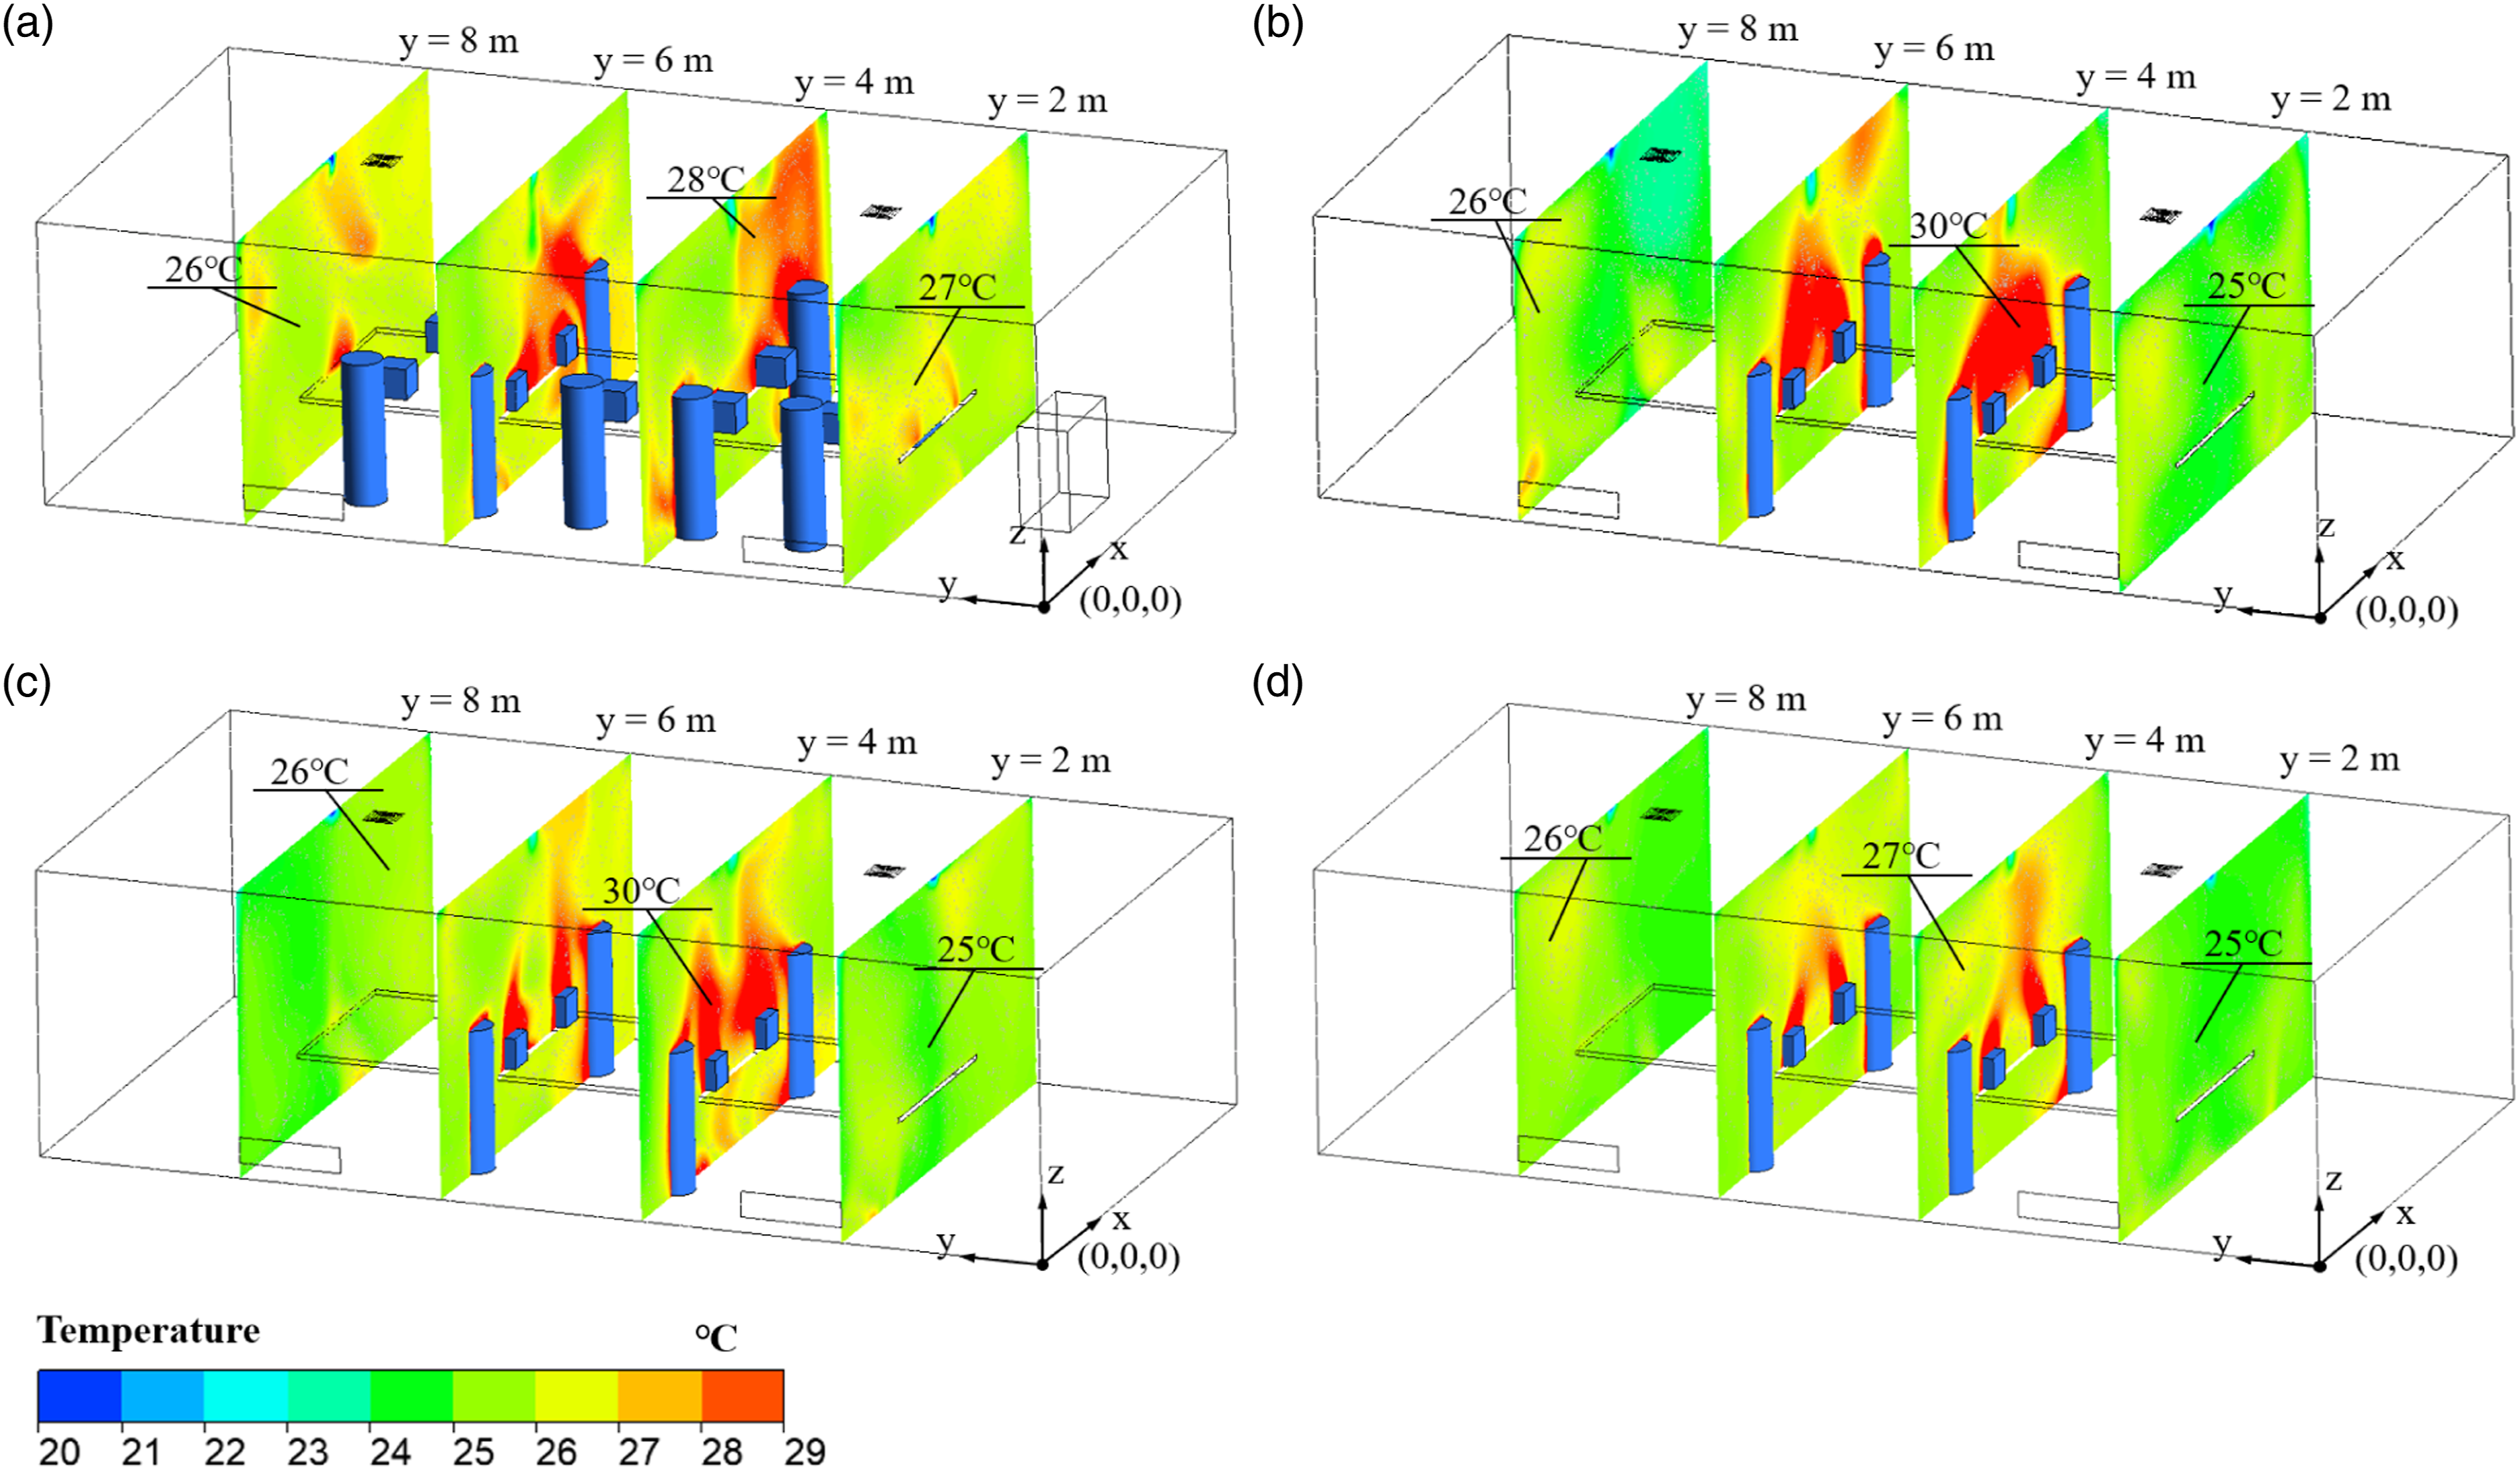
To determine the correlation between airflow distribution and indoor comfort, the velocity vectors and temperature contours under four typical scenarios in the conference were compared as shown in Figures 19 and 20. Velocity vector charts under four typical scenarios: (a) 100% air volume (without regulation); (b) 40% air volume (without regulation); (c) 40% air volume (CMV) and (d) 40% air volume (CMT). Temperature contour plots of the conference room: (a) 100% air volume (without regulation); (b) 40% air volume (without regulation); (c) 40% air volume (CMV) and (d) 40% air volume (CMT).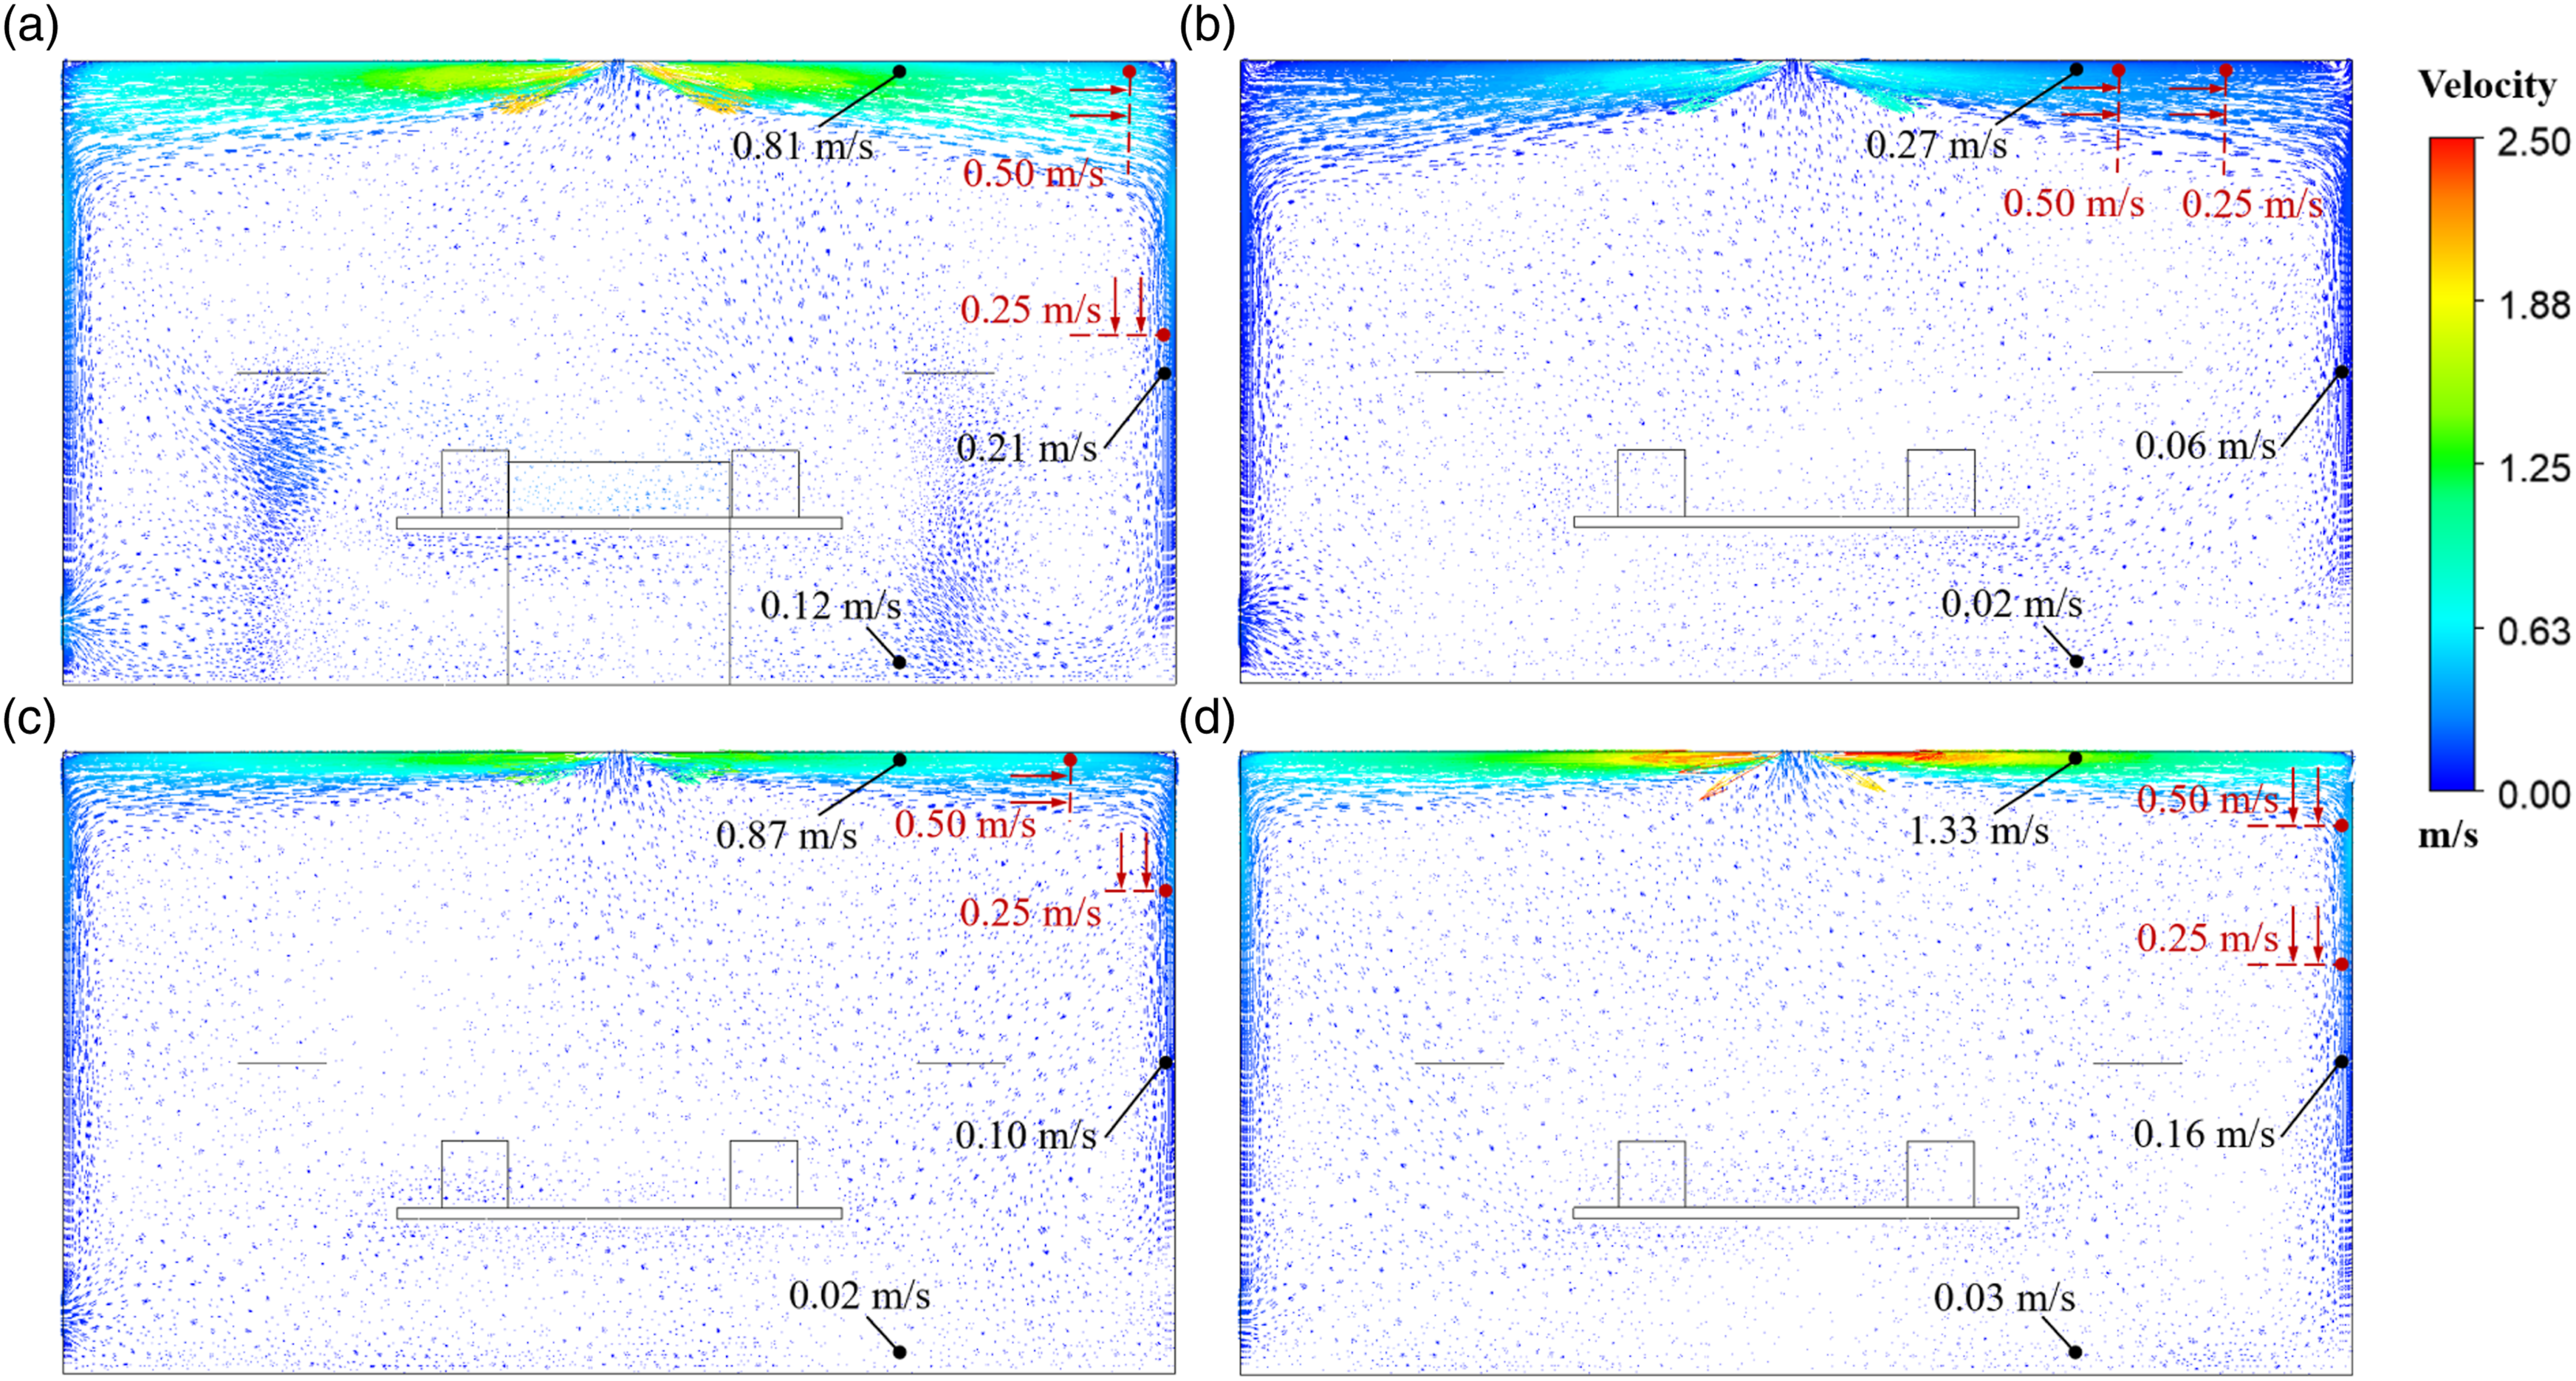
The airflow was discharged from the diffuser, forming a spreading zone near the ceiling. Then it turned vertically downward along the walls, and becomes horizontal again when it reached the ground. Earlier studies revealed that the jet velocity decay before and after the corner is correlated. 29 This means that the airflow in these three regions can be treated as a whole. Figure 19 indicates the positions where the jet velocity decayed to 0.5 m/s and 0.25 m/s, which are commonly used to quantify the range of the airflow. 24 When the diffuser was not used to make any adjustment to the reduced air volume, the jet almost decayed near the ceiling. When the airflow reached the wall, the velocity declined to 0.06 m/s (Figure 19(b)). CMT was shown to have the longest throw length under the same air supply volume. At the same location on the wall, the velocity of CMT was 60% higher than that of CMV. This method, therefore, would enhance the jet strength at each positions.
Figure 20 shows the strengthening of the air flow, which removed the heat in the room more effectively. Due to the heat dissipation of occupants and computers, the high temperature area in the room was located in the middle. Compared with the control group (Figure 20(b)), the use of CMV allowed the cold air to be delivered farther and the uniformity of the indoor temperature distribution was improved. However, there were still large areas near the personnel with temperatures reaching 30°C. CMT could improve the problem of excessive local temperature, which would meet the personnel thermal comfort requirements. Figure 20(a) is not discussed here because of its different heat source distribution.
The simulation results indicate that the airflow pattern of ceiling diffusers can be divided into two categories: full coverage model (Figure 21(a)) and partial coverage model (Figure 21(b)). The former represents the typical pattern of the ceiling diffuser.
29
The airflow entered the working area at a certain velocity after impinging and turning at the corner. The thermal plume generated by the indoor heat source would move upwards and entrain the airflow in the spreading zone.
52
This loop can remove heat from the working area. Schematic diagrams of flow pattern on the middle section in the case of two different air volumes: (a) full coverage model and (b) partial coverage model.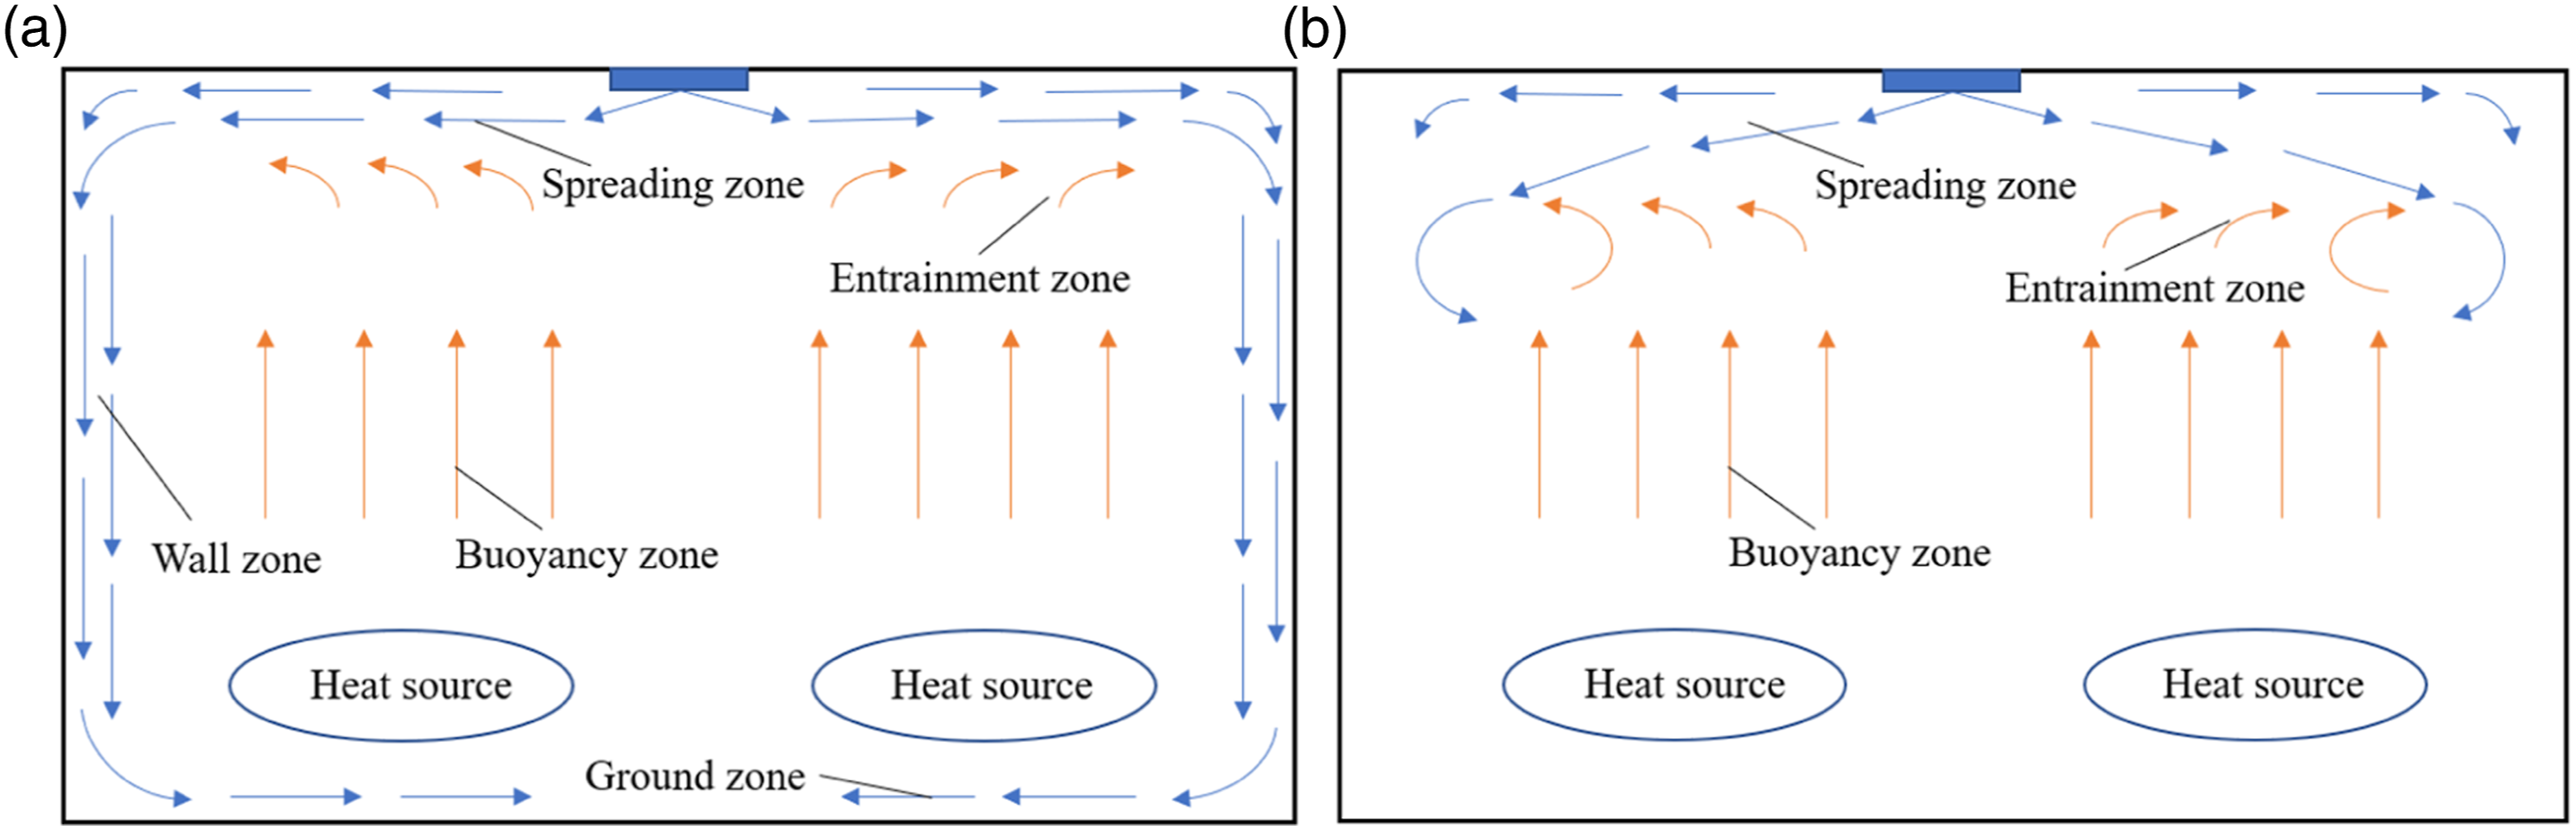
The airflow pattern would gradually change to partial coverage model as the initial air supply momentum was decreased. The jet was completely mixed with room air before it reached the walls, and the airflow in the wall and the ground zone would be weaken. When the heat source in the room was concentrated and of high intensity, the heat dissipation in the corresponding area would not be effectively removed. Earlier studies have shown that excessive wind velocity near the ground may cause draught problems in rooms. 53 This study supplements that conclusion and shows the increase in the initial air supply momentum is necessary in order to improve the heat removal efficiency.
Compared with CMV, CMT would extend the distance of the spreading zone by increasing the momentum of the outlet airflow. The airflow range of the spread zone would be more easily assured and the airflow intensity of the wall zone and ground zone would be enhanced. Thus, it can maintain optimum heat removal and environment creation in the VAV system.
(2) Throw length of non-isothermal jet
The throw length distribution diagram (Figure 12) was tested under isothermal conditions. Air supply temperature difference was not considered. Influenced by inertial force and buoyancy, the velocity decay and behaviour of non-isothermal jets vary across different
Conclusion
In this study, an active diffuser control method based on constant jet throw length has been proposed, which aims to replace the original control method of keeping the outlet air velocity constant. The main findings are summarized as follows: (1) A ceiling diffuser based on sub-tuyere was tested. Each sub-tuyere area of the diffuser can be controlled by a baffle, so that the air supply area can be varied at different air volumes. The experimental results show that the new diffuser can adapt to a range of airflow variations from 40% to 100%, and the throw length can be increased to 50% of the design value under the condition of 20% air volume. (2) Although CMV can have an improving effect on the indoor environment under partial load. It can still make the throw length deviate from expectations. The diffusion performance of the diffuser is dynamically changing during the adjustment process. The experimental results show that the actual throw length deviated to 76% and 57% of the original at 60% and 40% airflow conditions, respectively. (3) The new control method CMT was proposed and applied to typical office and conference rooms. Results show that CMT can create a more uniform indoor temperature environment compared to CMV. This method can achieve ADPI values of 95.69% and 97.37% in offices and conference rooms, respectively.
This paper recommends that the active diffuser should be tested by the manufacturer for different opening conditions before leaving the factory, and provides typical reference airflow range distribution diagrams for designers. In the future, different kinds of tuyeres should be studied to verify the universality of CMT. Furthermore, it is time-consuming and labour-intensive to test the airflow of all the open states of the active tuyere. How to simplify this method to better apply it to actual production is also the focus of research.
Footnotes
Acknowledgements
Wei Xu is gratefully thanked for his assistance in the experiment. Thanks to Qian Wang, Cheng Guo and Qili Shi for their valuable comments on this paper.
Author Contributions
Linye Song: investigation, data analysis, methodology and writing – original draft preparation; Kaijun Li: methodology, writing – review and editing; Xinghui Zhang: supervision, project administration, writing – review and editing; and Jing Hua: writing – review and editing.
Declaration of conflicting interests
The author(s) declared no potential conflicts of interest with respect to the research, authorship, and/or publication of this article.
Funding
The author(s) received no financial support for the research, authorship, and/or publication of this article.