
Abstract
In this study, we proposed and designed a pump-driven chip-level two-phase cooling system (PCTCS) and experimentally demonstrated that it can directly cool central processing units in data centres (DCs). The operation of the PCTCS involves an internal refrigerant cycle (IRC) and an external water cycle (EWC). Within the IRC, multiple mini-channel evaporators enable the dissipation of heat from the CPUs in the servers through a plate heat exchanger to initiate the EWC, which is followed by the dissipation of the heat to the environment. We performed experiments to systematically analyze the effects of key operation parameters on PCTCS performance of the IRC. The results indicated that the average and the highest core temperature of the CPUs were 76.3°C and 79.0°C, respectively, under extremely harsh heat dissipation conditions. The key driving component of the PCTCS is a refrigerant pump with high energy efficiency ratio (EERp) defined as ratio of heat dissipated by the power of the refrigerant pump. The EERp was 17–18 when the CPUs were at 0% load and 38–42 and 68–76 when the CPUs were at 50% and 100% loads, respectively. Moreover, optimizing the flow resistance of the IRC can improve the performance of the PCTCS.
Keywords
Introduction
In recent decades, several advancements have been made in the fields of cloud computing and big data technology. Accordingly, data centres (DCs), which are crucial components of the internet computer infrastructure, have been upscaled in terms of size and number, thus leading to a rapid increase in the energy consumption of DCs. The power consumption of DCs was expected to increase by approximately 140 billion kWh per year by 2020. 1 In China, the energy consumption of data centres exceeded 120 billion kWh in 2017, which accounted for 2% of the total electricity consumption. By 2022, data centres in China are predicted to consume over 250 billion kWh of electricity, accounting for 4% of the total electricity consumption. 2 Statistics have indicated that 40–50% of the total power consumption of DCs is used for cooling.3–5
Conventionally, DCs are cooled using computer room air conditioning (CRAC) systems, 6 which operate 24 h every day throughout the year, even during winter when the outdoor ambient temperature is sufficiently low for cooling DCs, thereby increasing the energy consumption for cooling and reducing energy efficiency.7–9 Studies have proposed many methods to reduce the energy consumption for cooling DCs. Amongst these methods, cooling using natural cold sources and liquid cooling are two promising techniques for DC cooling systems.10–12
When the outdoor ambient temperature is lower than the ambient temperature of a DC, natural cold sources can be used for cooling, and the heat of the DC can be directly dissipated to the outdoor environment without mechanical refrigeration. 13 Therefore, increasing the application of natural cold sources can reduce the use of compressors, thereby reducing the energy consumption for cooling the DC.14,15 Amongst natural cold sources, ambient air is extensively used because of its advantage of convenience and accessibility. 16 The use of cold ambient air sources can be direct or indirect. In direct use, high-quality fresh air is introduced; however, the risk of server failure may increase if the DC does not satisfy the cleanliness requirements, which are high. 17 In addition to ensuring high air quality, a new wet load needs to be handled which is introduced by fresh air. Although direct natural cooling is highly efficient, its operation and maintenance costs are also high. Moreover, direct natural cooling is rarely used in actual DC projects. Therefore, to prevent the adverse effects of directly using ambient air and to expand the applicability of ambient air cold sources, studies have proposed different methods for the indirect utilization of ambient air. Amongst the various methods, the two-phase loop thermosyphon cooling system (LTCS) is a safe, reliable, simple and energy-saving system that is extensively used for DC cooling.18–20
Similar to CRAC systems, LTCSs can be implemented in three levels, namely, room level, rack level and chip level, through cooling terminal thermal management methodologies. The different levels of implementation have different operating conditions, heat dissipation efficiencies and types and sizes of LTCSs.10,21,22
The room-level LTCS cools an entire data room by enabling the dissipation of heat from internet technology equipment to the room. Qian et al. 23 proposed a heat pipe cooling system. They experimentally estimated the energy saving with 29 data racks and a total power requirement of 30 kW. The experimental results indicated that the system could reduce the power consumption of the DC cooling system by 38.9%. Tong et al. 24 discovered that the total thermal resistance of the R744-based LTCS, which was used to cool DCs, was 22%–25% lower than that of the R22 LTCS and theoretically demonstrated that the air-side thermal resistance constituted majority of the total thermal resistance (68%–82%).
In the rack-level LTCS, evaporators are housed inside the rack. This shortens the air circulation path for heat dissipation, and the heat generated from internet technology equipment can be absorbed by the evaporators. 25 Ding et al. 18 designed an LTCS by placing evaporators inside the front and back doors of the rack; the temperature of the evaporators in the LTCS was much higher than that of the conventional CRAC system. The experimental results indicated that the mixing of cold or hot air in the rack-level LTCS is negligible, indicating that the rack-level LTCS can help achieve more energy saving than the CRAC system. Zou et al. 26 experimentally determined the optimal filling ratio, thermal resistance and operating performance of four LTCSs with different typical server arrangements and discovered that the server arrangement had an influence on the optimal filling ratio but had no notable influence on the thermal resistance of the system. Moreover, clumping the servers at the bottom of the rack is effective for shortening the start-up time of the LTCS under low rack utilization (2 kW heating power).
The room-level and rack-level LTCSs use air as a heat carrier to cool servers in DC. Compared with liquids, air has lower heat-carrying capacity, and a greater temperature difference between servers and cold source is required for cooling using air. The strong heat transfer and cooling load capacity of liquid can improve the utilization time of natural cold sources. Moreover, reusing the waste heat generated in a DC for secondary applications is more efficient than disposing it into the atmosphere.27,28
Amongst the aforementioned three types of LTCSs, chip-level LTCSs are the most advanced and have the highest heat transfer efficiency.21,27,29 Liquid cooling is implemented in chip-level LTCSs by using mini evaporators that cover high-power chips, which are directly cooled by the coolant in the evaporators. Currently, various instabilities associated with a two-phase flow are the main constraints to the application of mini evaporators in chip-level cooling.30,31
Lamaison et al. 29 modelled and experimentally verified a chip-level two-phase cooling system of parallel pseudo-central processing units (CPUs) integrated into a liquid-pumped cooling cycle and investigated the performance of the cooling systems under various blade server operating conditions of transient, steady-state, balanced and unbalanced cooling loads on two pseudo-CPUs. The simulations and preliminary experimental tests revealed that chip-level two-phase cooling is highly effective, efficient and reliable for single and multiple parallel microprocessors.
Chauhan et al. 32 proposed a symmetric double-tapered evaporator configuration, wherein the evaporator makes direct contact with the CPU to dissipate a cooling load of 130 W. The temperature difference parameter θJ-CW was defined as the difference between the junction (or chip surface) temperature and the chilled water temperature. The results indicated that the thermosyphon cooler with a 2.5° taper angle was able to dissipate heat at a rate of 25 W/cm2 at θJ-CW = 36.5°C, while the air and water coolers could dissipate heat at rates of 9 and 19 W/cm2 at θJ-CW of 52°C and 50°C, respectively.
Madhour et al. 33 analyzed the two-phase flow boiling of the R134a refrigerant in a copper multi-microchannel heat sink for microelectronic CPU cooling applications. The base heat flux varied from 2.57 to 189 W/cm2, and the mass flux varied from 205 to 1000 kg/m2s, at a nominal saturation temperature of 63°C. At a coolant flow rate of 1000 kg/m2s with no inlet subcooling, the heat transfer coefficient can reach up to 2.7 × 10⁵ W/m2K (relative to the base area), with the chip held at 85°C and a maximum decrease of 94 kPa in pressure. Studies have also revealed that the heat transfer coefficient increases with the heat flux and is independent of the mass flow rate.
As revealed by aforementioned investigations, compared with room-level cooling and rack-level LTCSs, chip-level LTCS, a liquid cooling method for DCs, has a higher heat transfer coefficient and lower electric consumption and can easily recover waste heat. However, most studies on chip-level two-phase cooling have been focused on designing efficient porous-medium heat sinks. The research on cooling systems and related application technologies for DC industries are scarce.21,31 Furthermore, limited research has been conducted on pump-driven chip-level two-phase cooling systems (PCTCSs) designed for cooling multiple servers in server racks of actual DCs. The implementation of the PCTCSs presents several challenges that need to be addressed, such as modifying structures within servers and handling various chip loads. 10 Our study aims to evaluate the performance of the PCTCSs in real DCs under various operating conditions, identify the key factors influencing their performance and provide references for the further possible application of PCTCSs in DCs.
In this study, we designed a PCTCS for cooling an actual data room with six 42U racks and a total of 120 servers. Each server in the data room has two CPUs, and the PCTCS has mini-channel evaporators that can directly cool the CPUs in the servers. To expediently evaluate the operating characteristics and performance of the PCTCS, we used the first rack total of 20 servers as the test object and recorded their pressure, temperature and electric power. The temperature and the electric power of the servers were also recorded. The effects of cooling water temperatures, CPU loads, refrigerant flow and flow resistances on the PCTCS were investigated through experiments. Finally, we analyzed the performance of the PCTCS and identified potential optimization solutions and operational strategy for the design of the PCTCS. Research showed all the CPUs’ temperature was no more than 80°C in various experimental conditions. The temperature was far lower than the CPU temperature resistance limit (i.e. 95°C). Therefore, the PCTCS can easily cool the chips using natural cold sources throughout the year in every Chinese city.
PCTCS setup used for cooling an actual data room
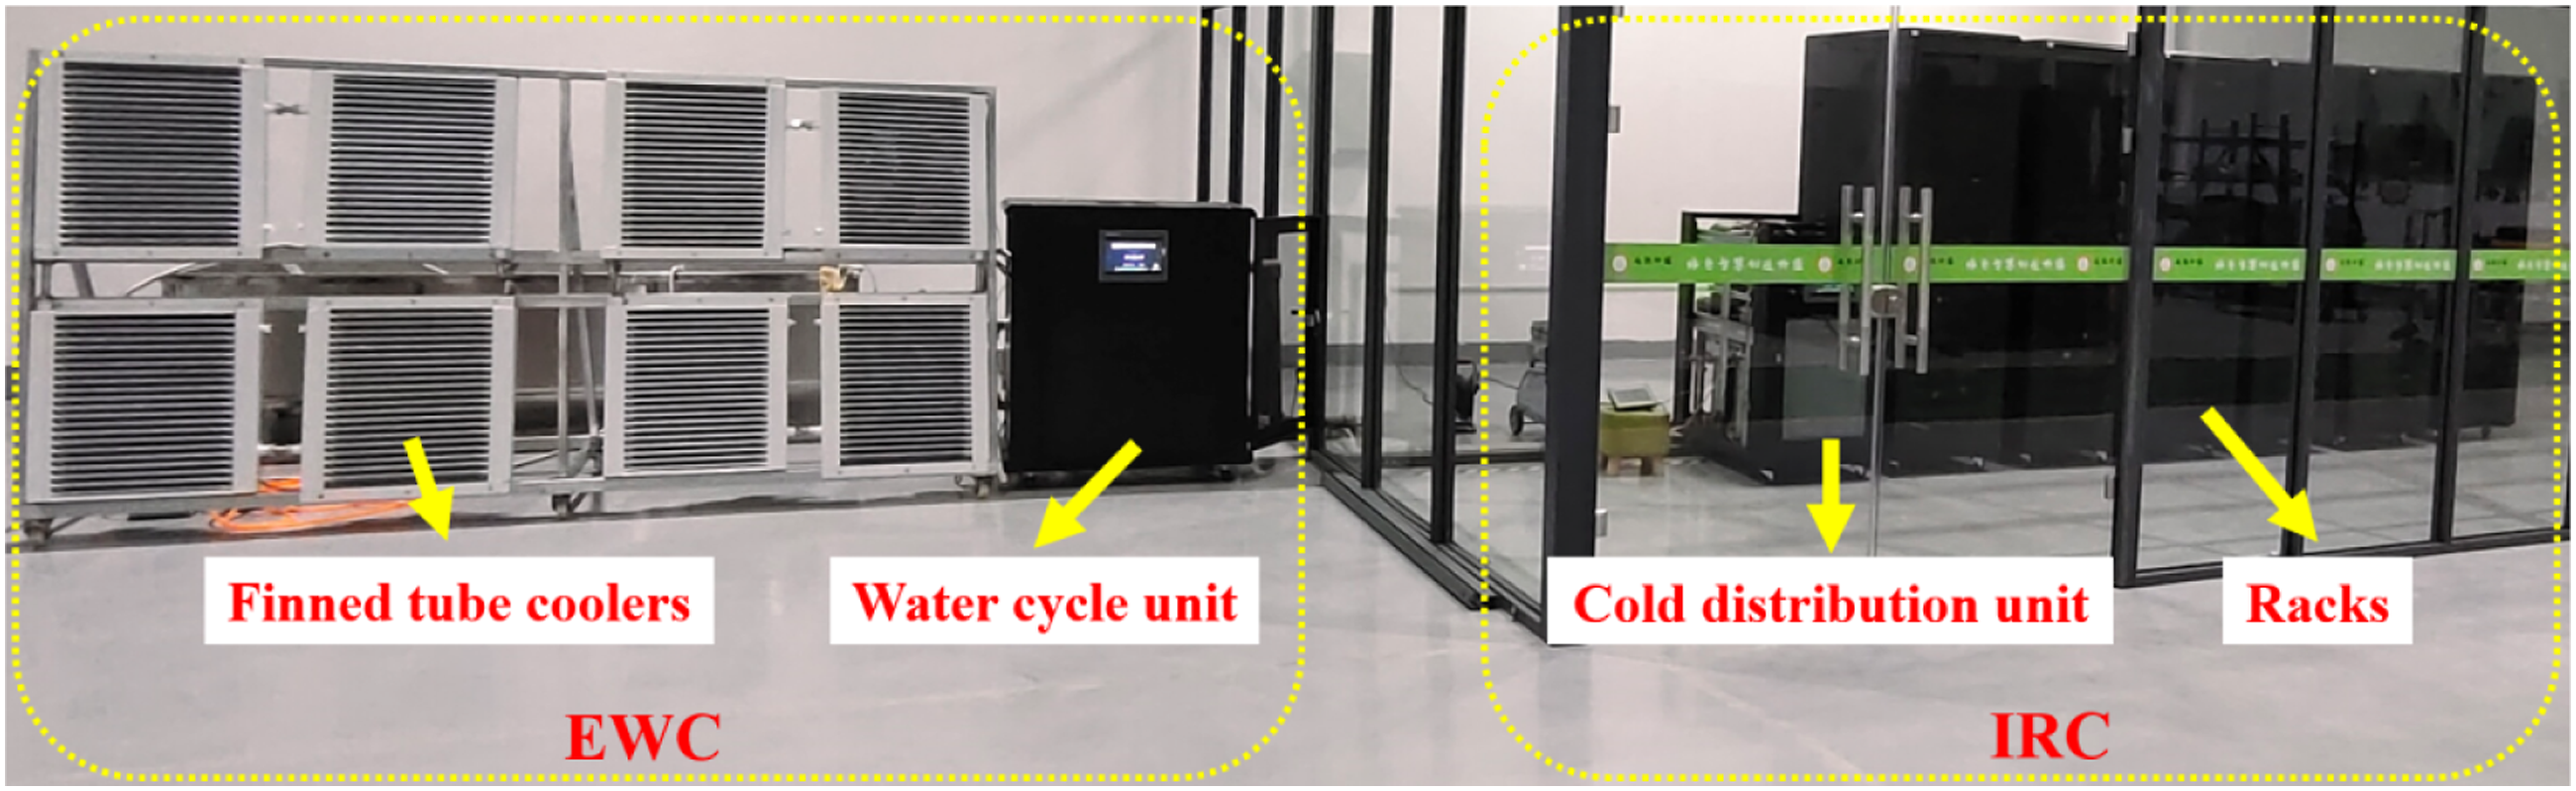
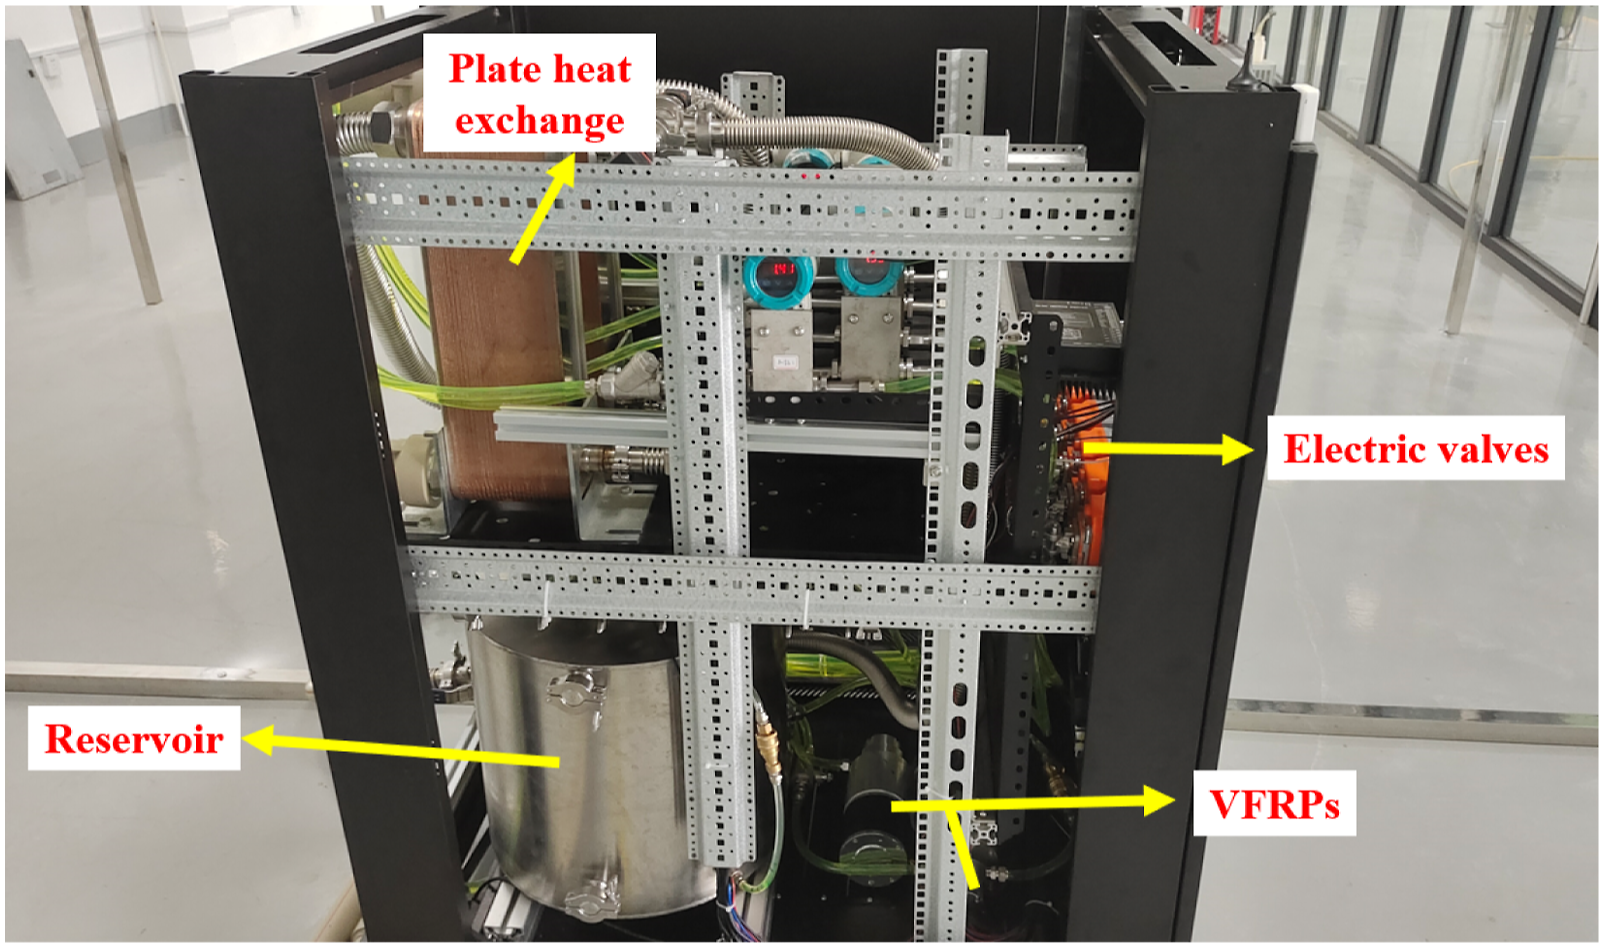
An actual DC with six 42U racks and a total of 120 servers was built in Xiangyang, China. The data room was cooled simultaneously using a PCTCS and a CRAC system. Figure 1 presents the heat balance diagram of the test DC. Considering the heat leakage from the PCTCS and the DC, the PCTCS primarily dissipates the majority of the CPUs’ heat, while the CRAC addresses all other cooling loads. These include heat leakage from the CPU via the PCTCS, cooling loads from other server components, heat leakage within the DC environment and lighting, amongst others. The DC room temperature was maintained at 25°C. The schematic and overall view of the PCTCS are displayed in Figures 2 and 3. The operation of the PCTCS involves two cycles, namely, an internal refrigerant cycle (IRC) and an external water cycle (EWC), wherein heat is exchanged through a plate heat exchanger. The IRC and the plate heat exchanger are placed indoors, and the EWC is placed outdoors. As displayed in Figures 2–4, to achieve a modular design, the main components of the IRC excluding the racks and main components of the EWC excluding the finned tube coolers are integrated into a cold distribution unit and a water cycle unit, respectively. Heat balance diagram of the test DC. Schematic of the PCTCS. Photograph of the PCTCS. Photograph of the cold distribution unit.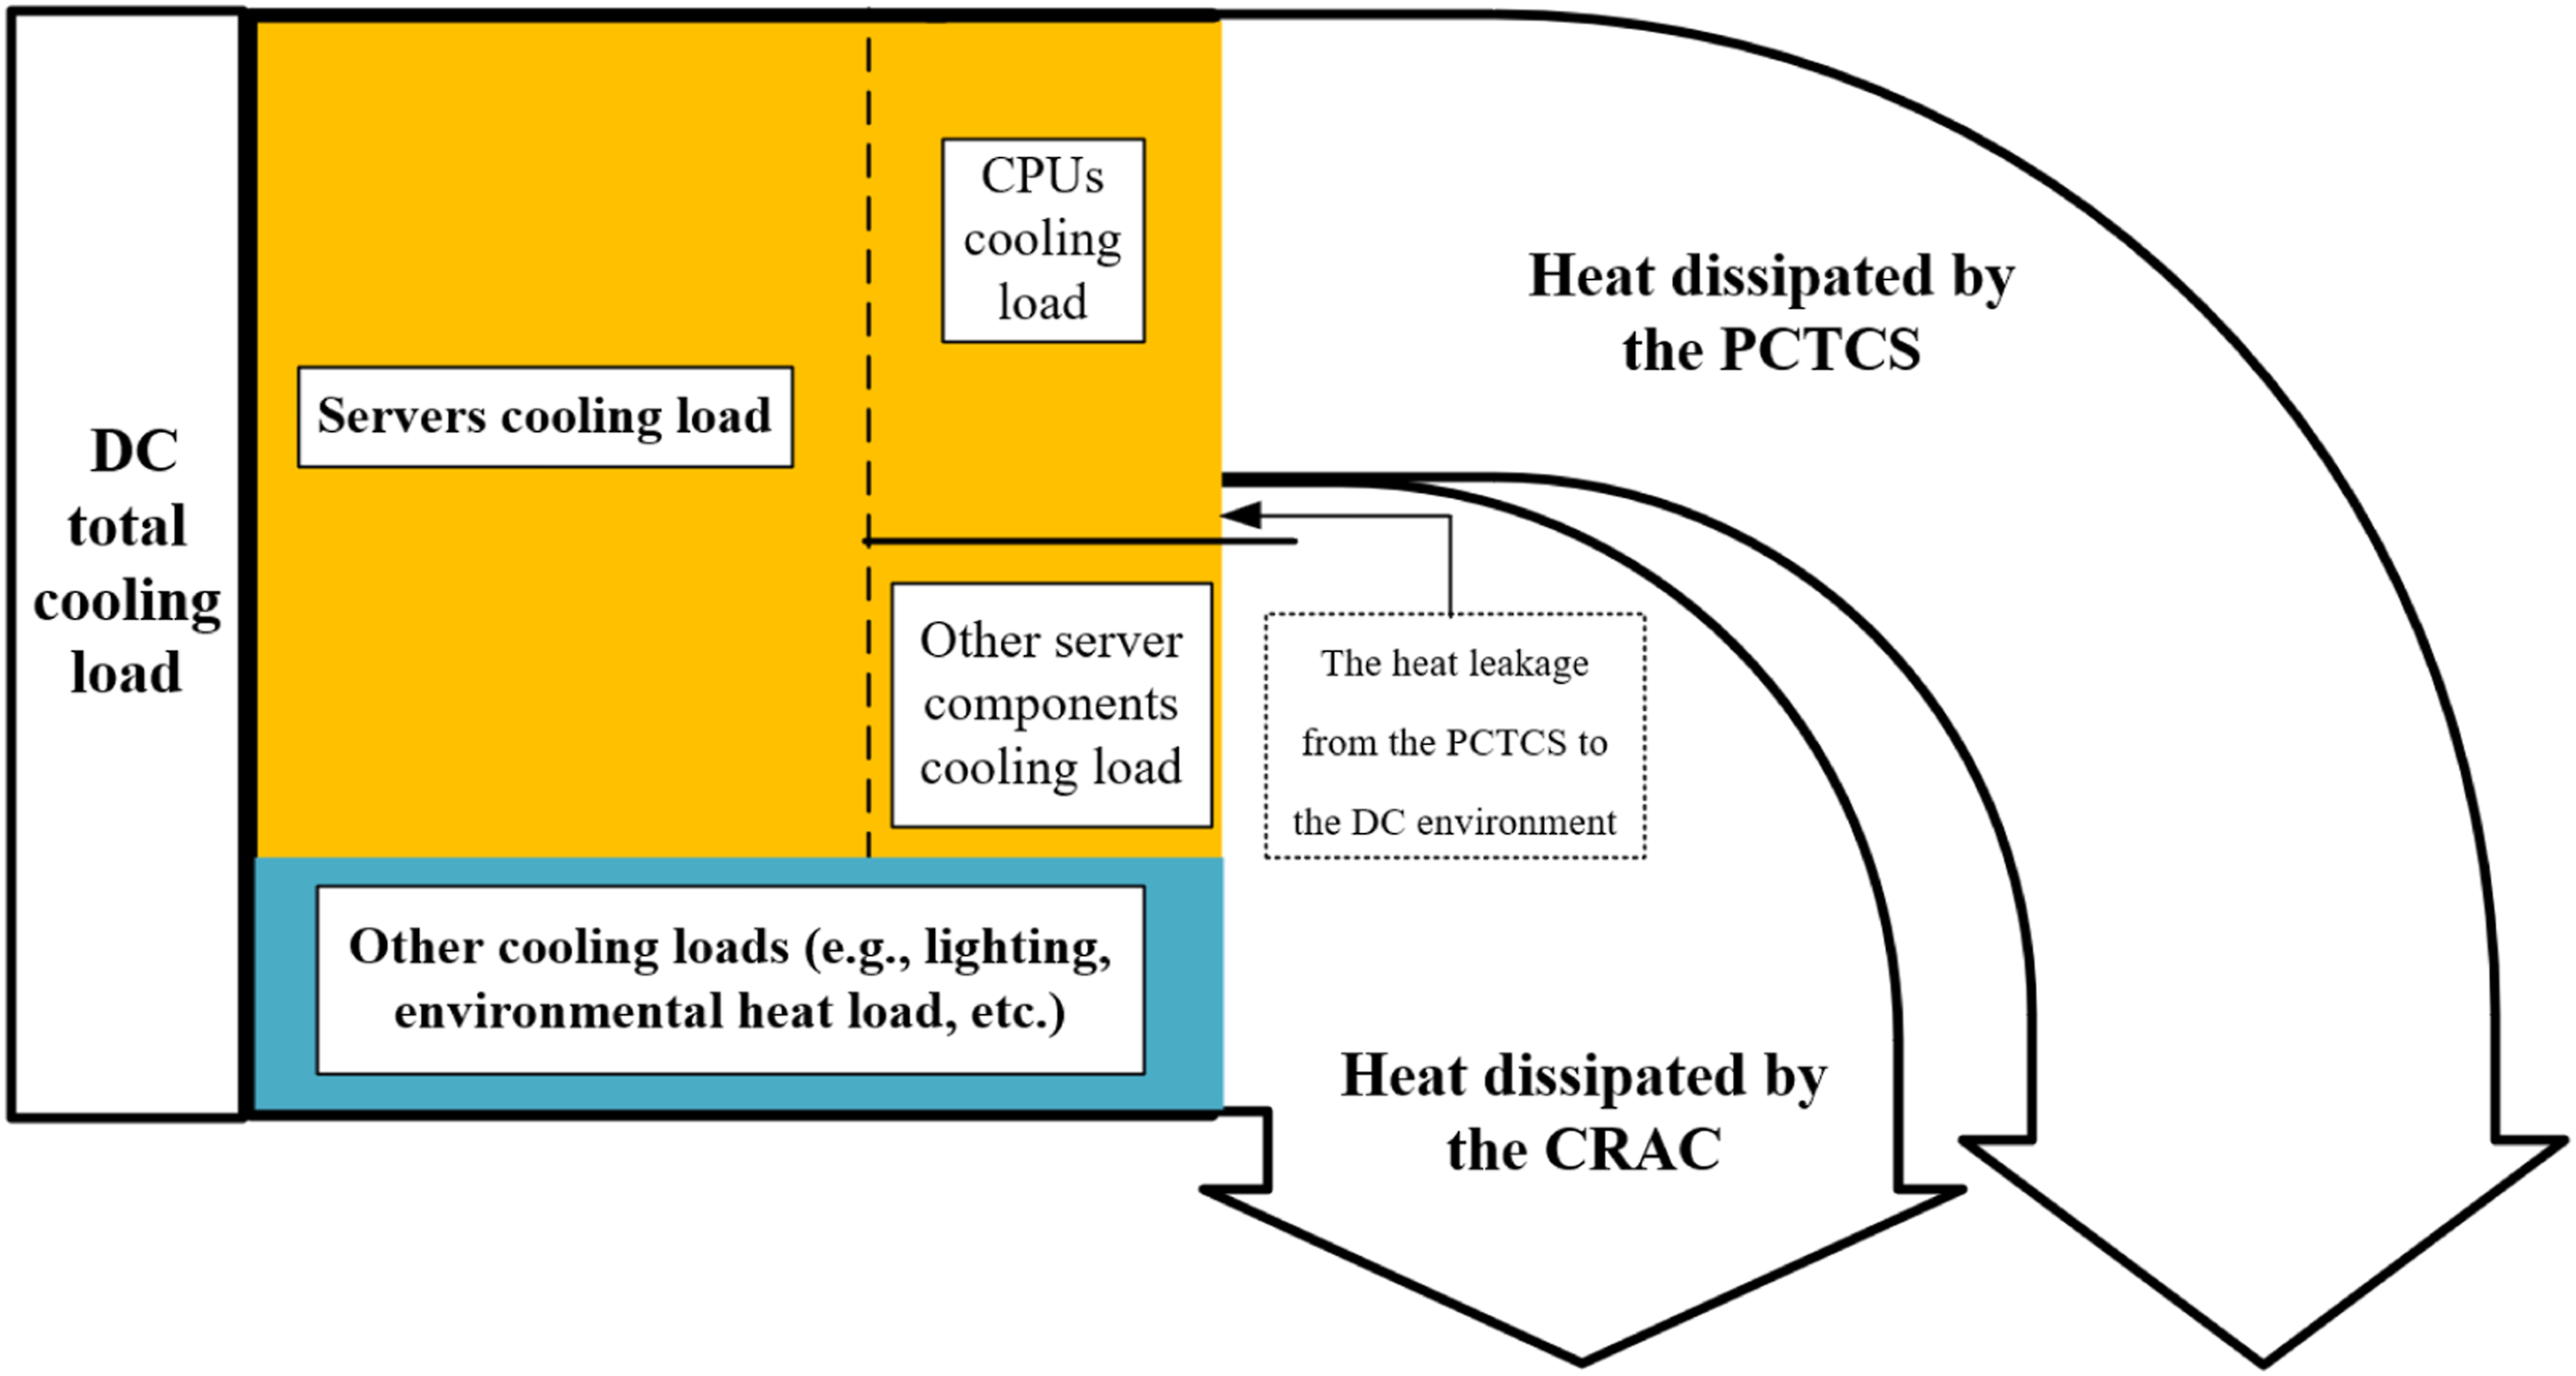
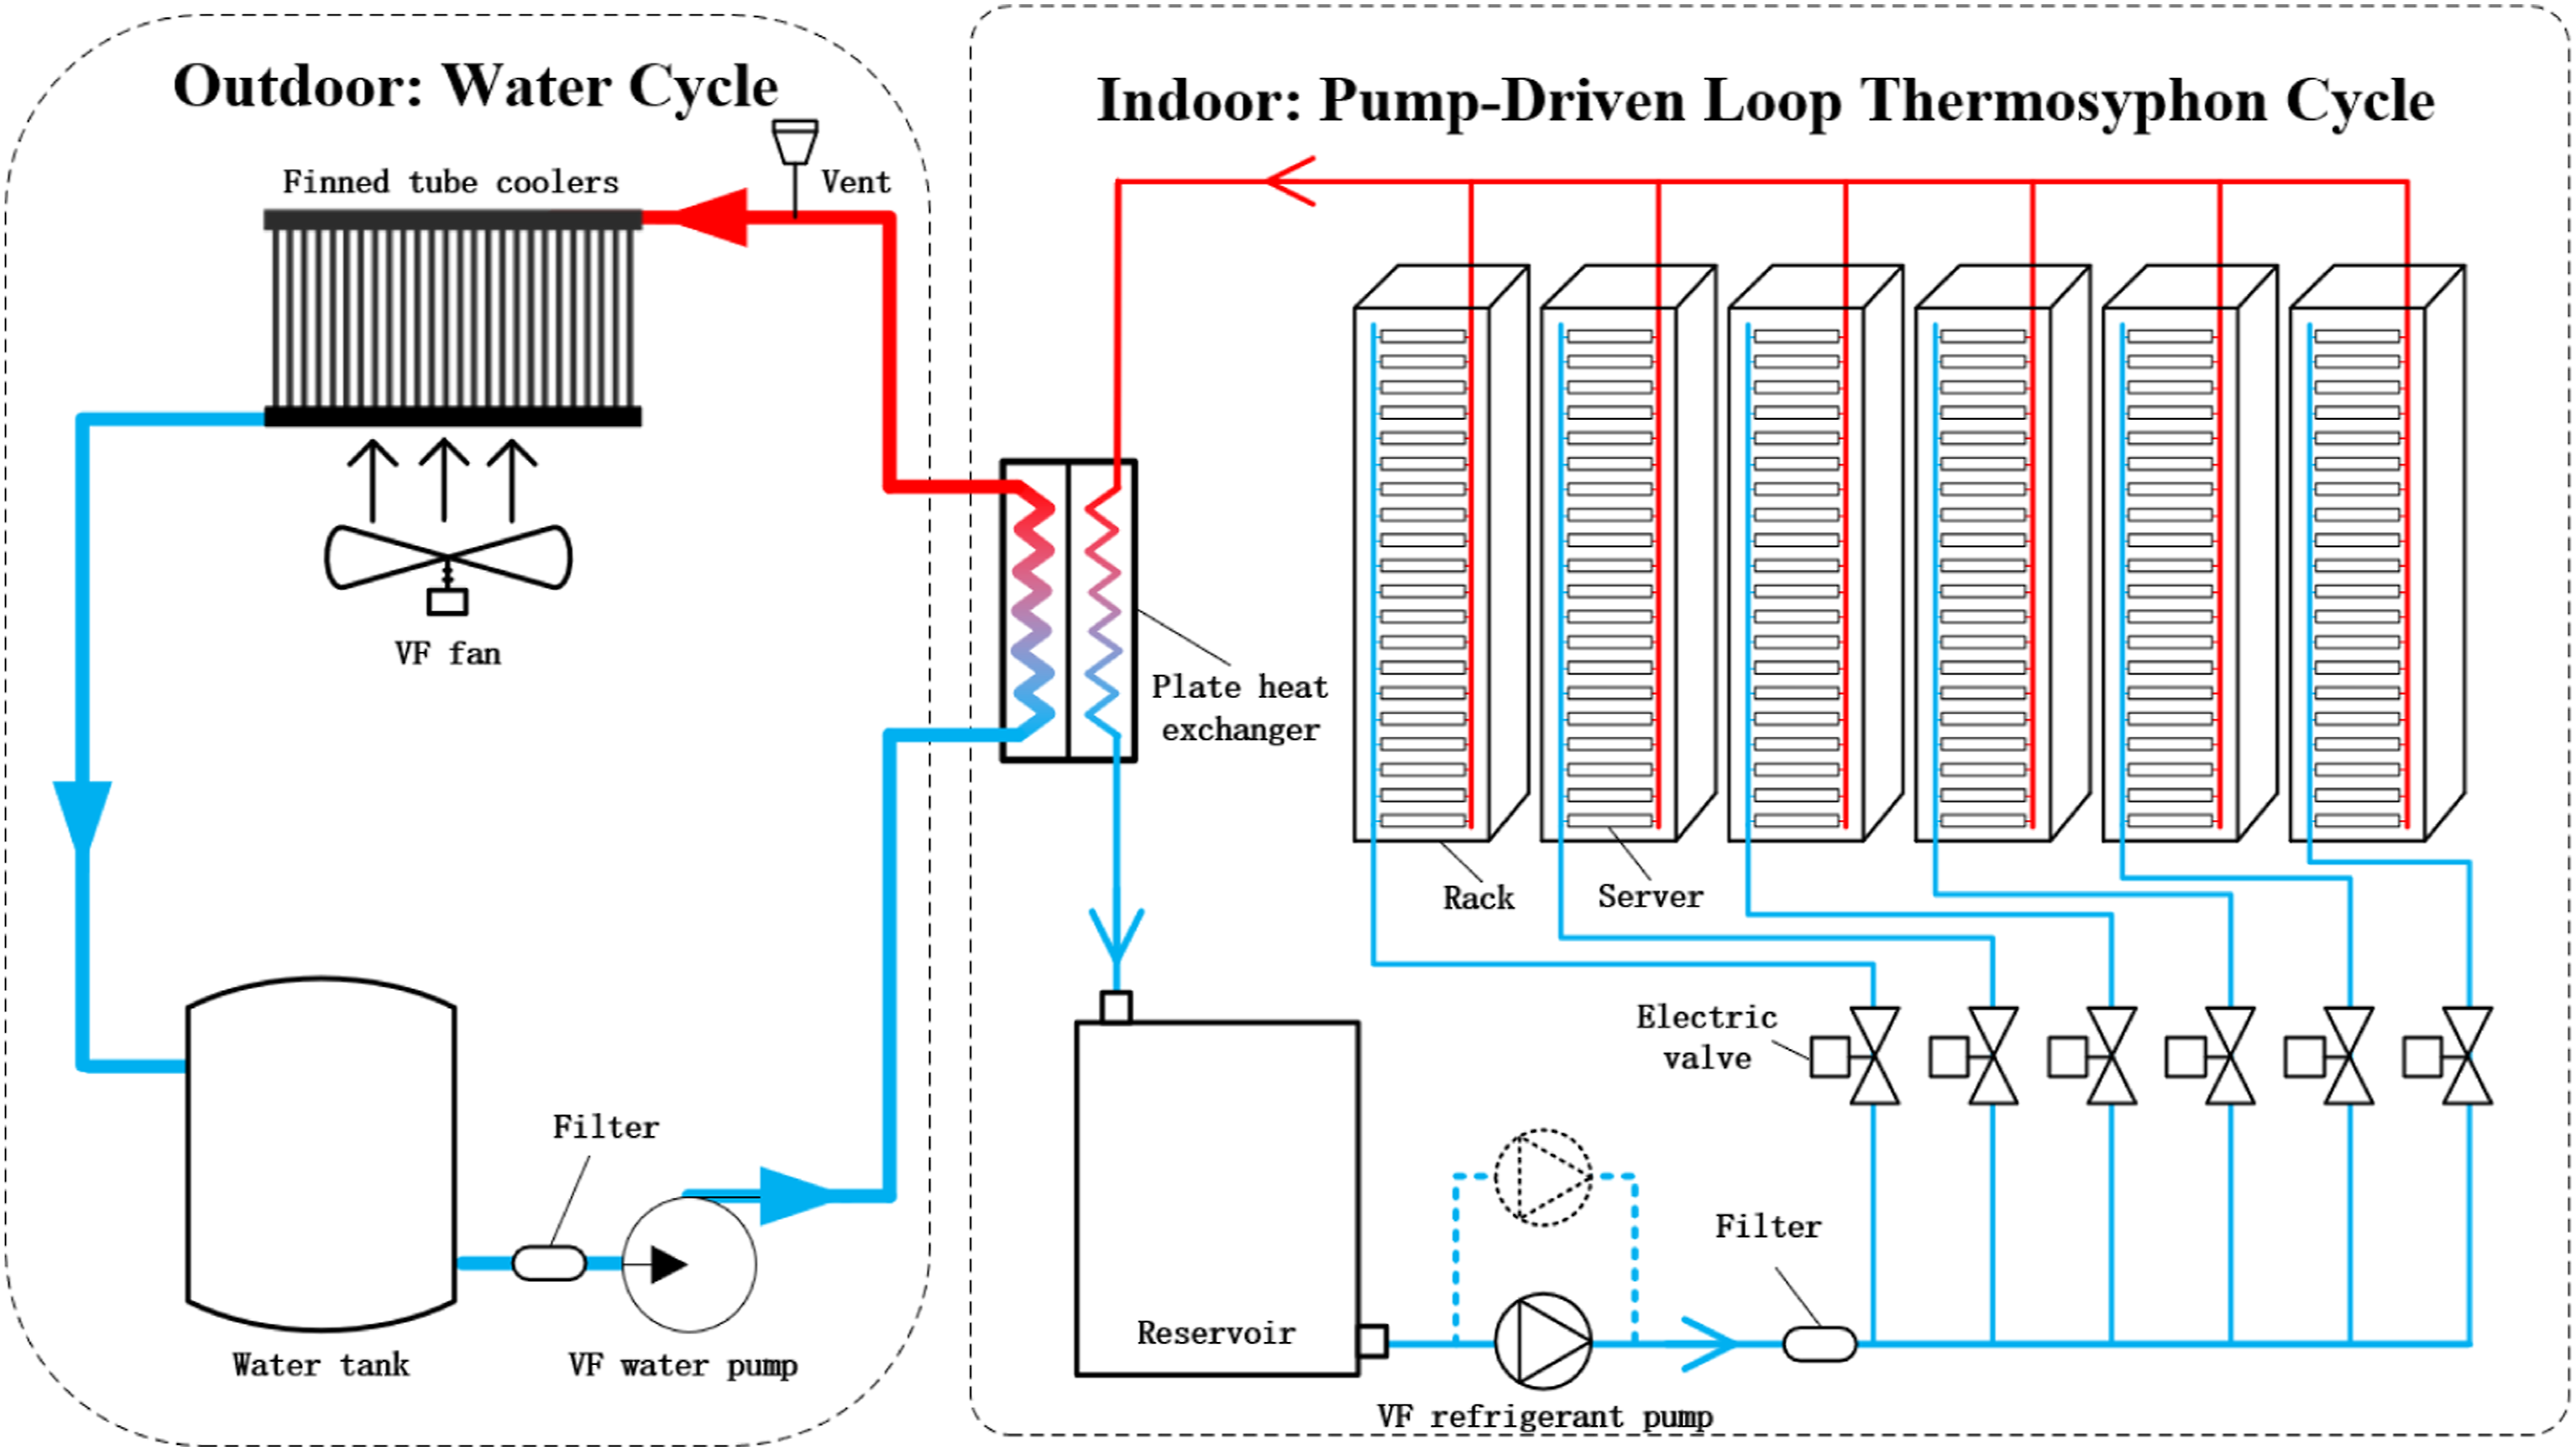
For the safety of servers and operation and maintenance personnel, the IRC employs a non-conductive, non-toxic refrigerant with a low operating pressure and a boiling point above 30°C at atmospheric pressure. A 0.04 m3 refrigerant reservoir stabilizes the pressure in the IRC and stores excess low-temperature liquid refrigerant. The liquid refrigerant from the reservoir is pumped into mini-channel evaporators across six racks using two mutually redundant variable-frequency refrigerant pumps (VFRPs). The liquid refrigerant within the mini-channel evaporators evaporates into a gas–liquid two-phase refrigerant, which then condenses into the liquid phase in the plate heat exchanger before flowing back to the reservoir. In the EWC, cooling water from a 0.08 m3 tank is first pumped to the plate heat exchanger by a variable-frequency water pump. The water then flows to eight finned tube coolers in sequence and finally returns to the water tank. The heat transfer path of the PCTCS is illustrated in Figure 5. The refrigerant in the mini-channel evaporators absorbs heat from the CPUs and transfers it to the plate heat exchanger via the IRC. The cooling water in the EWC subsequently absorbs this heat in the plate heat exchanger, before dissipating it into the ambient air through convection in the finned tube coolers. Throughout this process, the CPUs and ambient air exhibit the highest and lowest temperatures, respectively. Diagram of the heat transfer path.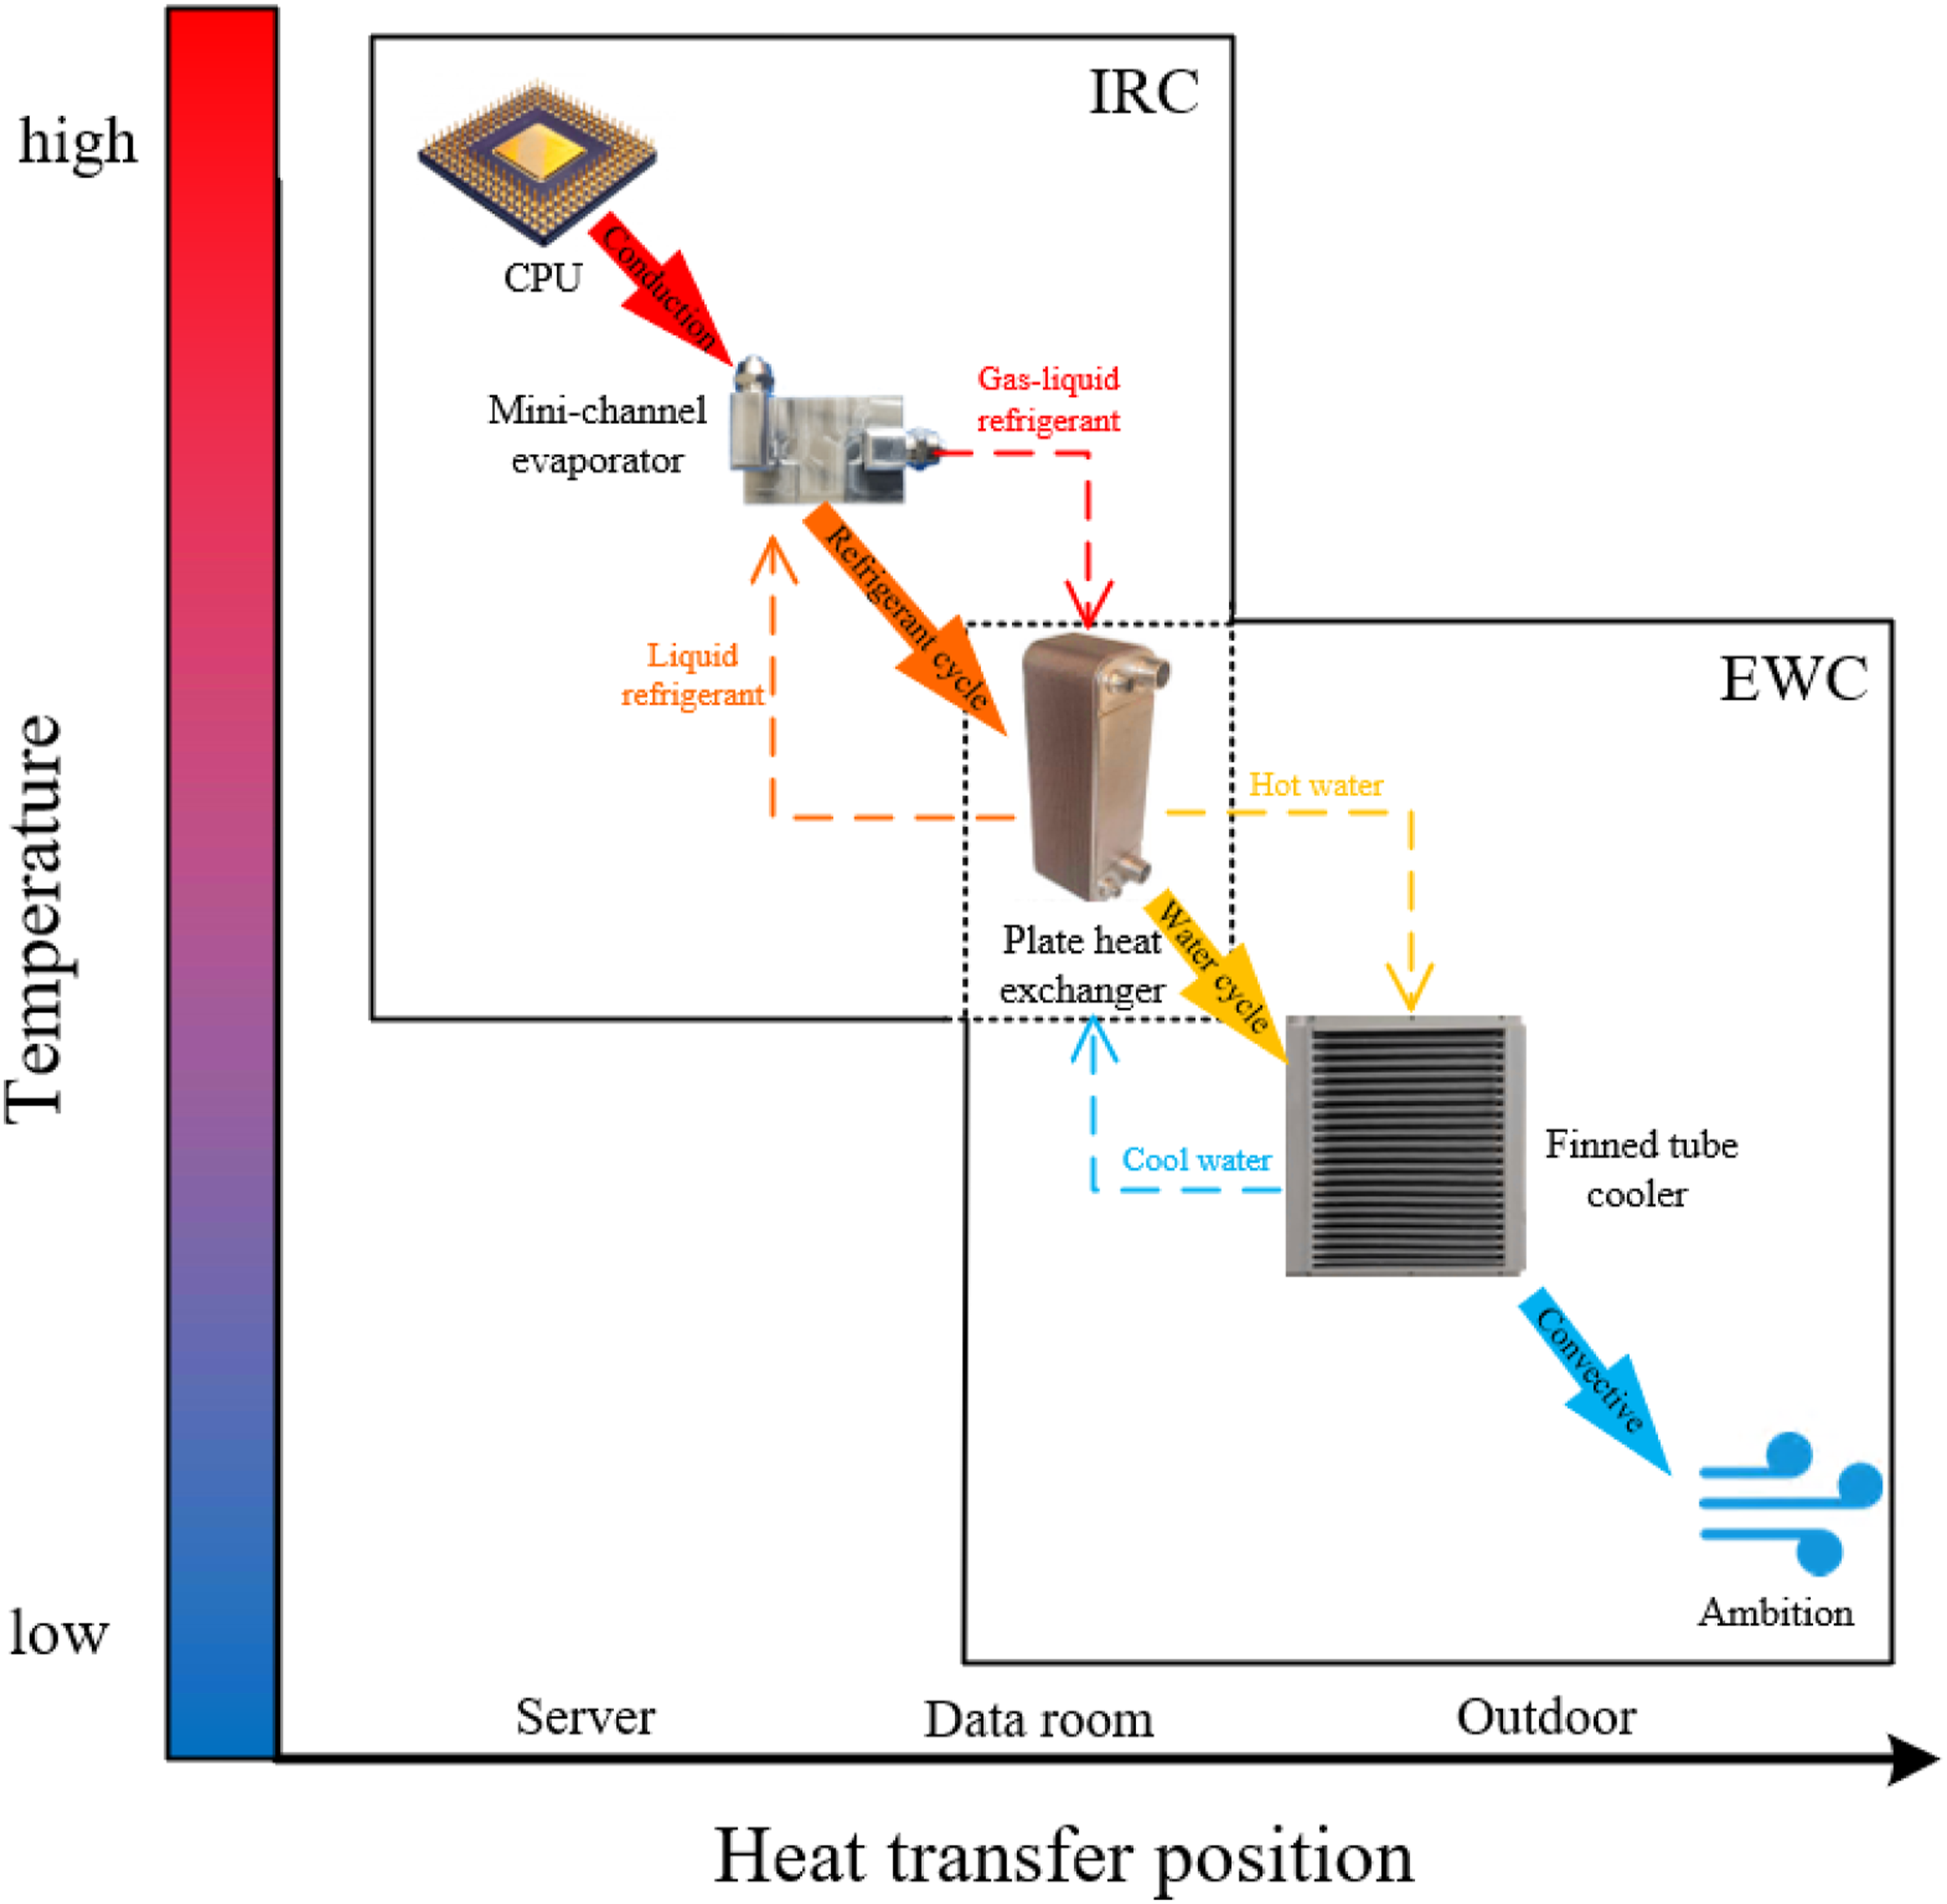
Experimental methods
The PCTCS was originally developed for the functional demonstration, in which only a few sensors were installed to record some critical data. To grasp more details about the performance and characteristics of the PCTCS, some modifications were made to the PCTCS and the data room. We added several sensors to the PCTCS and modified its controllers and other components and only the first rack (i.e. 20 servers) was operated during the experiment.
Experimental setup
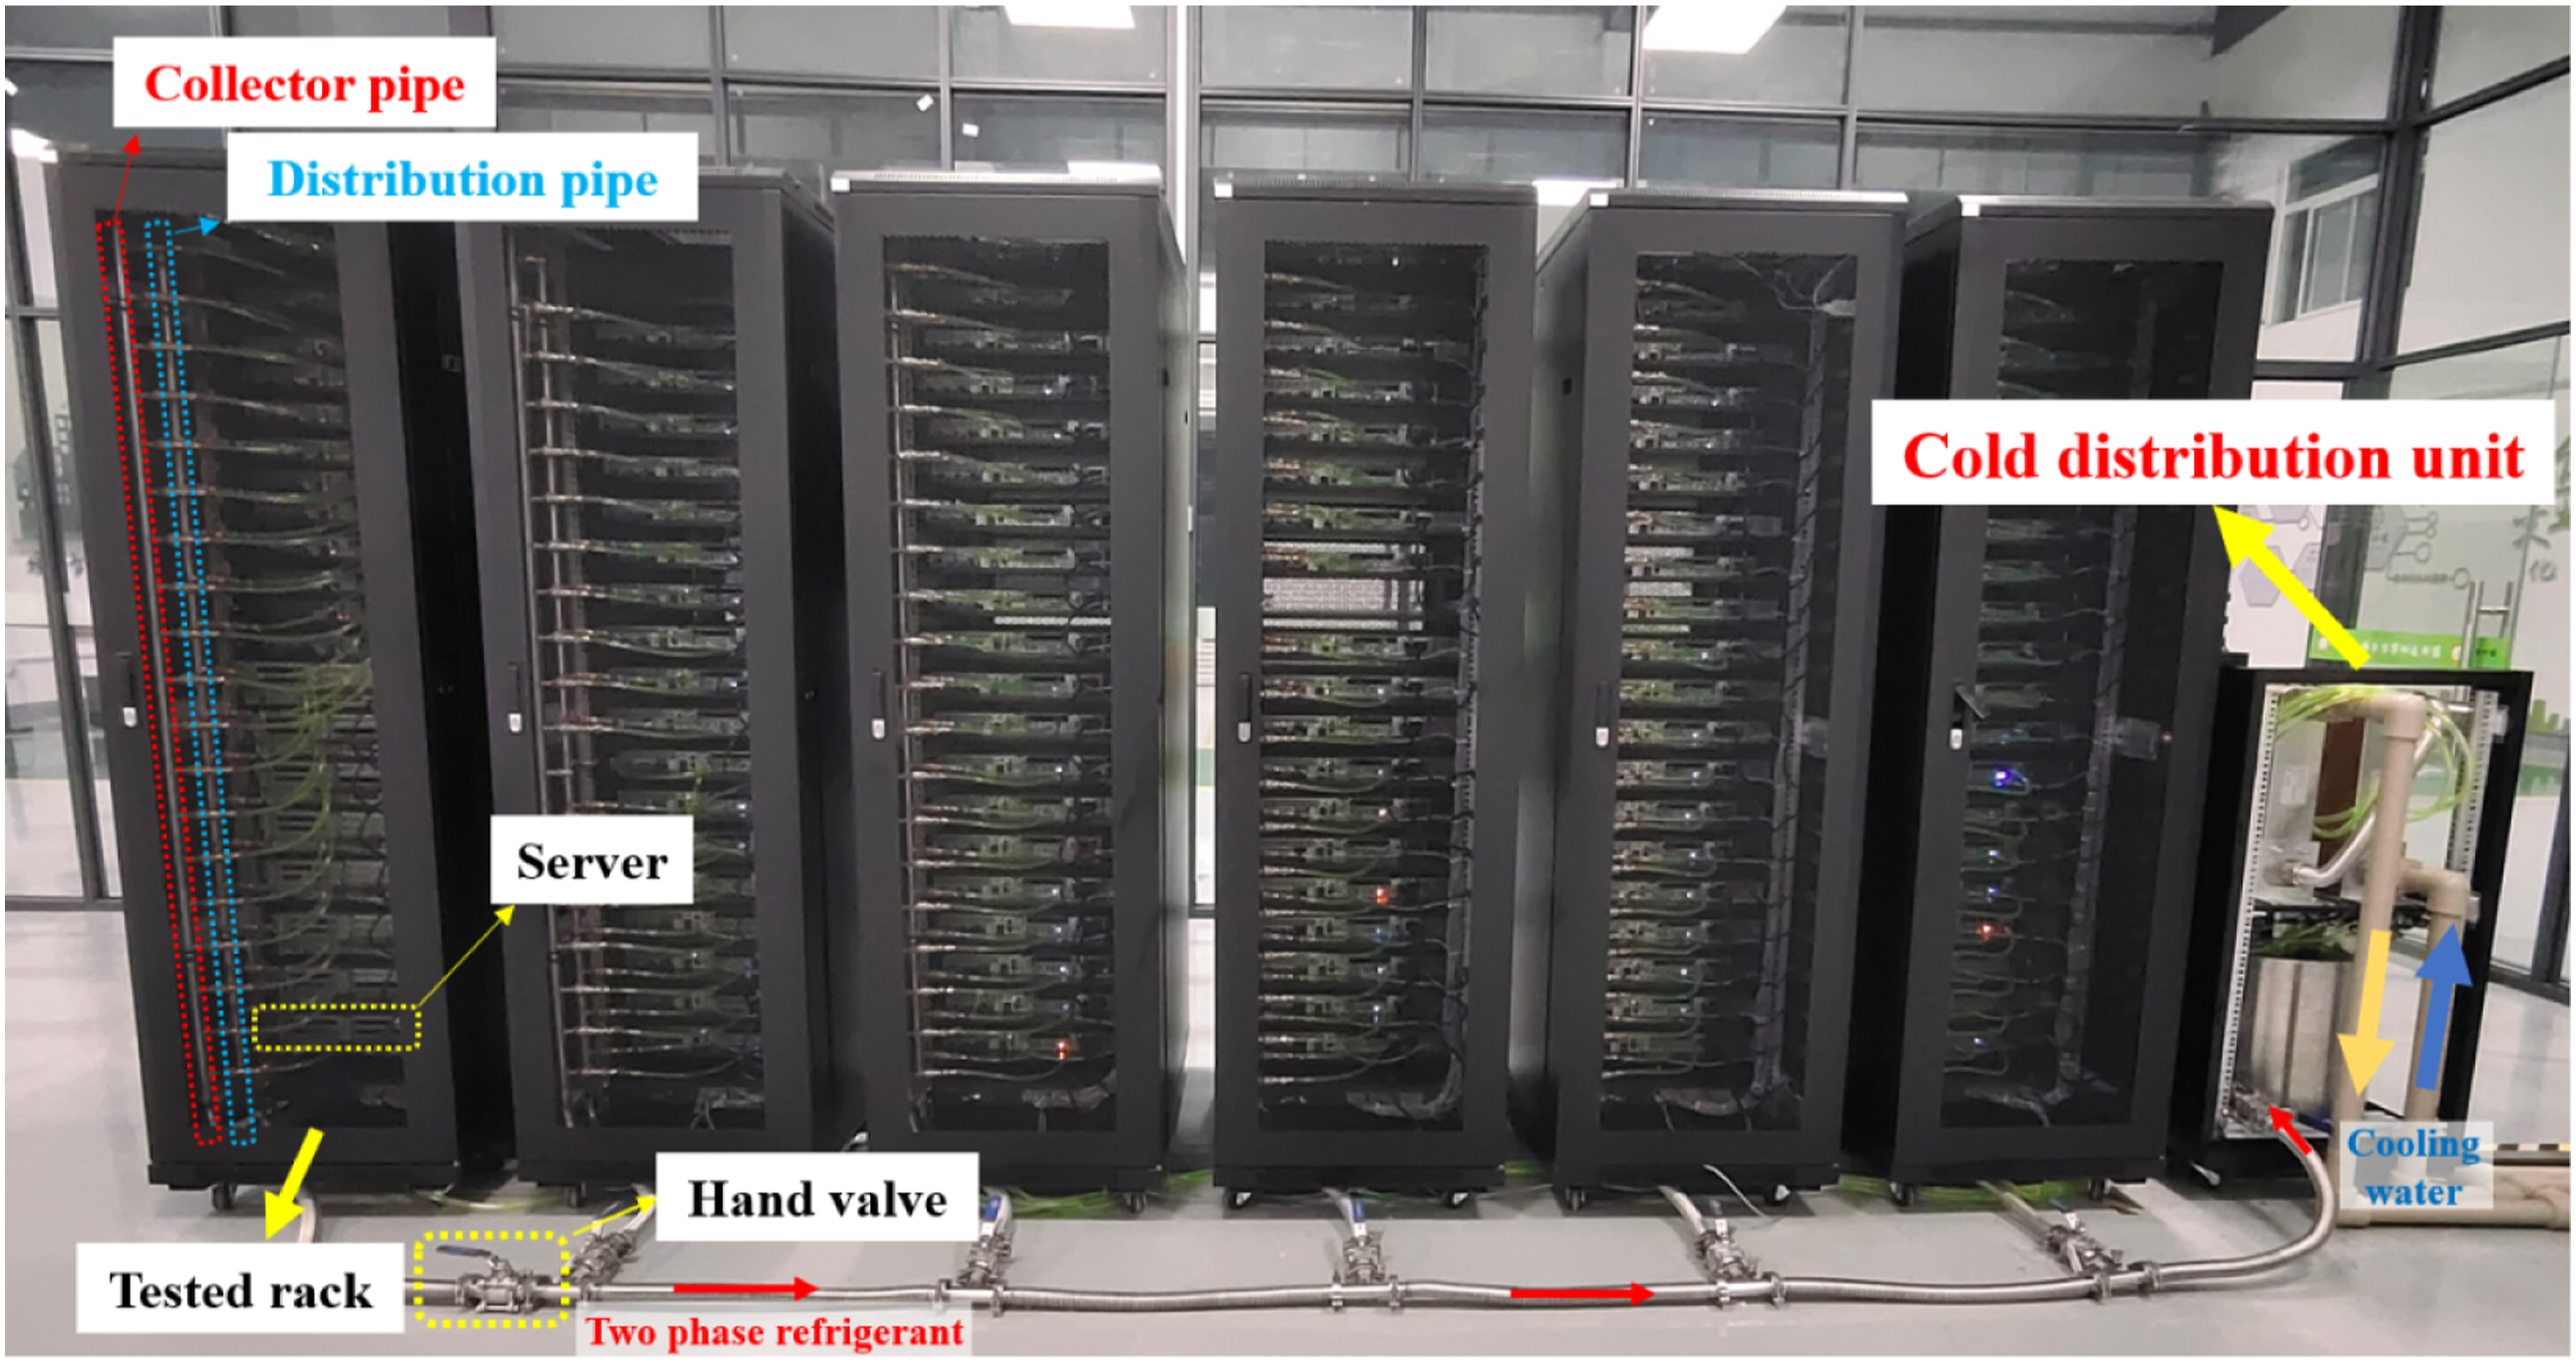
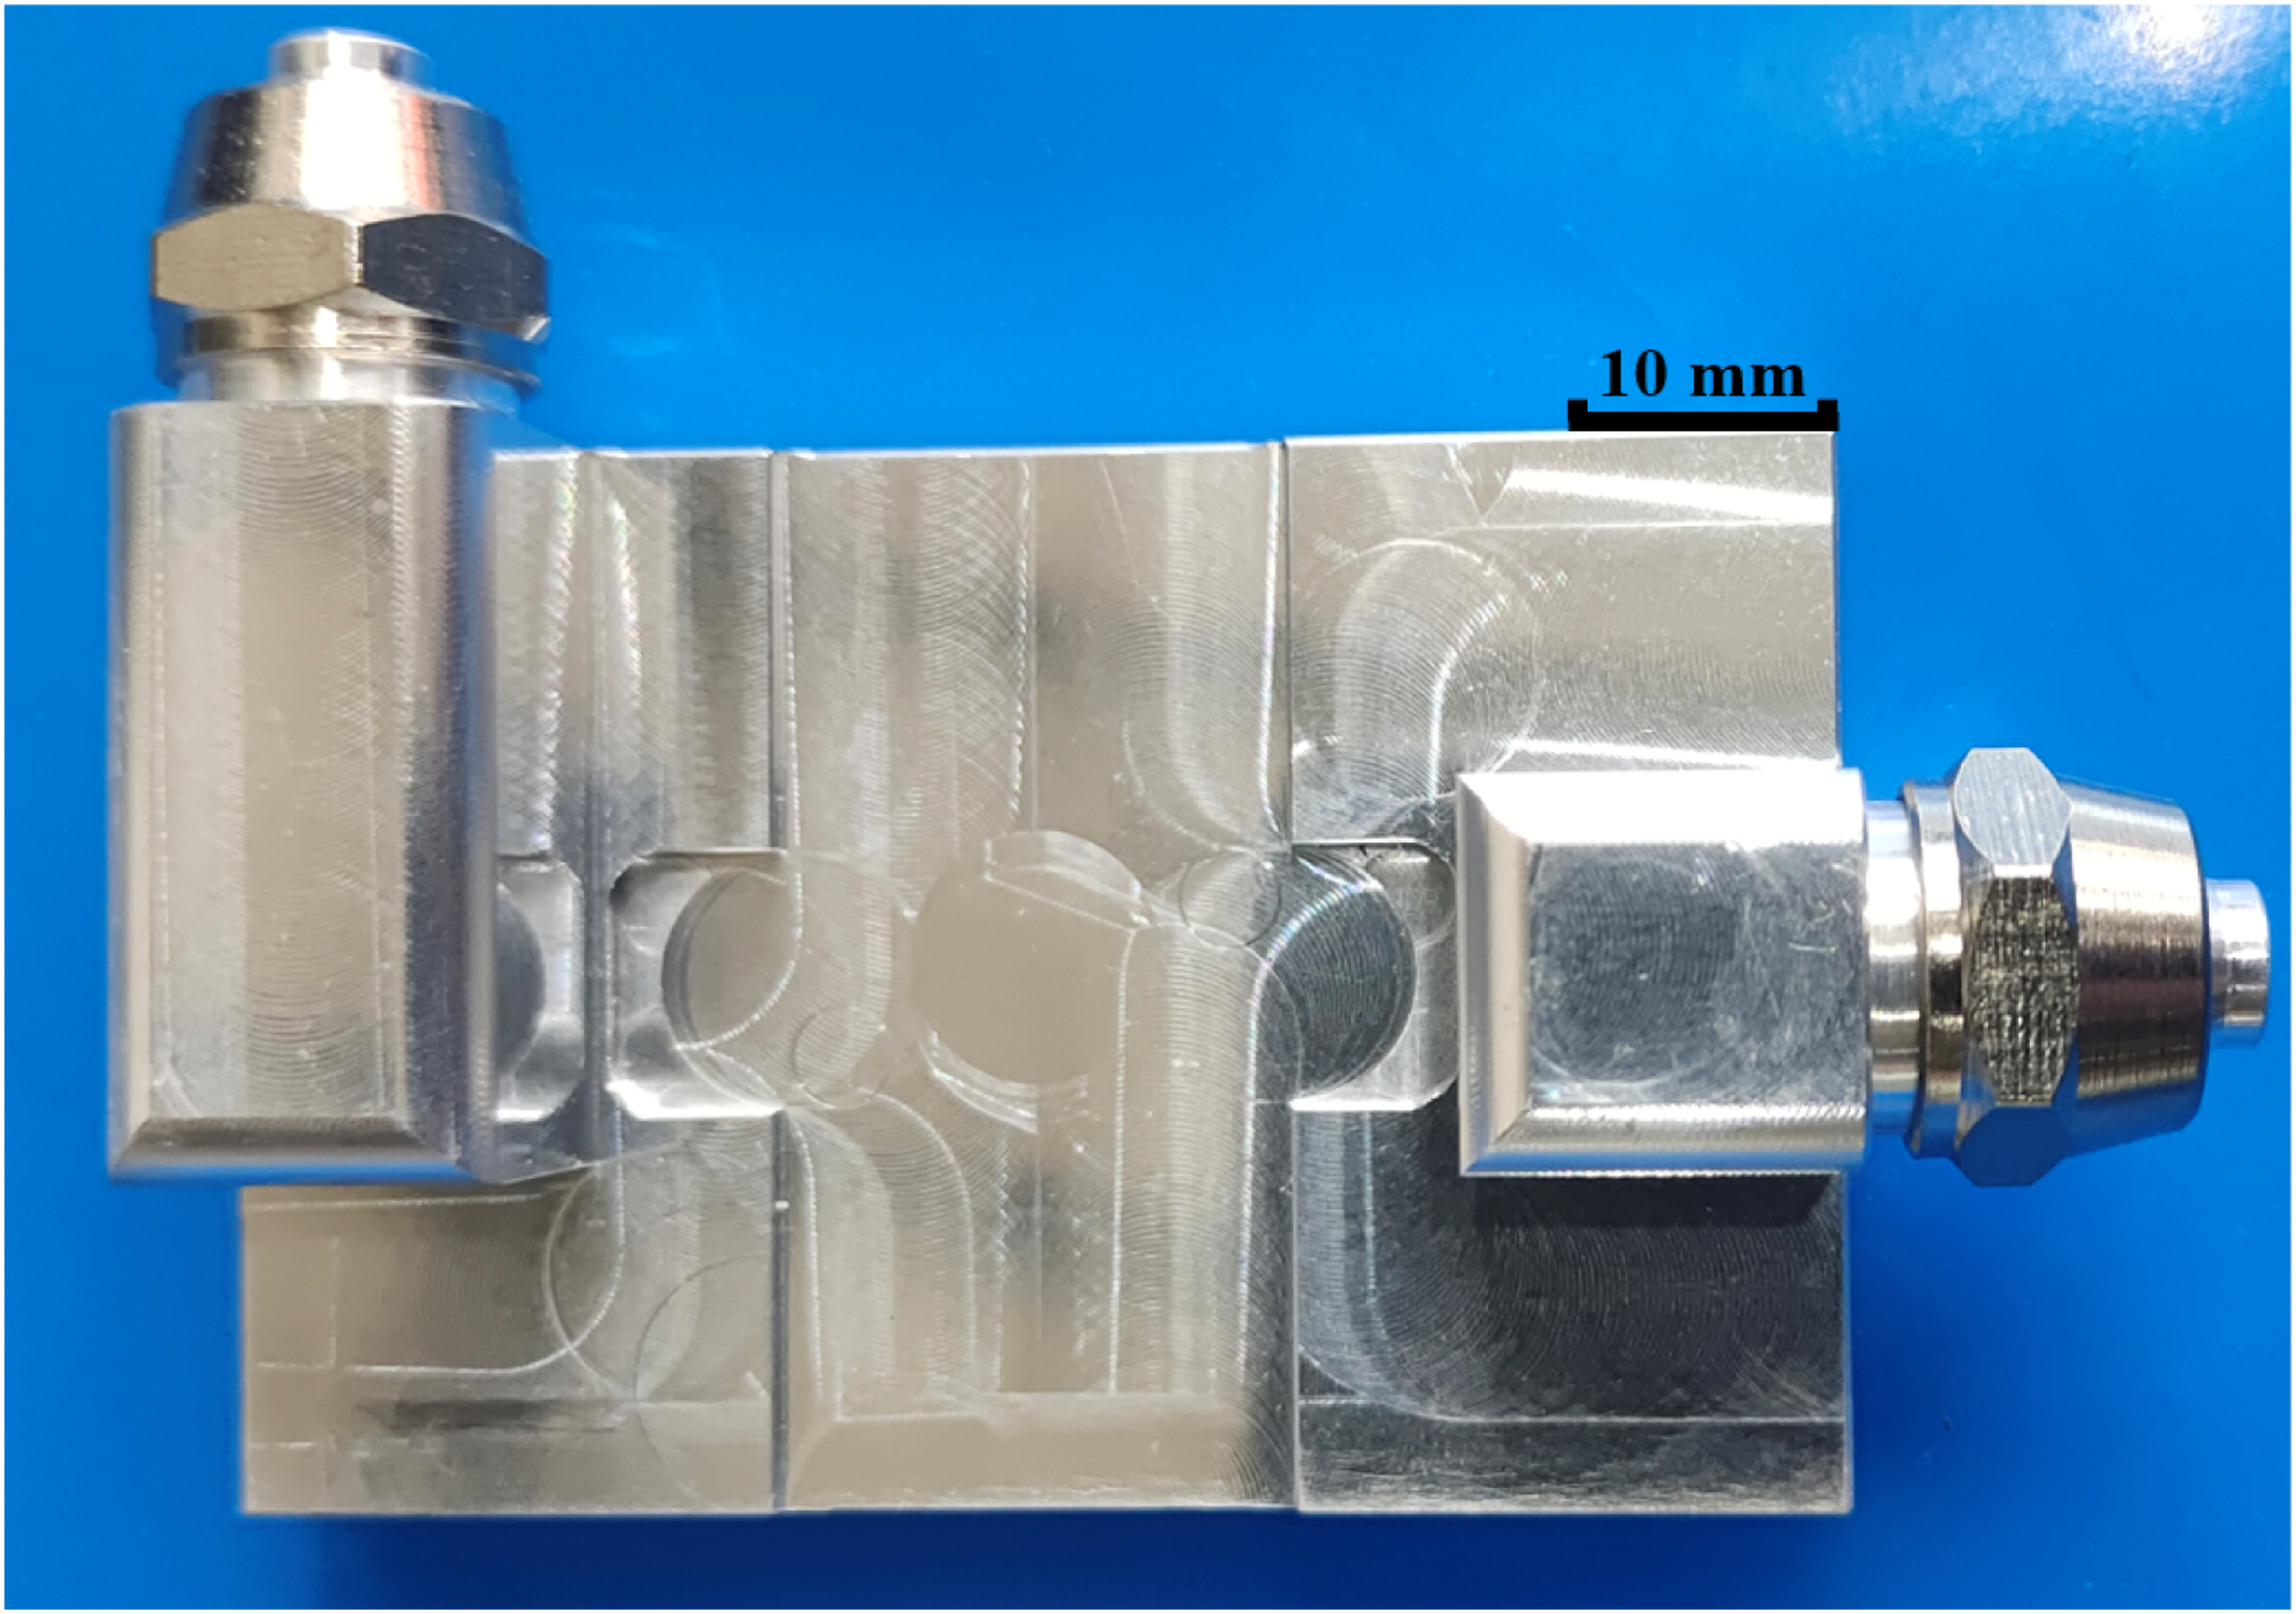
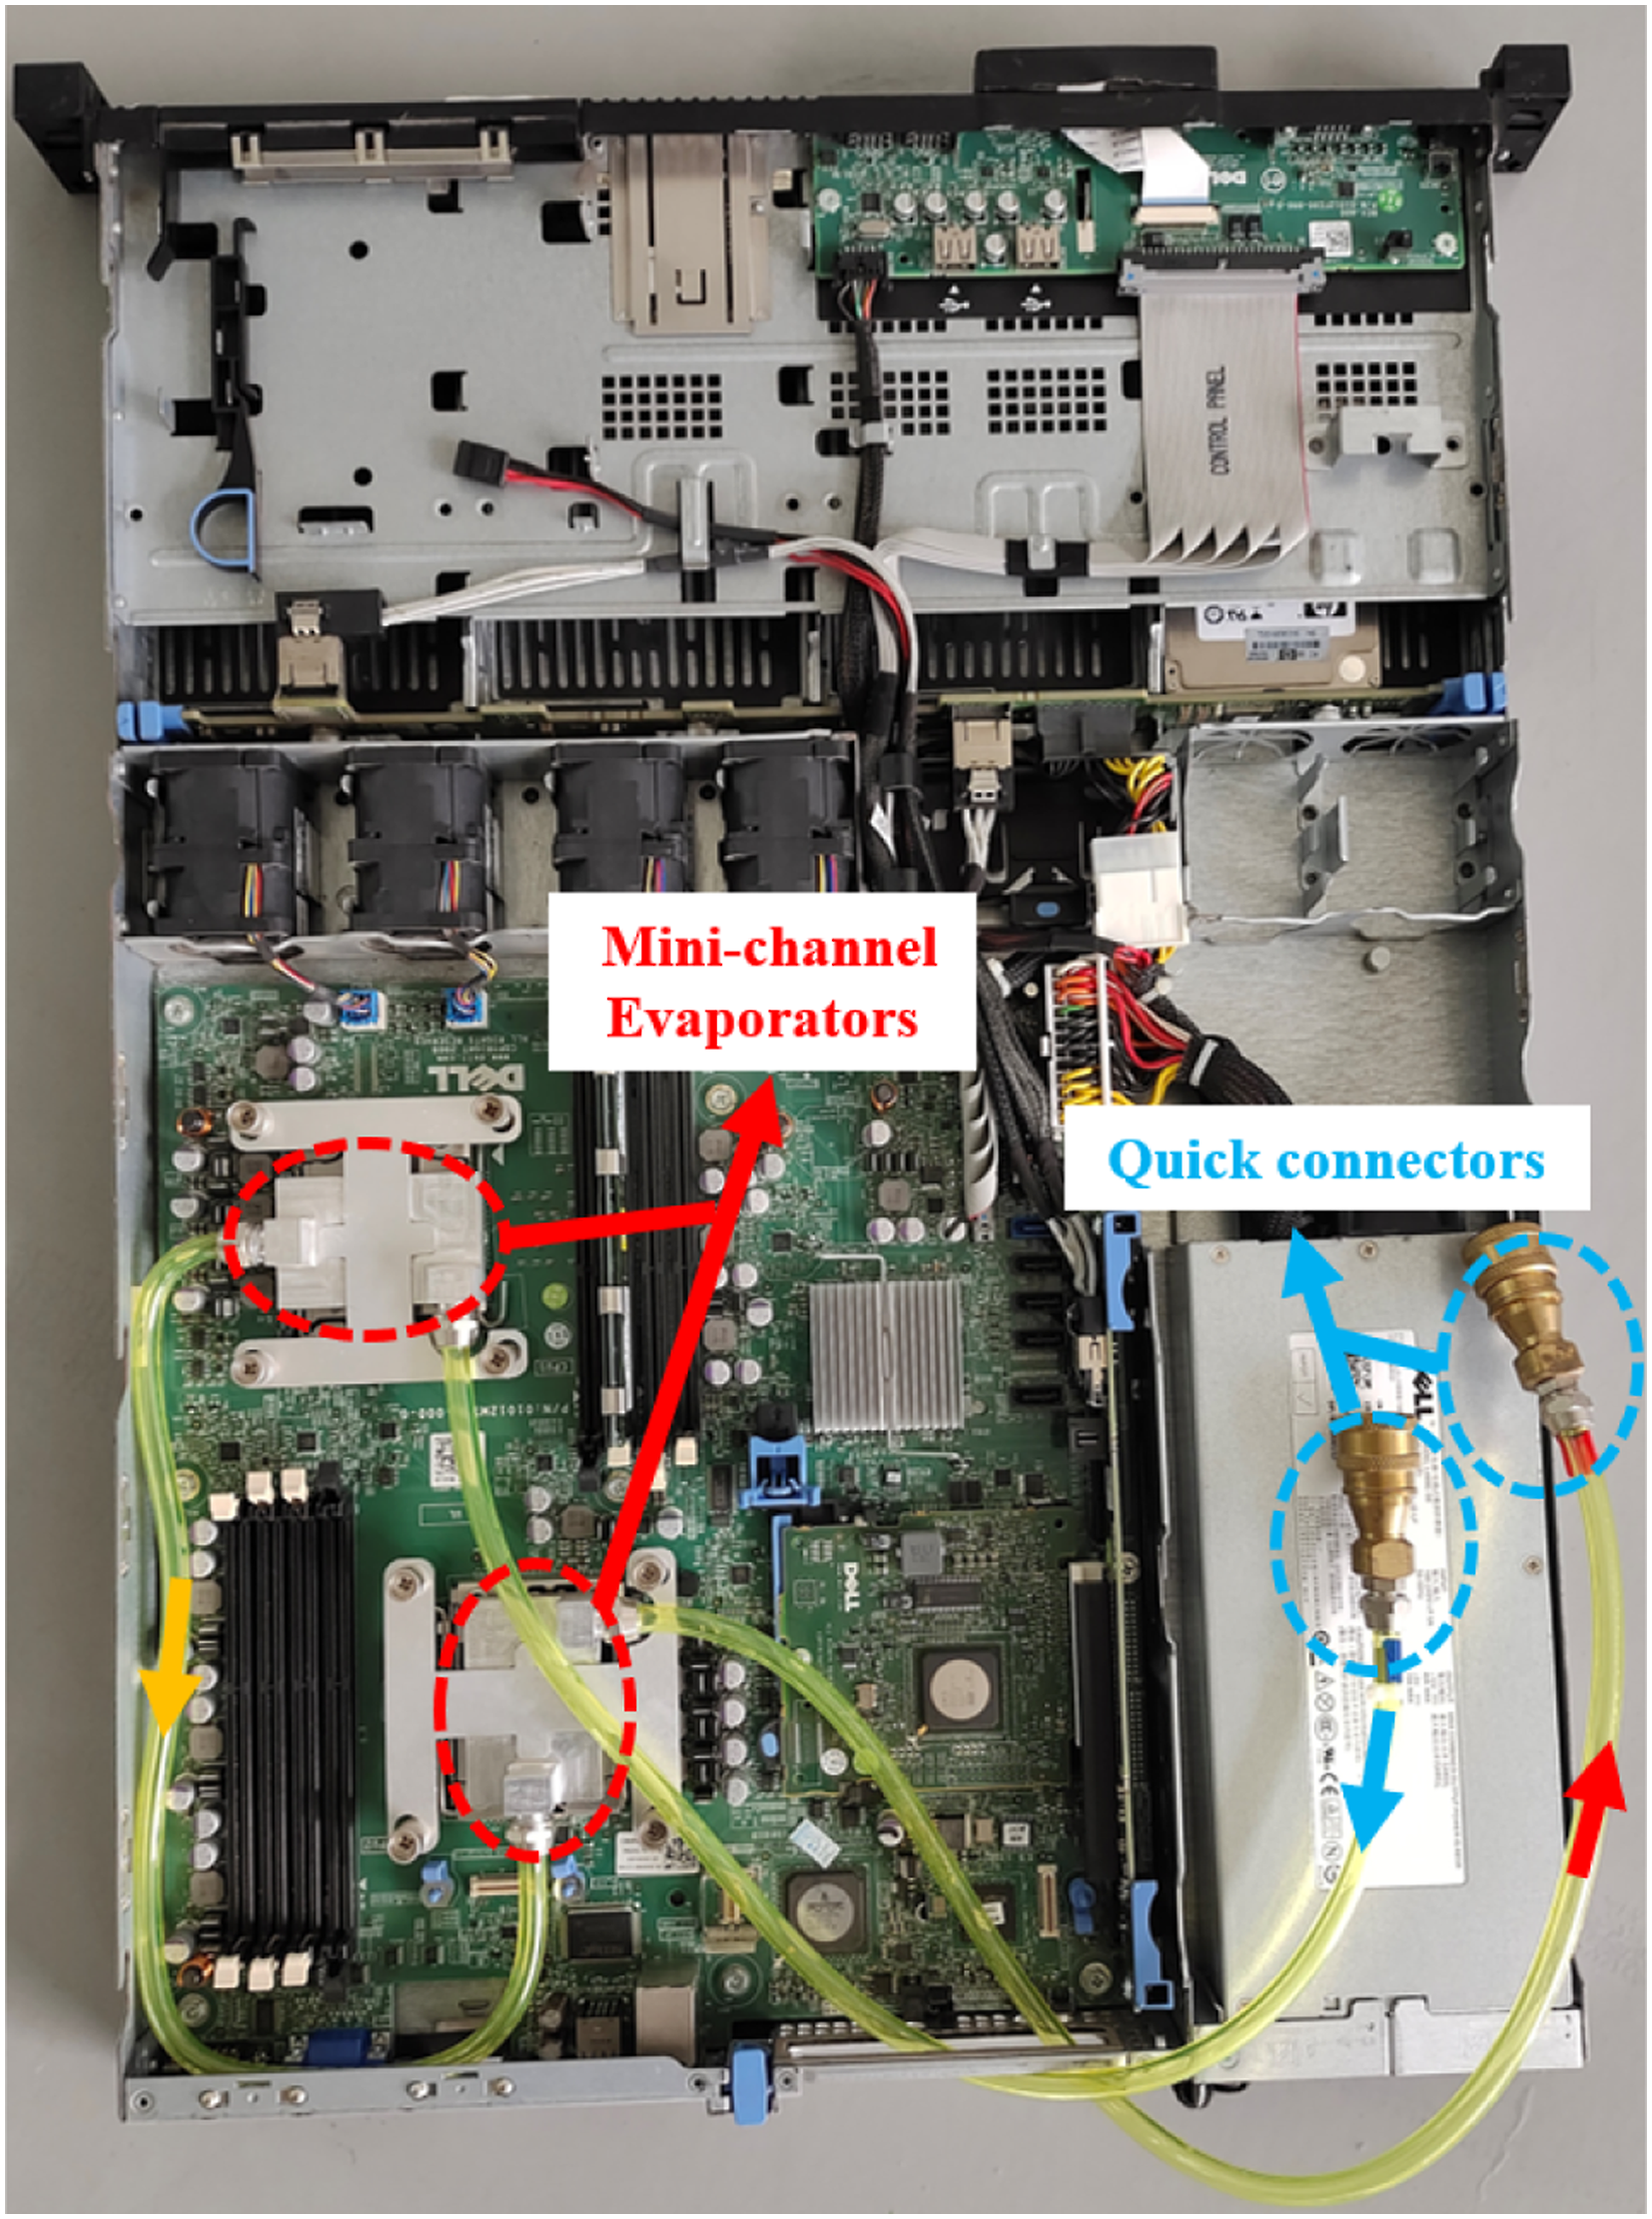
Figures 6 and 7 display a schematic and a photograph, respectively, of the PCTCS experimental setup. As illustrated in Figures 6–8, the liquid refrigerant in the IRC entered the first rack and was evenly distributed through a pipe to 20 servers placed at different heights. Each server had two mini-channel evaporators that were connected in series through transparent polyurethane hoses, with each evaporator attached to the surface of the CPU. Then, the liquid refrigerant entered each server and in turn absorbed the heat from the first and the second CPU and evaporated into the gas–liquid two-phase flow in the two mini-channel evaporators. These are the key components of the PCTCS that are carefully designed in particular, as shown in Figure 8. The evaporator except inlet and outlet joints was 55 mm long, 44 mm wide and 5 mm high. To reduce the thermal resistance between the CPUs and the mini-channel evaporators, the surface of the CPUs and the bottom surface of the evaporators were tightly attached and coated with thermally conductive silicone grease. Thereafter, the two-phase refrigerant flowed from the servers through a collector pipe to the plate heat exchanger to condense. The reformation of the servers and the connection between the server internal pipeline and the mini-channel evaporators are illustrated in Figure 9. The two original air-cooled fin heat exchangers of the server CPUs were replaced with two mini-channel evaporators. The servers were connected to the distribution pipe and the collector pipe using self-sealing quick connectors, which enabled the rapid installation and disassembly of the servers without any leakage. Schematic of the PCTCS experimental setup. Photograph of the back of the data centre. Photograph of the mini-channel evaporator. Photograph of the server interior.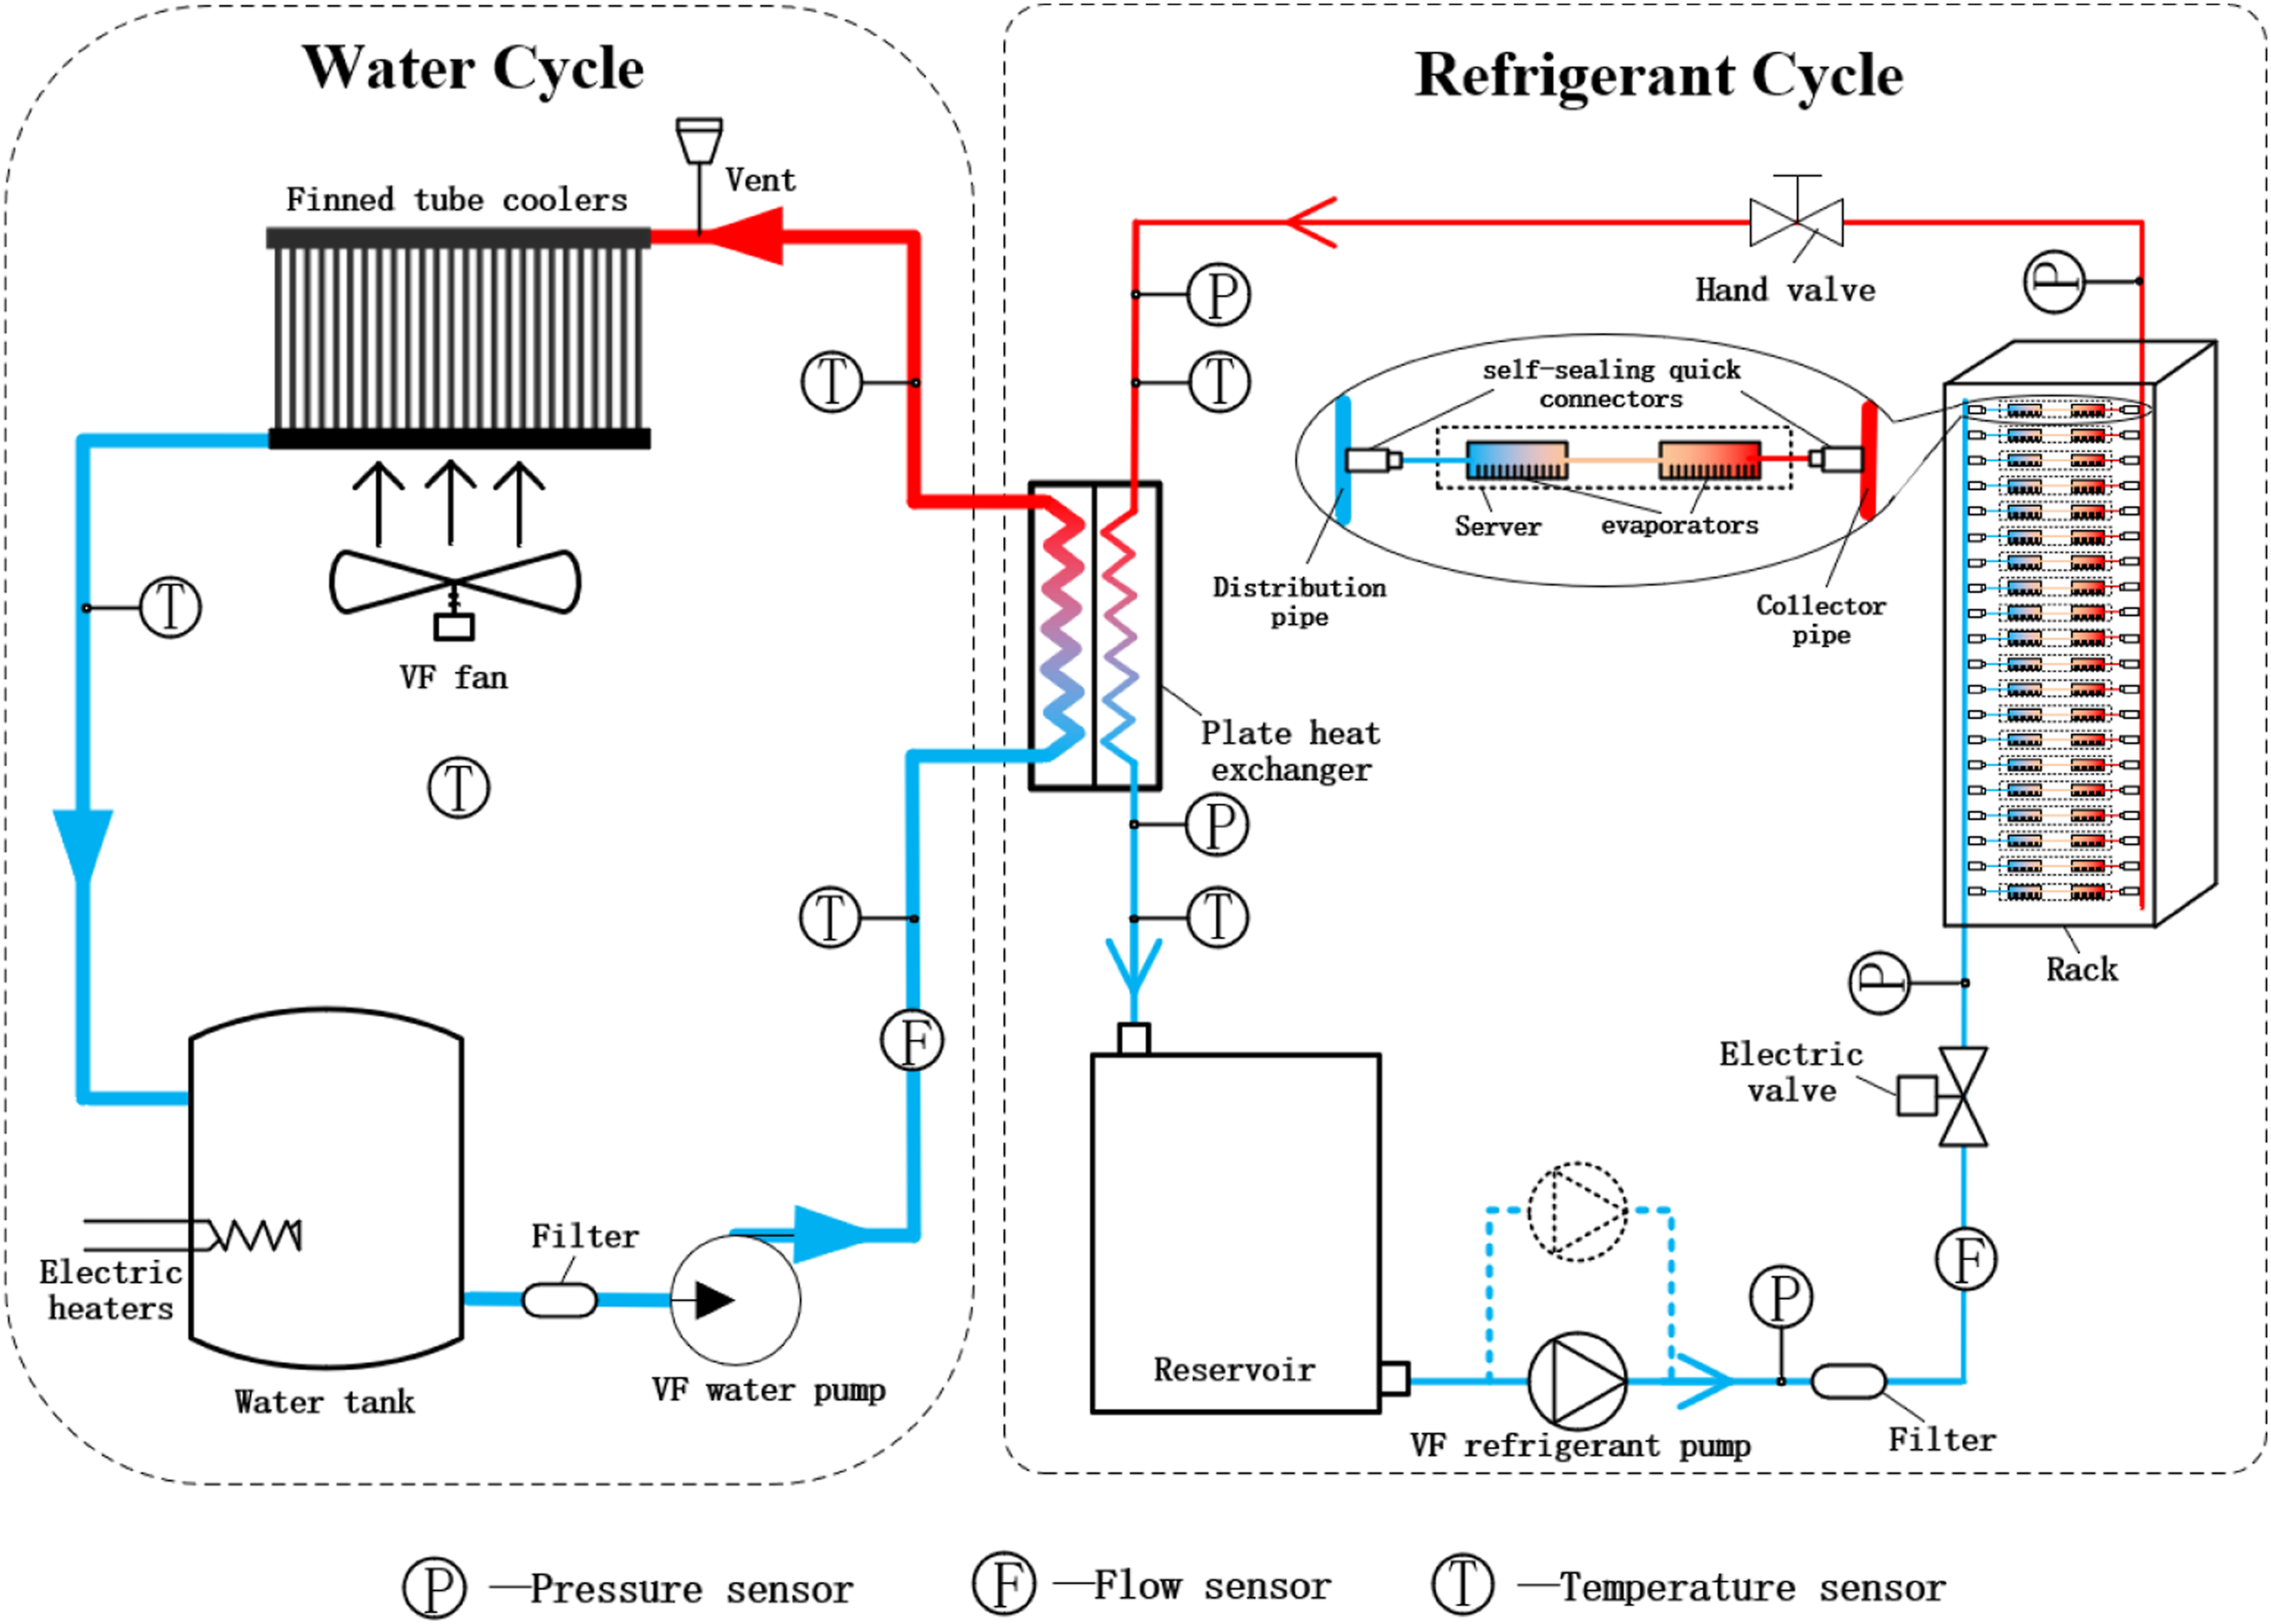
The IRC is the most critical component of the PCTCS, and our research primarily focuses on its performance through experimental investigation. A stable and adjustable cold source is crucial for analyzing the performance of the IRC. Due to the limitations of experimental conditions and venues in the original PCTCS which was mentioned in the section 'PCTCS Setup Used for Cooling an Actual Data Room', a stable ambient cold source is difficult to obtain. The key to achieving a stable ambient cold source depends on stabilizing both the cooling water temperature and flow rate. A stable cooling water temperature can be easily achieved by cooling and heating processes. The EWC features eight finned tube coolers, each equipped with a variable-frequency fan. Heat dissipation was adjusted by controlling the running quantity and rotational speed of the fans. Furthermore, as shown in Figure 6, we added a 5-kW electric heater to the water tank and controlled its heating power using a proportional–integral–differential (PID) controller. Meanwhile, we adjusted and stabilized the cooling water flow rate by modifying the rotational speed of the variable-frequency water pump.
Measuring instruments and method
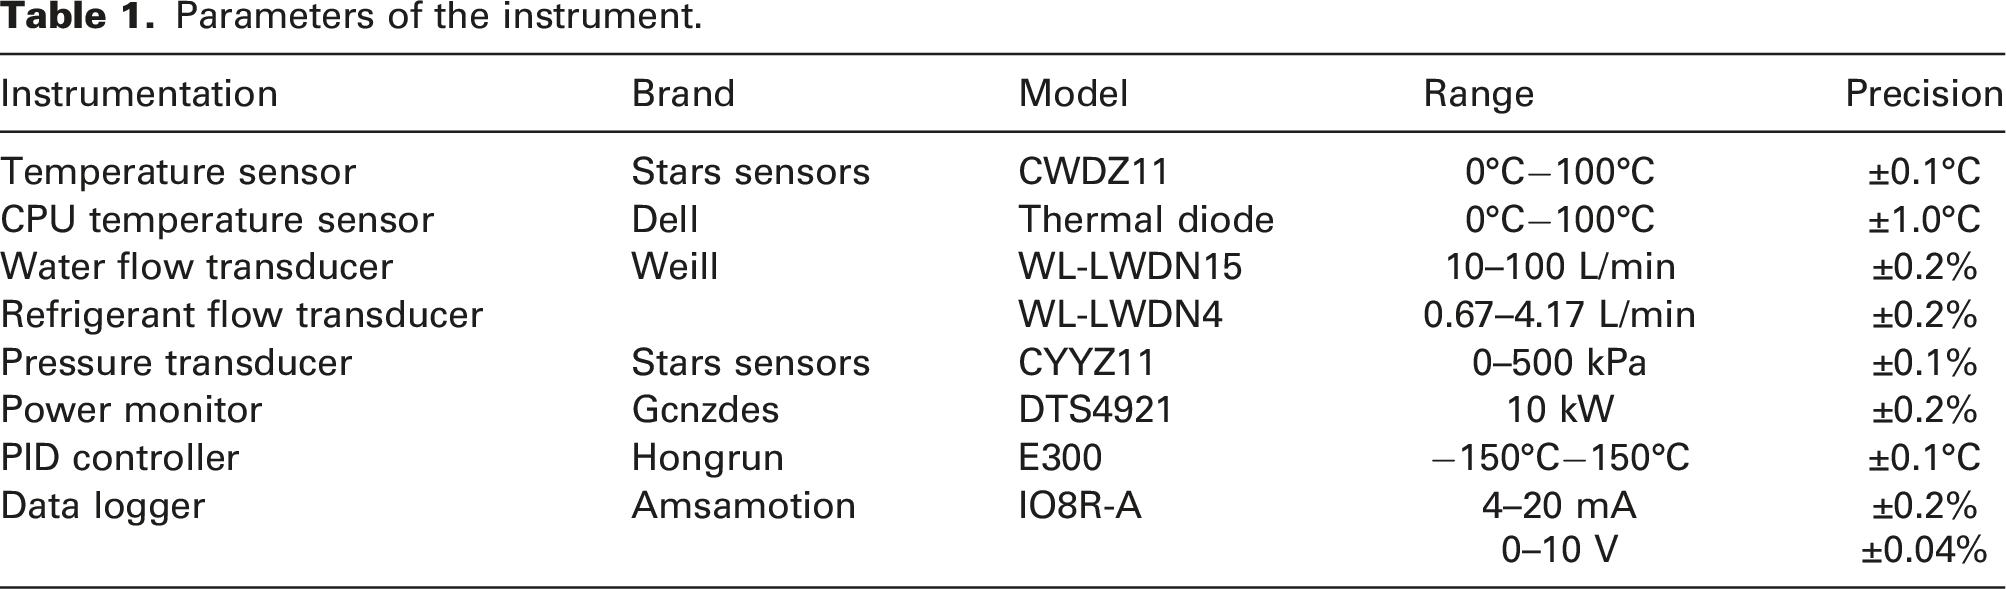
Parameters of the instrument.
The model name of the test servers was Dell PowerEdge R410 with two CPUs. The CPU model name was Intel Xeon E5520 with thermal design power and temperature resistance limit of 80 W and 95°C, respectively.
We analyzed the operating characteristics of the PCTCS under different conditions. According to ASHRAE’s proposal,
34
the data room dry bulb temperature was set to 27°C, and the wet bulb temperature was held constant at 19°C by using the CRAC. The experiments were performed under a cooling water flow of 0.6 m3/h, and the 20 servers were numbered 1 to 20 from the bottom to the top of the rack to distinguish the servers. The load rates of the CPUs were regulated using CPU Grab Ex software. 1. Changing CPU load and cooling water temperature: 40 CPUs were tested at 100% load, 50% load and 0% load at the cooling water temperatures of 25°C, 35°C, 45°C and 55°C, and the refrigerant flow was 0.15 m3/h. 2. Changing refrigerant flow: The flow of the refrigerant was adjusted to 0.12 m3/h, 0.15 m3/h and 0.18 m3/h. The other test conditions included a cooling water temperature of 35°C and a CPU load of 100%. 3. Changing flow resistances in various zones: The opening of both the electric valve and the hand valve in the IRC, which serve as additional flow resistances, was altered to simulate different flow resistances in the liquid phase zone and gas–liquid phase zone. The test conditions included a cooling water temperature of 35°C, CPU load of 100% and a refrigerant flow of 0.15 m3/h.
Performance evaluation
The performance of the PCTCS was assessed according to the cooling capacity Q, VFRP power Pp and EERp values of the VFRPs. The proposed PCTCS can only cool the CPUs in servers, while other parts (motherboard, memory module, power supply and so on) of the servers were cooled using CRAC systems, which was not analyzed in this study. The performance of the PCTCS was calculated as follows.
Q of the PCTCS was calculated using equation (1):
EERp was calculated by equation (2):
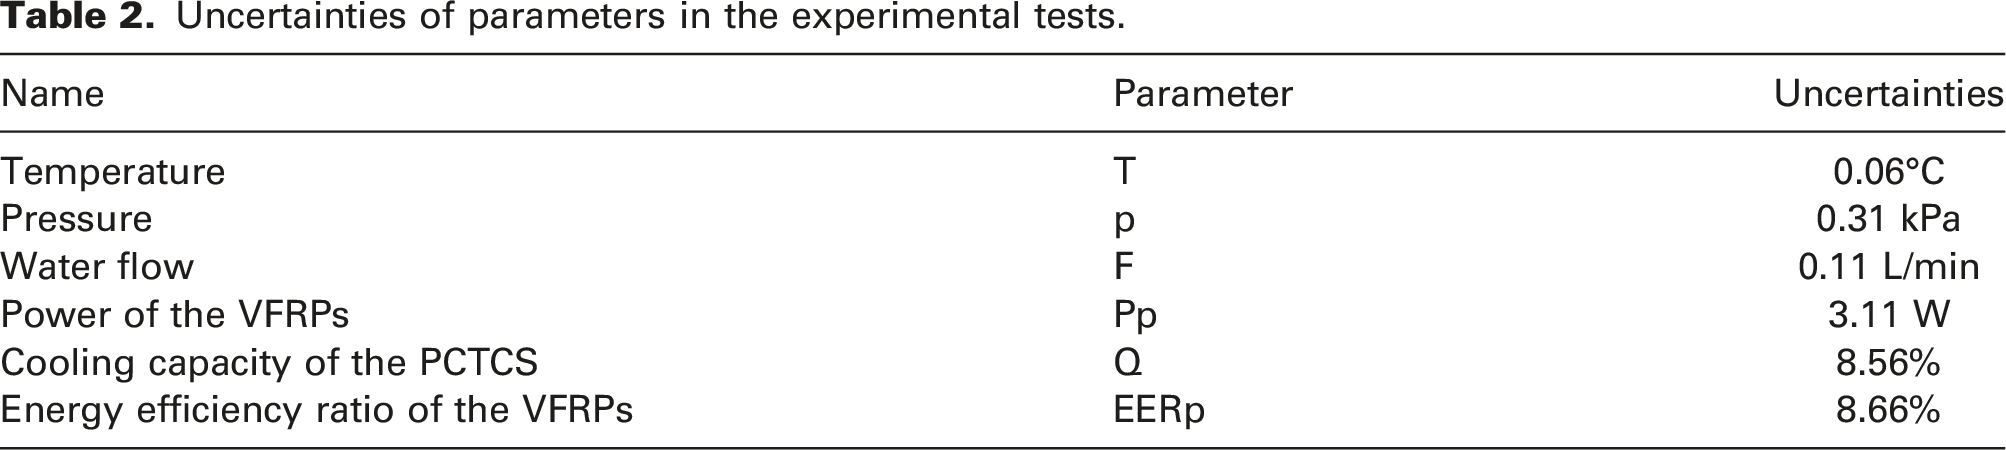
Uncertainty analysis
Results and discussion
Effects of cooling water temperature and CPU load
Figures 10 and 11 display the experimental results for all the servers at 100% load and 50% load, and the cooling water temperature of 25°C, 35°C, 45°C and 55°C. CPU temperature is a key indicator for the evaluation of PCTCS performance. Figure 10(a) and (b) illustrates the temperature of 40 CPUs in 20 servers when the CPU loads were 100% and 50%, respectively. The experimental results indicated that at the same cooling water temperature and same CPU load, the temperature difference between all CPUs was less than 10°C and the temperature difference between the two CPUs of each server was less than 5°C. The variances in temperature amongst all the CPUs were between 2.1°C and 6.9°C. In consideration of the discrepancies in the thermally conductive silicone grease coating and the temperature measurement error, the temperature of CPUs could be seen as uniform. Even under the least favourable experimental conditions (all CPUs were at 100% load and the cooling water temperature was 55°C), the average temperature of all CPUs (Tav) was 76.3°C, and a maximum CPU temperature of 79.0°C was observed in the first CPU of the 15th server. Both temperatures were considerably lower than the CPU’s temperature resistance limit (i.e. 95°C). Thus, all CPUs were effectively cooled by the proposed PCTCS, even under extreme operating conditions. Simultaneously, the water temperature of 55°C was sufficiently high for the water to be reused or easily cooled by outdoor ambient air. Therefore, the PCTCS can use natural cold sources throughout the year in most places and heat water up to 55°C. Temperatures of individual CPUs and the average temperature of all CPUs: (a) all CPUs at 100% load and cooling water temperatures of 25°C, 35°C, 45°C and 55°C and (b) all CPUs at 50% load and cooling water temperatures of 25°C, 35°C, 45°C and 55°C. Difference between the average temperature of all CPUs and cooling water temperature at CPU loads of 50% and 100%.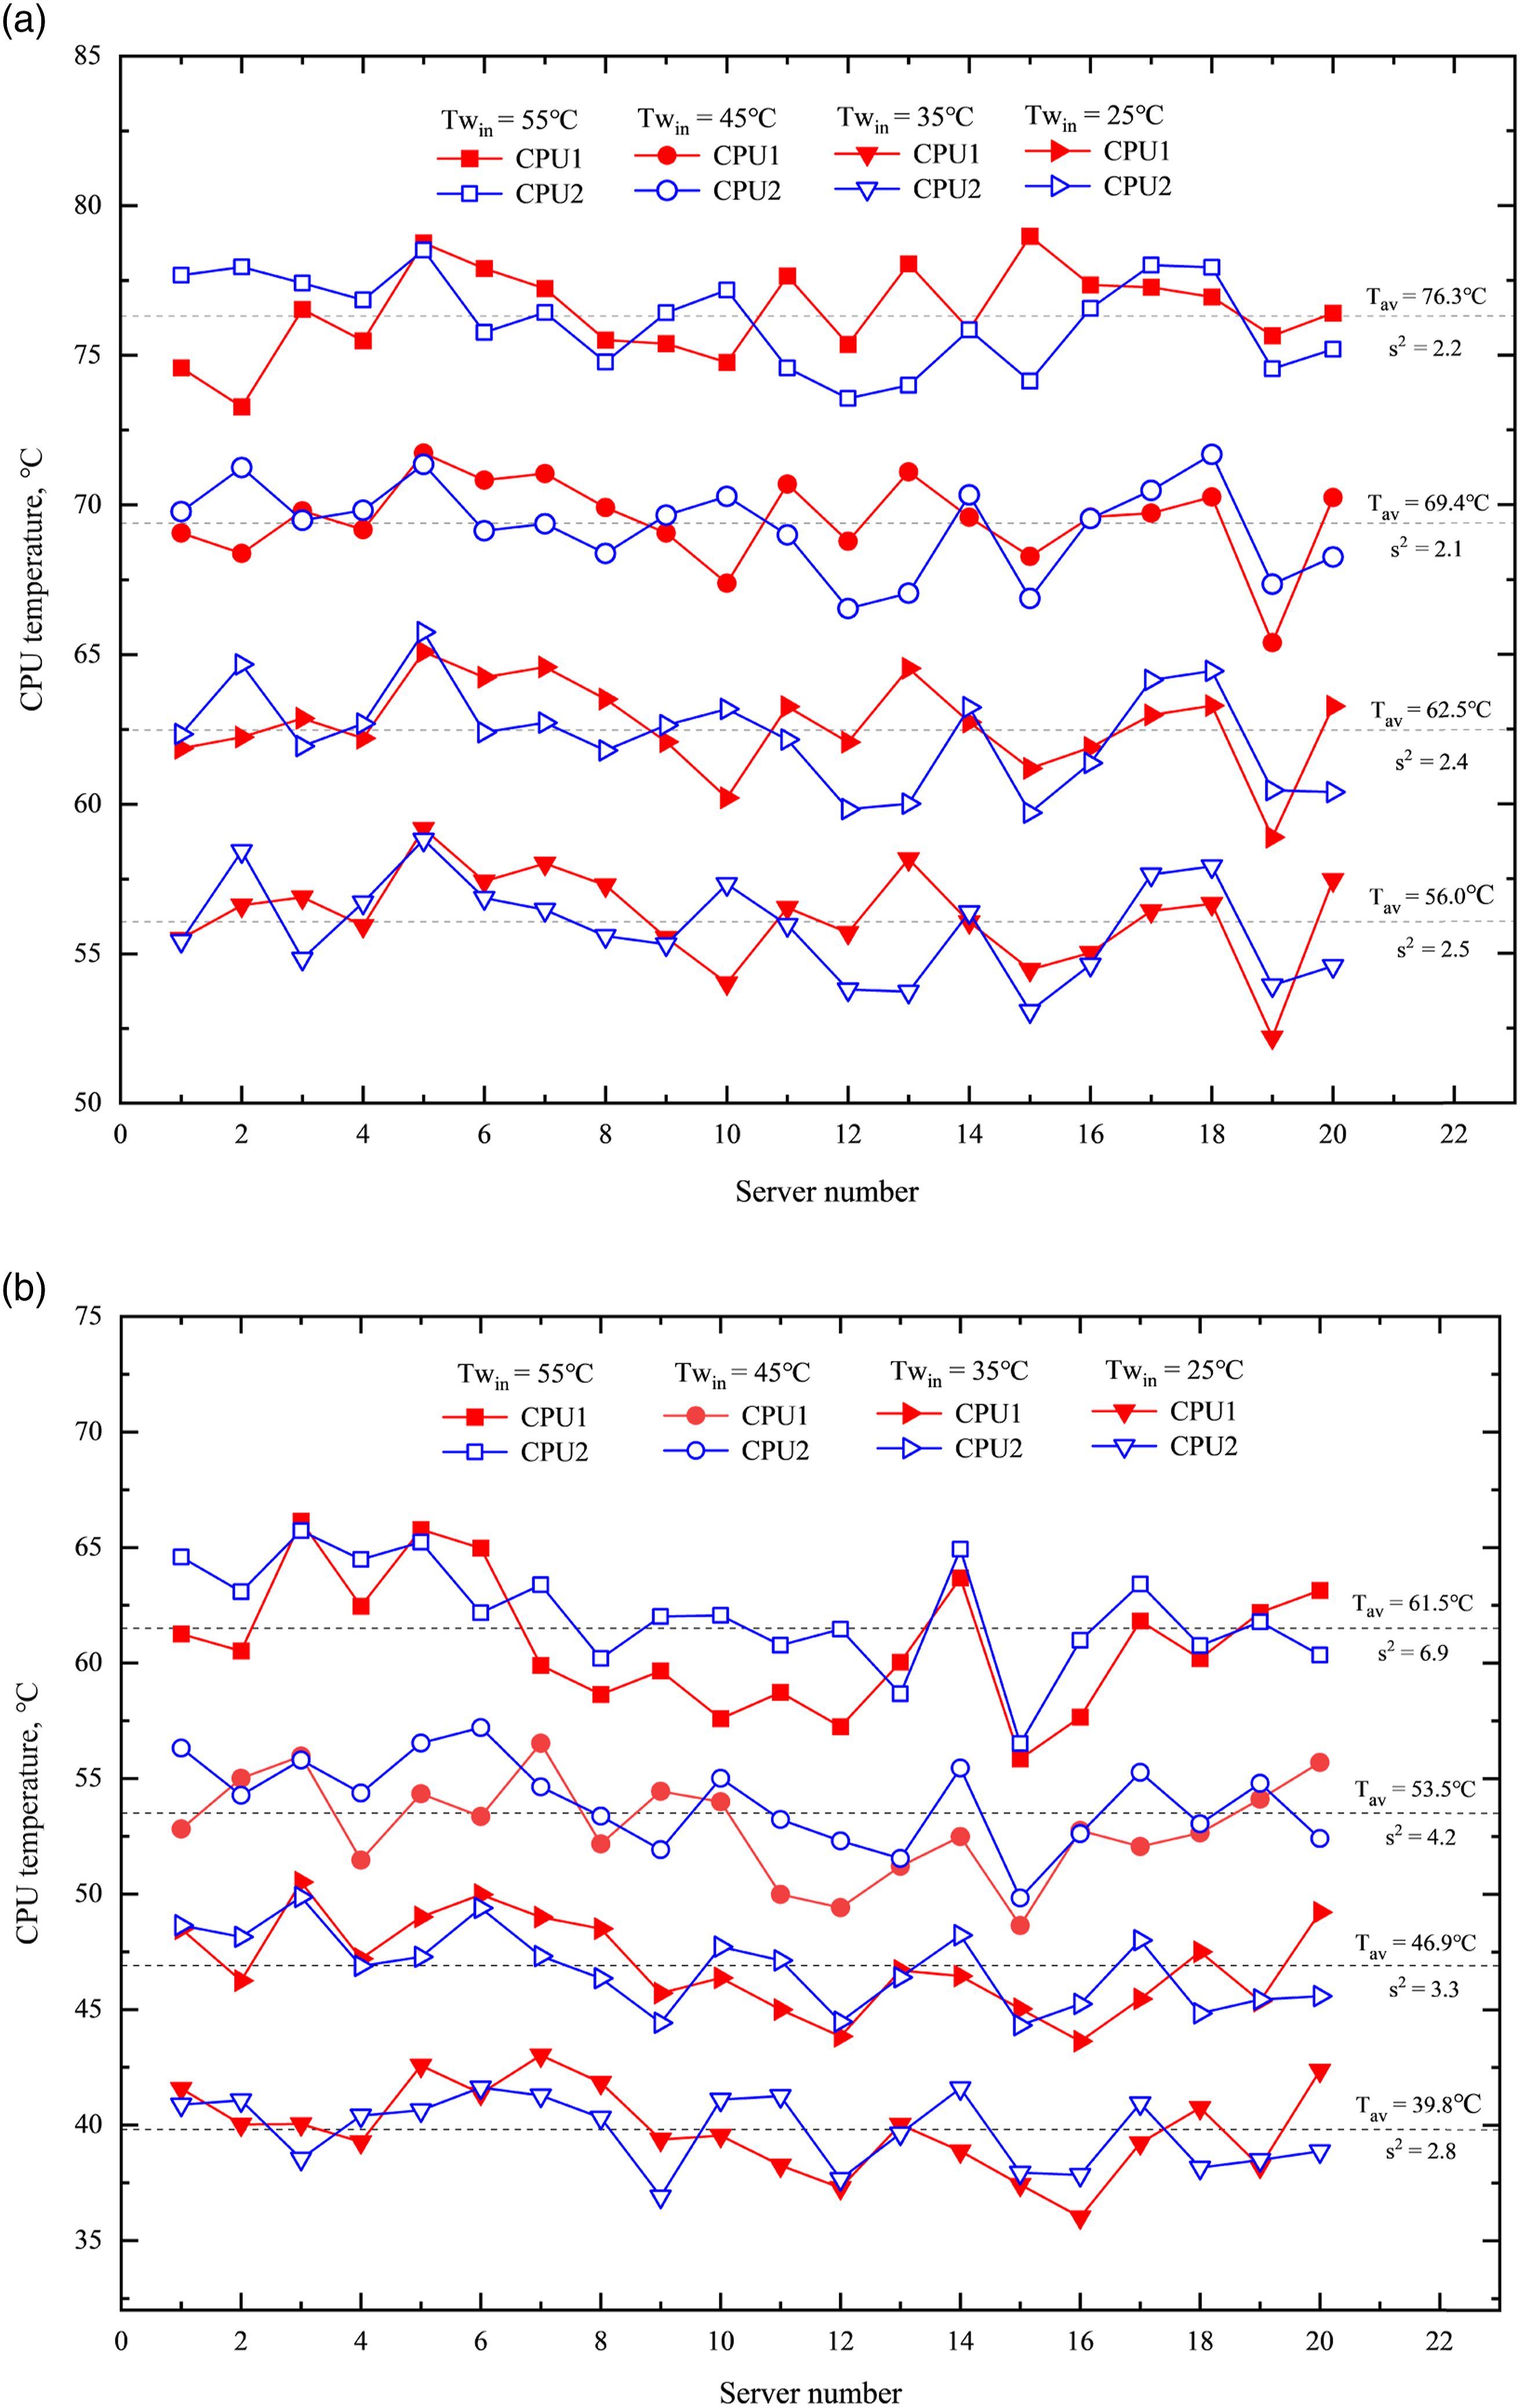
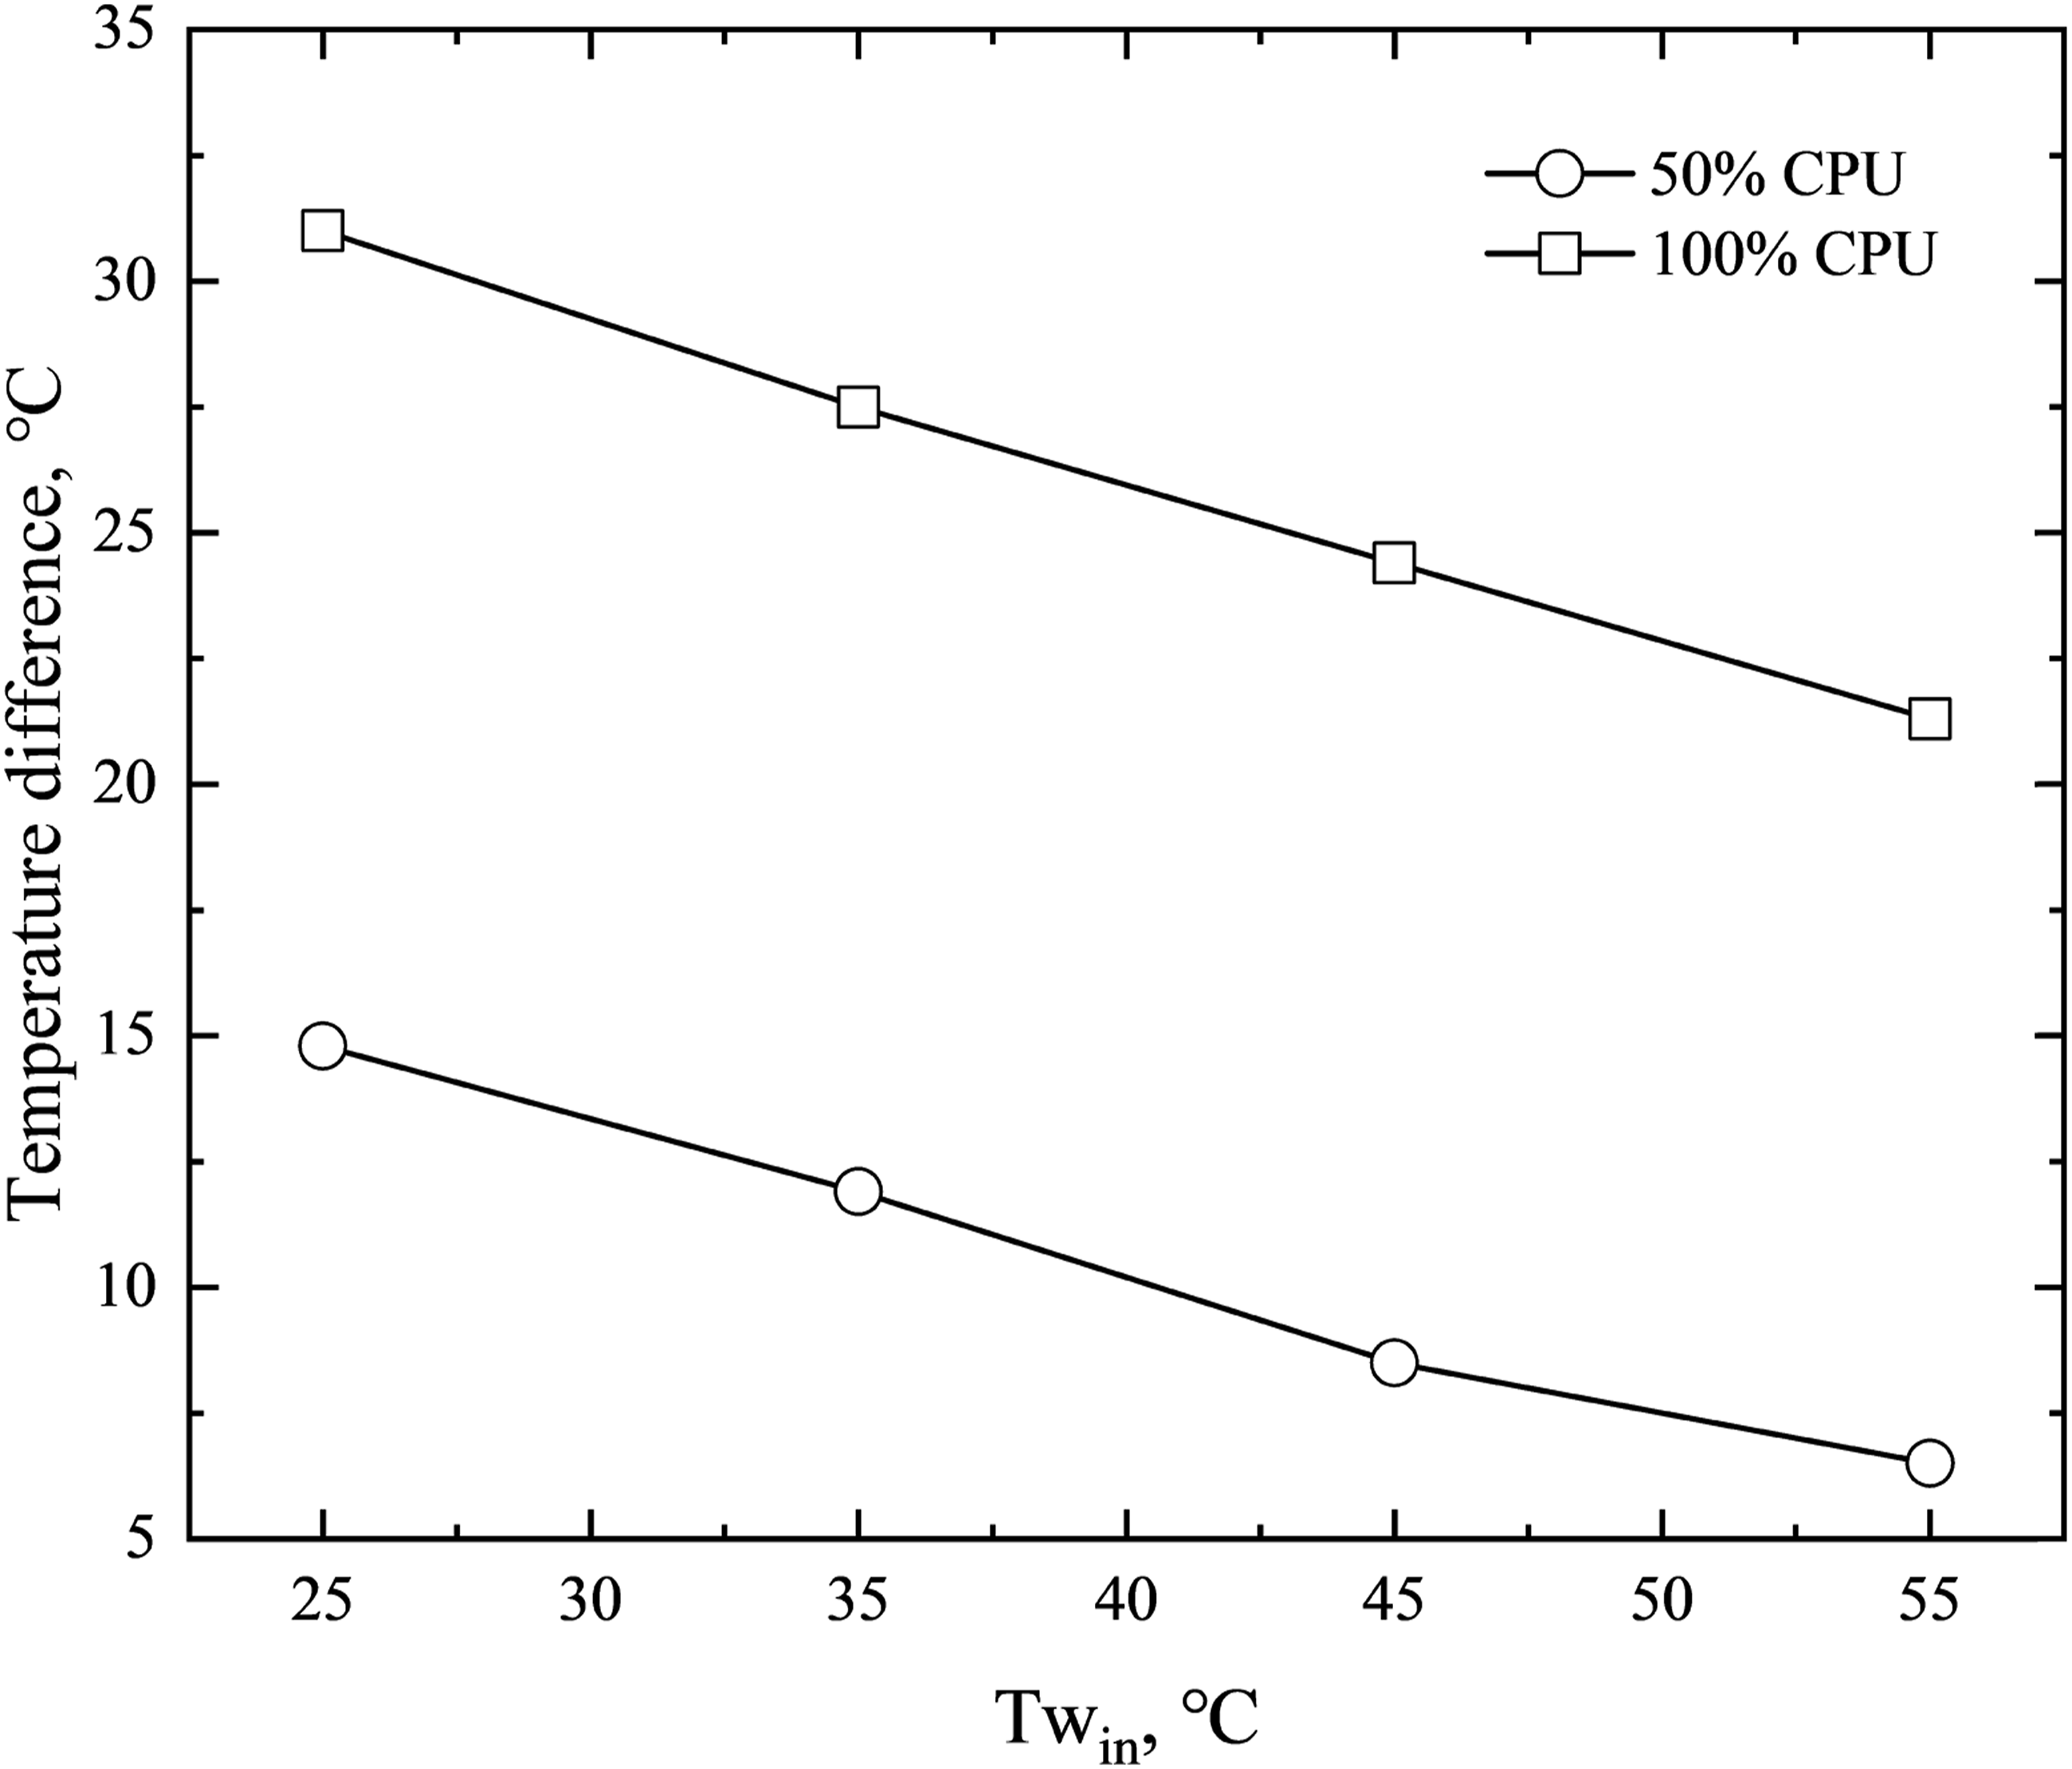
Figure 11 illustrates the difference between the average temperature of all CPUs and the cooling water temperature. With the decrease in the CPU load and cooling water temperature, the CPU’s temperature decreased but in a nonlinear trend. Under the same CPU load, the temperature difference was decreased with increasing cooling water temperature because of the increase in the pressure of the IRC (as displayed in Figure 11) and temperature of the refrigerant. The physical parameters of the refrigerant changed; in particular, the saturation temperature difference corresponding to the saturation pressure difference of 1 kPa at the high base pressure was lower than that at the low base pressure. However, as illustrated in Figure 12, the change in the difference between the evaporating pressure and the condensing pressure was not substantial. Therefore, with the increase in the cooling water temperature, the temperature difference between the refrigerant evaporation temperature and the condensation temperature was decreased, thereby decreasing the difference between the average temperature of all the CPU and the cooling water temperature. The PCTCS exhibited a better performance at high cooling water temperatures. Moreover, a higher cooling water temperature facilitated not only the dissipation of heat to the ambient air but also a more efficient recovery of waste heat. Pressure of the IRC under different conditions: (a) pressure of the VFRP outlet and plate heat exchanger outlet at different cooling water temperatures and CPU loads and (b) IRC pressures at different CPU loads and cooling water temperatures.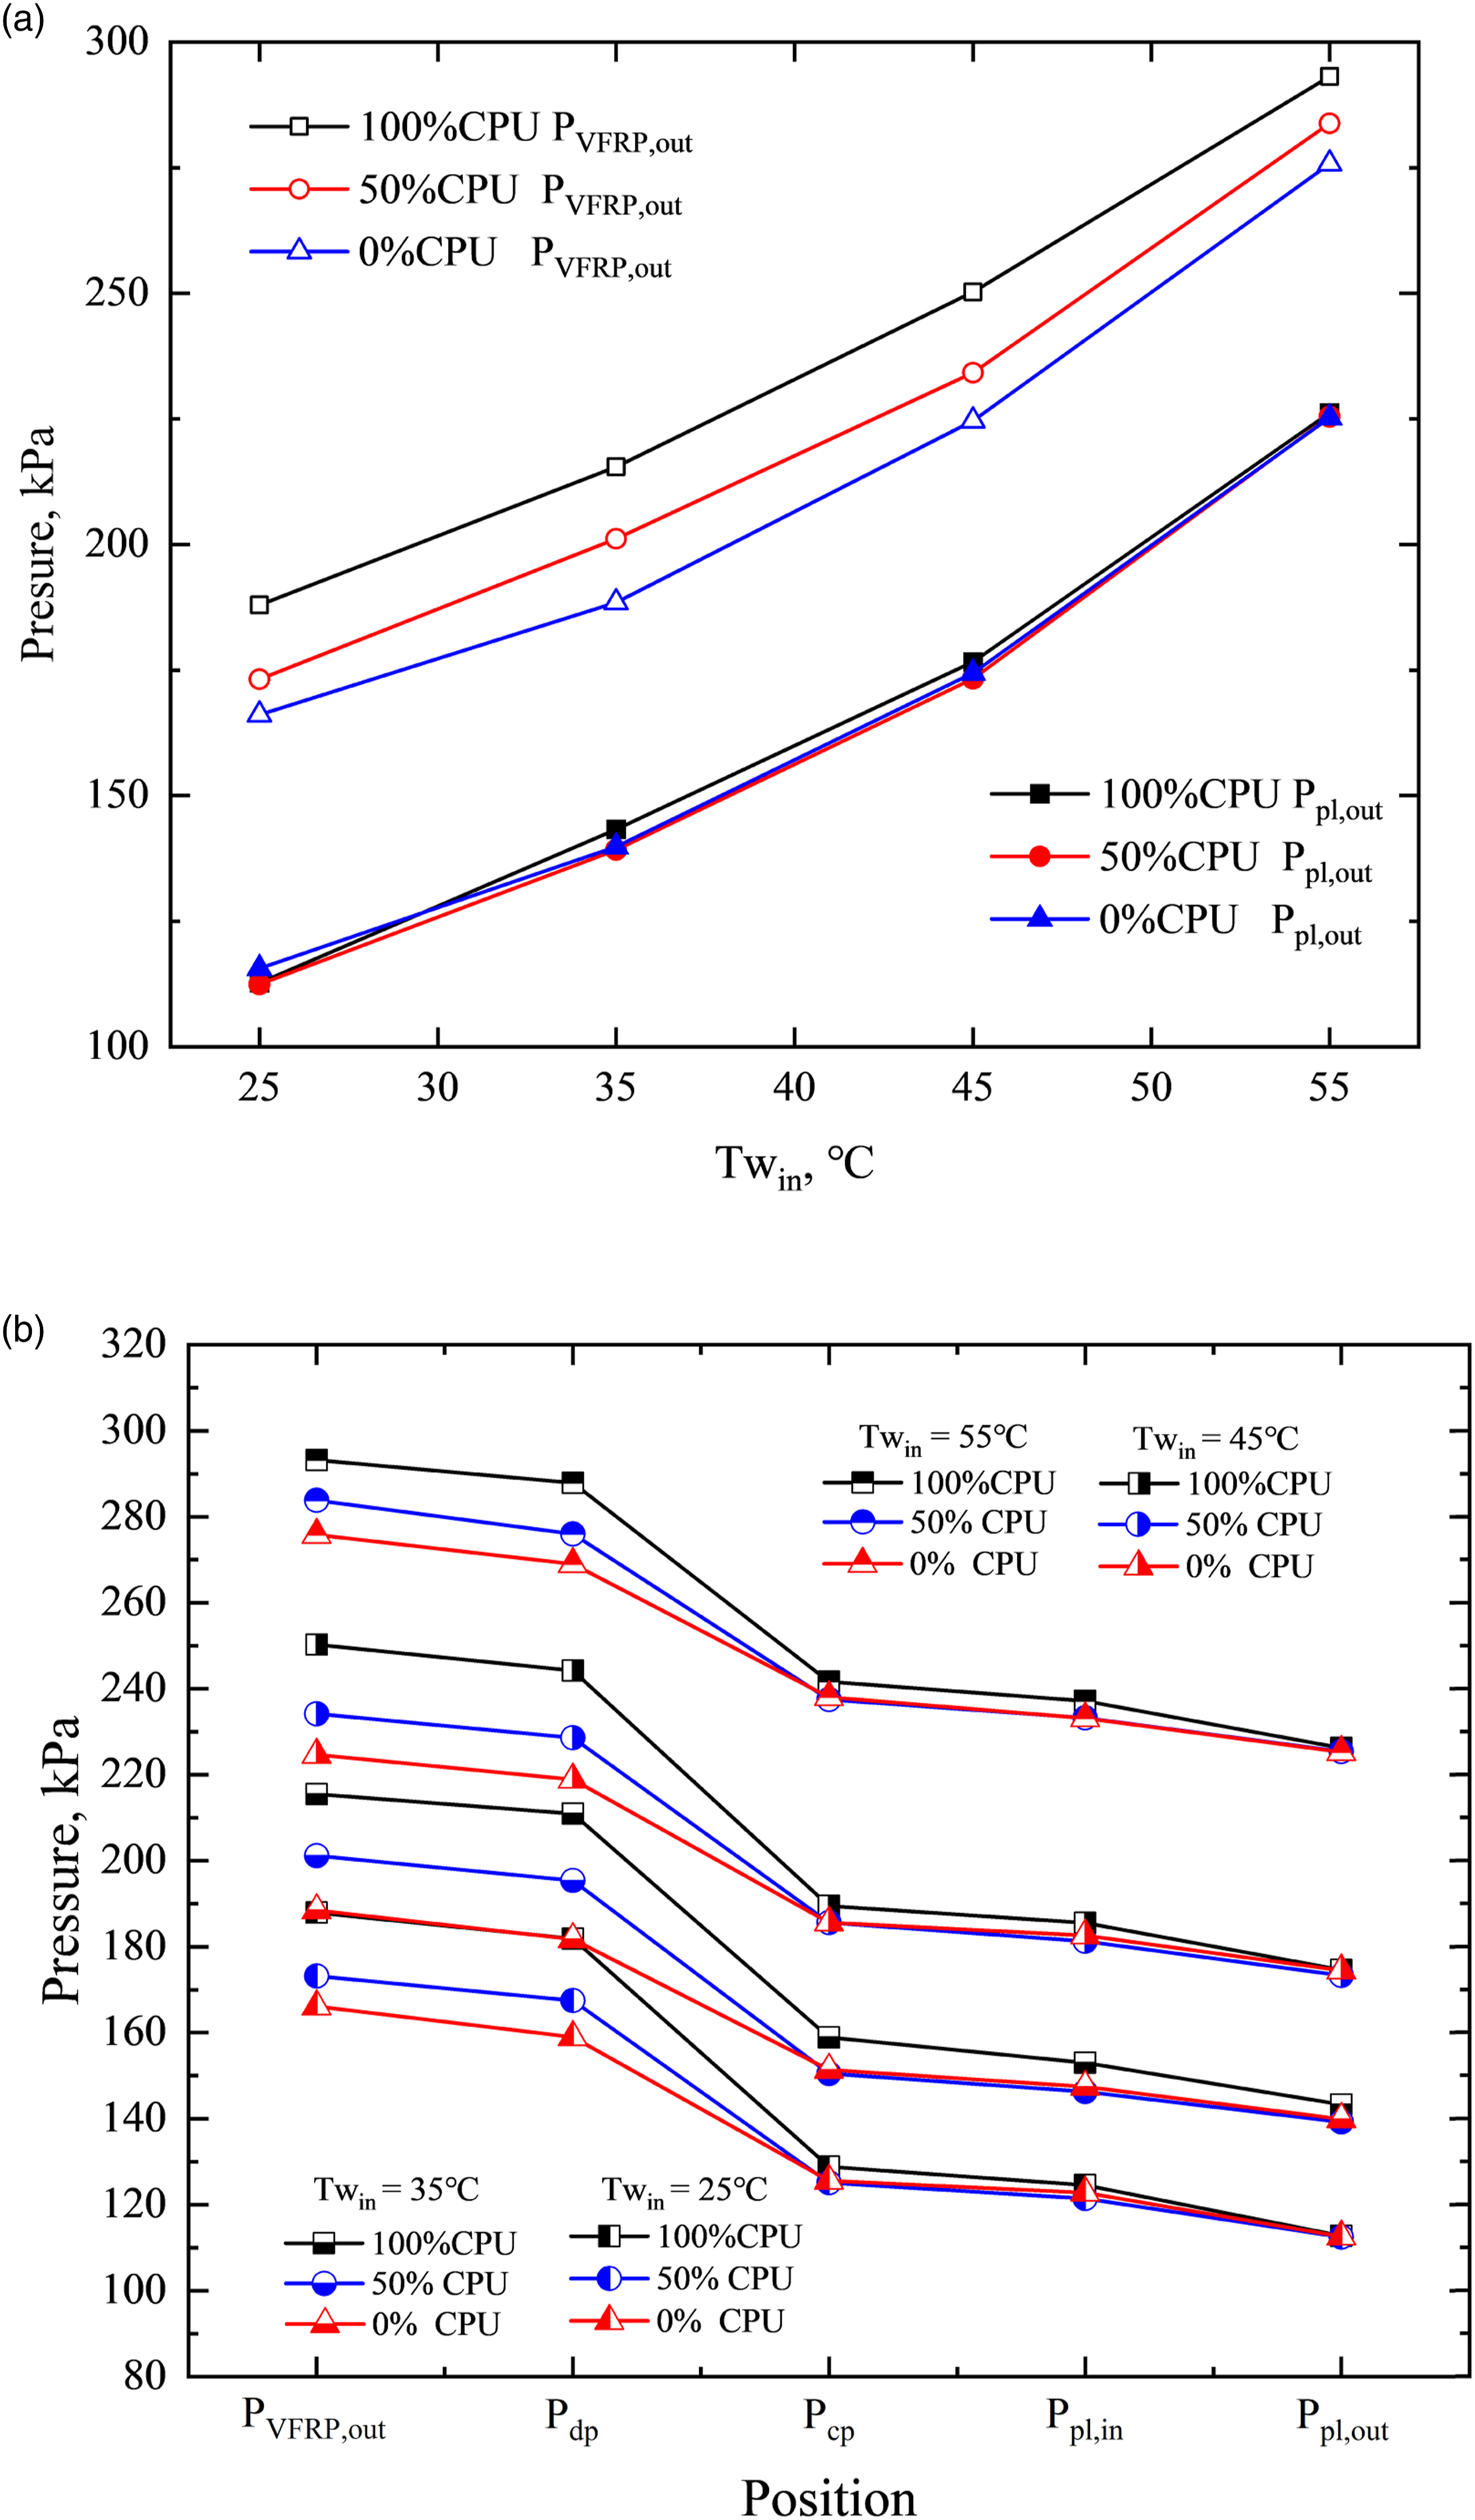
When the CPU temperature is considerably lower than the CPU temperature resistance limit, the cooling water temperature should not be exceedingly high during high CPU load. Figure 14 illustrates the effects of the cooling water temperature and the CPU load on the total power of the servers and the cooling load of the CPUs. At the same CPU load, the power of the servers and the cooling load of the CPUs were increased with the increase in the cooling water temperature and average temperature of the CPUs. Moreover, the higher the CPU load, the faster the growth of server power and CPU cooling load. When the CPU load was 100% and the cooling water temperature was 25°C, the total power of the servers was 4820 W and the CPU cooling load was 2740 W. When the cooling water temperature is 55°C, the server power and the CPU cooling load was increased to 5696 W and 3186 W by 18.2% and 16.3%, respectively. This can be attributed to the severe increase in the leakage of transistors because of the high CPU temperature at high CPU load. This increased the power consumption and the cooling load of the CPU. Moreover, when the CPU temperature rose, the high-velocity fans in the server were also speeded up, which increased the server power consumption and noise.36,37 Therefore, when the CPUs were run at high loads, the high cooling water temperature increased the total power consumption of DCs, which should be prevented.
Unlike CRAC systems, the PCTCS uses VFRPs instead of compressors. Figure 13 illustrates the variations in the VFRPs power and EERp at different CPU loads and cooling water temperatures. A high CPU load would correspond to high VFRP power and high EERp. With the increase in CPU load, VFRP power would be increased, but the increase in EERp would be considerably faster. When the CPU load is 0%, the CPU experiences the lowest cooling load and the corresponding EERp is also at its lowest. VFRP power and EERp at different Twin values and CPU loads.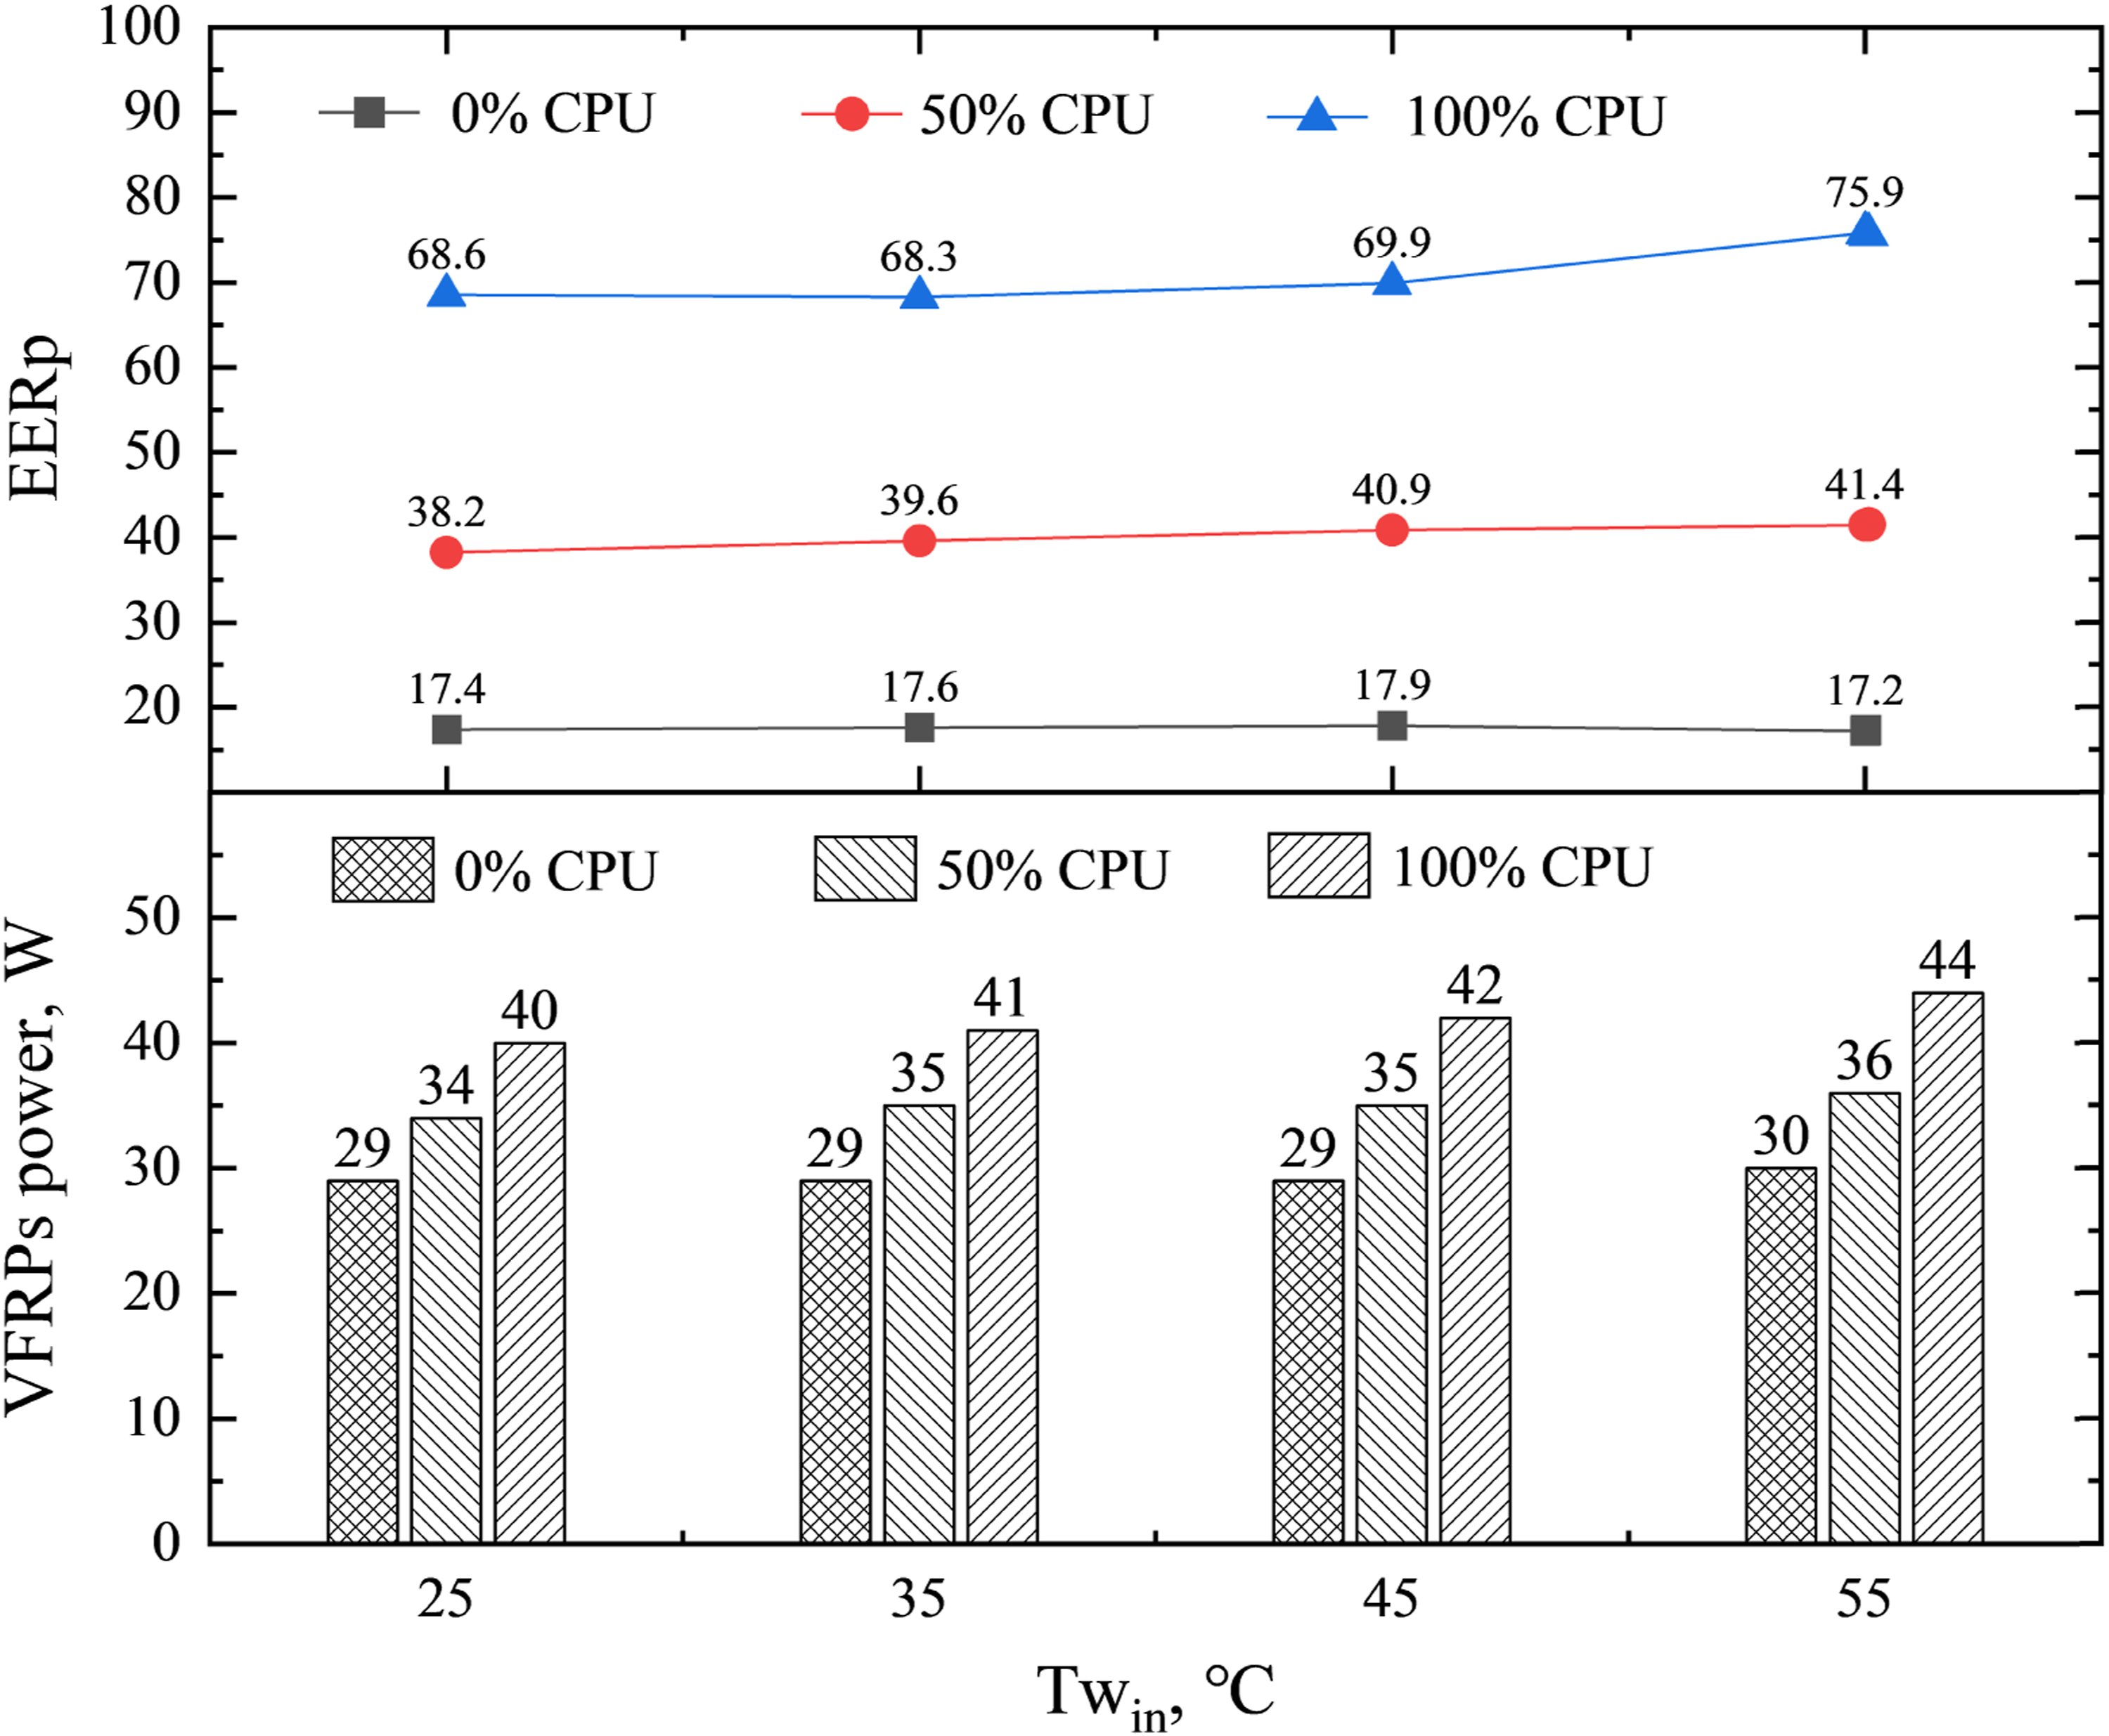
EERp was 17–18 when all the CPUs were at 0% load and 38–42 and 68–76 when the CPUs were at 50% load and 100% load, respectively. In addition, with the decrease in the cooling water temperature, both VFRP power and EERp were decreased slightly and become negligible. VFRPs are considerably more efficient than compressors, especially when the CPU load is high. Moreover, the key electric consumption components in the PCTCS are the water pump and cooling fans instead of VFRPs. By contrast, the key electric components in CRAC systems are compressors.
In summary, the proposed PCTCS can efficiently handle the load of dozens of CPUs by using natural cold source cooling throughout the year round, with considerably higher efficiency than that of CRAC systems; it can also heat water up to 55°C.
Effect of refrigerant flow on the performance of the PCTCS
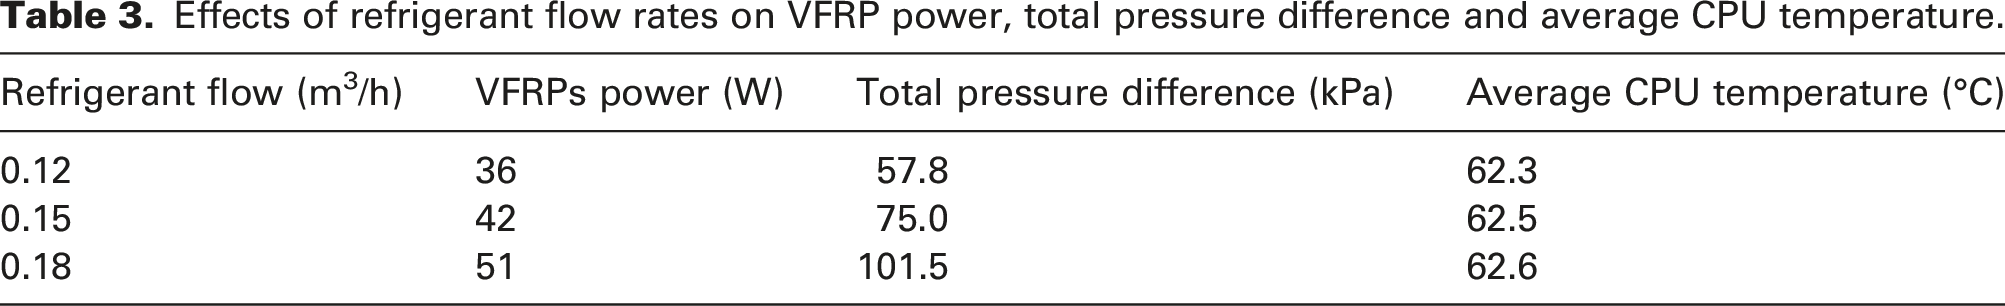
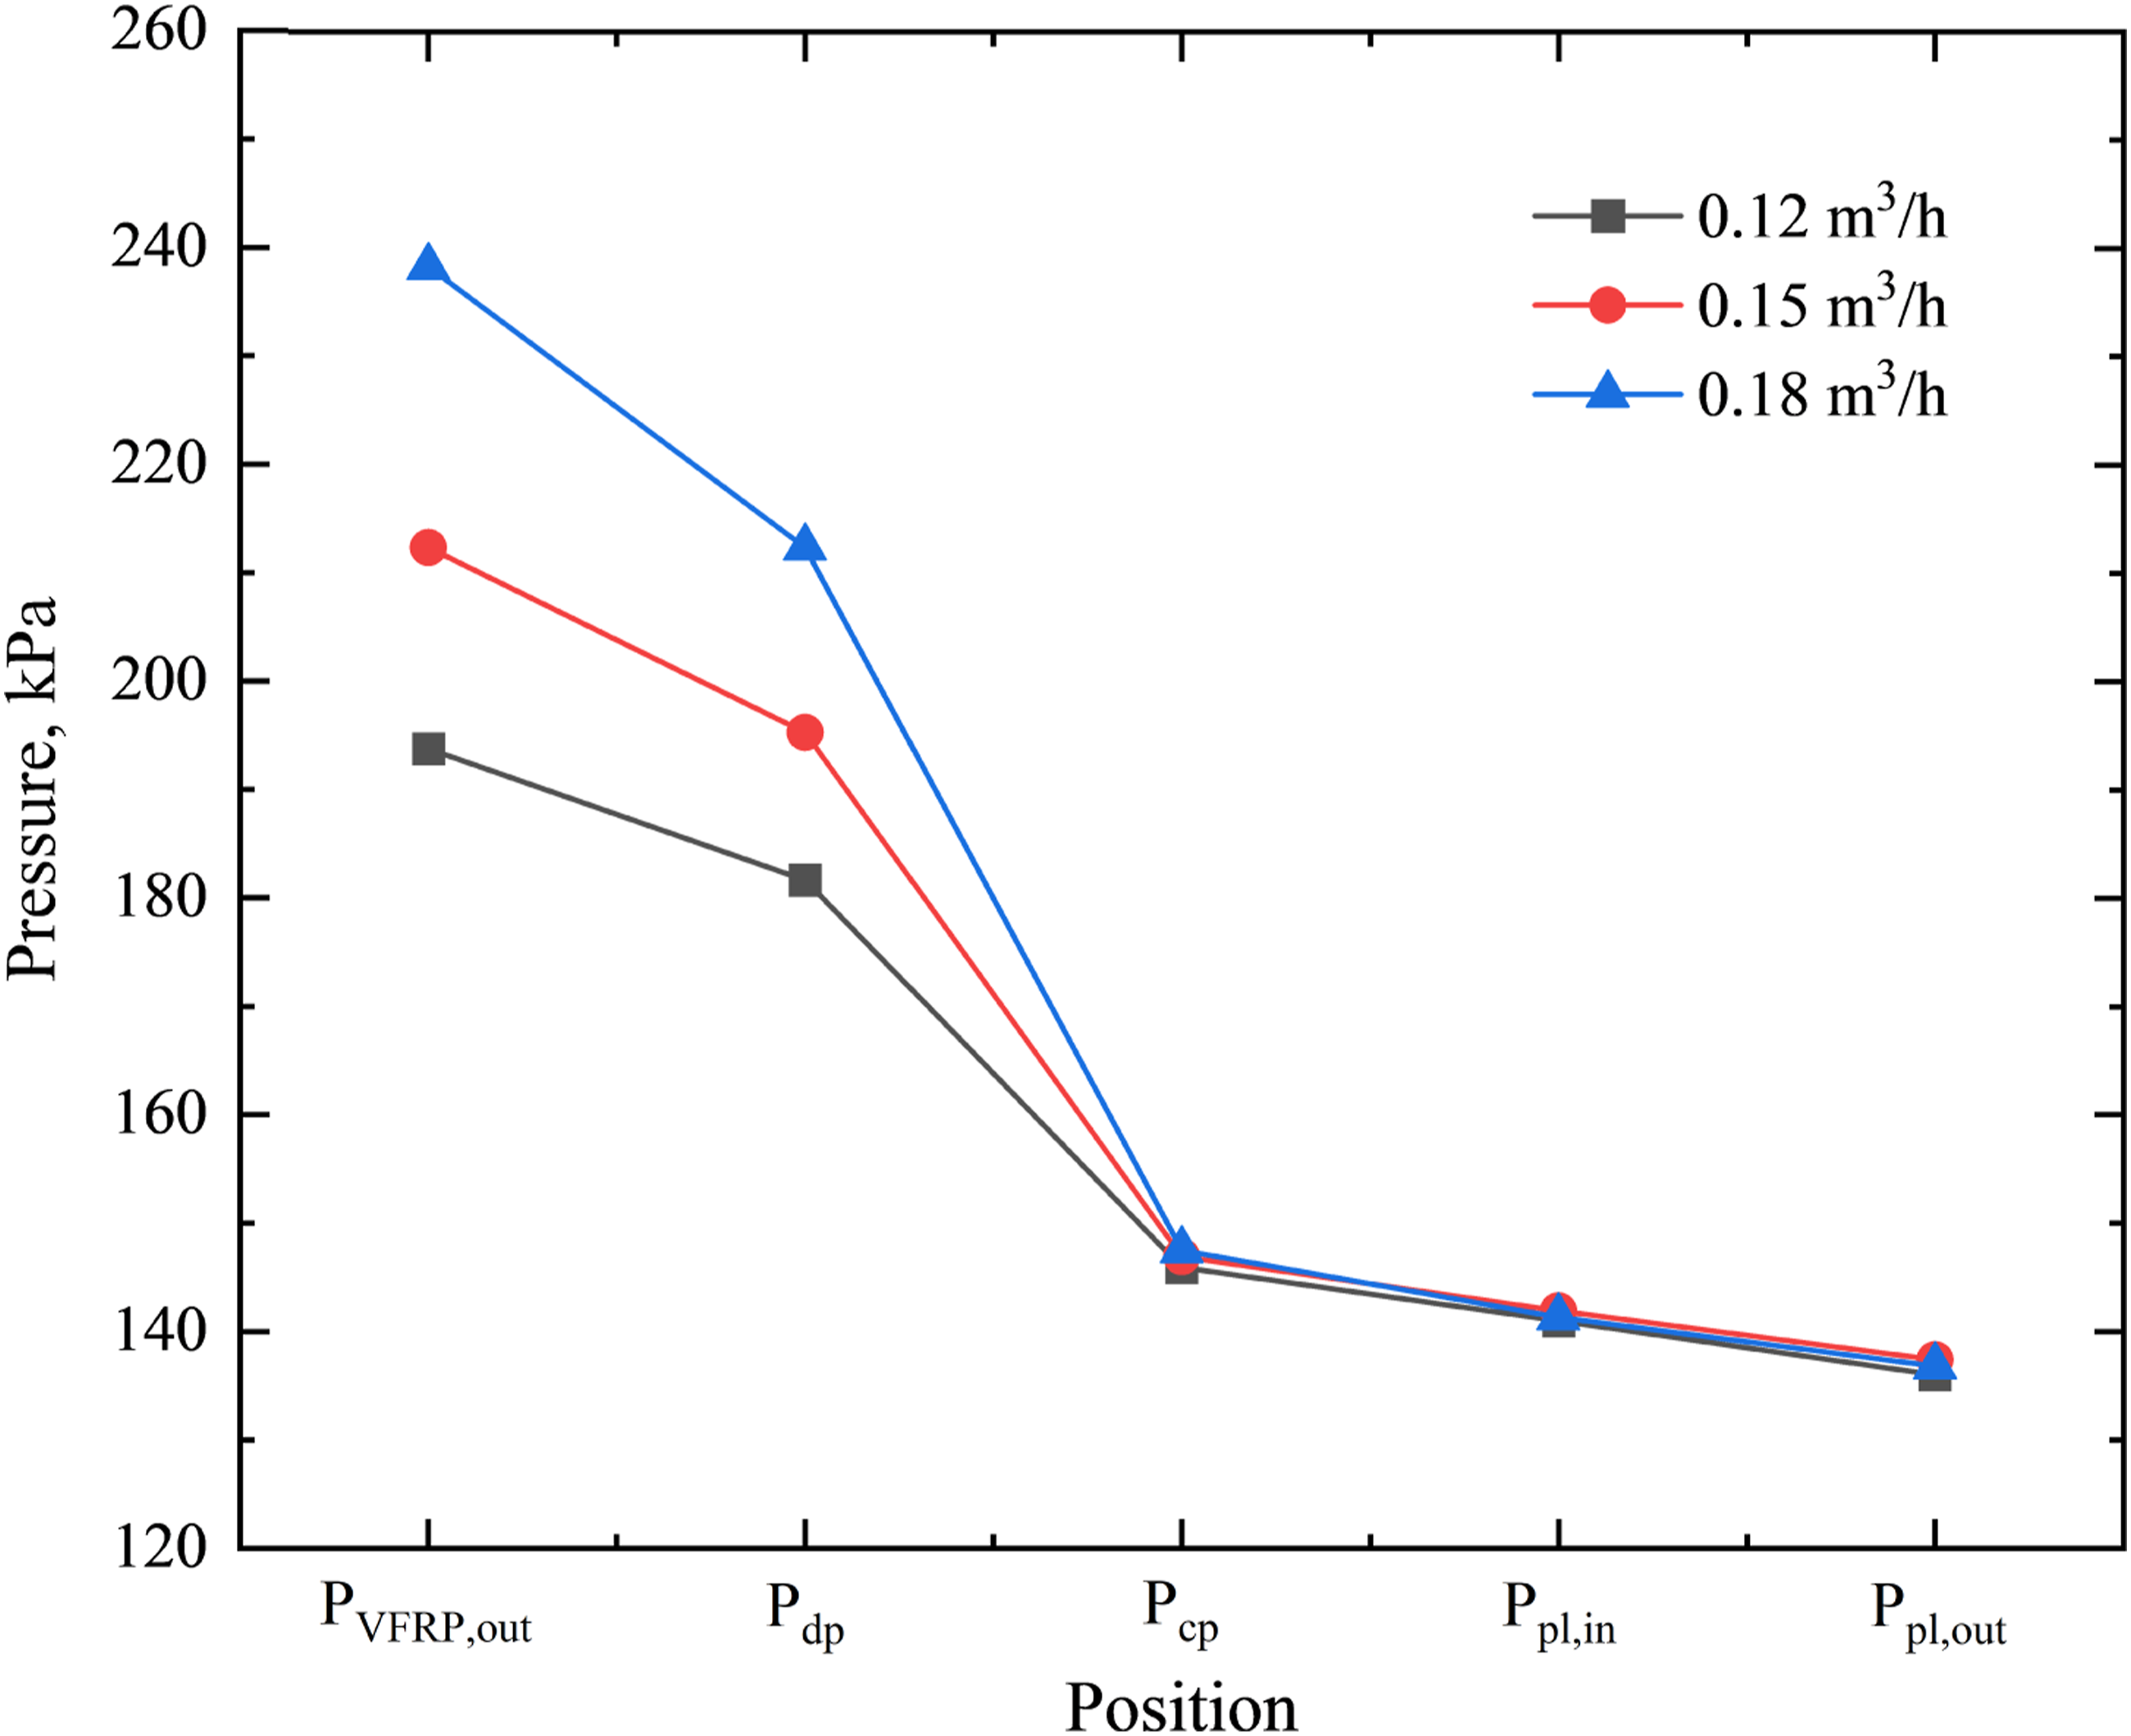
The effects of refrigerant flow on PCTCS performance are illustrated in Figure 15 and Table 3. The total pressure in the IRC was decreased with the increase in the refrigerant flow, as illustrated in Table 3. As illustrated in Figure 15, for the pressures in the IRC at different positions, the increase in refrigerant flow raised the pressure at the VFRP outlet and the distributor pipe, whereas the pressure at the collector pipe and the plate heat exchanger inlet and outlet did not increase substantially. This is because the refrigerant in the reservoir was in the saturation state, and the saturation refrigerant temperature and saturation refrigerant pressure were both related to the cooling water temperature. Moreover, the flow resistance of the collector pipe to the reservoir was small. As illustrated in Table 3, with increasing refrigerant flow, the VFRP power, the total pressure difference in the IRC and the CPUs’ average temperature were increased. The refrigerant flow had a notable influence on the VFRP power and the total pressure difference in the IRC and little influence on the temperatures of the CPUs. In summary, the effects of a slightly large refrigerant flow on the performance of the PCTCS are not substantial. Furthermore, the refrigerant flow in the PCTCS should satisfy the heat dissipation requirements of all servers under different operating conditions. Sever power and CPU heat at different CPU loads and cooling water temperatures. Effects of refrigerant flow rates on VFRP power, total pressure difference and average CPU temperature. Effects of refrigerant flow rates on IRC pressures.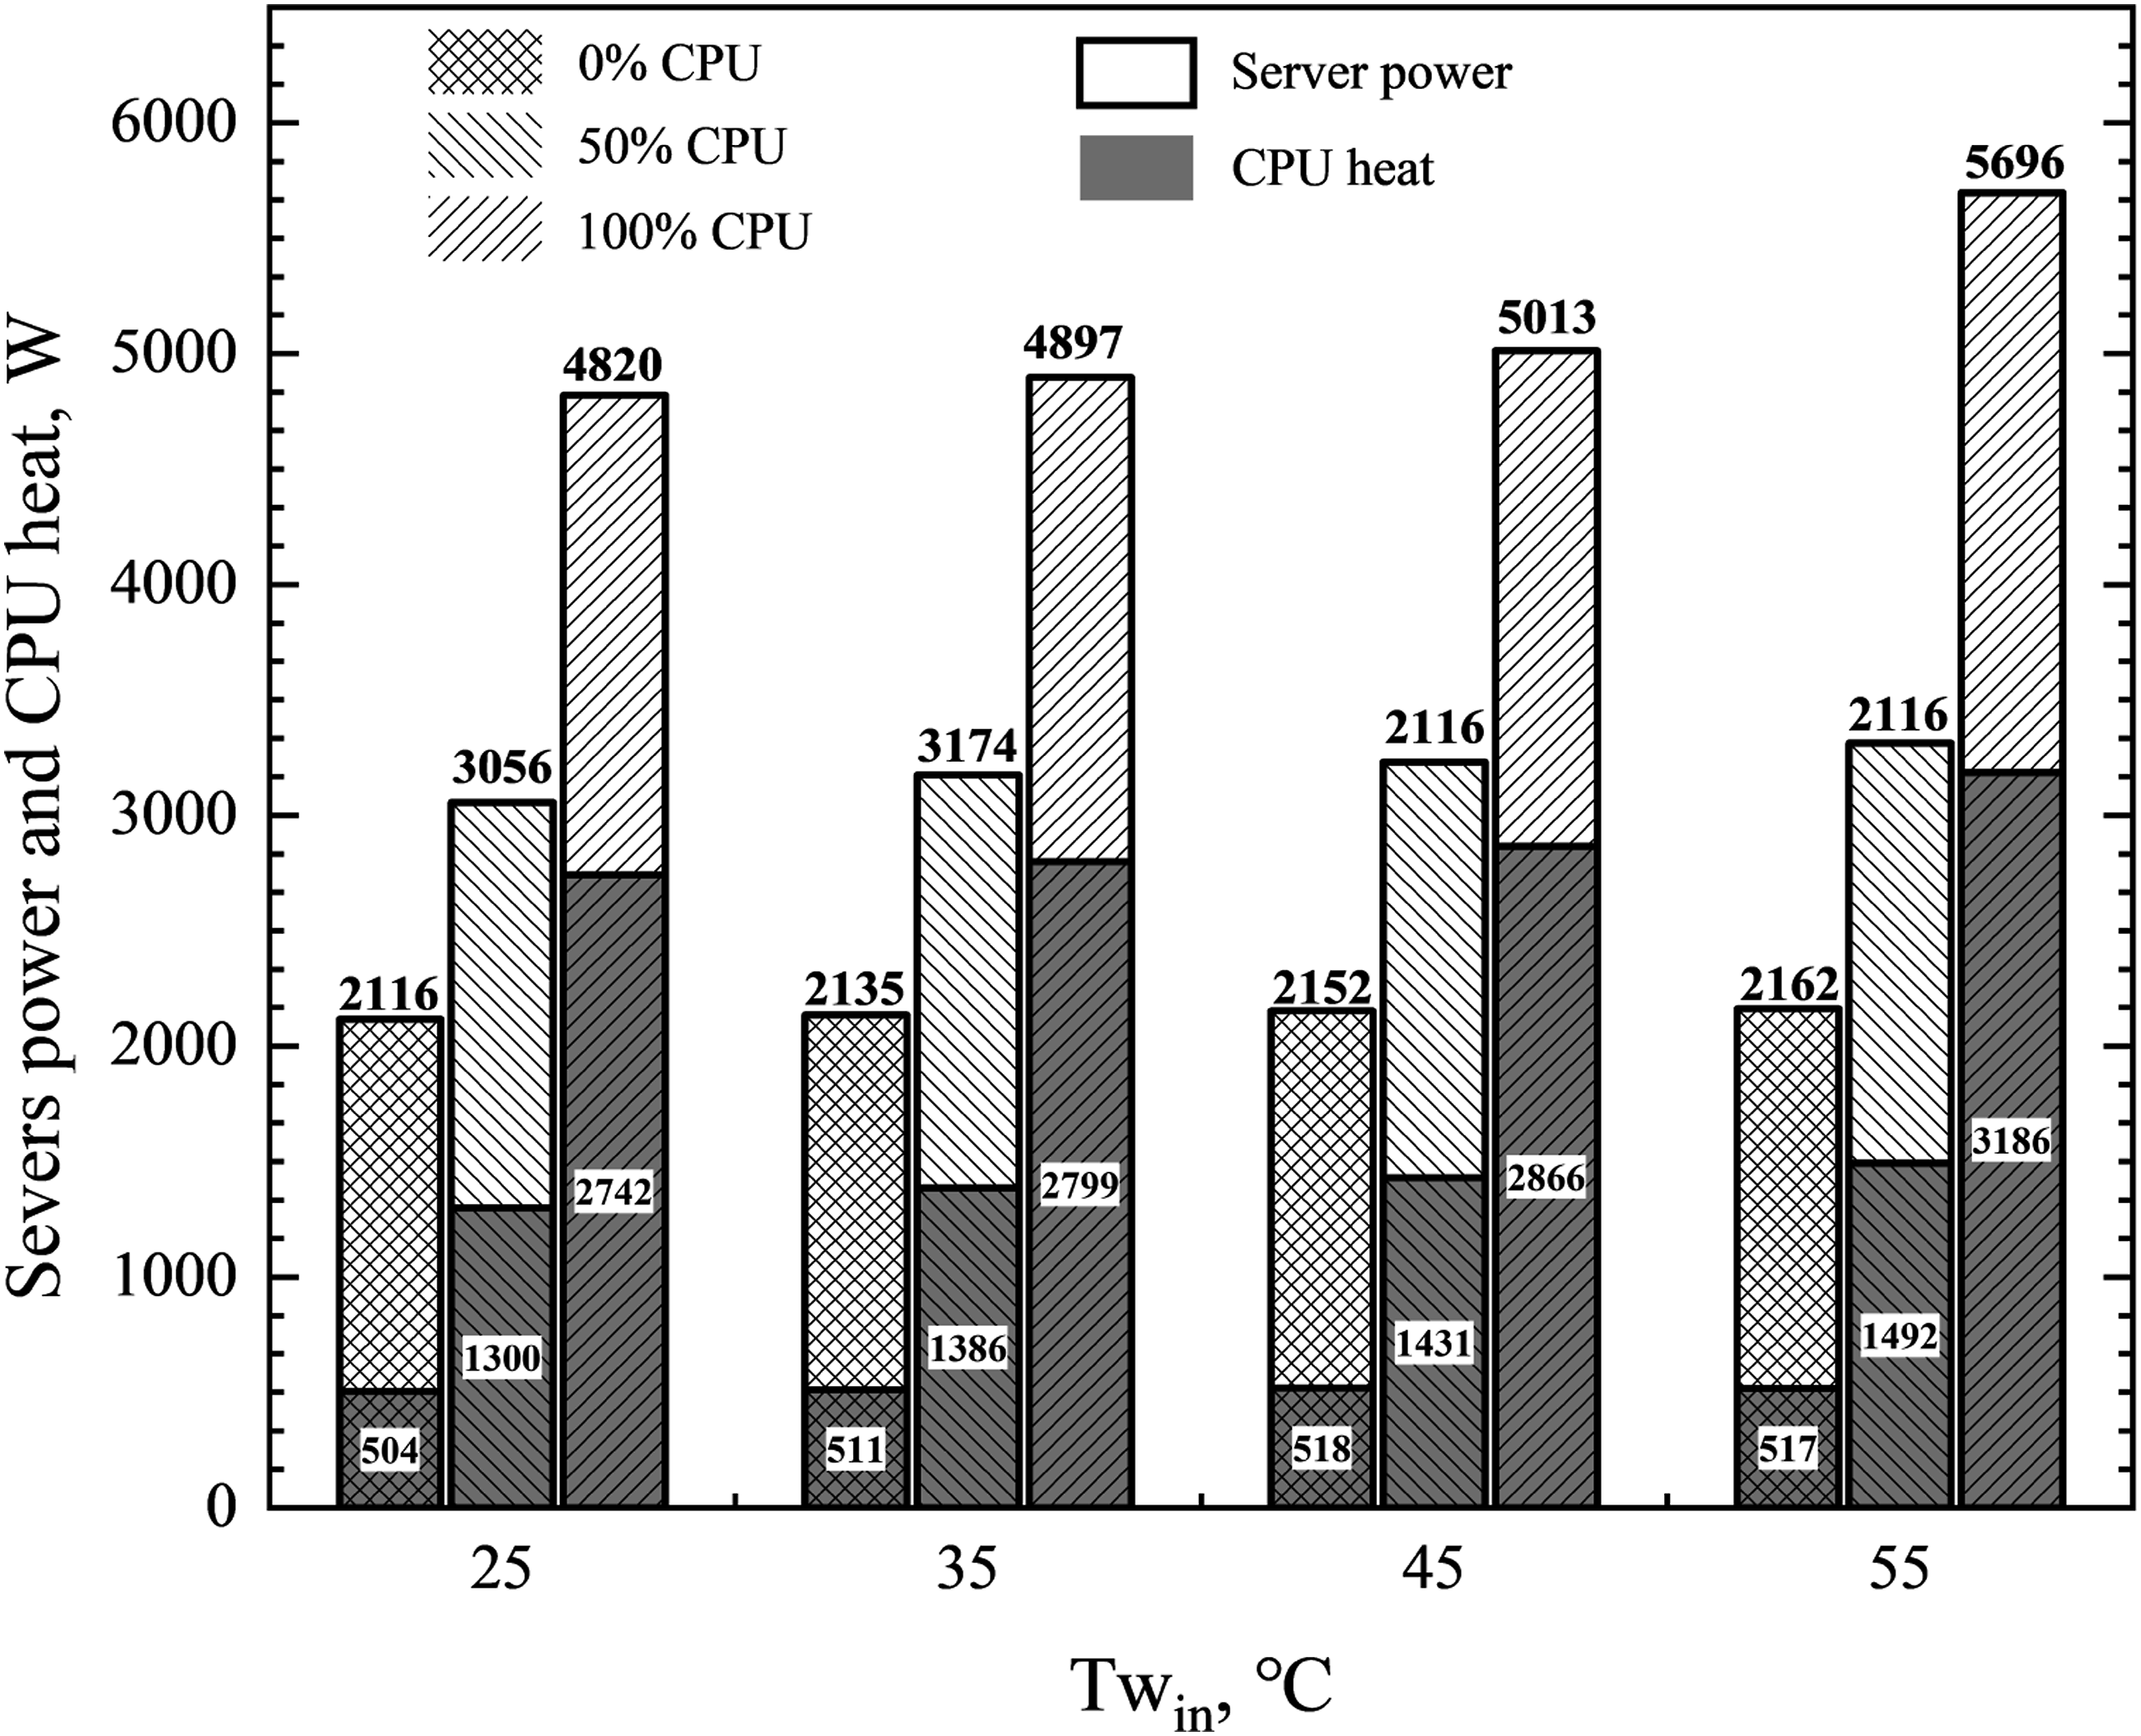
Effects of different flow resistance in the liquid phase zone and gas–liquid phase zone on PCTCS performance
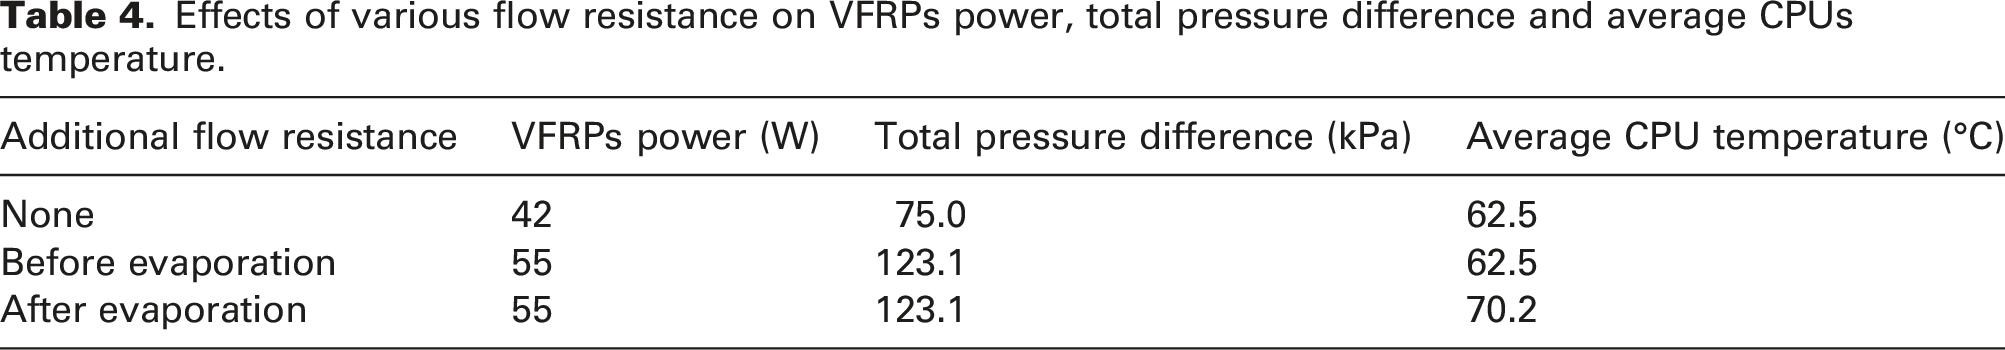
The effects of various flow resistances in the liquid phase zone and gas–liquid phase zone on the PCTCS are illustrated in Figure 16 and Table 4. Before flowing through the mini-channel evaporators, the refrigerant had a liquid phase, which changed to a gas–liquid two-phase after it flowed through the mini-channel evaporators. To analyze the influence of the flow resistance at different positions on the PCTCS, the total pressure drops of the two experiments were set to equal values by adjusting the openings of the hand valve and the electric valve, respectively. For the pressures at the different positions in the IRC, as illustrated in Figure 16, although the two different additional flow resistances caused the same total pressure difference, the additional flow resistance before the evaporation increased the pressure difference between the VFRPs. The servers and only the VFRP outlet pressure were increased. By comparison, the additional flow resistance after evaporation increased the pressure difference between the servers and the plate heat exchanger and increased the pressure at the plate heat exchanger. As displayed in Table 4, while the total pressure difference and the VFRPs power of the PCTCS were the same for the different two additional flow resistances, the average temperature of the CPUs was considerably higher when the additional flow resistance was in the gas–liquid zone than when the additional flow resistance was in the liquid zone. This phenomenon occurred because although the cooling water temperature and the condensation temperature of PCTCS were the same, the additional flow resistance in the gas–liquid zone increased both the refrigerant evaporation pressure and evaporation temperature. In the PCTCS, the evaporation temperature in the mini-channel evaporators exhibited a strong positive correlation with the average temperature of the CPUs. Therefore, reducing the flow resistance in the IRC, both in the liquid zones and gas–liquid zones, can decrease both the total pressure difference and the VFRP power. Moreover, decreasing the flow resistance after evaporation by the mini-channel evaporators is crucial for reducing the temperature of the CPUs and improving PCTCS performance. Effects of various flow resistance on IRC pressure. Effects of various flow resistance on VFRPs power, total pressure difference and average CPUs temperature.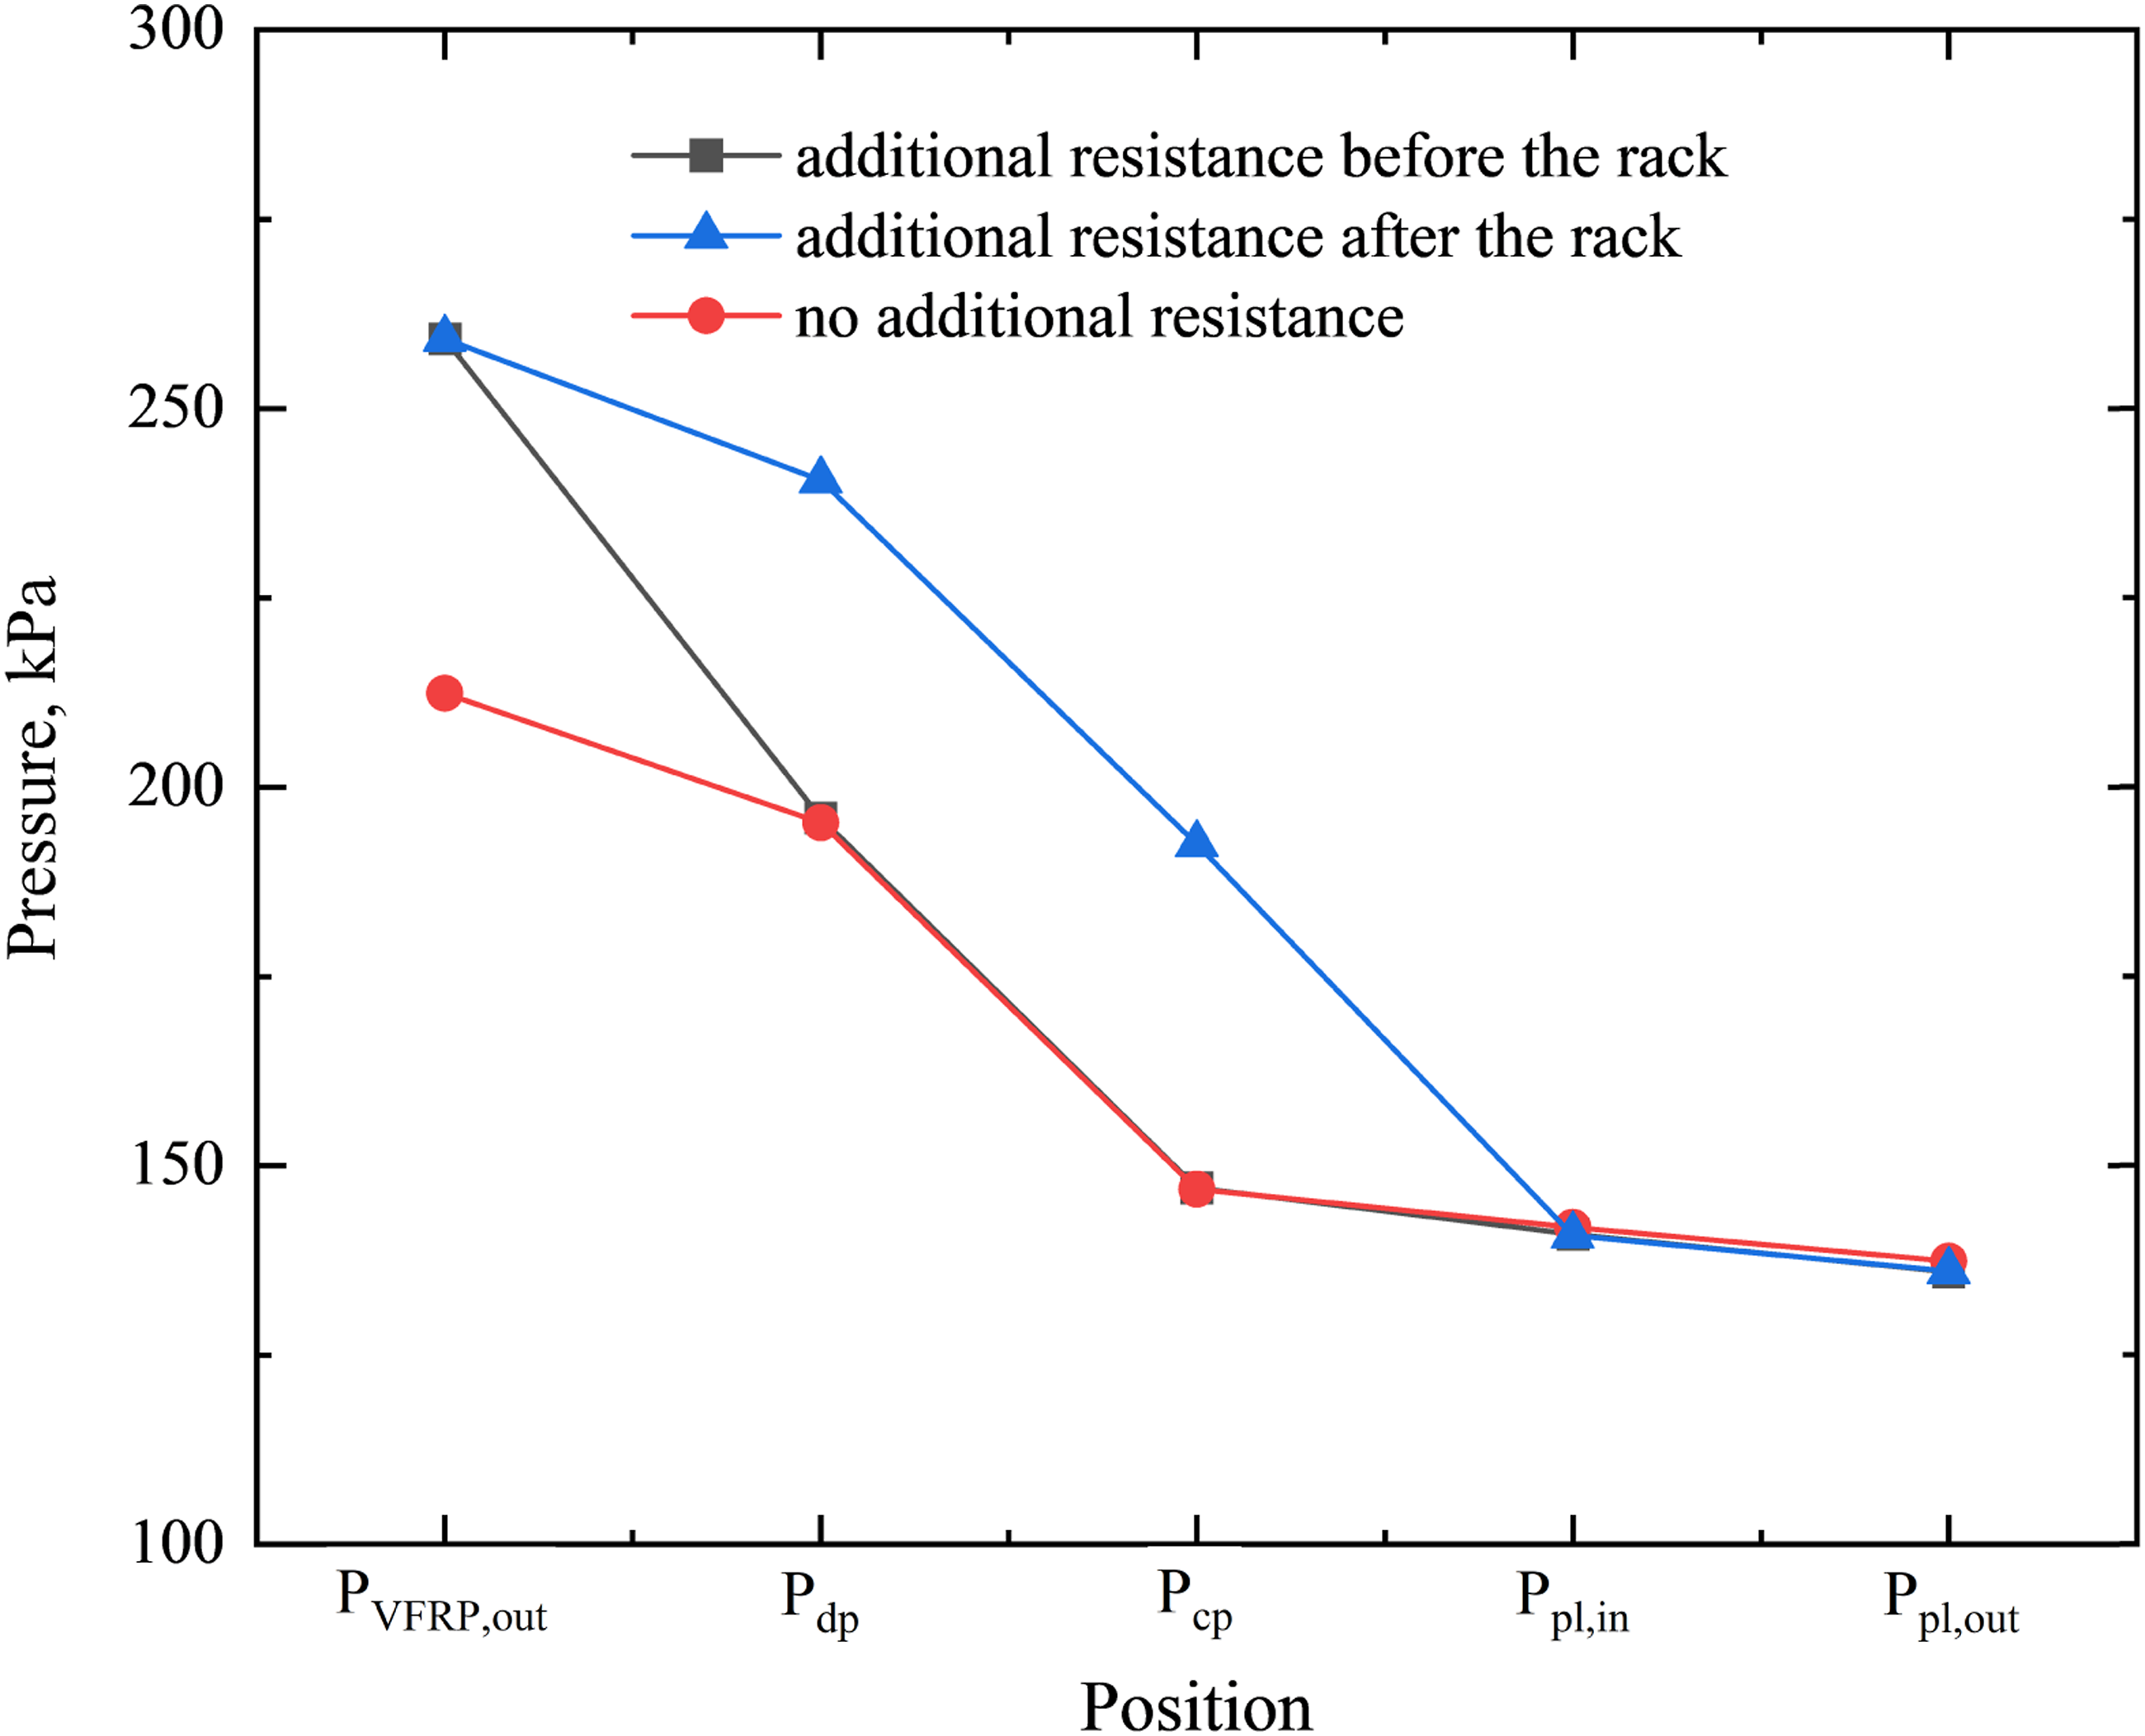
Conclusions
In this study, we developed a novel PCTCS for an actual small DC. The effects of CPU load, cooling water temperature, refrigerant flow and additional flow resistance on the performance of the PCTCS were experimentally analyzed. In comparison to CRAC systems, the PCTCS has a higher energy efficiency ratio for the component that drives the refrigerant and can easily cool the servers’ CPUs using natural cold sources throughout the year in most places. The conclusions of the study are as follows. 1. The proposed PCTCS can effectively cool CPUs with various loads and cooling water temperatures. Even under the most unfavourable conditions, the averages of temperatures of all the CPUs and the highest CPU temperature are lower than the CPU temperature limits. For example, with a 100% CPU load and a cooling water temperature of 55°C, the average temperature of all CPUs is 76.3°C and the highest CPU temperature is 79.0°C. Both temperatures are significantly lower than the CPU temperature resistance limit (i.e. 95°C). Cooling water with a temperature of 55°C can be easily cooled by natural cold sources throughout the year in almost every Chinese city. Furthermore, the higher the cooling water temperature, the lower the temperature difference between the CPUs and the cooling water and the better the cooling performance of the PCTCS. However, under the same CPU load, the higher the cooling water temperature, the higher the power consumption of the servers, especially when the CPU load is high. Therefore, the recommended cooling water temperature in the PCTCS is between 35°C and 55°C. 2. Compared with CRAC systems, the proposed PCTCS uses VFRPs instead of compressors. The energy efficiency ratio of the VFRPs is considerably higher than that of the compressors, especially when the CPU load is high. When CPU load is 0%, the value of EERp is 17–18; when CPU load is 50%, EERp is 38–42; and when CPU load is 100%, EERp is 68–76. However, cooling water temperature has negligible influence on EERp. 3. With an increase in the refrigerant flow rate, both the VFRP power consumption and CPU temperature are increased. However, the influence of the refrigerant flow rate on CPU temperature is considerably less notable than on VFRP power consumption. Thus, the increase in refrigerant flow can slightly deteriorate the cooling performance of the PCTCS, and considering the reliability of DCs, a slightly large refrigerant flow in PCTCS is acceptable. 4. In the PCTCS, the flow resistance in various zones of the IRC increases the total decline in pressure and VFRP power, thereby negatively affecting the performance of the PCTCS. Moreover, the flow resistance in the gas–liquid phase (after the evaporators) increases the difference between the CPU temperature and the cooling water temperature, thus degrading the performance of the PCTCS. Therefore, optimizing the flow resistance in the gas–liquid zone is more crucial than it is in the liquid zone (before the evaporators).
Footnotes
Acknowledgements
We would like to express our deepest gratitude to Mr Ren (Xiang Yang Solergy Technology Co., Ltd.) who provided experimental equipment and experimental site.
Author contributions
All authors contributed equally in the preparation of this manuscript.
Declaration of conflicting interests
The author(s) declared no potential conflicts of interest with respect to the research, authorship, and/or publication of this article.
Funding
The author(s) disclosed receipt of the following financial support for the research, authorship, and/or publication of this article: This work was supported by the Xiang Yang Solergy Technology Co., Ltd.