
Abstract
The indoor environment quality in care facilities impacts residents’ daily lives. Sensor technology has been proven useful in evaluating the indoor environment of buildings, but the process of using this information to improve residents’ comfort, specifically in the context of nursing homes, is still underdeveloped. Thus, this study focuses on monitoring indoor environmental quality in a nursing home in the Netherlands, supported by professional caregivers’ insights. A campaign was conducted for one year to monitor eight rooms, and a mixed-method approach was used to collect and analyse the data on local weather, building facility operation and proxies’ responses to residents’ comfort. Seventeen care professionals and twenty-two guardians (visitors) answered questions based on their opinions and observation. The results show that the low indoor humidity during heating seasons and high CO2 concentration at night were the main factors leading to environment-related symptoms of residents and care professionals, such as dry eyes. Furthermore, we found that data outliers can help to reveal residents’ occupancy, ventilation habits and activity time, thus showing the application value of environmental sensors in dementia care. We also recommend using non-intrusive sensors for nursing home residents and taking into account room layouts and occupants’ conditions before installing sensors.
Introduction
According to the World Alzheimer Report 2021, 1 over 55 million people live with dementia globally, and this number is steadily increasing. In the Netherlands, an estimated 280,000 people have been diagnosed with dementia, of which 70,675 lived in care facilities in 2018. 2 Smart technology development and application contribute to dementia care with health assessment and monitoring, maintenance of functioning and caregiving management. 3 Over the past decade, many projects in the Netherlands have deployed advanced technologies in homes and care facilities to support people with dementia in their daily activities or social interaction.4,5 However, most applications were focused on preventing dangerous situations rather than improving well-being or coping with dementia symptoms. 6 Because of the hallmarks of dementia (e.g. cognitive decline, memory loss and difficulties in learning new tasks), interactive technologies could be unsuitable in practical situations. 7 Technologies for people with dementia usually have simple functions, such as the smart pillbox reminding them to take medicine on time. 8 For privacy protection and ethical issues, users do not readily accept intrusive technologies with surveillance cameras and audio recording devices. 9 Therefore, sensors, as non-intrusive technologies, are widely used in care facilities and tested in dementia studies. 10
Research used monitoring technologies in care facilities.
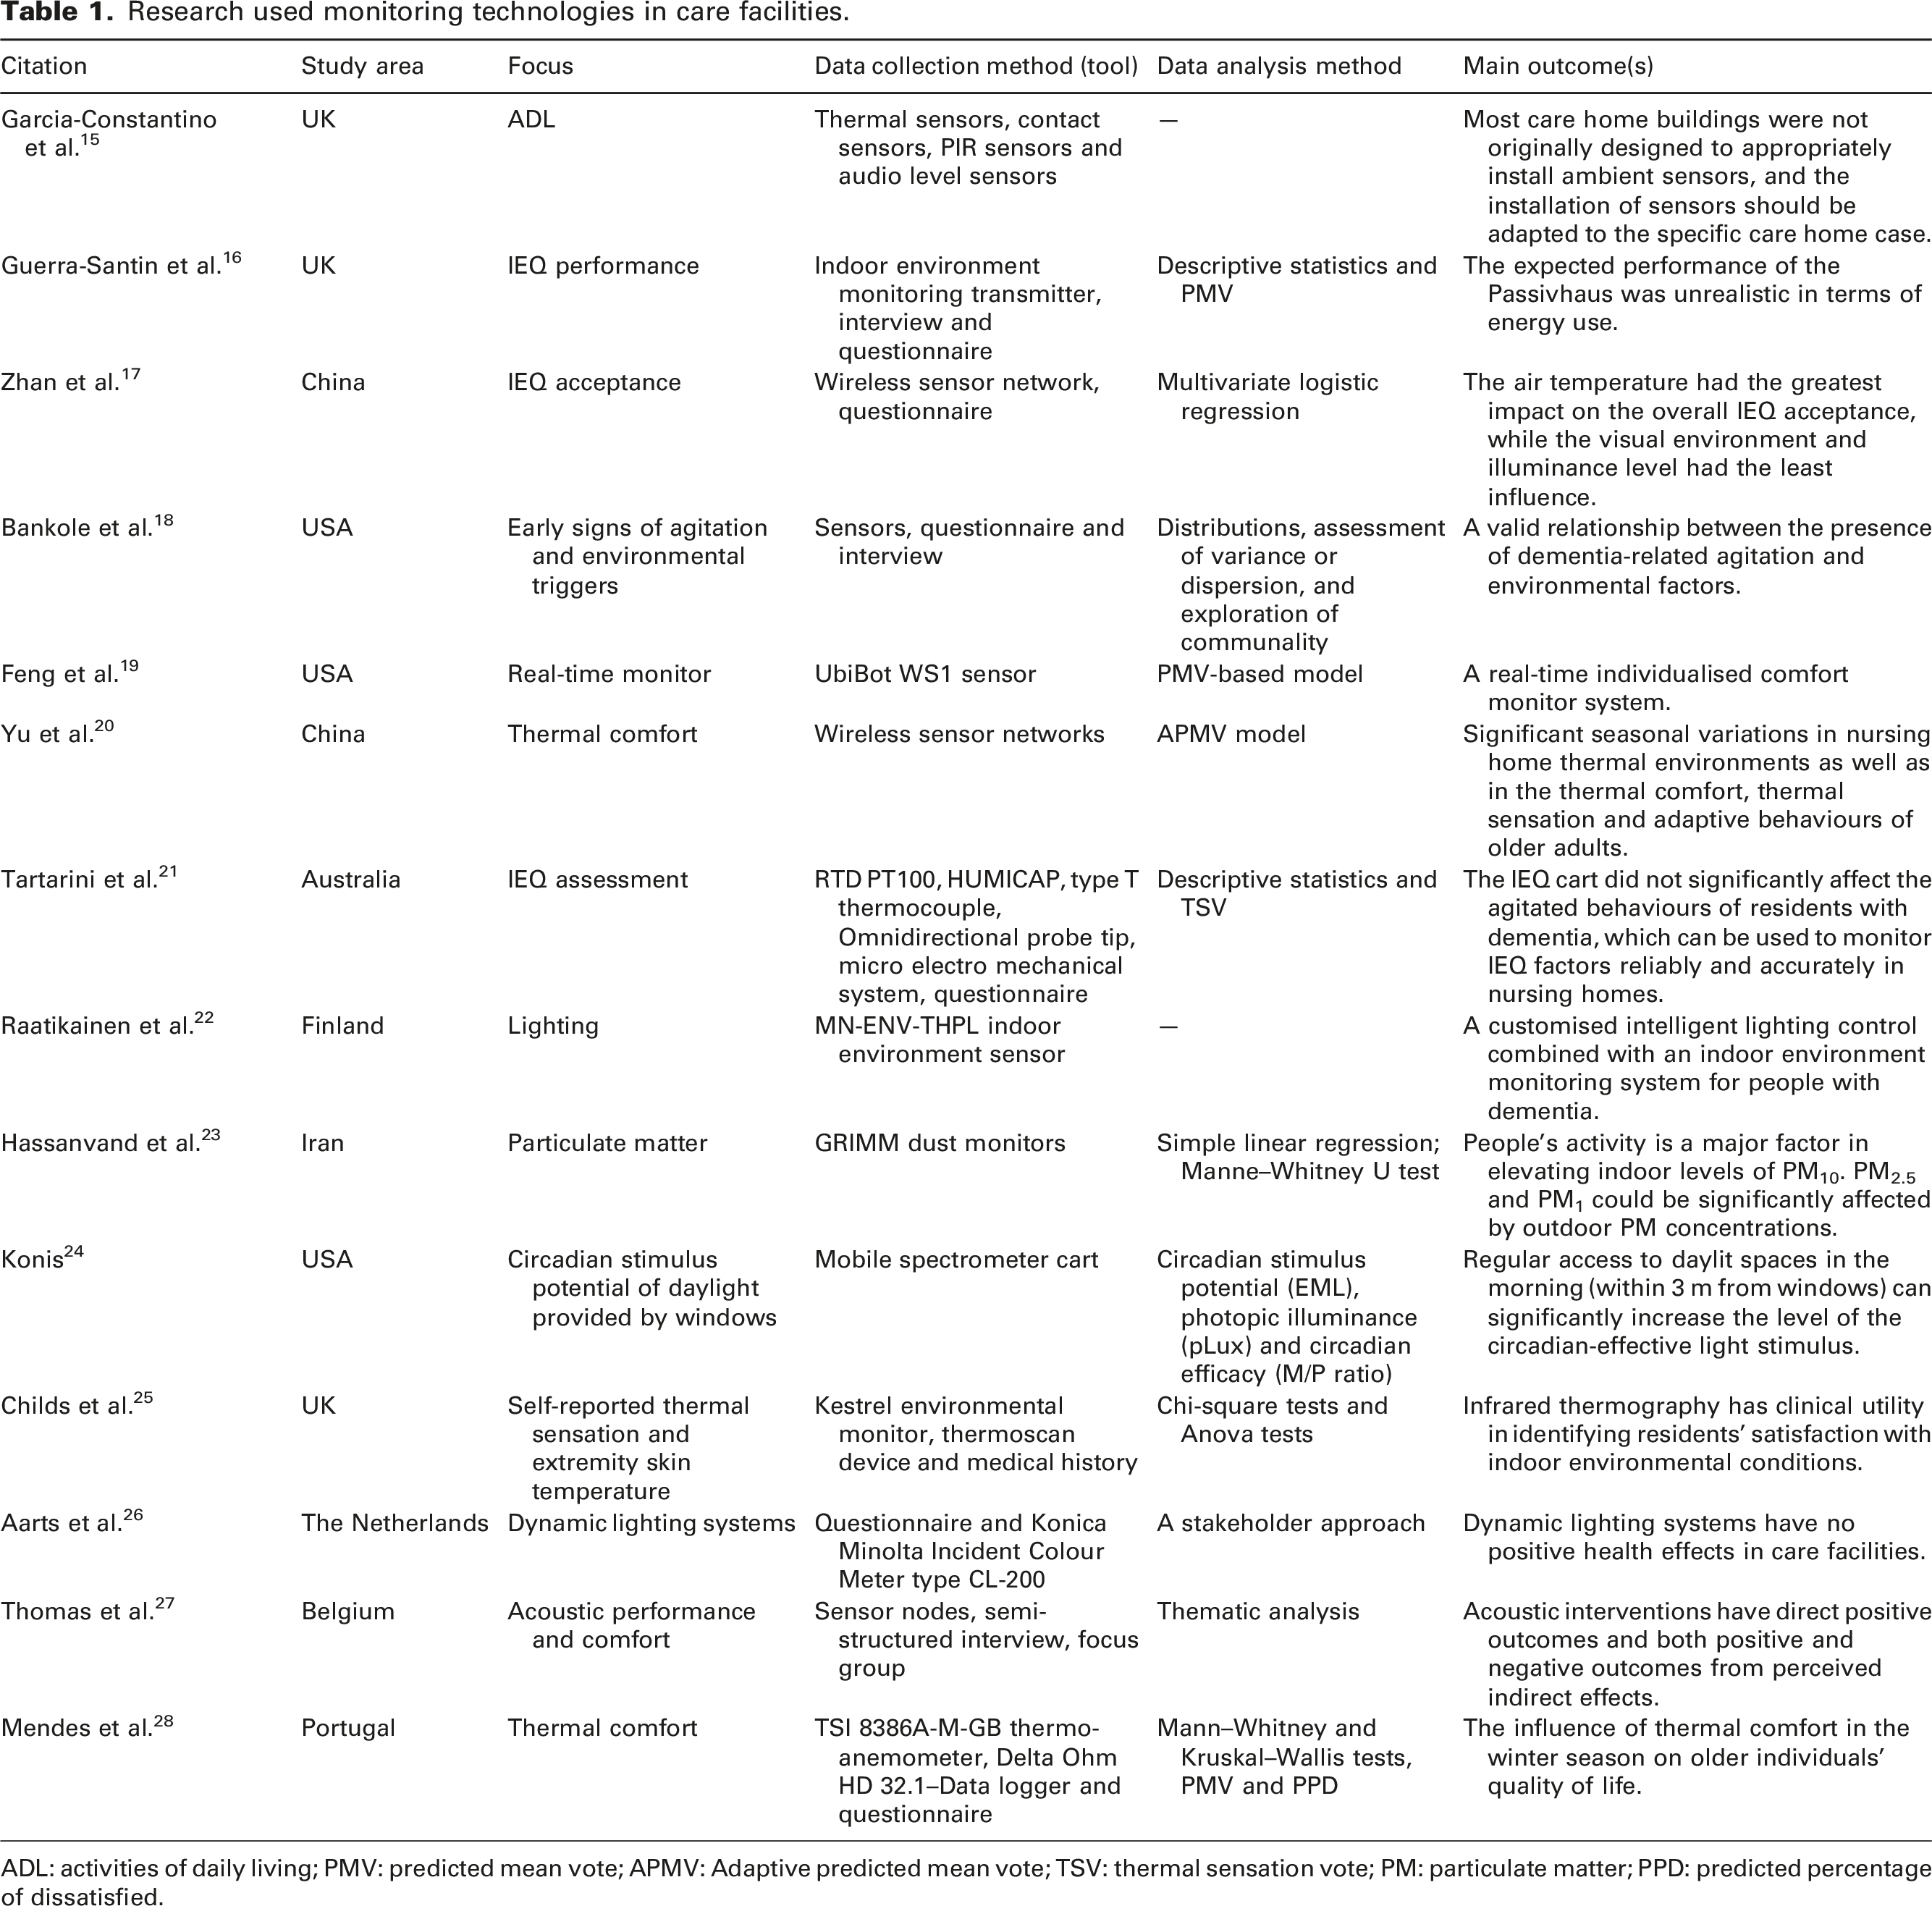
ADL: activities of daily living; PMV: predicted mean vote; APMV: Adaptive predicted mean vote; TSV: thermal sensation vote; PM: particulate matter; PPD: predicted percentage of dissatisfied.
Based on the existing literature, the sensory deviation and acceptance threshold amongst people with dementia on indoor environmental factors, such as ventilation frequency and ambient temperature, are still unknown. 34 There is also a lack of information on the effects of indoor environmental indicators on people with different degrees of dementia. 29 The existing knowledge mainly looks at the influence of single indoor environmental indicators on health and comfort and does not take them into account in a holistic way. 35 Indoor environment standards and guidelines, such as EN ISO 7730 36 and ASHRAE 55, 37 focus on healthy adults and are not entirely applicable to frail older groups. 38 Older adults usually spend most of their day (80%–90%) indoors, and this percentage is likely even higher amongst nursing home residents. 32 Exposing them to unsatisfactory indoor environmental conditions could adversely influence their physical and mental health.39–41 Furthermore, these health risks increase when people develop deterioration of cognitive abilities and increasing difficulties in expressing themselves. 42
Sensors are widely tested in monitoring the living environments of people with dementia. However, as Table 1 shows, the application remained on the data collection level, and the studies rarely bridged connections between sensor data and residents’ comfort. The guideline for appropriately deploying environmental sensors in nursing homes is also lacking. Thus, this study had a twofold goal. Firstly, we assessed the IEQ in the studied facility and investigated, based on objectively measured data and subjective opinions of people with dementia, their guardians and care professionals. Secondly, we validated the questionnaire responses with the data analysis results and explored the value of using environmental sensors in real-life dementia care.
Methods
Case study
The case study was in a small-scale care facility, which provides 32 bedrooms for 32 older people with dementia (above 65 years old). The red dots show the sensor locations in the nursing home (Figure 1). Each floor of this two-storey building includes two lounges, a central living room and a nurse station. A spacious green courtyard is on the ground floor. Each bedroom has a private bathroom. Residents can furnish their spaces with personal belongings. Bedrooms are orientated south or southeast. The building has a concrete structure and double glazing to achieve the standardised insulation level of old-age care facilities. The thermoregulating floor system consists of a gas-fired heating system supplying water to the entire building. The water is heated in winter and unheated in summer. The general temperature settings are 23°C during the daytime and 22°C between 6:00 p.m. and 4:00 a.m. all year. The temperature in each room can also be manually controlled by thermostats. One window in each bedroom can be opened for natural ventilation. The central mechanical ventilation has three grades of wind force for common spaces and bedrooms (low, medium and high airflow) to provide fresh air 24 hours. The wind force in bedrooms is usually lower than in common spaces. Floor plans and sensor locations in the case study.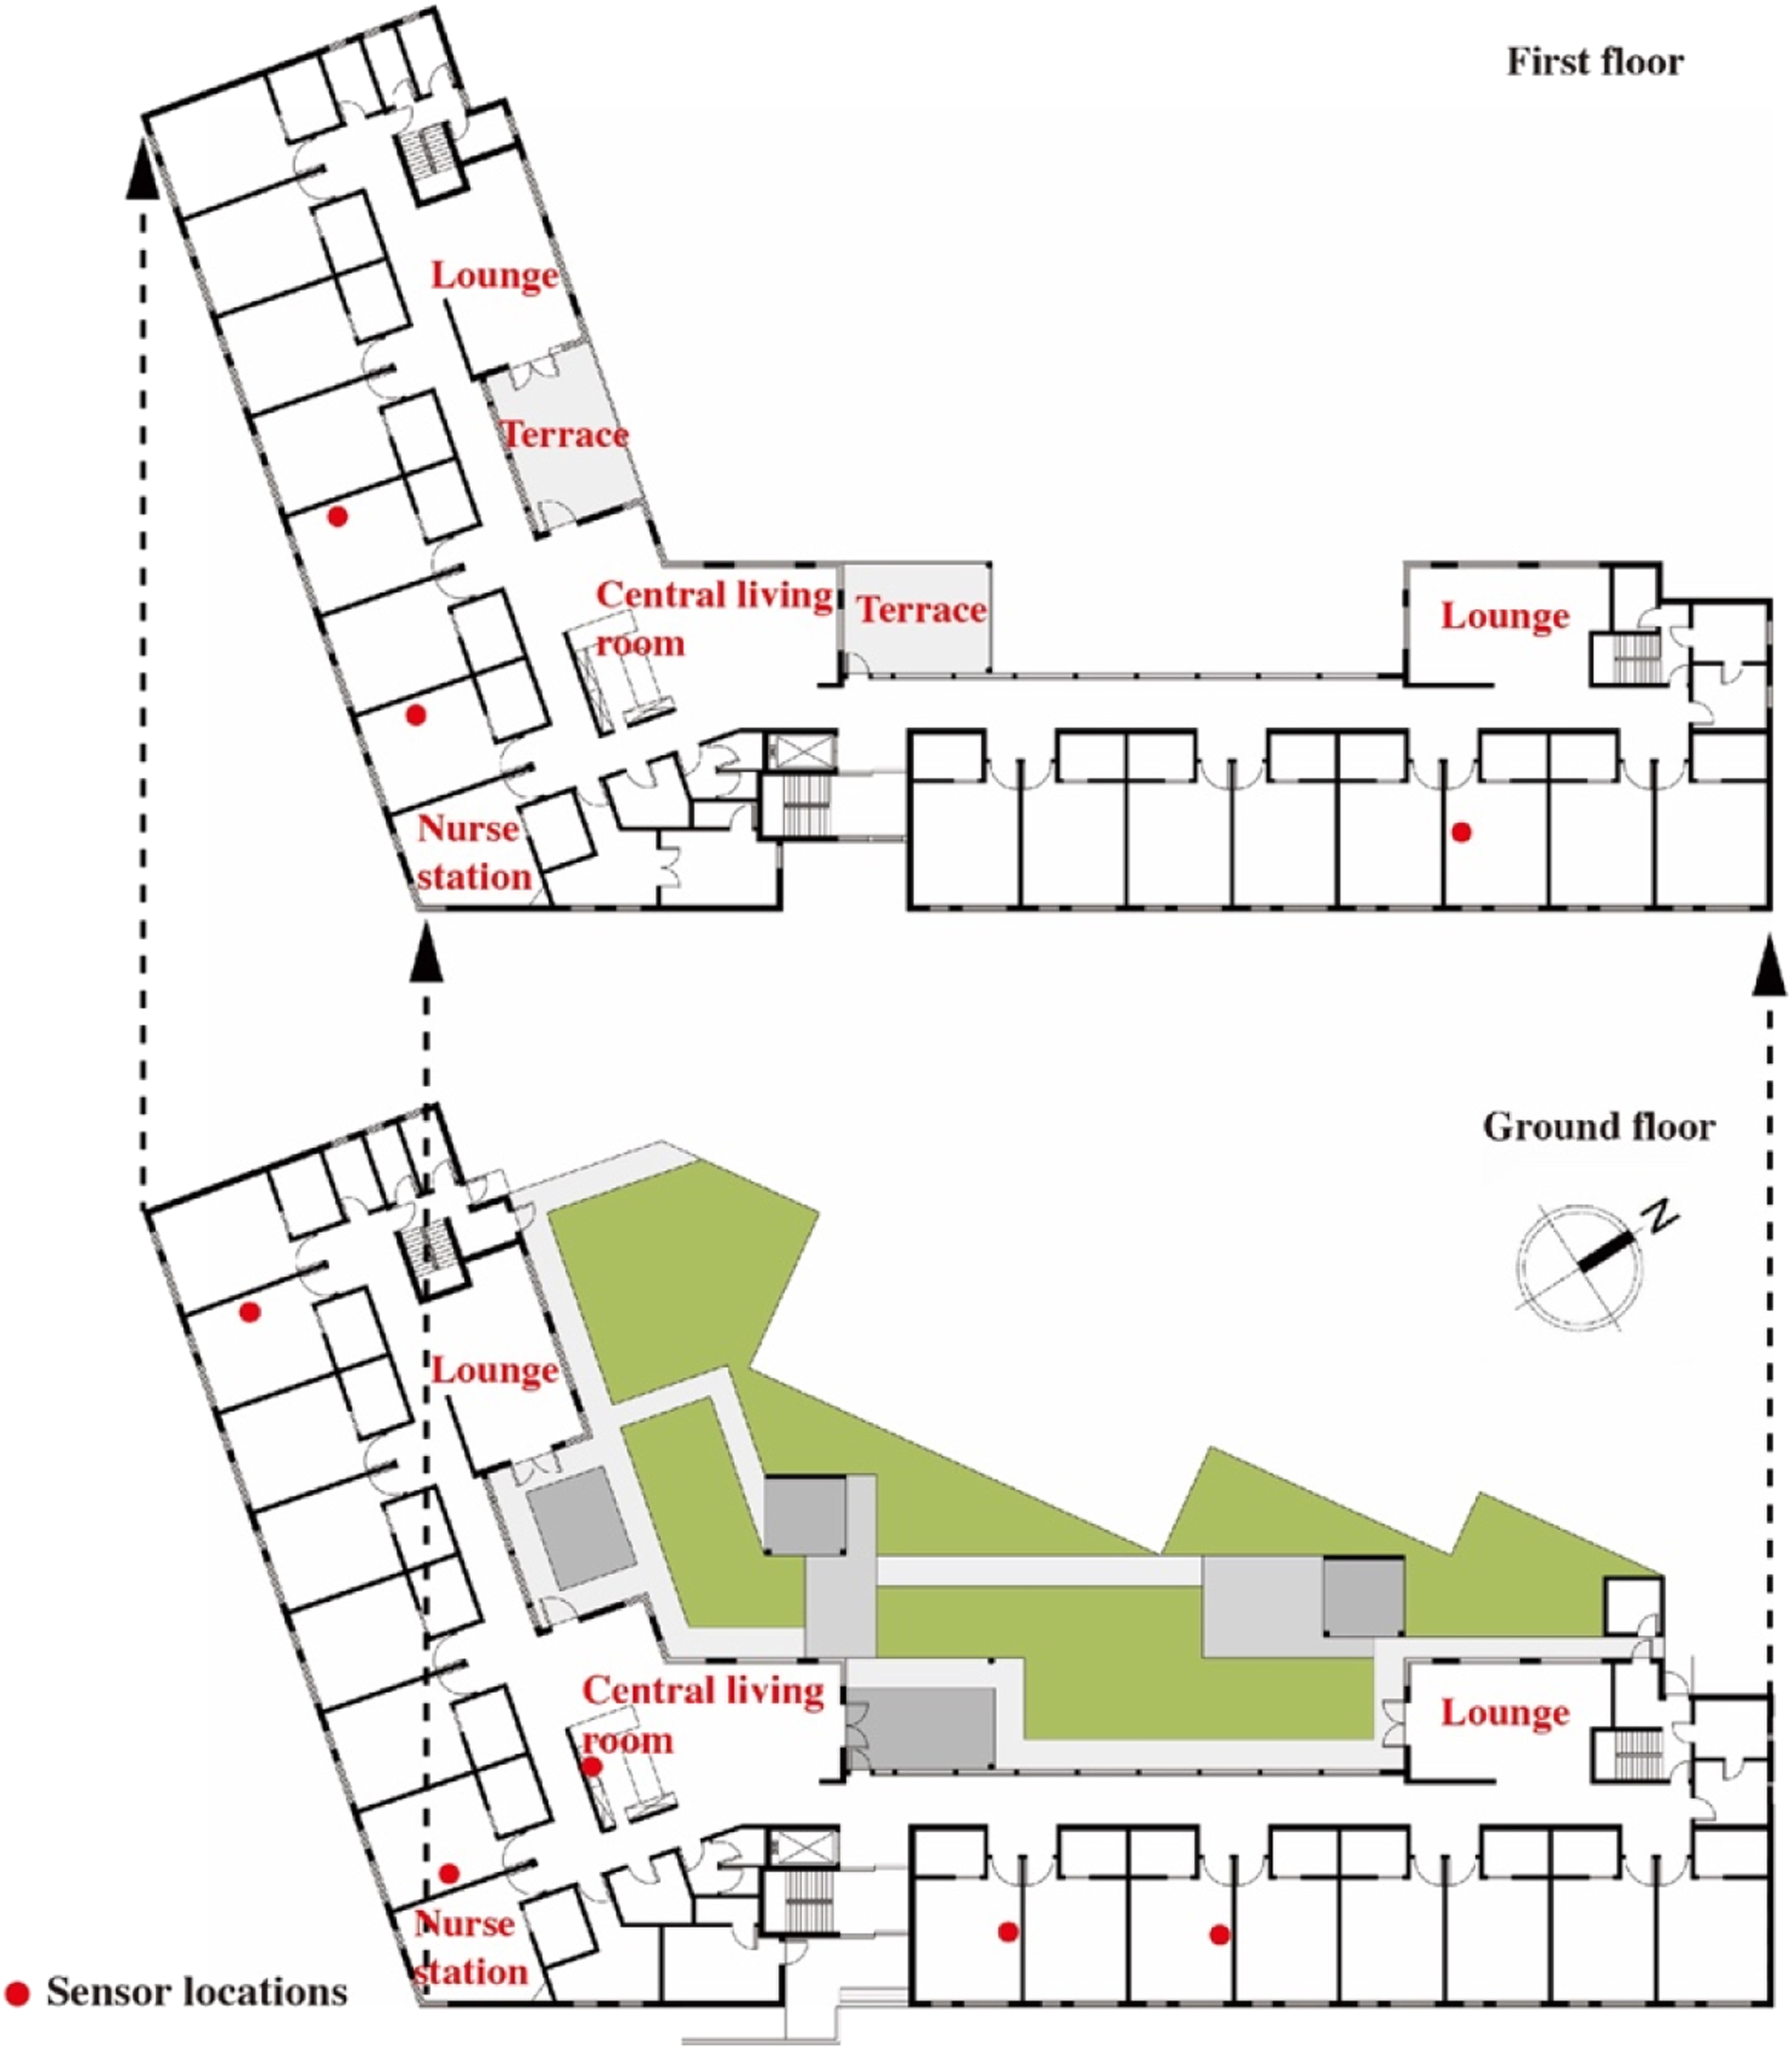
Monitoring campaign
The monitoring campaign was conducted from July 2019 to June 2020 and continuously collected indoor environmental data from eight rooms in the nursing home. We received consent for monitoring the bedrooms of seven residents. In these seven bedrooms, sensors were installed on top of wardrobes, and the receiver sides were towards the beds. The wardrobes have two positions: near the entrance or beside the bed (Figure 2). The sensor in the central living room was deployed at the top of the kitchen cabinet. The installation heights of these sensors were 1.8 m to avoid interfering with residents’ daily activities. The layout of the bedrooms.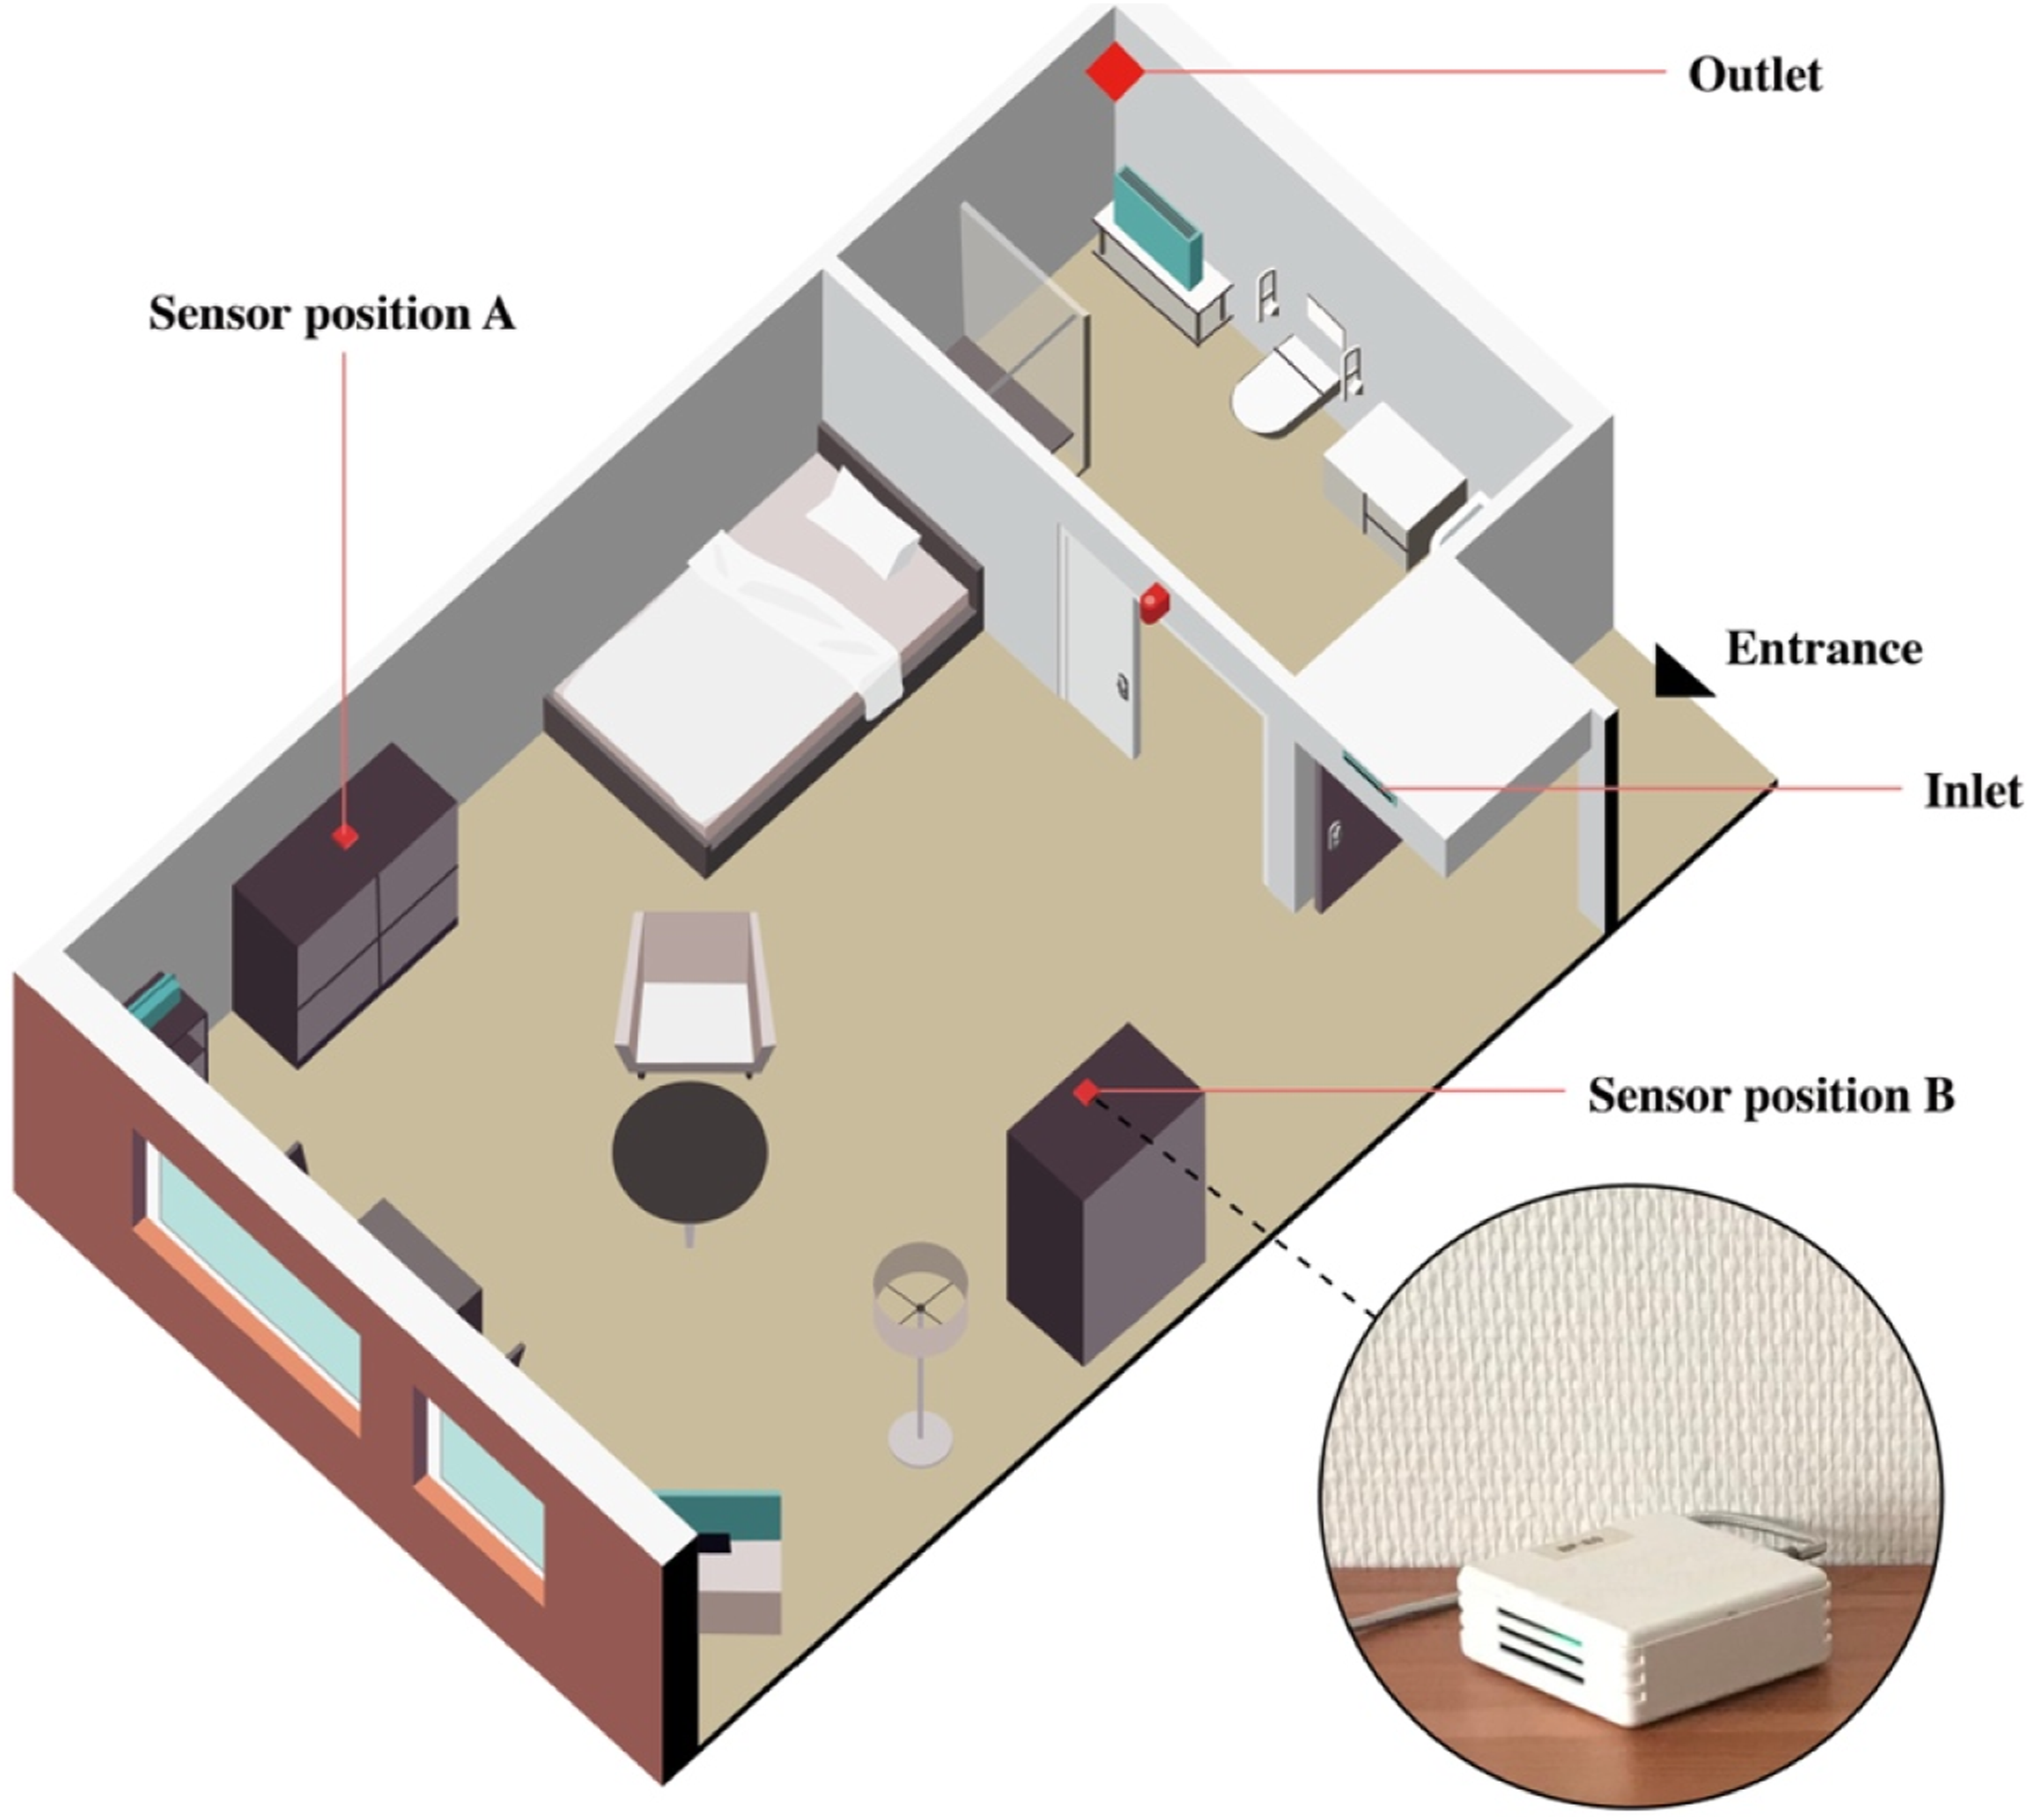
Sensor features
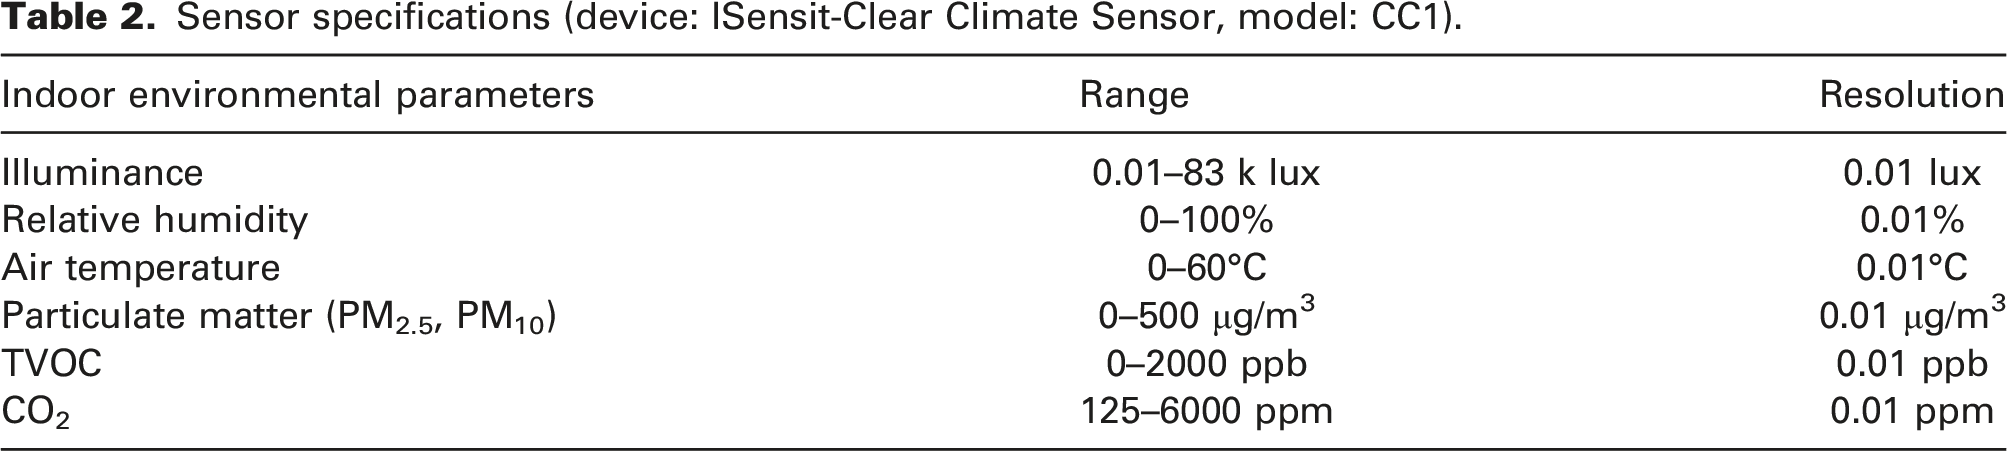
Sensor specifications (device: ISensit-Clear Climate Sensor, model: CC1).
Data collection and analysis
Before the monitoring campaign, possible confounders and modifiers were identified. These were classified into three categories: 1) environmental factors (location-specific weather conditions to which a building is subjected); 2) building characteristics (building quality, design, materials and facility operation); and 3) human activities and interventions (such as room occupancy and usage of appliances).
44
Therefore, as Figure 3 shows, we employed the local weather data from the Royal Netherlands Meteorological Institute (KNMI) database, obtained the building characteristics and building management information by interviewing the technicians, and investigated human factors through related records and interviews with care professionals. These three-category data were collected from September 2020 to February 2021. The possible confounders and modifiers were considered in the description of the relationship between IEQ parameters and the comfort of residents with dementia. Data types in the study.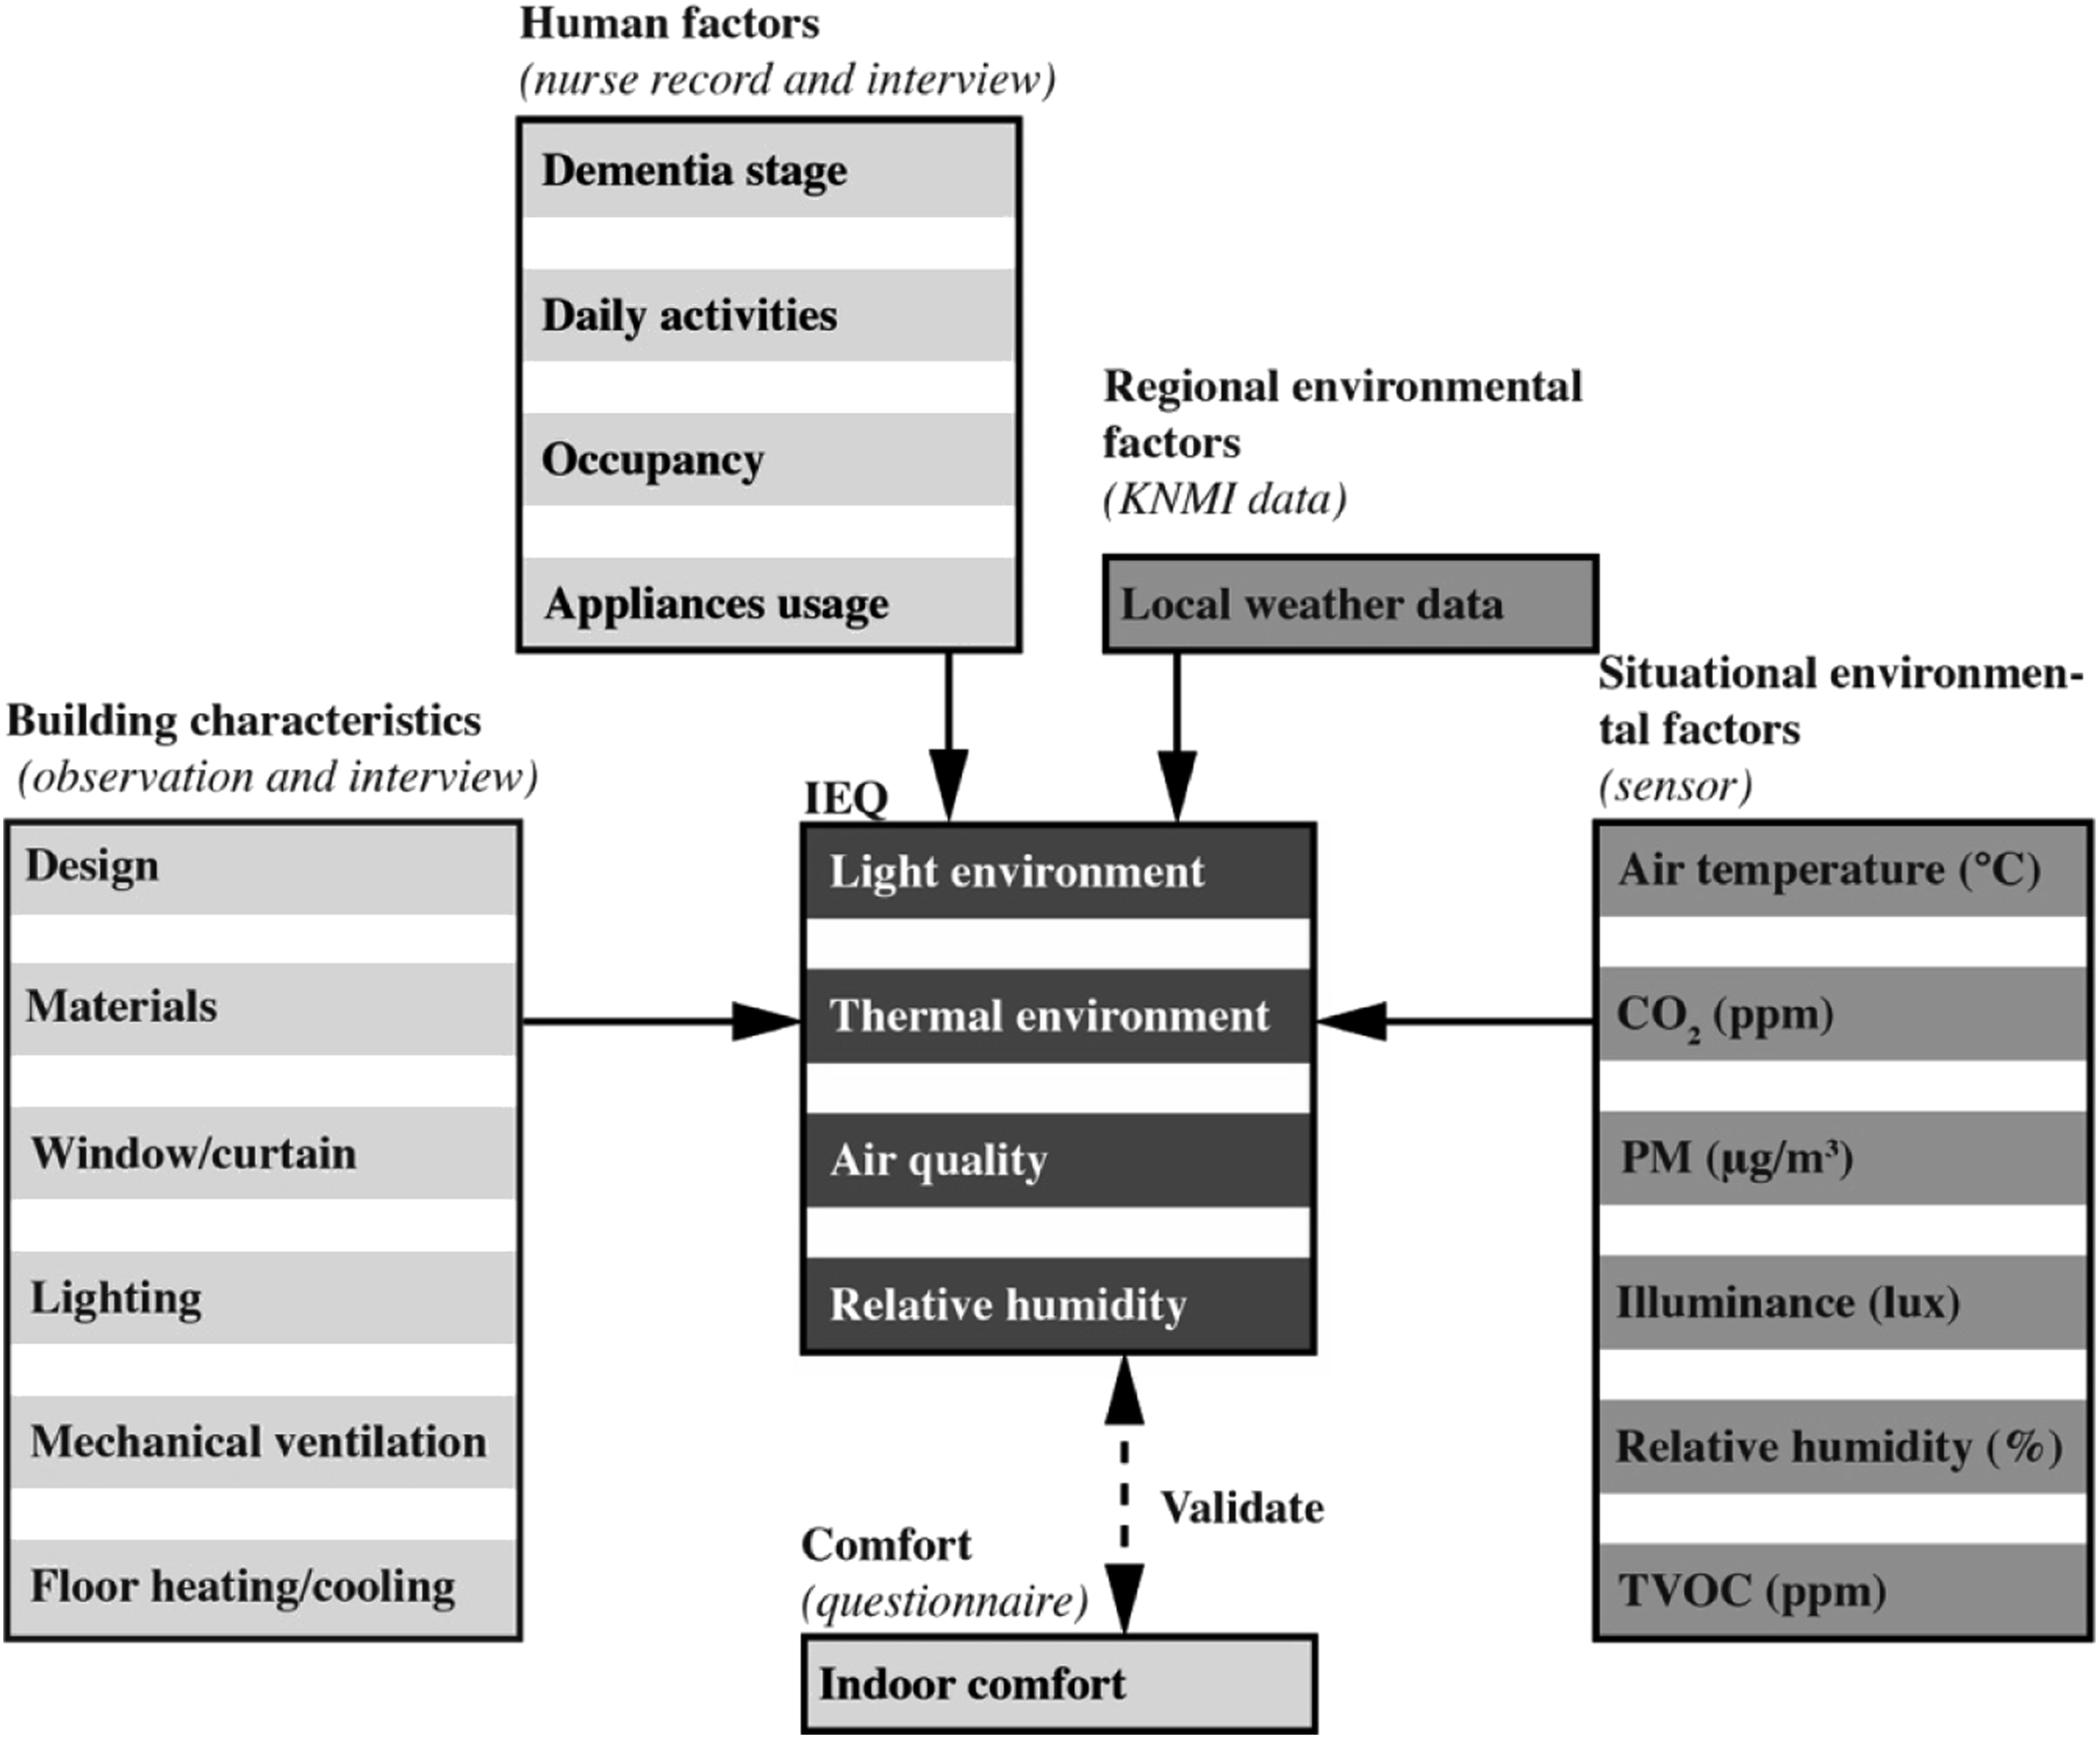
The environmental data collected from seven bedrooms and one central living room were descriptively analysed in SPSS. Box plots were created per room in two seasons (summer and winter) to show the IEQ in the studied facility when the weather changes led the outdoor environment to extreme conditions. The outliers of the data set were compared with the questionnaire responses for validation. Questionnaire responses were summarised in graphs to demonstrate the comfort and preference of different groups.
Participants and recruitment
The nursing home sent consent forms to residents, their guardians and care professionals and distributed anonymous online questionnaires. All participants were informed about the purpose of the study and signed a consent form. Seven residents gave permission to install sensors and collect data in their bedrooms. Their room numbers were replaced with letters that cannot be linked to specific participants.
Given the vulnerable status of people with dementia during the COVID-19 pandemic, the possibility of physical contact with them in the nursing home was excluded from this study. Thus, two questionnaires (A and B) were designed to obtain information on care professionals’, guardians’ and residents’ comfort in different seasons of the monitored year. The questionnaires consisted of three parts: demographic information, indoor environmental preferences and indoor comfort (7-point Likert scale). Questionnaire A, filled in by care professionals, focused on their opinions (e.g. what is your thermal comfort in the central living room during the winter? Please rate from 1-very cold to 7-very hot). Questionnaire B was designed for guardians (visitors) and concentrated on the basic information of their family members. The guardians were required to ask residents and fill in their answers to the questionnaire (e.g. in your opinion, what is the thermal comfort of your family in the bedroom during the summer, or how does the room feel to them? Please rate from 1-very cold to 7-very hot). Questionnaires with less than 50% completion were considered invalid.
Results
Questionnaire responses
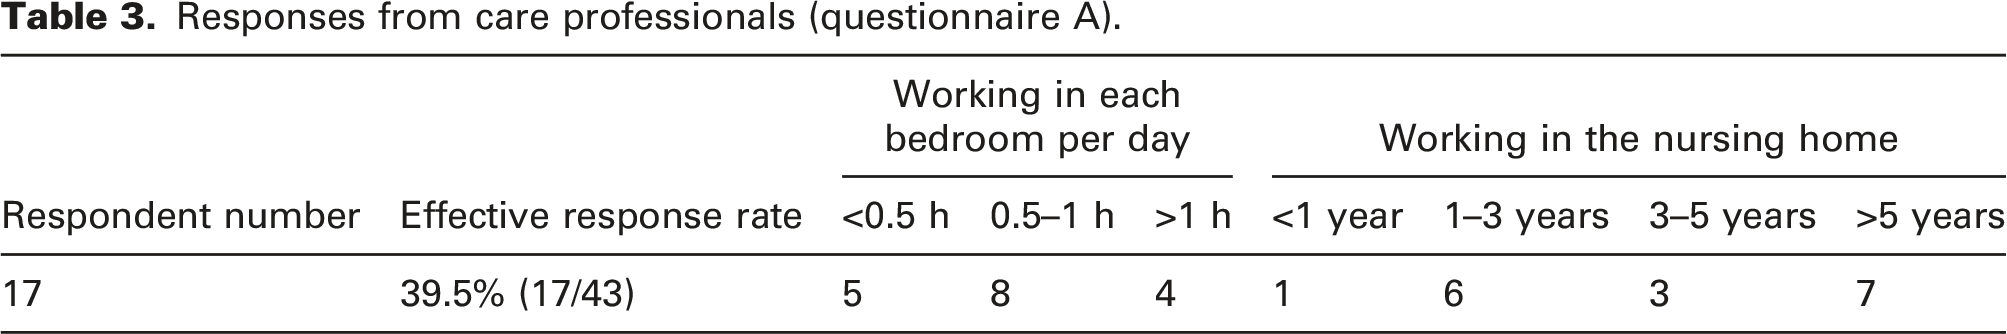
Responses from care professionals (questionnaire A).
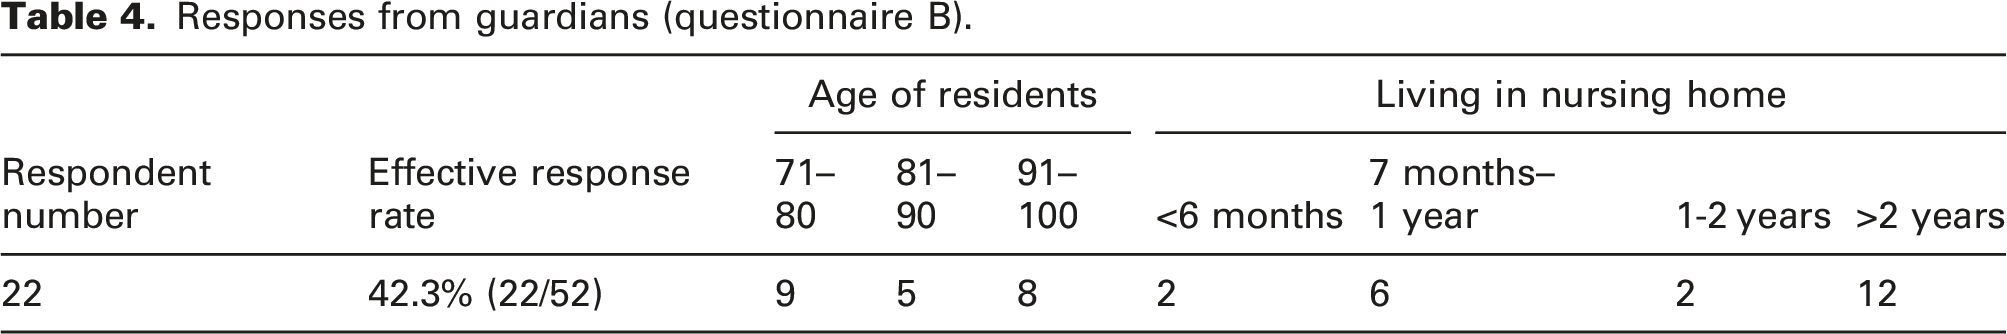
Responses from guardians (questionnaire B).
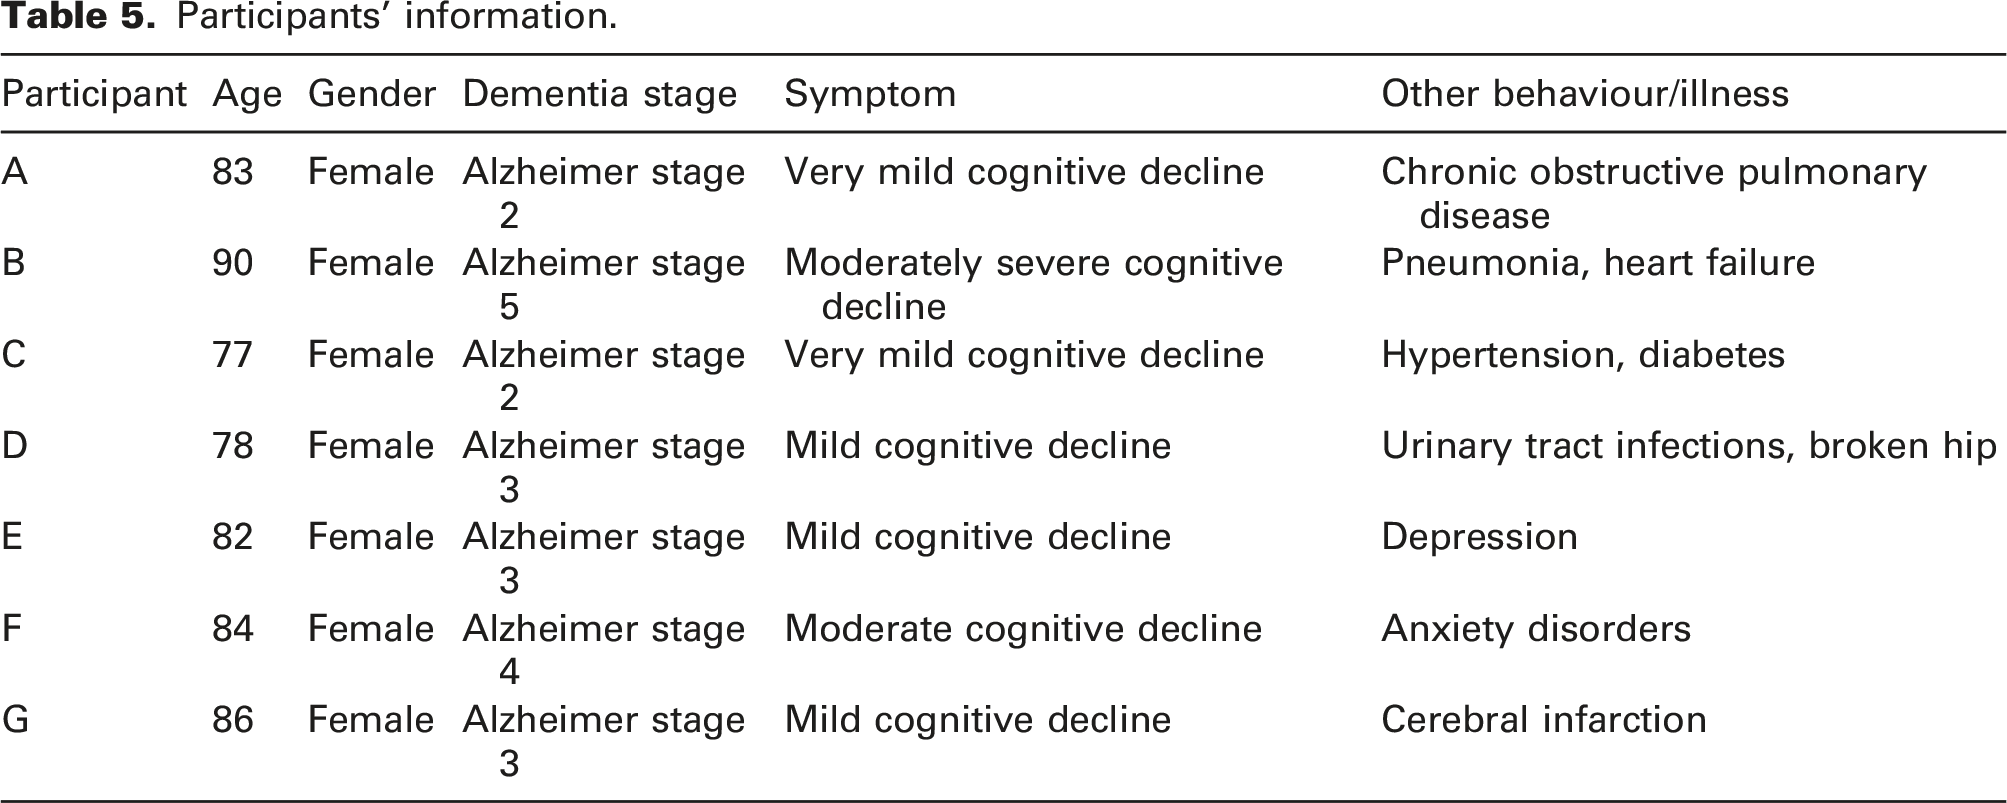
Participants’ information.
Thermal environment
Sensor data shows the temperature in bedrooms was steady between 22 and 23°C, usually with less than 1°C standard deviation in different seasons and no significant differences between seasons. The temperature in the central living room was always higher than in the bedrooms (Figure 4), especially during dinner time. Figure 4 also shows that bedroom temperatures were more constant in winter than summer. However, some bedrooms had a risk of overheating, as shown by the outliers of Room A in January. The temperature in Room B was stable all year, around 23°C. Furthermore, unoccupied rooms (Room A in February and Room G in December and January) were 2–3°C cooler than the other bedrooms in the same period. According to the weather data (KNMI), the local mean monthly temperatures in January and February 2020 were around 6–7°C. It can be seen that residents’ activities influenced the indoor air temperature to some extent, and the temperature data reflects the room occupancy. Box plot of indoor air temperature in summer and winter.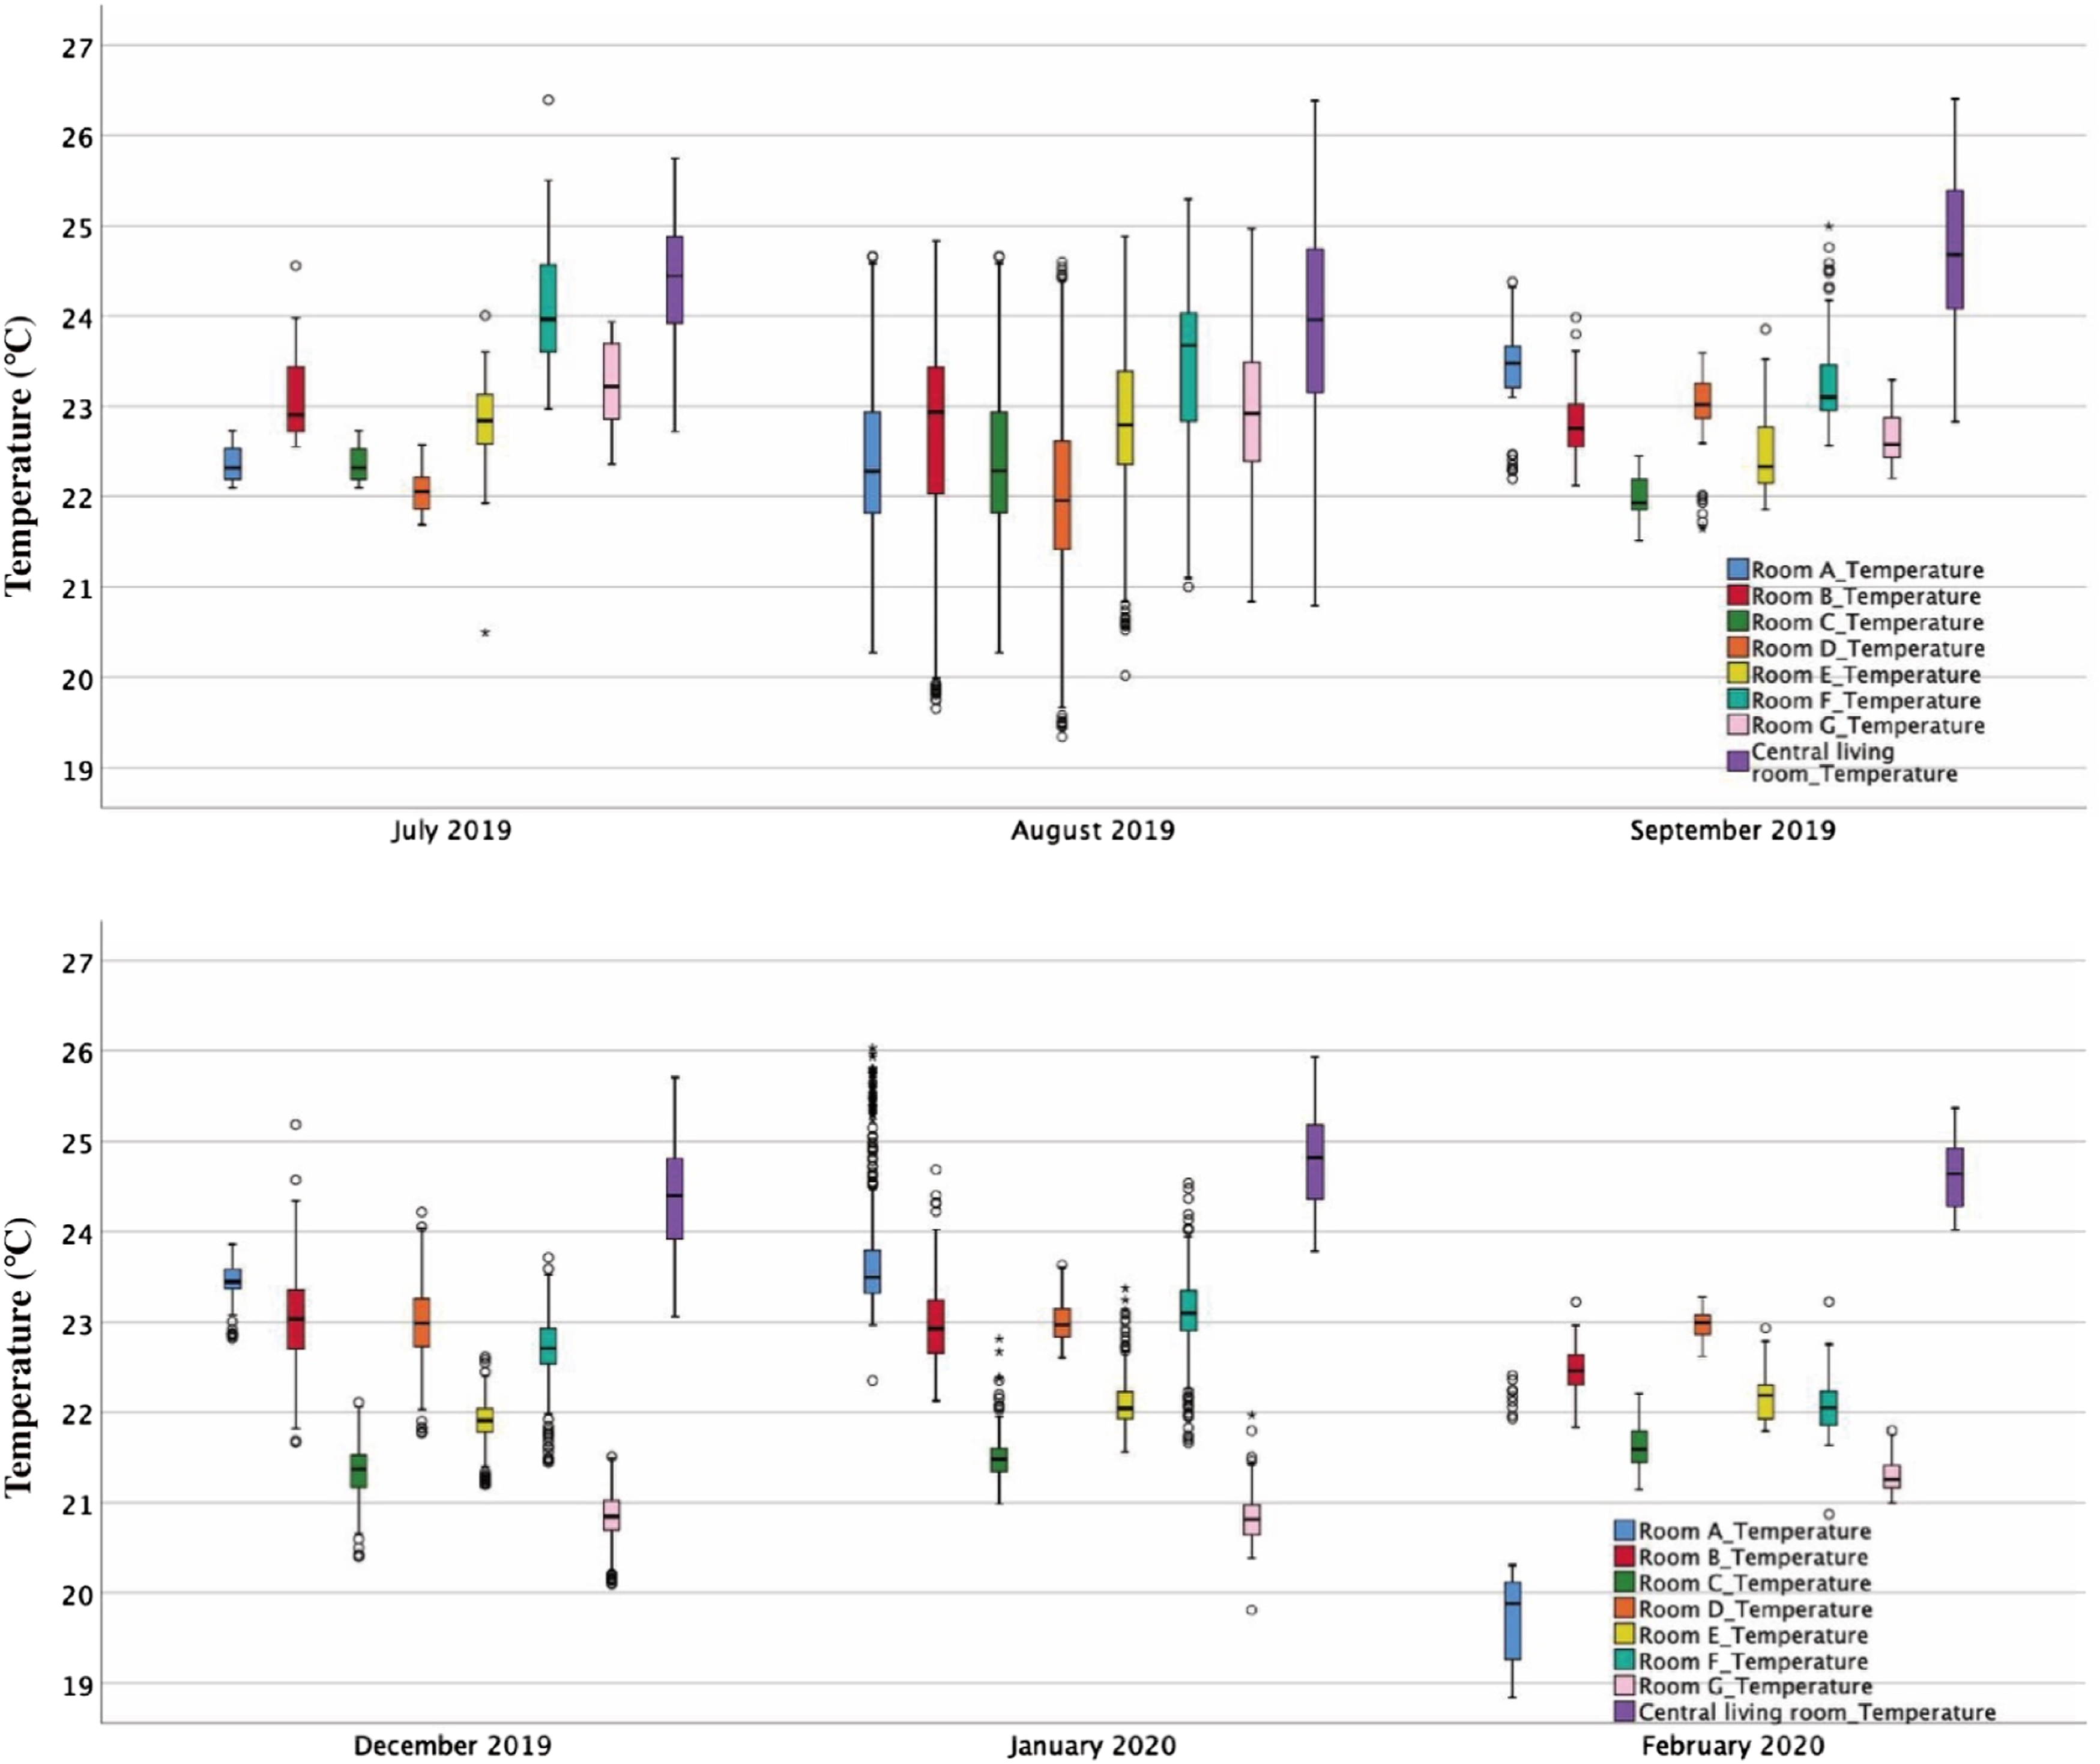
Participants had different views on indoor thermal comfort (Figure 5). The thermal sensation votes for bedrooms and the central living room in summer and winter show different patterns. Nearly 40% of care professionals reported that the interior spaces were hot during the summer, and the common areas (central living rooms and lounges) were overheated in winter. According to care professionals’ responses, the central living room was the hottest place in the building and had negatively influenced their work. In contrast, the guardians thought their family members were basically satisfied with the indoor thermal environment. Although 63% of the guardians thought the bedrooms were slightly hot in summer or slightly cold in winter, no one reported their family members feeling overheated or cold in the nursing home. Thermal sensation votes for indoor thermal comfort.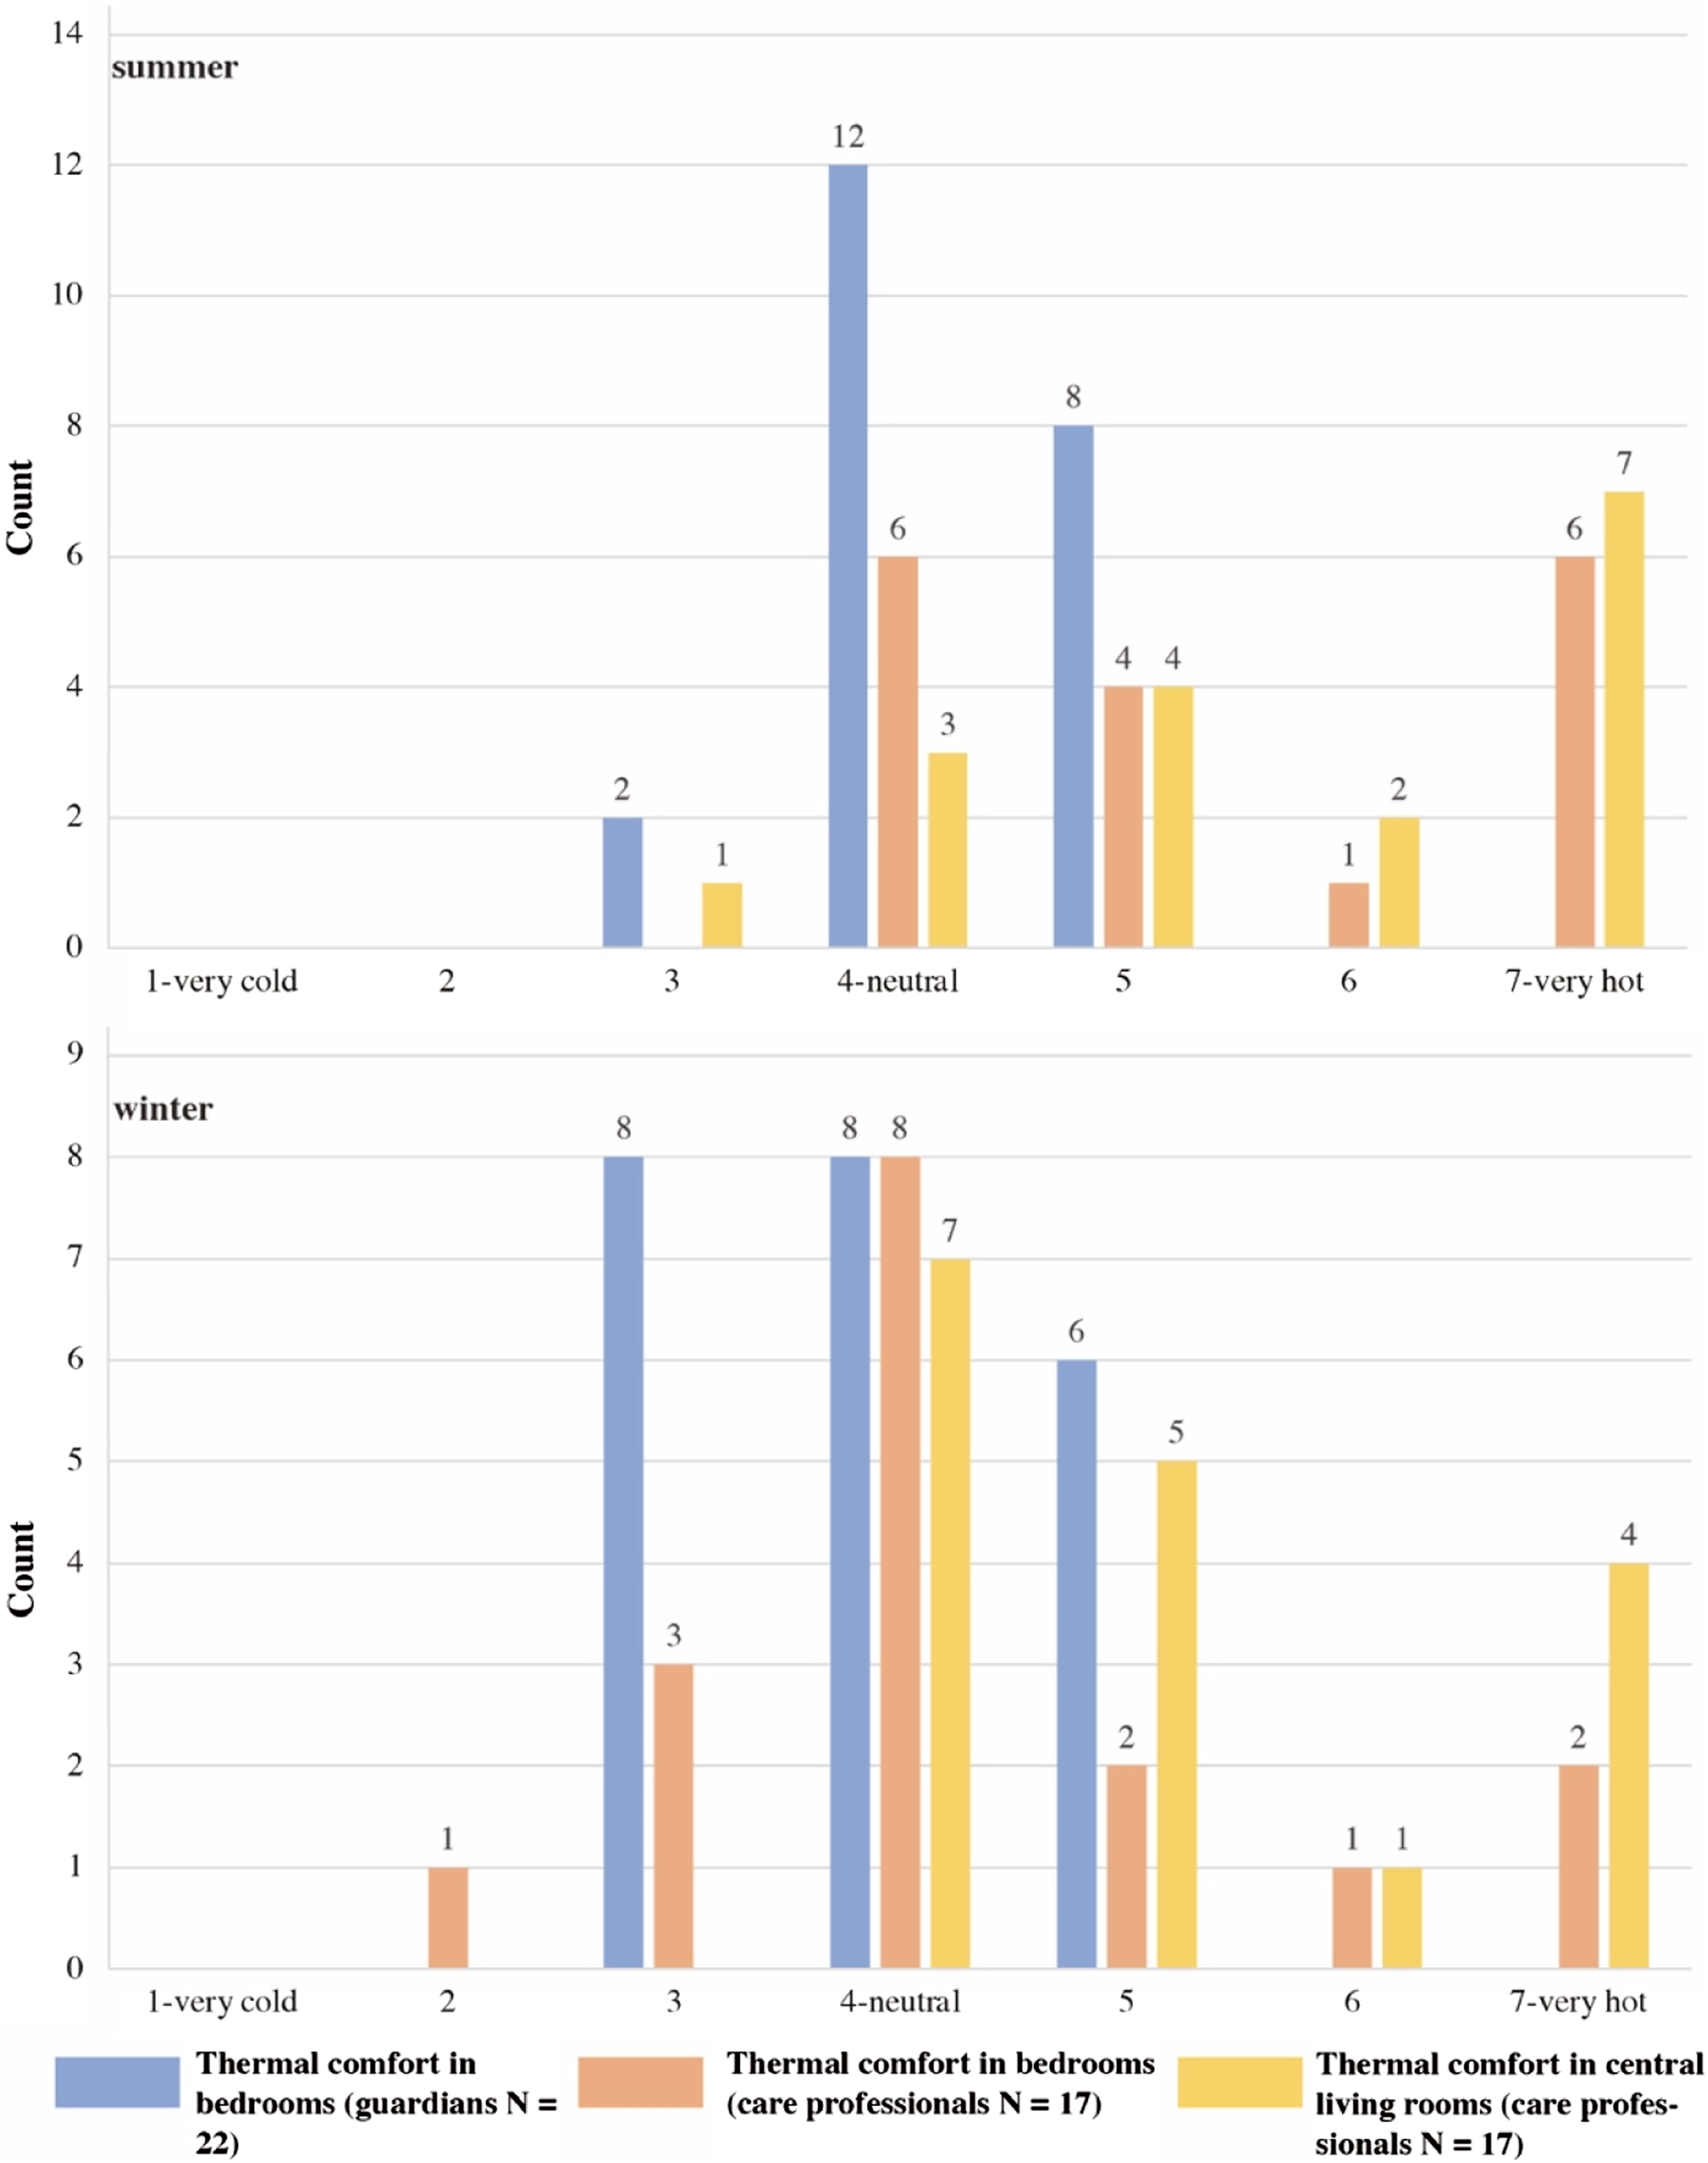
Relative humidity
The relative humidity is also a seasonal indicator in the studied nursing home. The highest value was detected in July 2019, around 60% in all rooms. From the end of October, humidity levels fell from 50% to 30%, and the levels in the nursing home remained low until May 2020. In 7 months, the mean indoor humidity of monitored rooms was lower than 40%. The mean values were lower than 30% in March and April 2020. There was little difference in humidity data amongst all rooms in the same season. The humidity fluctuations were larger in summer than winter (Figure 6). Because the outdoor humidity is normally higher than indoors in the Netherlands, the outliers of this box plot were related to the natural ventilation frequency of rooms, especially in winter. Box plot of relative humidity in summer and winter.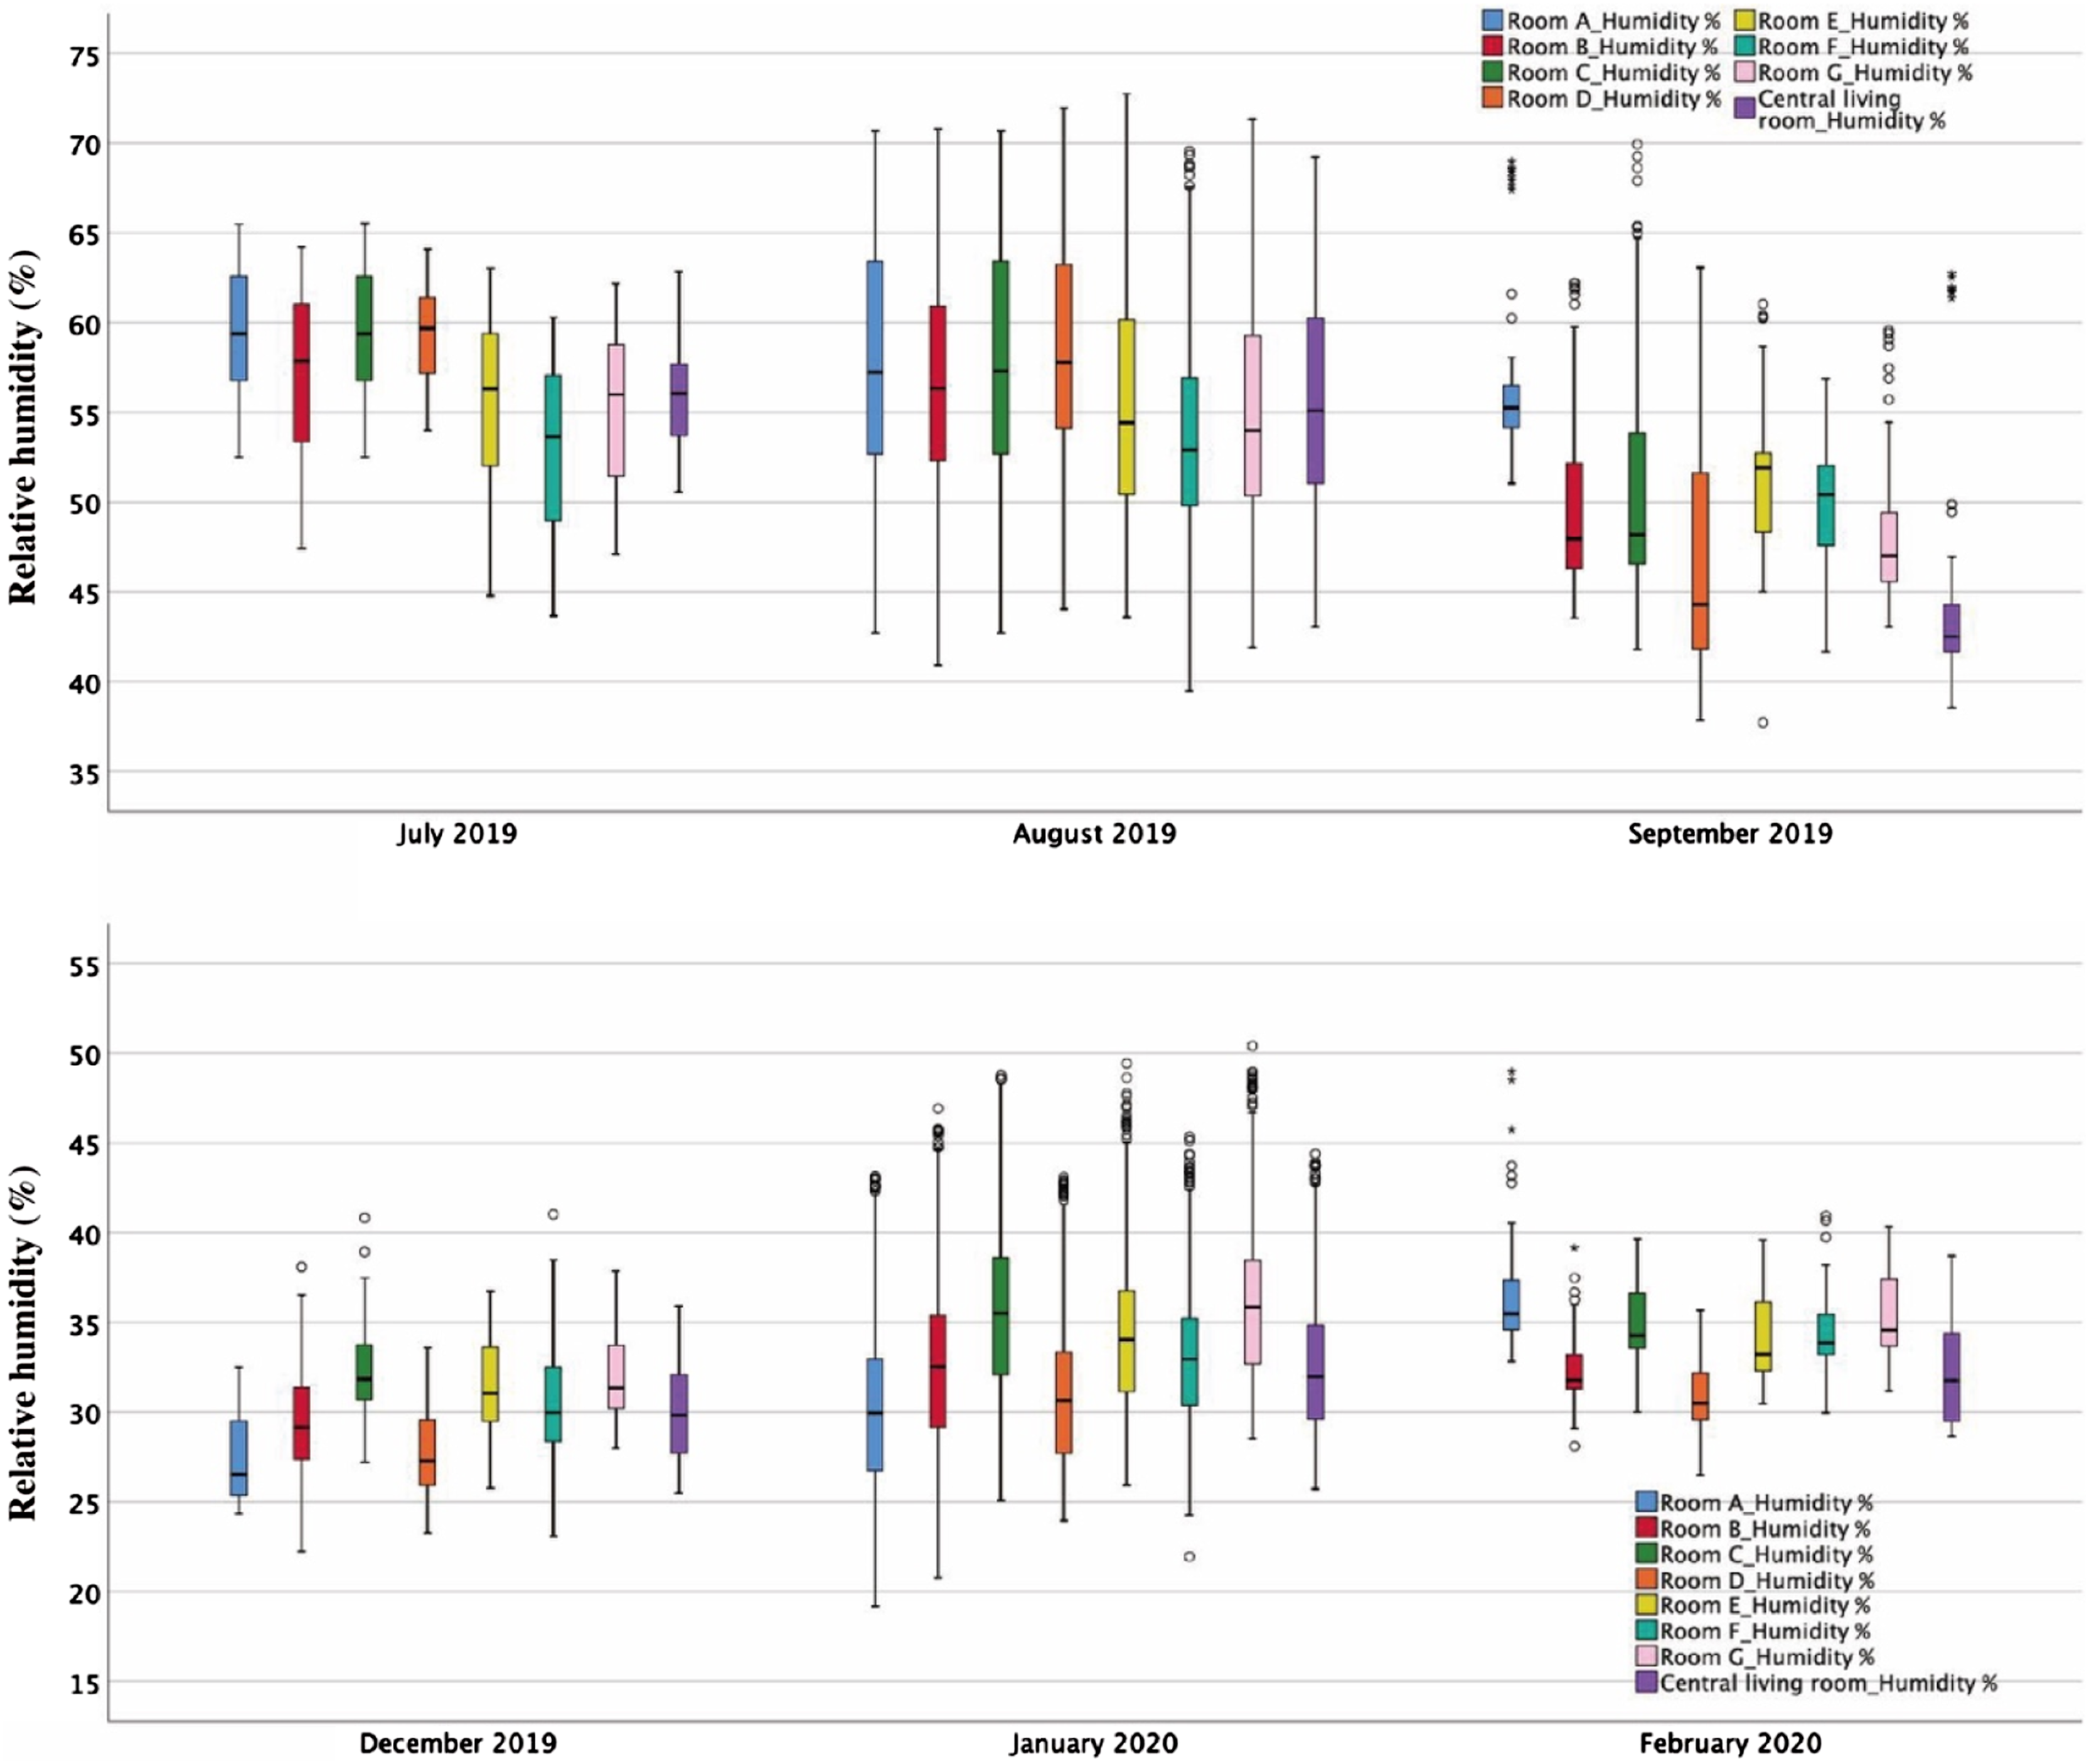
Figure 7 shows how the humidity and temperature changed at the beginning of the heating season. Indoor air temperature data was steady in all rooms between 21 and 26°C, but the relative humidity decreased significantly since 27th October. The outdoor temperature fell rapidly within one week from 16.4°C on 27th October to −0.7°C on 1st November. This was paired with increased usage of floor heating, which was seen with a sharp decline in indoor humidity, whilst the outdoor humidity levels remained above 80%. Based on the significant humidity difference between indoors and outdoors, humidity data fluctuations reveal the time and length of natural ventilation in bedrooms. Indoor relative humidity and air temperature variations between 21st October and 3rd November.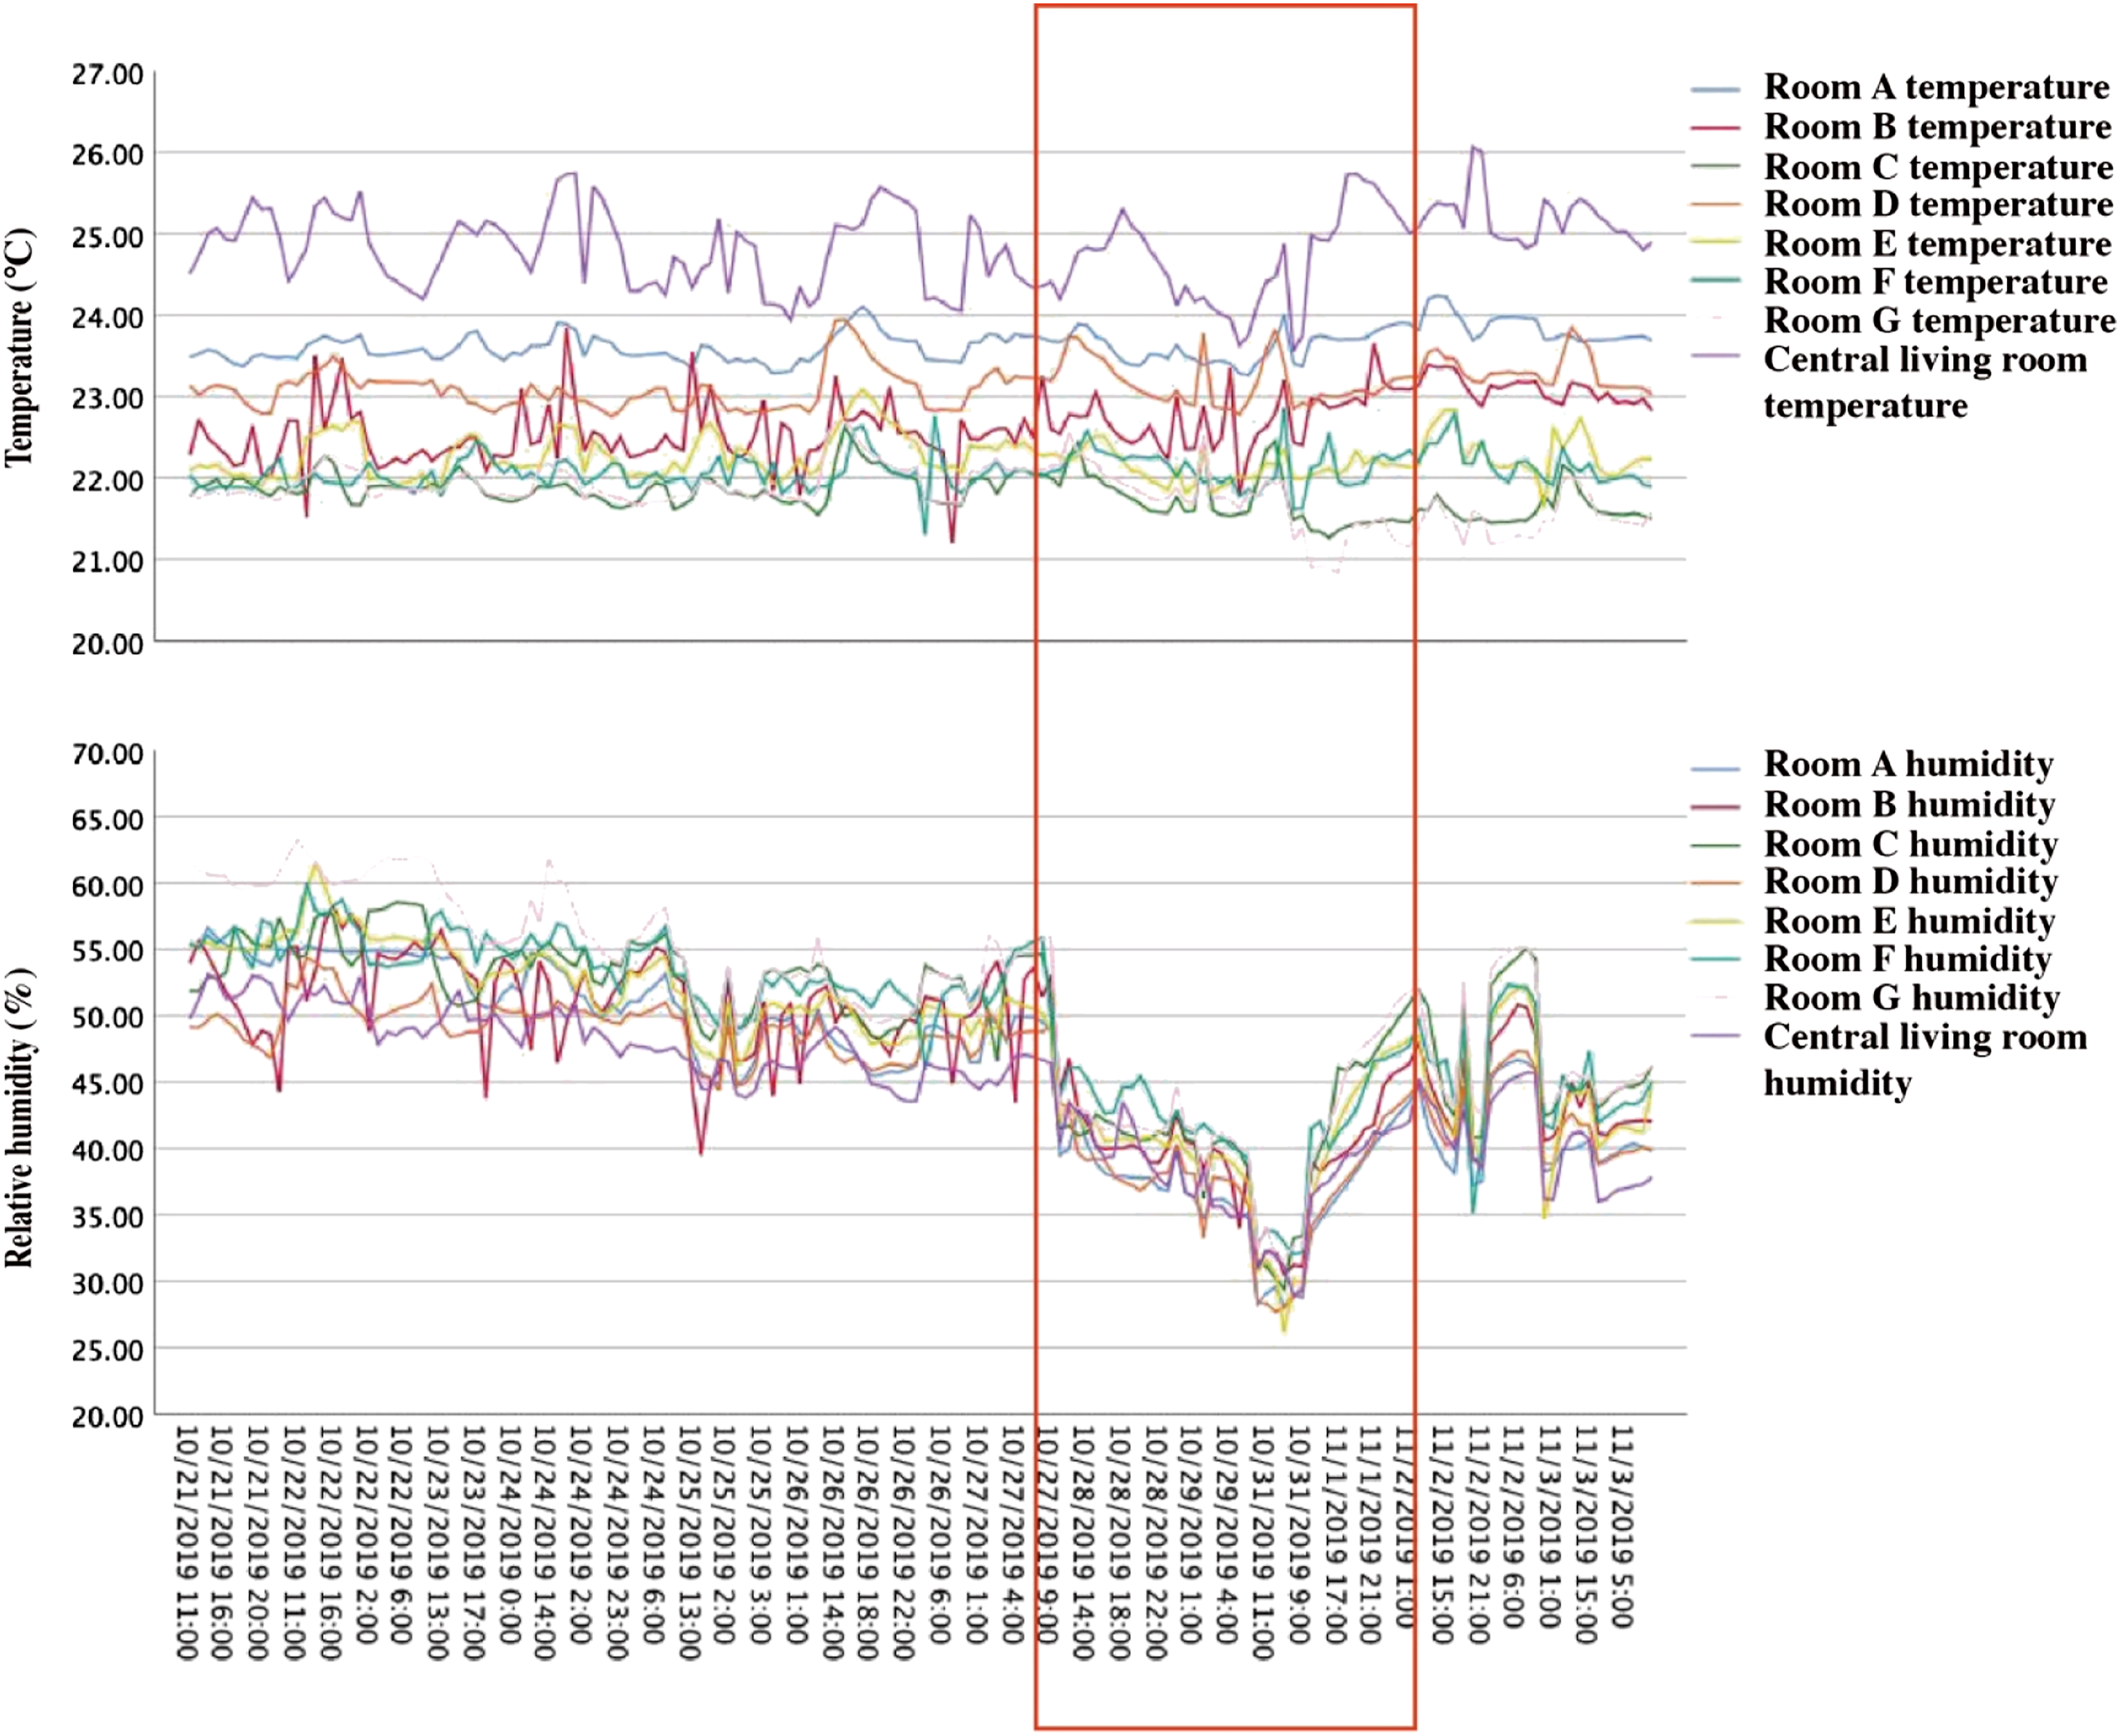
Questionnaire responses show relative humidity was the most problematic for residents and care professionals. More than half of the care professionals reported the indoor environment was slightly dry, dry or very dry (Figure 8). Nearly half of the guardians also reported that their family members felt the air was slightly dry in their bedrooms. Spring was the period with higher overall complaints and matched the sensor data. Care professionals also complained that indoor spaces on the upper floor were hotter and drier. People living and working in the nursing home had symptoms, such as being always thirsty, dizziness, headaches, dry eyes, sore throat and nasal pain, from February to April. Votes for indoor relative humidity.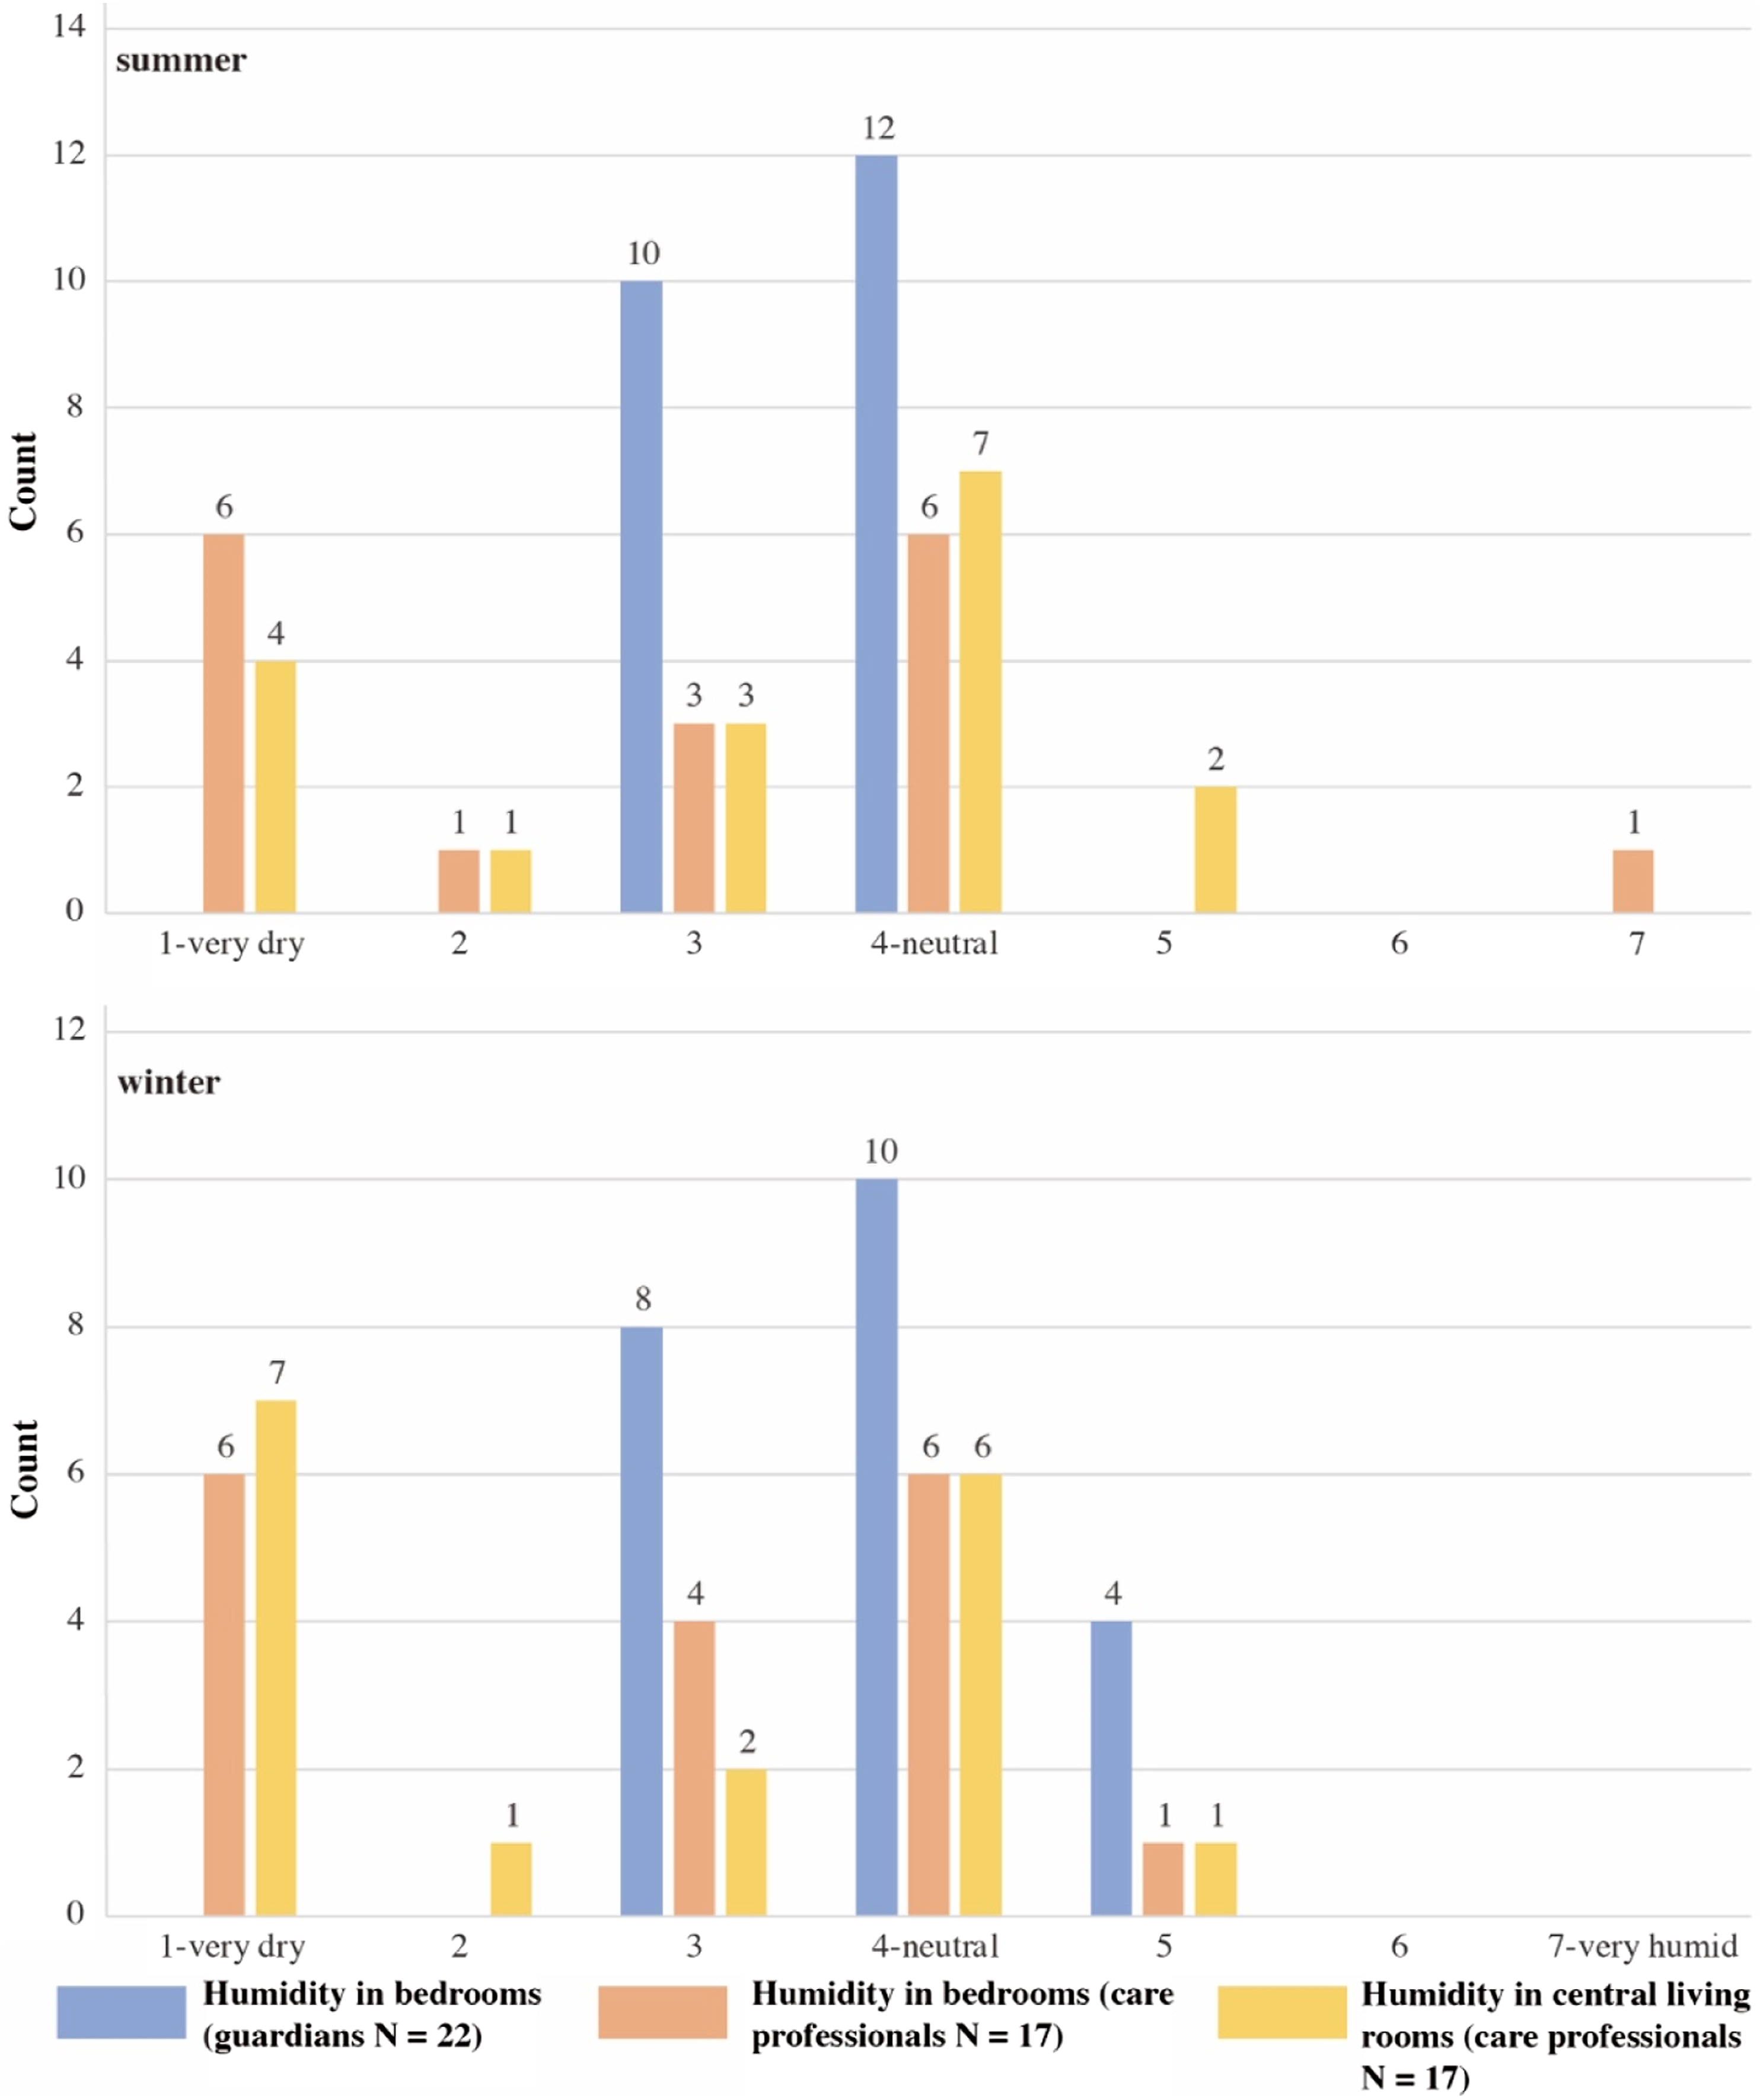
Air quality
The mean CO2 concentrations in monitored rooms were between 600 and 1000 ppm. However, the values varied significantly every day, which increased at night and decreased during the daytime. The peak values reached 2000 ppm a few hours at midnight. After the ward round the following day, the care professionals opened windows for natural ventilation, and CO2 concentrations in bedrooms were back to 400–600 ppm. The data deviations in monitored rooms were 200–400 ppm between rooms during the same season. TVOC value is a measurement for monitoring the overall amount of volatile organic compounds (VOCs) in a given space. TVOC concentrations in the nursing home were under 200 μg/m3 most of the year. The TVOC variation shows a similar trend as CO2, which decreased from the peaks at night to lower levels during the daytime. However, the peak values of TVOC concentration (100–200 μg/m3) were sometimes captured around noon.
Figure 9 presents the CO2 and TVOC concentration levels of the overall time percentage in the nursing home. The ventilation in the central living room was better than in the bedrooms. The CO2 concentrations in bedrooms nearly 60% of the time were lower than 800 ppm, 10% were between 800 and 1000 ppm and almost 30% were over 1000 ppm. This rate is similar in all bedrooms and shows the length of time residents maintain metabolism in a poorly ventilated space at night. TVOC concentrations in bedrooms were less than 10% of the time between 200 and 300 μg/m3 or above 300 μg/m3. However, Rooms B data reflects that the occupant’s activities and ventilation management still can significantly influence the air quality. CO2 and TVOC concentrations in 1 year.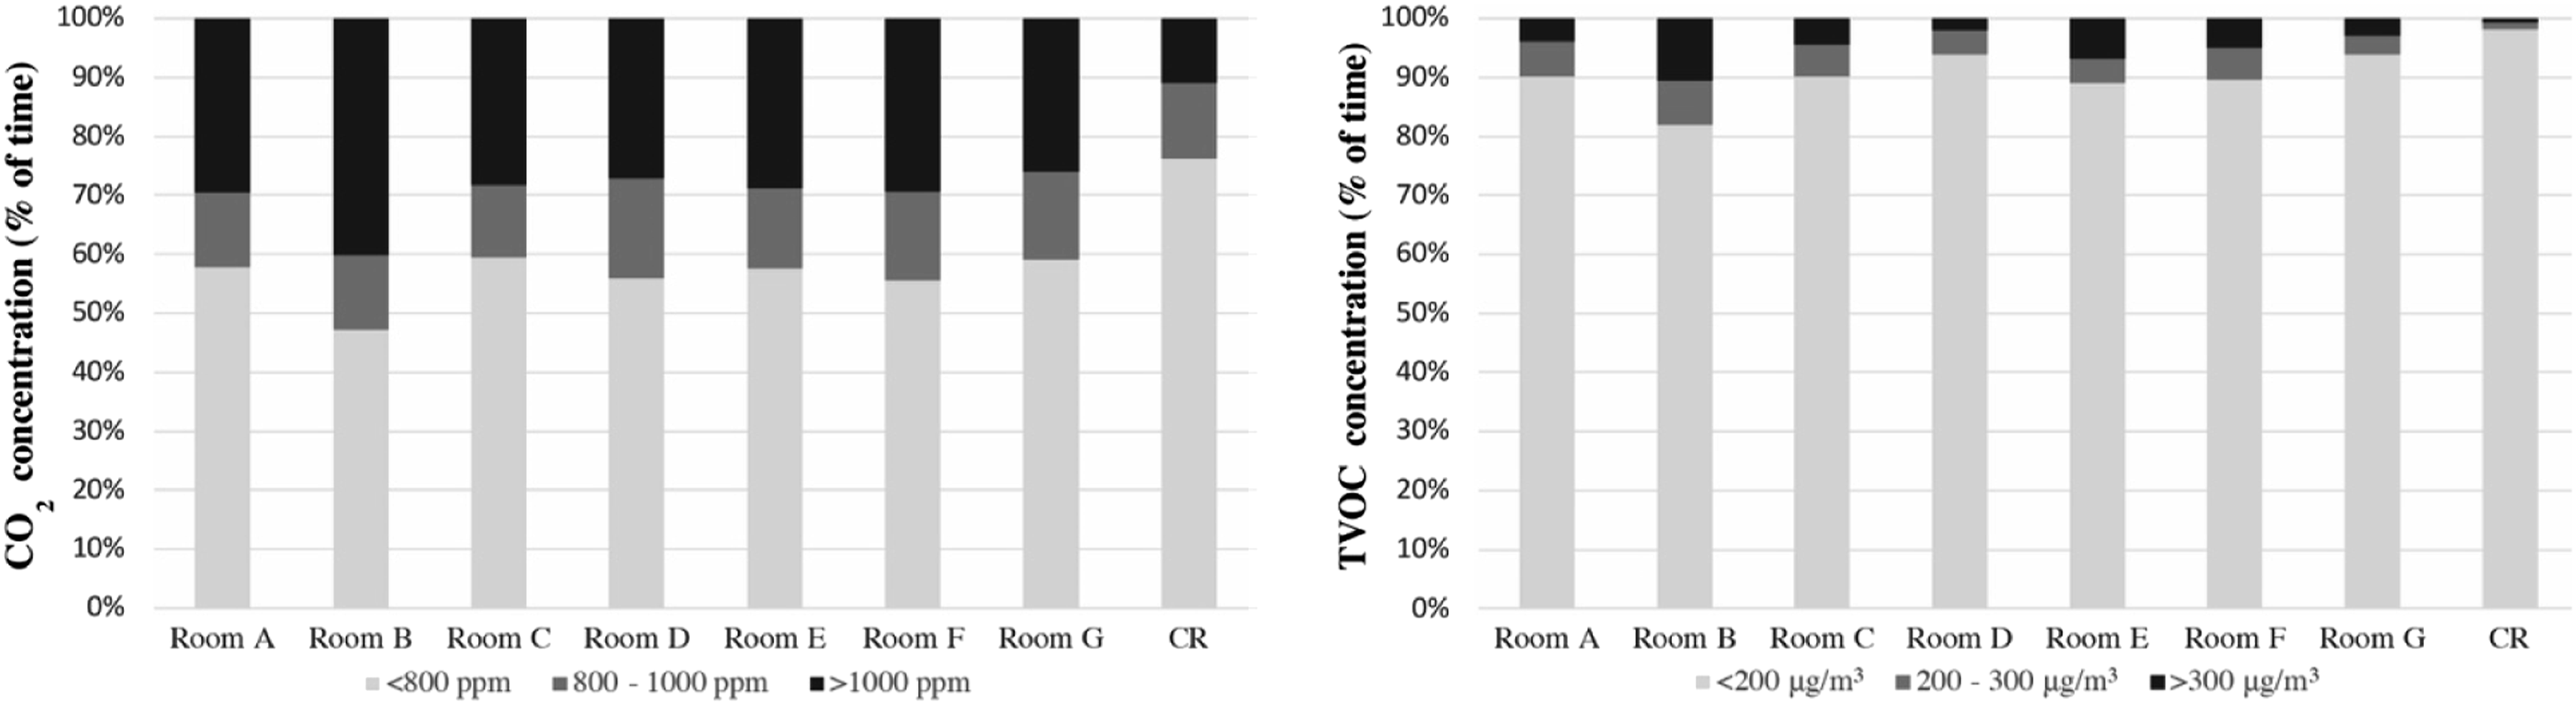
PM2.5 and PM10 concentrations were maintained within the suggested ranges according to World Health Organization (WHO) guidelines (mean value: bedrooms <10 μg/m³ and the central living room <15 μg/m³). 46 In contrast to CO2 and TVOC data, particulate matter values were higher in the central living room than in the bedrooms. The peak values were usually captured around dinner time, which could be 20 times higher than the data monitored in the bedrooms. Cooking was the main reason PM2.5 and PM10 increased over 100 μg/m³ a few hours surrounding the stove and oven.
Participants reported they could smell cooking oil fumes from the central living room. They had similar views on indoor air quality that usually felt stale in the building (Figure 10). Nearly a third of guardians thought that their family members were not satisfied with bedroom air quality, and the dissatisfaction rate amongst care professionals was over 50%. The vote for the favourite place was the courtyard, where residents have access to fresh air and more sunlight. They usually stay in the courtyard or terraces for 1–2 hours if the physical condition and weather allow. Votes for indoor air quality.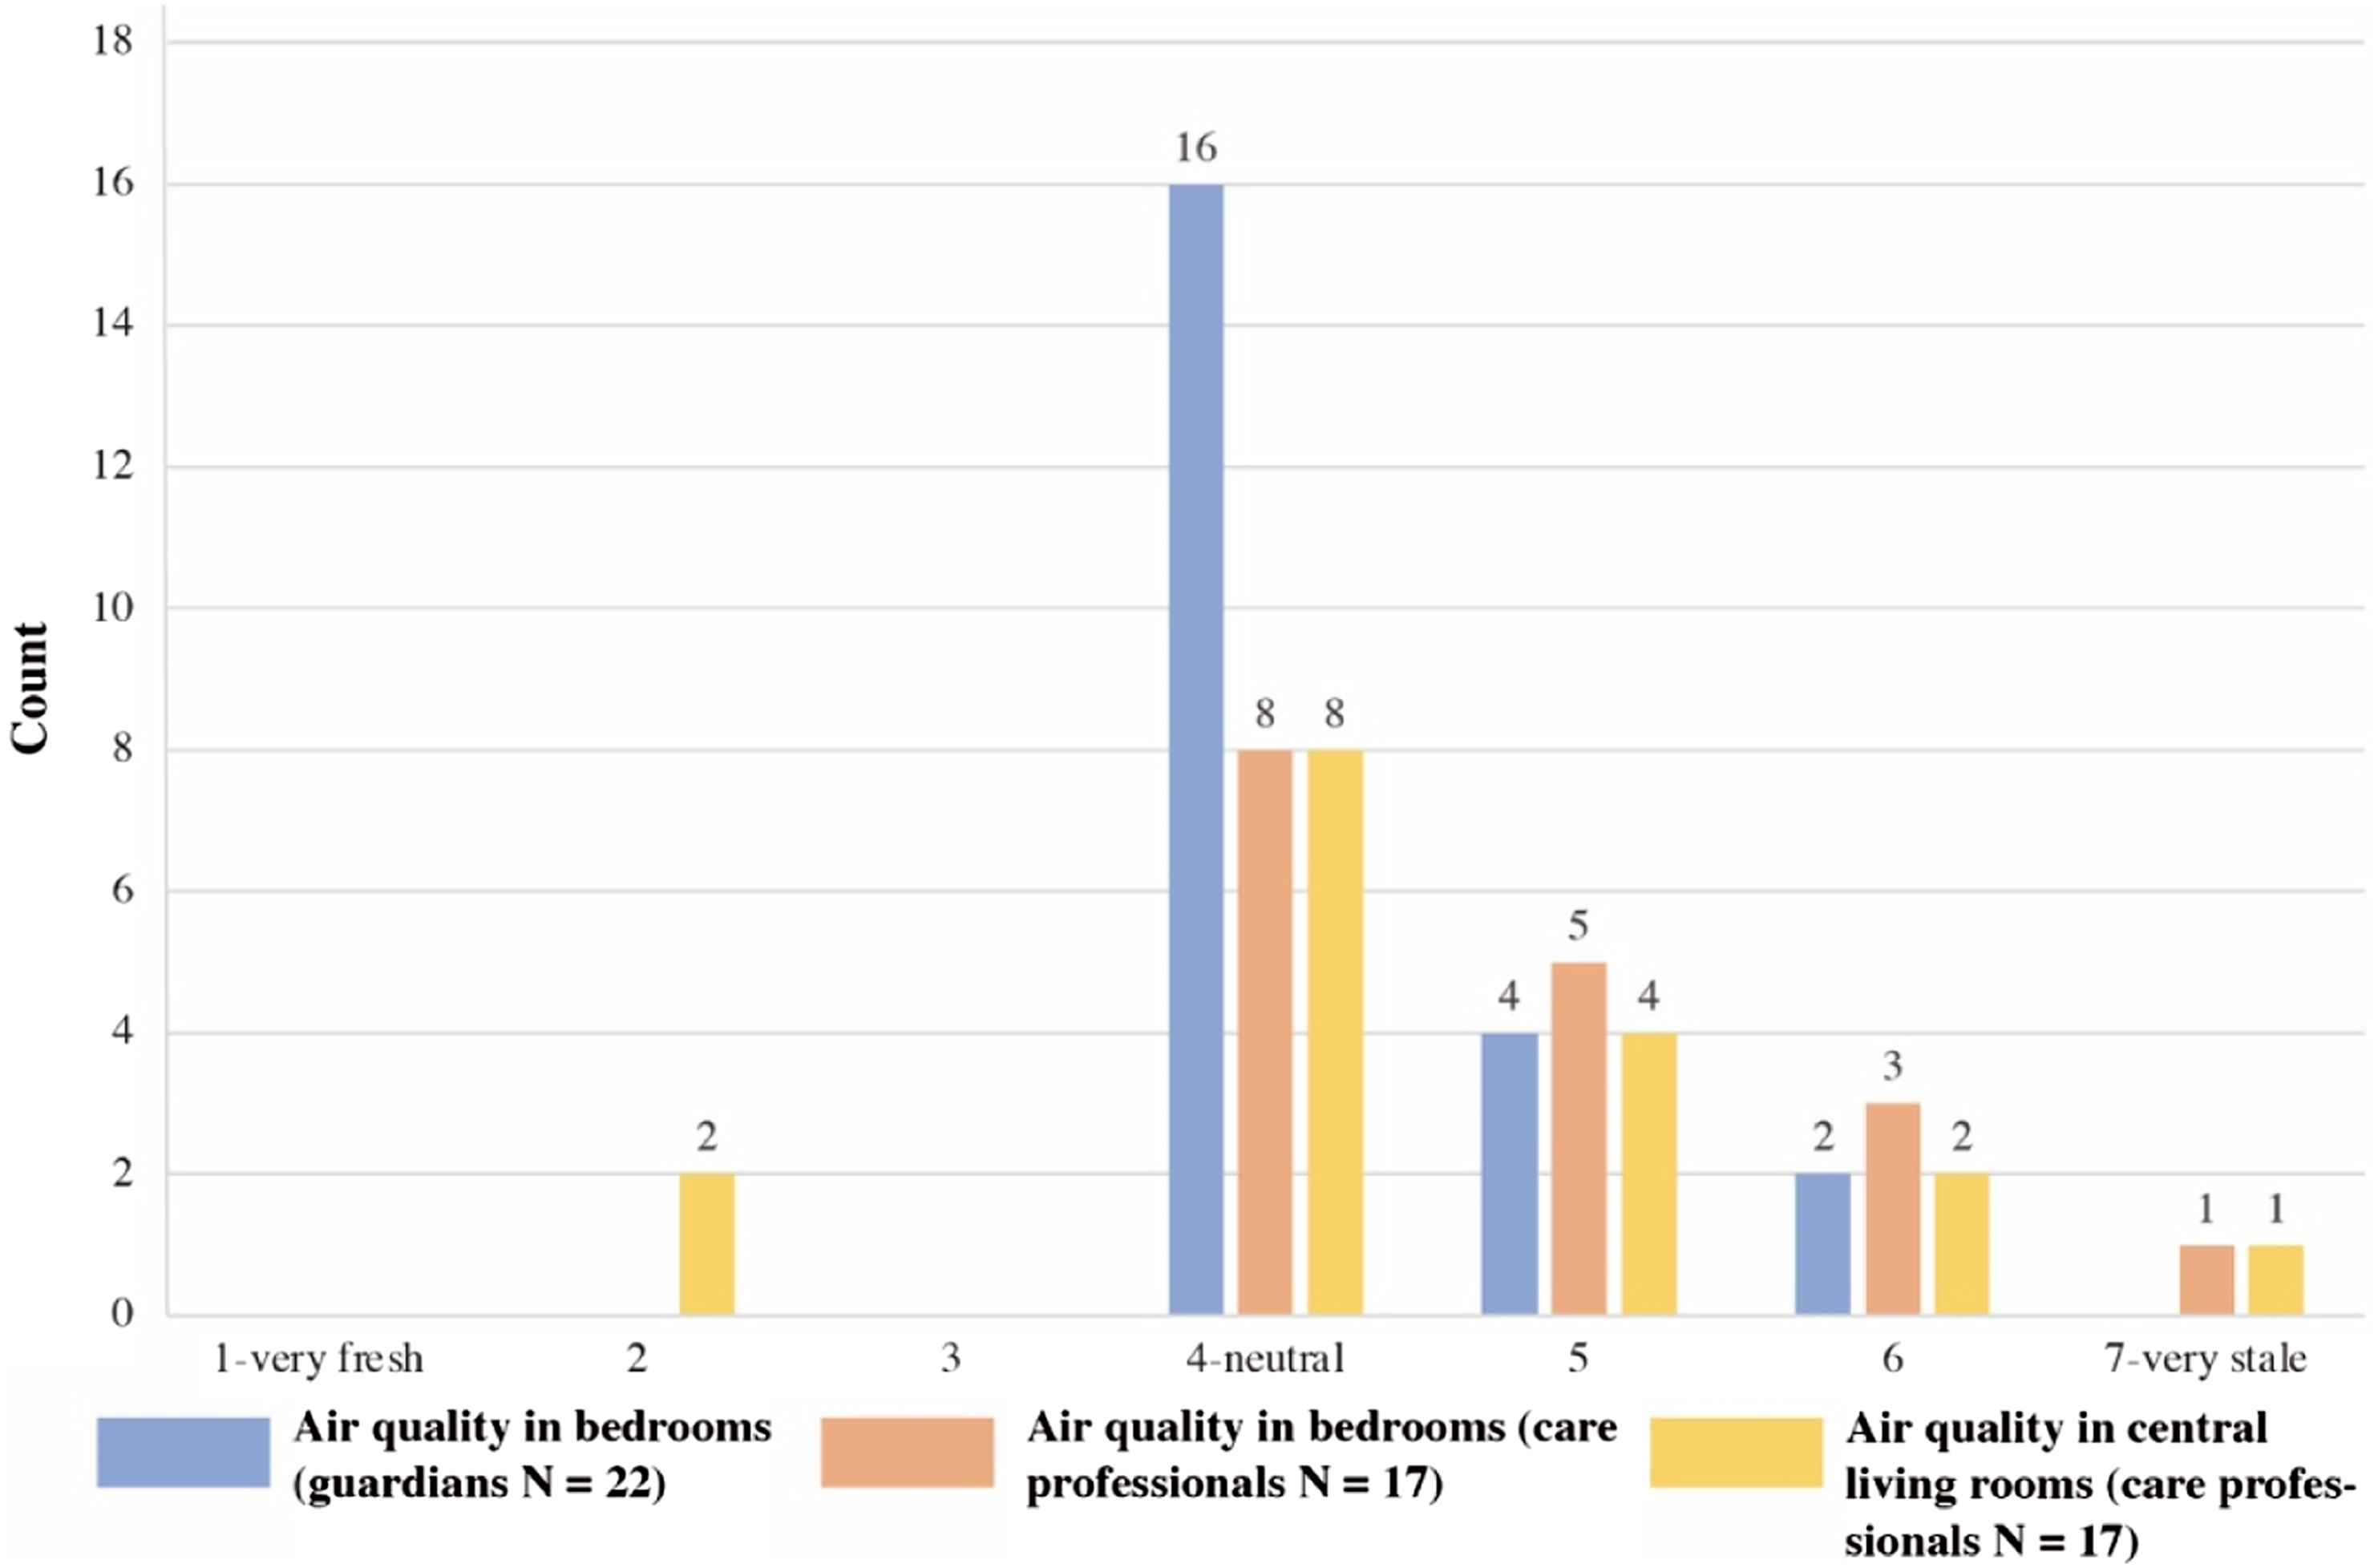
Light environment
Indoor illuminance is influenced by weather and human factors, and the data varied significantly between rooms. Figure 11 is a sample that selected a sunny day in the summer and a rainy day in winter to show indoor light environments under different conditions. In this heatmap chart, the red areas present the higher values detected on selected days. The illuminance data after sunset (summer 9 p.m., winter 5 p.m.) indicates the activities of residents (e.g. using the bathroom or watching TV). In the daytime, bedrooms were in a range of tens to hundreds of lux. On sunny days, the sunlight could be sufficient for residents’ daily activities or even need sun shading. However, on (winter) rainy days, the sunlight usually is insufficient. Rooms C, D and E data show the active time of residents or caregivers using artificial light. The heatmap chart of indoor illuminance (lux) on a summer day (left) and a winter day (right).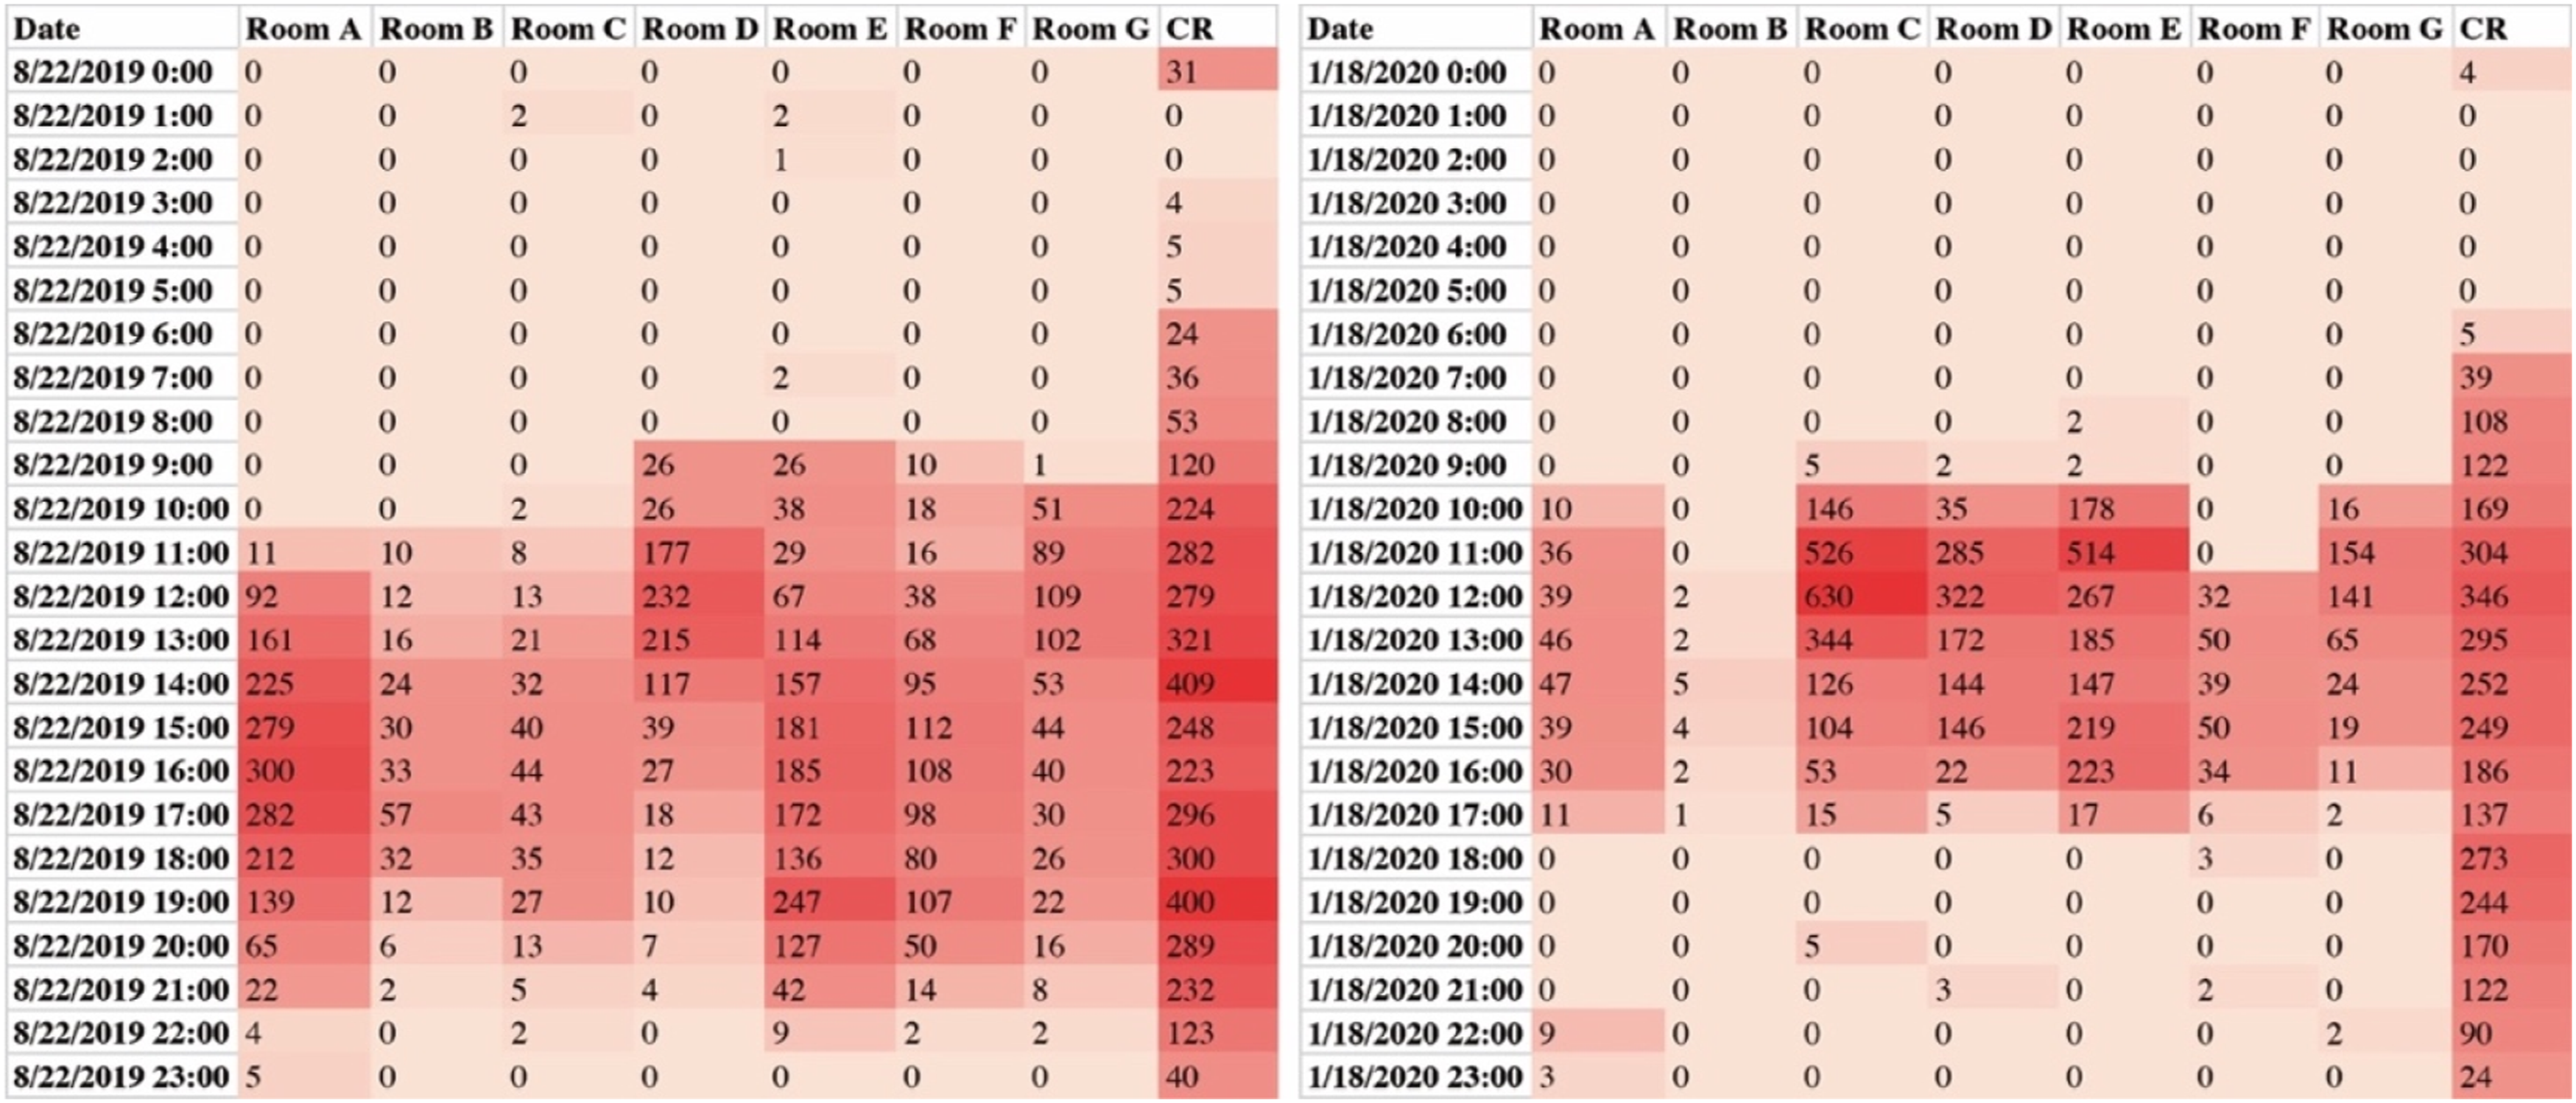
Whether in summer or winter, the central living room was the brightest place in the nursing home, where staff worked earlier in the morning and left later at night. Artificial light maintained the average illuminance of activity time in the central living room at around 300 lux. However, the illuminance data varied significantly in bedrooms due to transient weather changes or variable control of artificial lighting and shading elements. Although 53% of care professionals and 73% of guardians thought that light intensities in bedrooms were neutral for residents (Figure 12), they always adjusted windows and curtains when they walked into the bedrooms. Room B was at a very low light intensity level all the year, and the maximum value was below 100 lux. Votes for indoor light environment.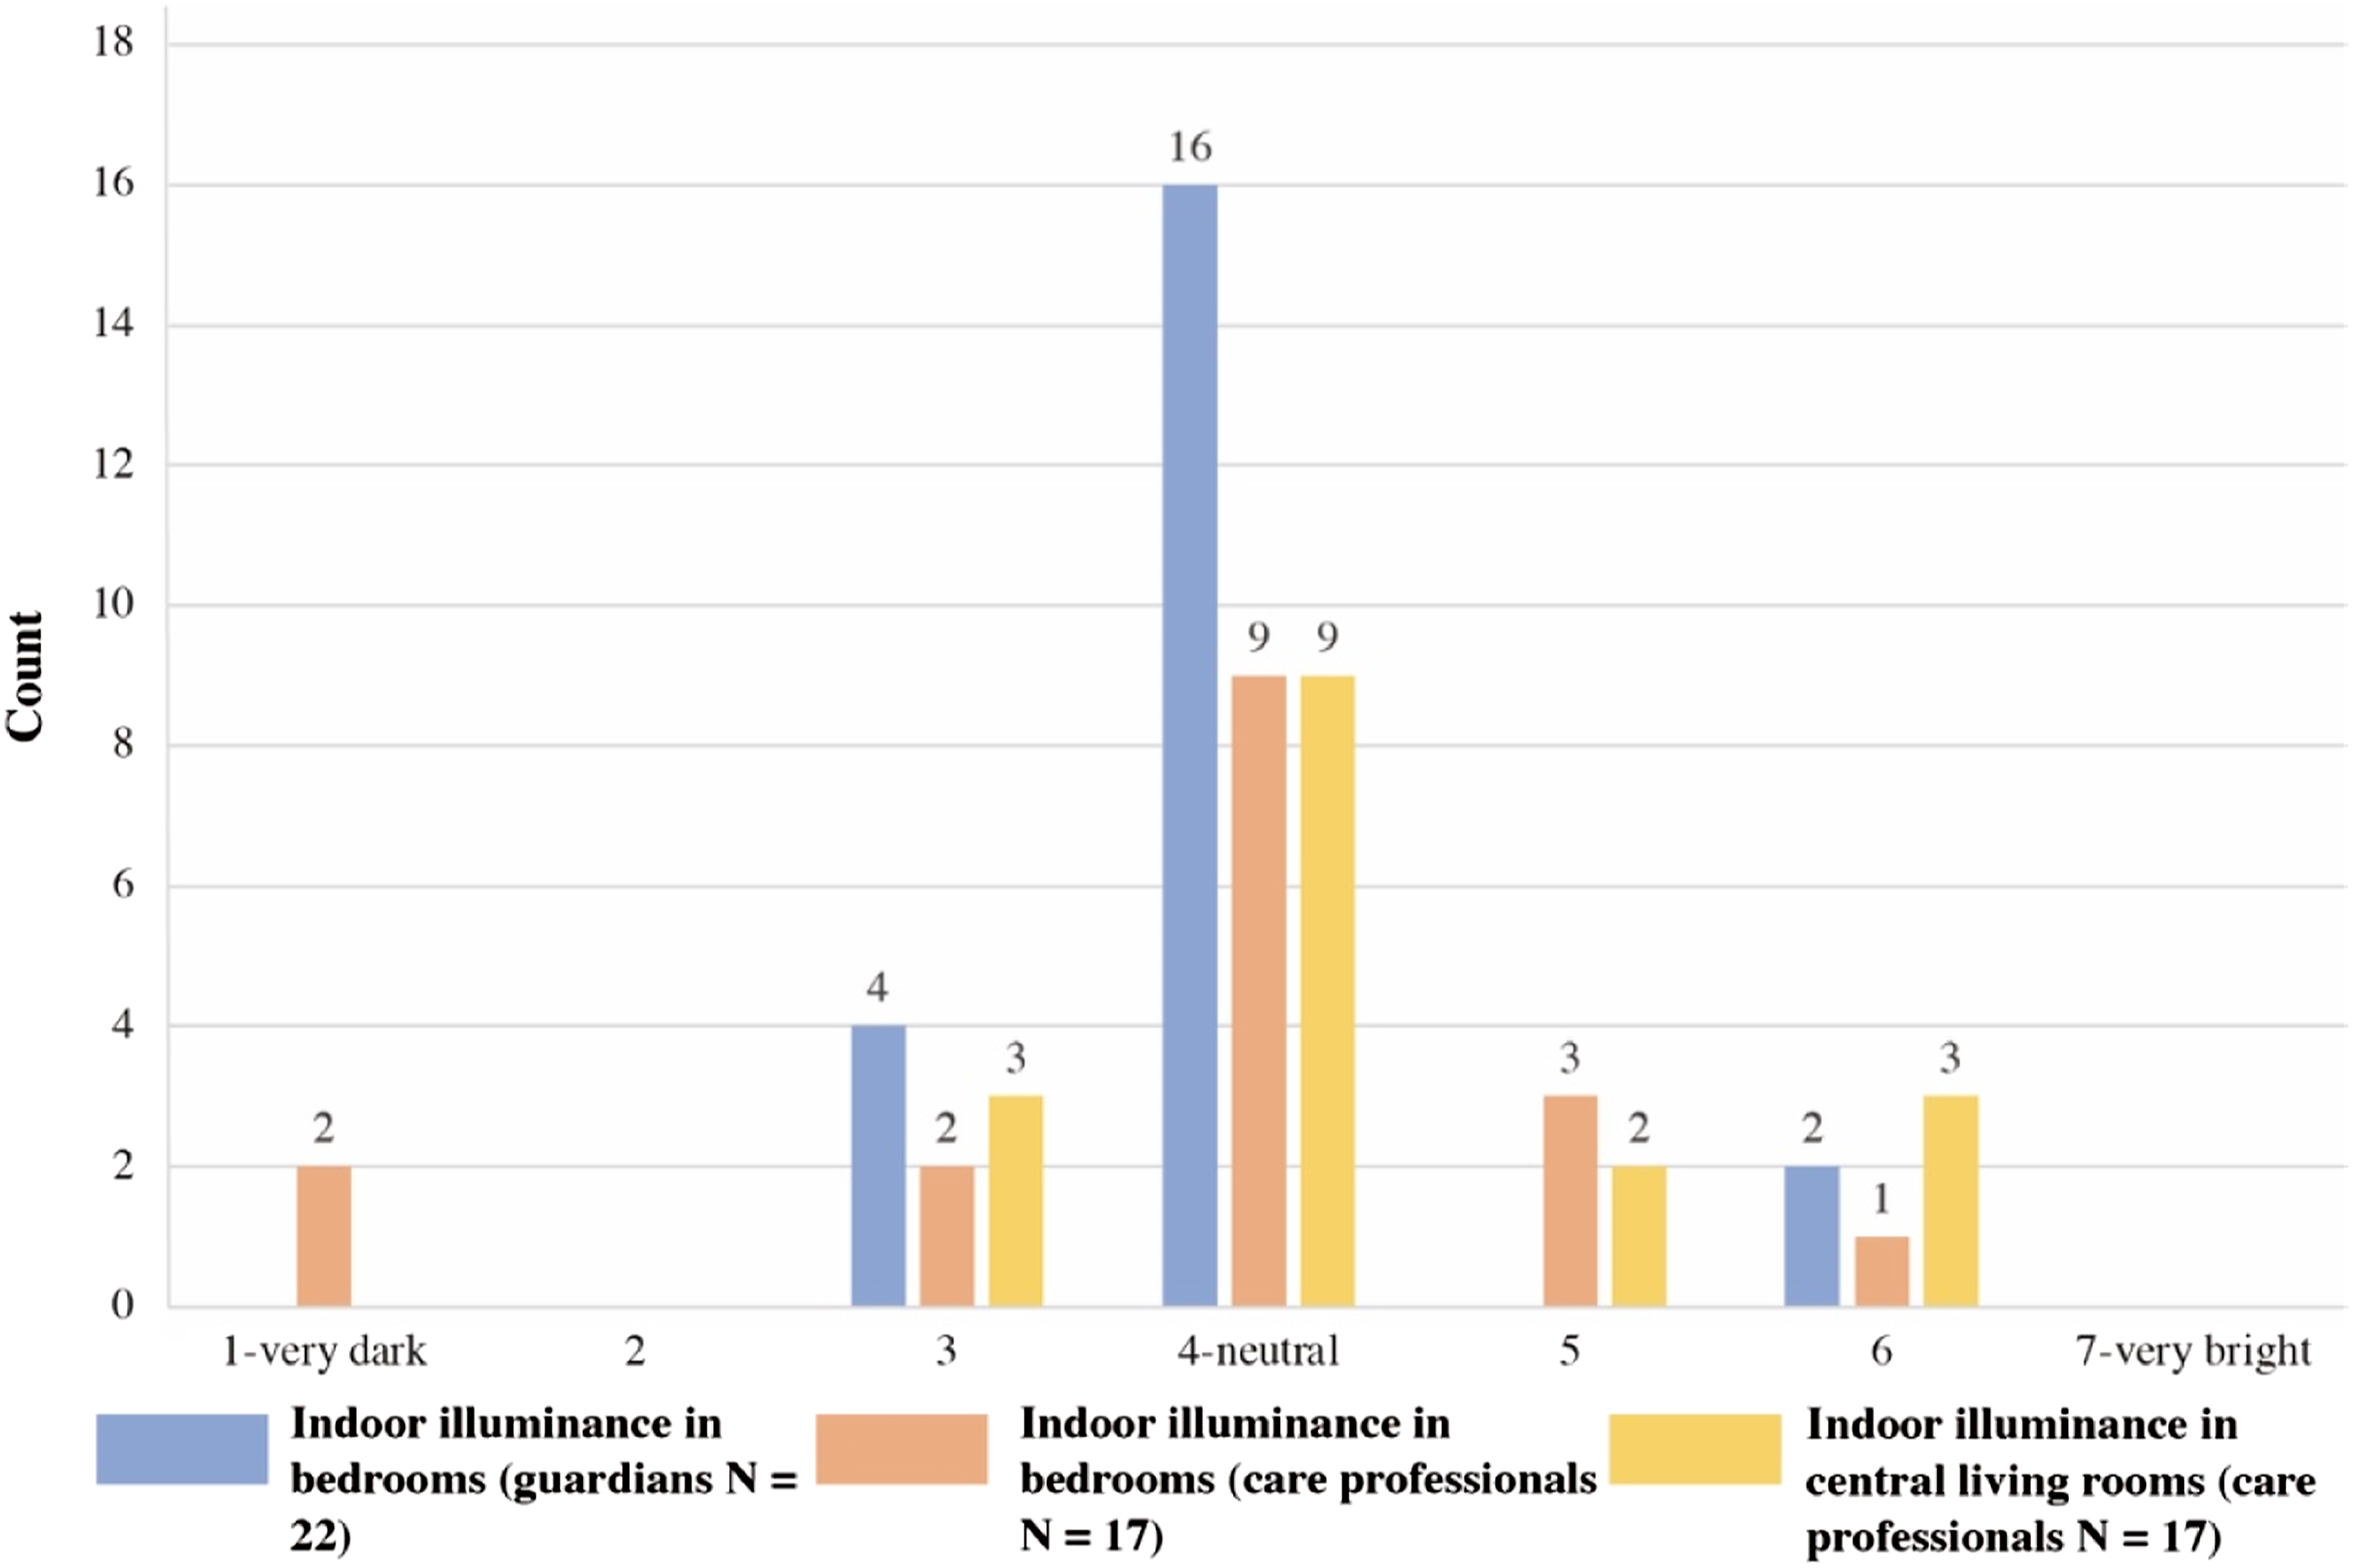
Discussion
Dementia is a progressive syndrome that changes cognitive, behavioural and psychological functions. 47 People with dementia may have difficulty expressing discomfort and asking for help. Monitoring technologies can be a potential solution to assist dementia care through environmental data. This study investigated the IEQ in a nursing home, proxies’ responses to residents’ comfort and the reasons for outliers and deviations in the data. To do this, we integrated sensor data analysis with caregivers’ opinions to determine the comfort level of people with dementia.
This study highlighted the potential use of sensor devices and data to support the care of people with dementia. For example, Resident B was in the moderately severe dementia stage and had heart failure, stayed in bed most of the day and relied on caregivers to control the indoor environment. Even though this resident did not report dissatisfaction with the indoor environment in her room, the data showed large differences between Room B and the other bedrooms occupied by residents with higher independence. The environmental data does not directly equal indoor comfort, but it could be a reference for caregivers providing care and interventions.
Building and care-related factors, such as insulation, ventilation, heating and ward round schedule, were consistent for all rooms and participants (residents and their caregivers) in this study. The building quality was high, and the facilities were new and operating well. All bedrooms were similar in layout and orientation. Thus, data differences were mainly associated with room occupancy, residents’ daily activities and room facility control. The mechanical ventilation was set lower at night for noise reduction, but it led to CO2 concentrations above 2000 ppm and TVOC above 300 μg/m3 in bedrooms, which were higher than the harmless limits. Many studies have shown a strong correlation between air pollutants and levels of indoor air quality. CO2, TVOC and particle matter concentrations are key indicators for measuring indoor air quality.31,34,48 These air pollutants in care facilities usually are higher than outdoors. Reasons include indoor emission sources (e.g. furnishing), activities (e.g. cooking), low ventilation and seasonal variations in temperature and humidity. 48 The average outdoor CO2 concentration level varies from 350 to 575 ppm. 49 Based on existing research, the healthy threshold of CO2 concentration has been set at 800 ppm, and the harmless limit is 1000 ppm. 50 A high CO2 concentration could increase Sick Building Syndrome (SBS) symptoms, including eye irritation and upper tract respiratory symptoms, which were reported by care professionals from the studied nursing home. 51 The same symptoms may also be caused by TVOC exposure, 52 and its guideline value proposed by the European Commission is 300 μg/m3, and the comfort range is under 200 μg/m3. 53 Low TVOC values were maintained in the nursing home (Figure 9) and thus not the main factor influencing residents’ health. However, the TVOC value could sharply increase around noon, related to residents’ specific activities or nursing services. Airborne particles, another significant air pollutant, primarily affect the human respiratory and cardiovascular systems. According to the WHO guidelines, the 24-hour means of PM2.5 and PM10 are 25 μg/m3 and 50 μg/m3, whilst the annual means set for PM2.5 and PM10 are 10 μg/m3 and 20 μg/m3. 46 Although peak PM2.5 values in the central living room were between 150 and 200 μg/m3 around cooking time, its 24-hour mean value was still below 25 μg/m3.
The indoor relative humidity during the heating season was another problem in the nursing home. Good building insulation, the use of the heating system and lack of humidifying devices were the reasons indoor relative humidity gradually decreased below 40%. Relative humidity is an indicator related to both thermal comfort and air quality. Maintaining the humidity level in a suitable range is essential for IEQ. Airborne fungi and house dust mites often happen in rooms with prolonged high humidity (>70%), but lower than 40% can cause the symptoms of dryness and irritation of the mucosa, 54 which care professionals and residents also complained about similar symptoms. High room humidity with poor ventilation could increase VOCs emissions and reduce indoor air quality. 55 Maintaining relative humidity over 40% could significantly reduce the infectivity of aerosolised viruses. 56 In care facilities, indoor environments are likely too dry in winter due to heating systems. 57 However, in the studied nursing home, the dry environment (<40%) lasted 6 months.
Existing studies have pointed out the overheating risk in care facilities during summertime, 58 which also remains in the wintertime. Six factors could influence thermal comfort in a particular scenario: metabolic rate, clothing insulation, air temperature, radiant temperature, airspeed and humidity. 37 Due to the COVID-19 restriction, this study only collected indoor air temperature and relative humidity data. The Dutch design guideline suggests that the maximum indoor air temperature in the general area of nursing homes should be 25.5°C in summer, and the minimum should be 22°C in winter. 59 According to a WHO report, an indoor environment between 18 and 24°C is the most healthy range for sedentary people. 60 The setting temperature of the nursing home was 23°C during the daytime and 22°C during the night, whilst the medians of temperature data were between this range. However, questionnaire responses show that the thermal comfort of older people with dementia was different between individuals and associated with seasons. Older people care more about warmer conditions in winter than cooler conditions in summer. 61 Occupation of an overheated room could trigger problems such as agitation and restlessness. Some residents and care professionals felt overheated in winter. For instance, Resident A used an electric radiator in her room during the winter, which caused the indoor temperature to be warmer than 25°C in some periods. In this case, Resident A would need more attention and adaptive actions from caregivers to adjust their thermal comforts (changing clothes, regulating metabolism or operating thermostats). 62
The impact of the lighting on care home residents’ living conditions is significant. 63 Older people with dementia staying in low illuminance environments could show more signs of a negative mood, thus impacting their well-being. 64 A comfortable indoor light environment compensates for the deteriorating eyesight of older people and benefits the quality of life, such as regulating circadian rhythm and decreasing depression. The suggested ambient light environment of care facilities is 500 lux and can be subdivided according to specific spaces. For general lighting in common spaces, including the entrance hall, corridor and bathroom, the lighting requirement is 300 lux. Lighting for bedrooms is 150 lux, and working and reading places are 750 lux. 65 A minimum illuminance of 1000–2500 lux could positively affect biological rhythms. 66 Older people with eye diseases need a higher quality of illumination (1500–4000 lux) to compensate for their visual impairments when reading. 67 Unfortunately, the residents’ exposure to light in care facilities is often reduced, and the actual light intensity is lower than the standards.22,68 We found some bedrooms on the ground floor did not have sufficient light during the daytime. These bedrooms were along the street, and thus, the constant passing of pedestrians and vehicles caused residents to close the curtains to protect their privacy. Protecting occupants’ privacy whilst maintaining natural ventilation and light should be important considerations during the design stage.
The major limitations of this study were the scale of participants, no direct feedback from people with dementia, and that the data collection was not conducted simultaneously. Thus, we designed questionnaires for care professionals and residents’ guardians to investigate their overall evaluation of the nursing home indoor environment for the monitored year. Some responses from different groups were contradictory. For instance, over half of guardians reported their family members were satisfied with the nursing home environment, and no one voted for unsatisfaction, but over 70% of care professionals were unsatisfied. Care professionals felt the common spaces, such as corridors between 21 and 24°C, were hot in winter, whilst 40% of guardians thought the family members felt slightly cold. Although the questionnaire for guardians required them to ask their family members, its accuracy cannot be completely guaranteed. The communication and verbal skills of people with dementia could be affected, 69 and acquiring accurate feedback requires more scientific approaches to obtain the information objectively. Also, the limited sample size of residents meant that the relationships between IEQ and comfort could only be assessed qualitatively and not with significance tests.
Sensor placement has influences on the data collection. In the monitoring campaign, sensors were deployed on top of wardrobes in ventilated zones and far from heat sources. However, the measurement requirements are different according to specific indoor environmental indicators. As ASHRAE 55 suggested, measuring the average value of air temperature concerns location and time: the height of the ankle level, the waist level and the head level in periods between 3 and 15 minutes. 37 Air quality sensors should be positioned at the breathing zone height or on the ceiling in the middle of the room, and the optimal position needs to take into account the room layout. 70 Thus, finding an appropriate position for a multi-functional sensor is difficult. Existing knowledge of sensor placement focuses on standing or seated participants. It has hardly been applied to the characteristics of people with severe dementia who are on extended bed rest. Sensor maintenance is also an important factor. Residents could pull out the plugs of sensors for using other electronic devices and then forget to plug them back in, which leads to sensors intermittently being offline and data loss. Low power consumption and battery-based sensors could be more suitable for long-term monitoring. Care professionals noticed that even the faint light and noise generated by sensors could reduce the acceptance of using these devices in private spaces. These interferences could increase the risks of people with dementia’s problem behaviours (e.g. agitation). Monitoring technologies used for care facilities need to become completely non-intrusive. Future research is suggested to verify the effectiveness of using these technologies in dementia care from the user’s perspective.
Conclusion
This study was conducted in a small-scaled nursing home in the Netherlands for one year to collect indoor environmental data in selected rooms. Its objective was to find the connections between indoor environmental parameters and residents’ comfort. Due to the uncertainties of people with dementia answering questionnaires and COVID-19 pandemic restrictions to carry out observations, the online questionnaires were answered by care professionals and residents’ guardians. The responses validated the connections of indoor comfort with indoor air temperature, air quality, relative humidity and illuminance variations to some extent. The relative humidity is the most problematic indicator in the nursing home during the heating season, which could be even drier in spring than in winter in the absence of humidification measures. The stages of dementia affect the independence and behaviour of older people, which can be revealed by indoor environment data. In this study, stable air temperature but poor air quality and illuminance were seen in the room of the resident with severe dementia than in rooms of other residents at mild and moderate dementia stages. The living environments of people with severe dementia who have less independence require more attention and timely adjustment from caregivers. Short-term data fluctuations and long-term trends could assist caregivers in obtaining objective information and assessing the IEQ of people with dementia’s living environment. Furthermore, the monitoring technology application in care facilities needs to be non-intrusive to reduce interference with residents’ daily lives.
Footnotes
Acknowledgements
We thank all care professionals, technicians and the manager in the studied nursing home affiliated with Santé Partners. We also appreciate the support of nursing home residents and their family members for participating in the data collection.
Author contributions
All authors contributed equally in the preparation of this manuscript.
Declaration of conflicting interests
The author(s) declared no potential conflicts of interest with respect to the research, authorship, and/or publication of this article.
Funding
The author(s) disclosed receipt of the following financial support for the research, authorship, and/or publication of this article: This research project has been carried out as a part of an ongoing collaboration within DEEL Academy, which is a national joint venture between several universities, citizens’ initiatives, housing associations and care organisations in the Netherlands. This innovation and co-creation platform aims to solve the housing challenge for older adults by developing empathic homes and caring communities that promote health and neighbourliness.