
Abstract
Passive houses, called nearly zero energy buildings in China, are developing rapidly. These constructions in China are mainly located in cold climate zones. Due to highly efficient energy-saving technology, Passive houses can decrease space heating demand (SHD) by 70%–90% compared to local conventional buildings. However, this energy-saving rate is still a theoretical result and needs to be verified by real data. There is a lack of studies evaluating the performance of residential Passive houses through monitored data in China. This article selects a newly built multi-storey residential Passive house building in Qingdao to accurately quantify its energy performance. Through energy consumption monitoring throughout winter, the average SHD of this building at an occupancy rate of 47% was found to be 28 kWh/(m2·a) and the primary energy consumption was 96.7 kWh/(m2·a), while maintaining a high level of indoor comfort. Compared with local conventional Green Buildings, the SHD of the case building was reduced by 86.3% and the total energy consumption was reduced by 69.2%. The results demonstrate that Passive houses have a great energy-saving potential and provide evidence supporting the use of Passive houses as an option for sustainable building in northern China.
Introduction
The 2021 global status report for buildings and construction pointed out that the construction industry accounted for 36% of global end-use energy consumption and 37% of energy-related CO2 emissions in 2020. 1 A report by the Ministry of Housing and Urban-Rural Development of China (MoHURD) 2 revealed that the direct and indirect carbon emissions of China’s construction sector account for about 40% of total societal carbon emissions. To achieve the ‘Carbon emissions peak before 2030 and carbon neutrality before 2060’ targets, 3 the General Office of the Central Committee of the Communist Party of China and the General Office of the State Council 4 have called for the promotion of passive ultra-low-energy buildings (PUEBs) and nearly zero energy buildings (nZEBs),5,6 and a focus on building operation energy efficiency. PUEBs are the primary form of nZEBs. Both have the same indoor environmental parameters; however, the energy efficiency of PUEBs is slightly lower than that of nZEBs. It is foreseeable that there will be huge developments in Passive houses (PHs) or nZEBs during the following five-year (14th Five-Year Plan) period in China.
Throughout the 13th Five-Year Plan period, China built more than 10 million m2 of PUEBs, mostly located in cold climate zones. 7 Based on these projects, a batch of energy-saving design and evaluation standards of PUEBs have been issued one after another.8,9 The energy performance of some public PH projects has been monitored and evaluated, such as the PHTEC in Qingdao10,11 and an office building in Zhuozhou, Hebei. 12 There are also other monitored public nZEB projects in severely cold zones 13 and in hot summer and warm winter climate regions 14 in China. However, the operating energy performance of residential PH buildings has not been evaluated or published. There are currently no case studies or literature on the monitoring of residential PH buildings in China. 15
Summary of relevant research from monitored buildings.
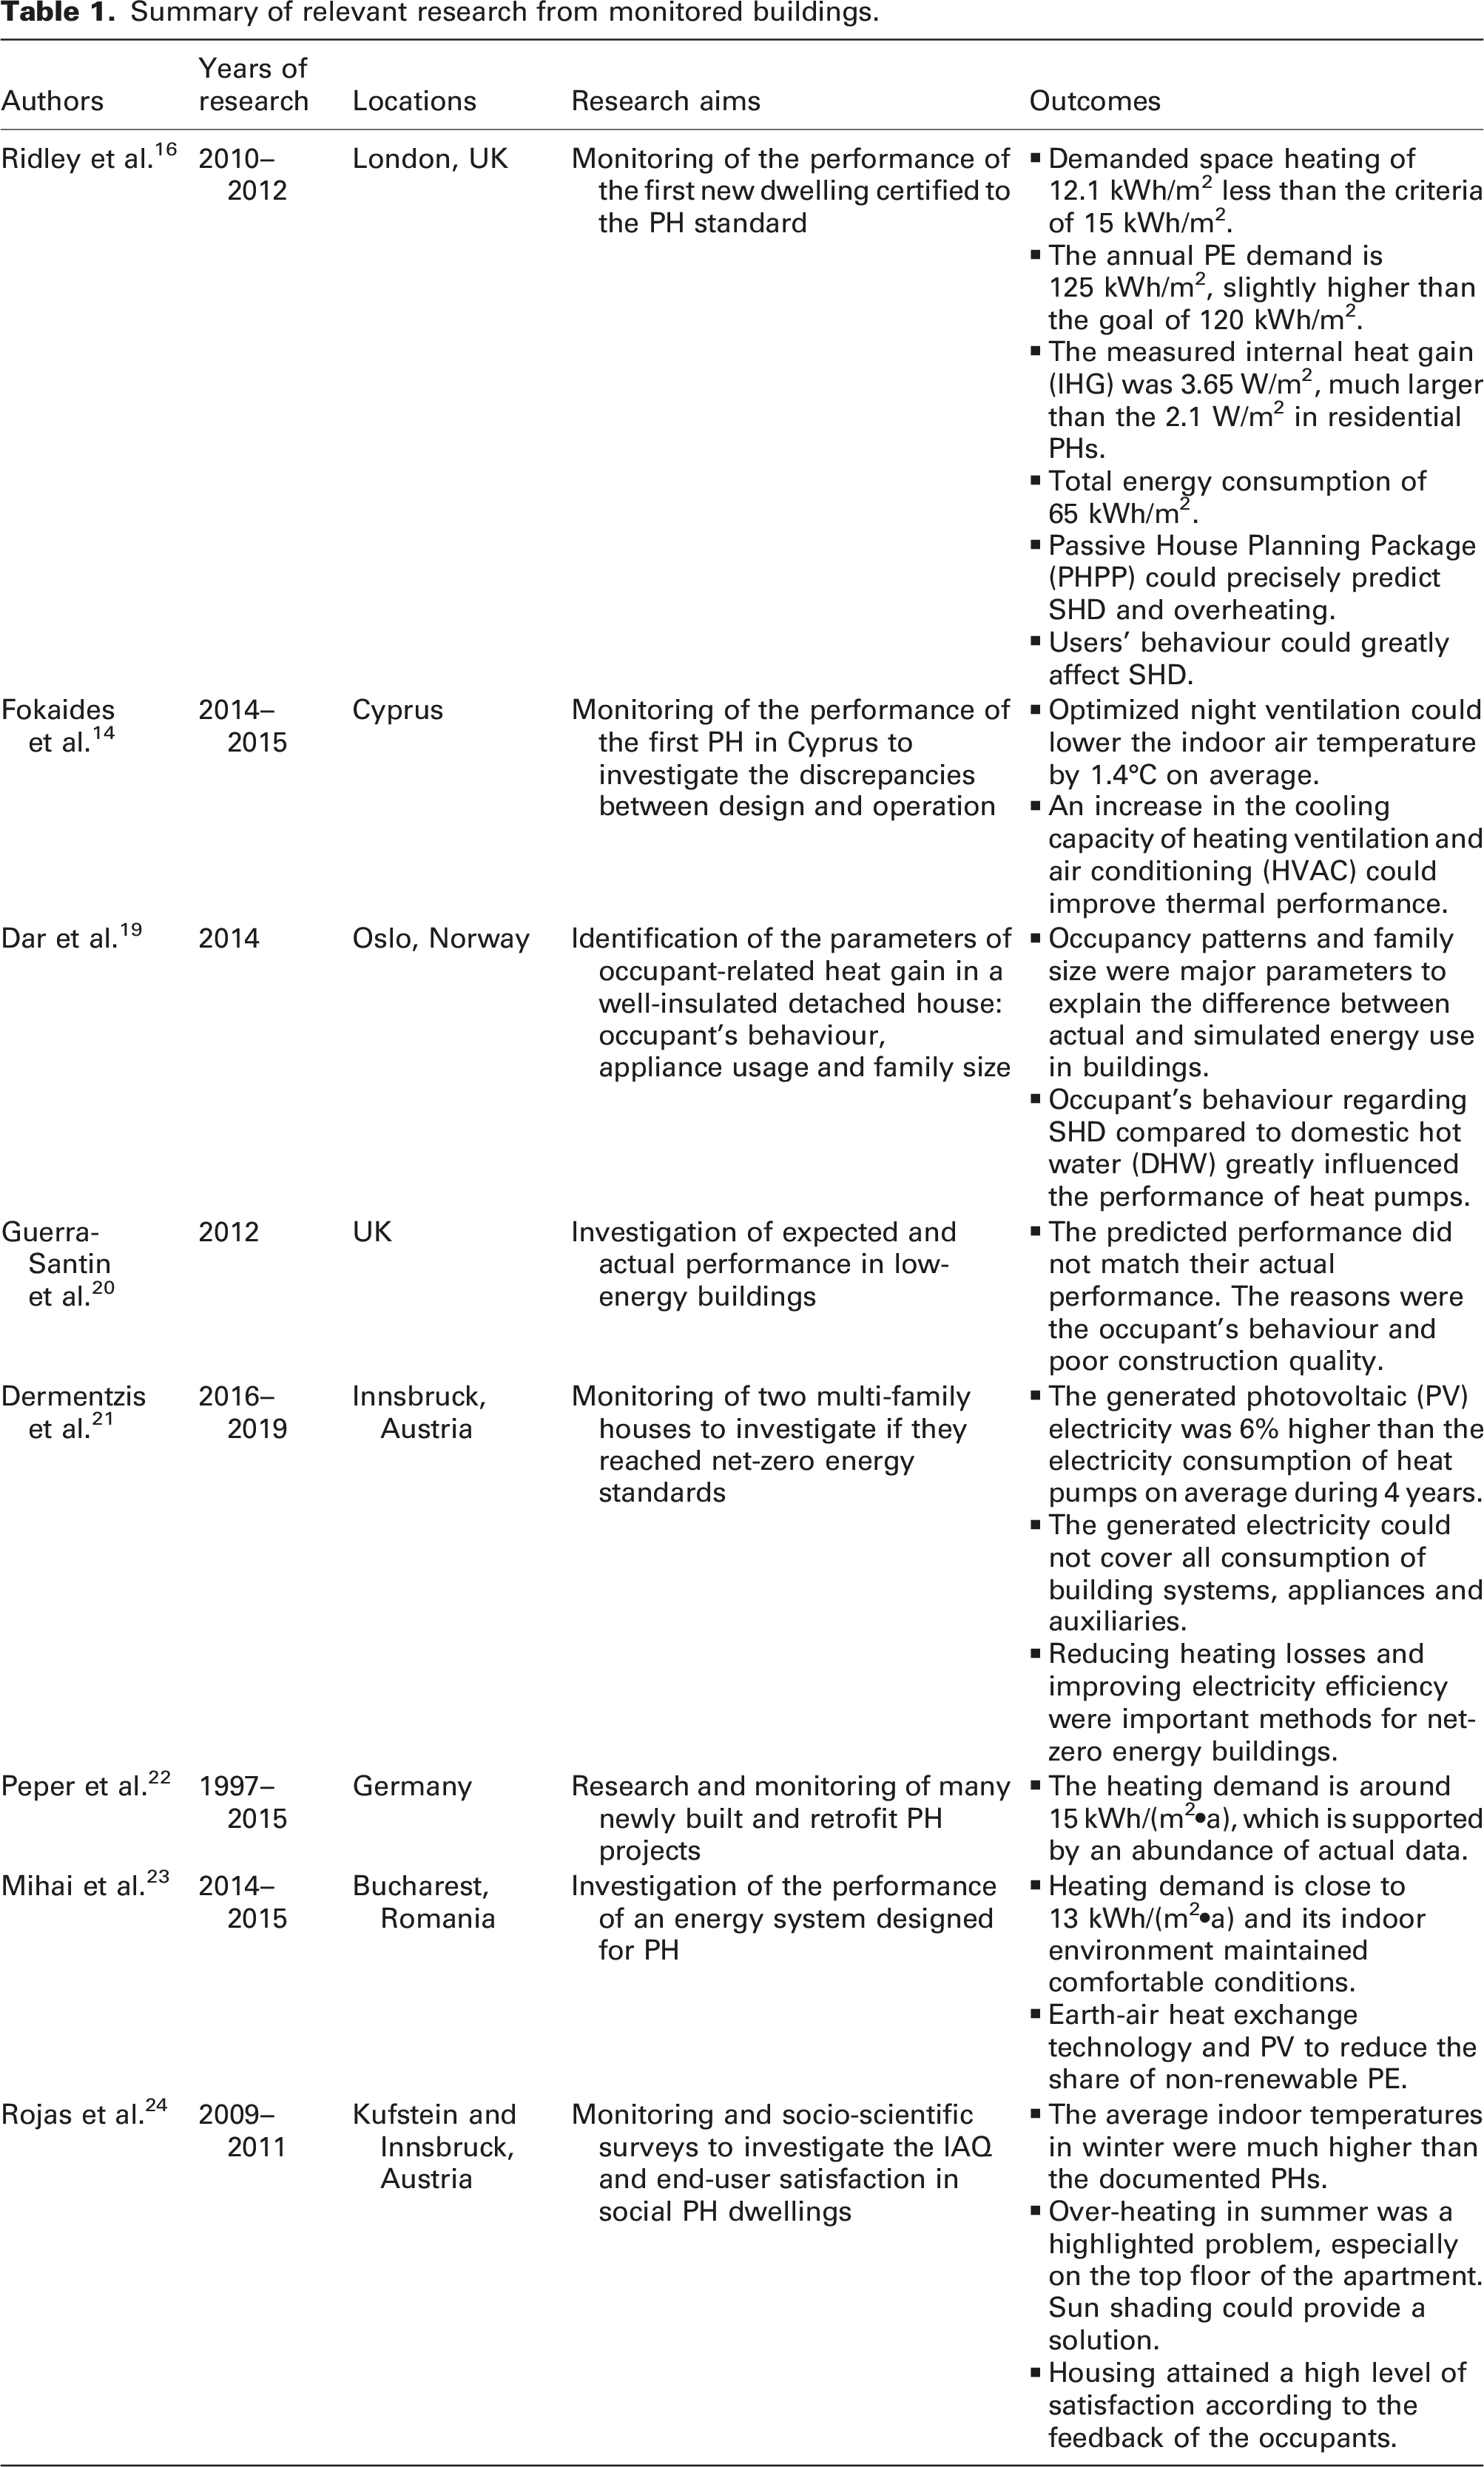
Ridley et al. 16 and Mihai et al. 23 evaluated the operating performance of PHs in the UK and Romania, respectively. They monitored SHD, PE consumption, IAQ, etc., and found that the indoor environment was comfortable and in line with the design indicators, but users’ behaviour had an impact on energy consumption resulting in PE consumption exceeding the target value. Dar et al. 19 and Guerra-Santin et al. 20 monitored the operating energy consumption of low-energy buildings in Norway and the UK, respectively. They found that there was a difference between actual and simulated energy consumption in buildings; the occupant’s behaviour and construction quality were the main causes for this difference. Peper et al. 22 evaluated many PHs in Germany and found that the SHD was around 15 kWh/(m2•a). Dermentzis et al. 21 and Mihai et al. 23 also proposed that improving the efficiency of electricity consumption and utilizing renewable energy were ways to improve the energy efficiency of buildings. The above analyses have illustrated that during the evaluation of building operating performance certain factors would need to be considered, like the quality of design and construction, users’ behaviour and family size.
The goal of this case study is to verify whether the operation of this residential PH building in a cold climate zone meets the expectation of energy-saving, including electricity consumption, SHD and corresponding indoor environment quality (IEQ). This article focuses on the first multi-storey residential PH building in China to implement energy consumption monitoring, which can provide meaningful support for policymakers in China. The novelty lies in (a) a calculation model based on the HVAC system of this building and (b) the establishment of an energy consumption monitoring system according to the calculation model. In addition, the verification of the accuracy of simulation tools is executed by the comparison of monitored data and simulated data.
Methodology
This article presents monitoring results of a residential PH building, focusing on its SHD, electricity consumption and site energy consumption. The energy efficiency level of this PH building was evaluated by comparing the monitored data with the simulated data of simulation tools Passive House Planning Package (PHPP) and IBE (IBE is a PUEB evaluation software based on China’s national conditions
6
and ISO 13790 standards.) and comparing it with the actual energy consumption of a neighbouring Green Building (GB) (see Figure 1). Flowchart of methodology.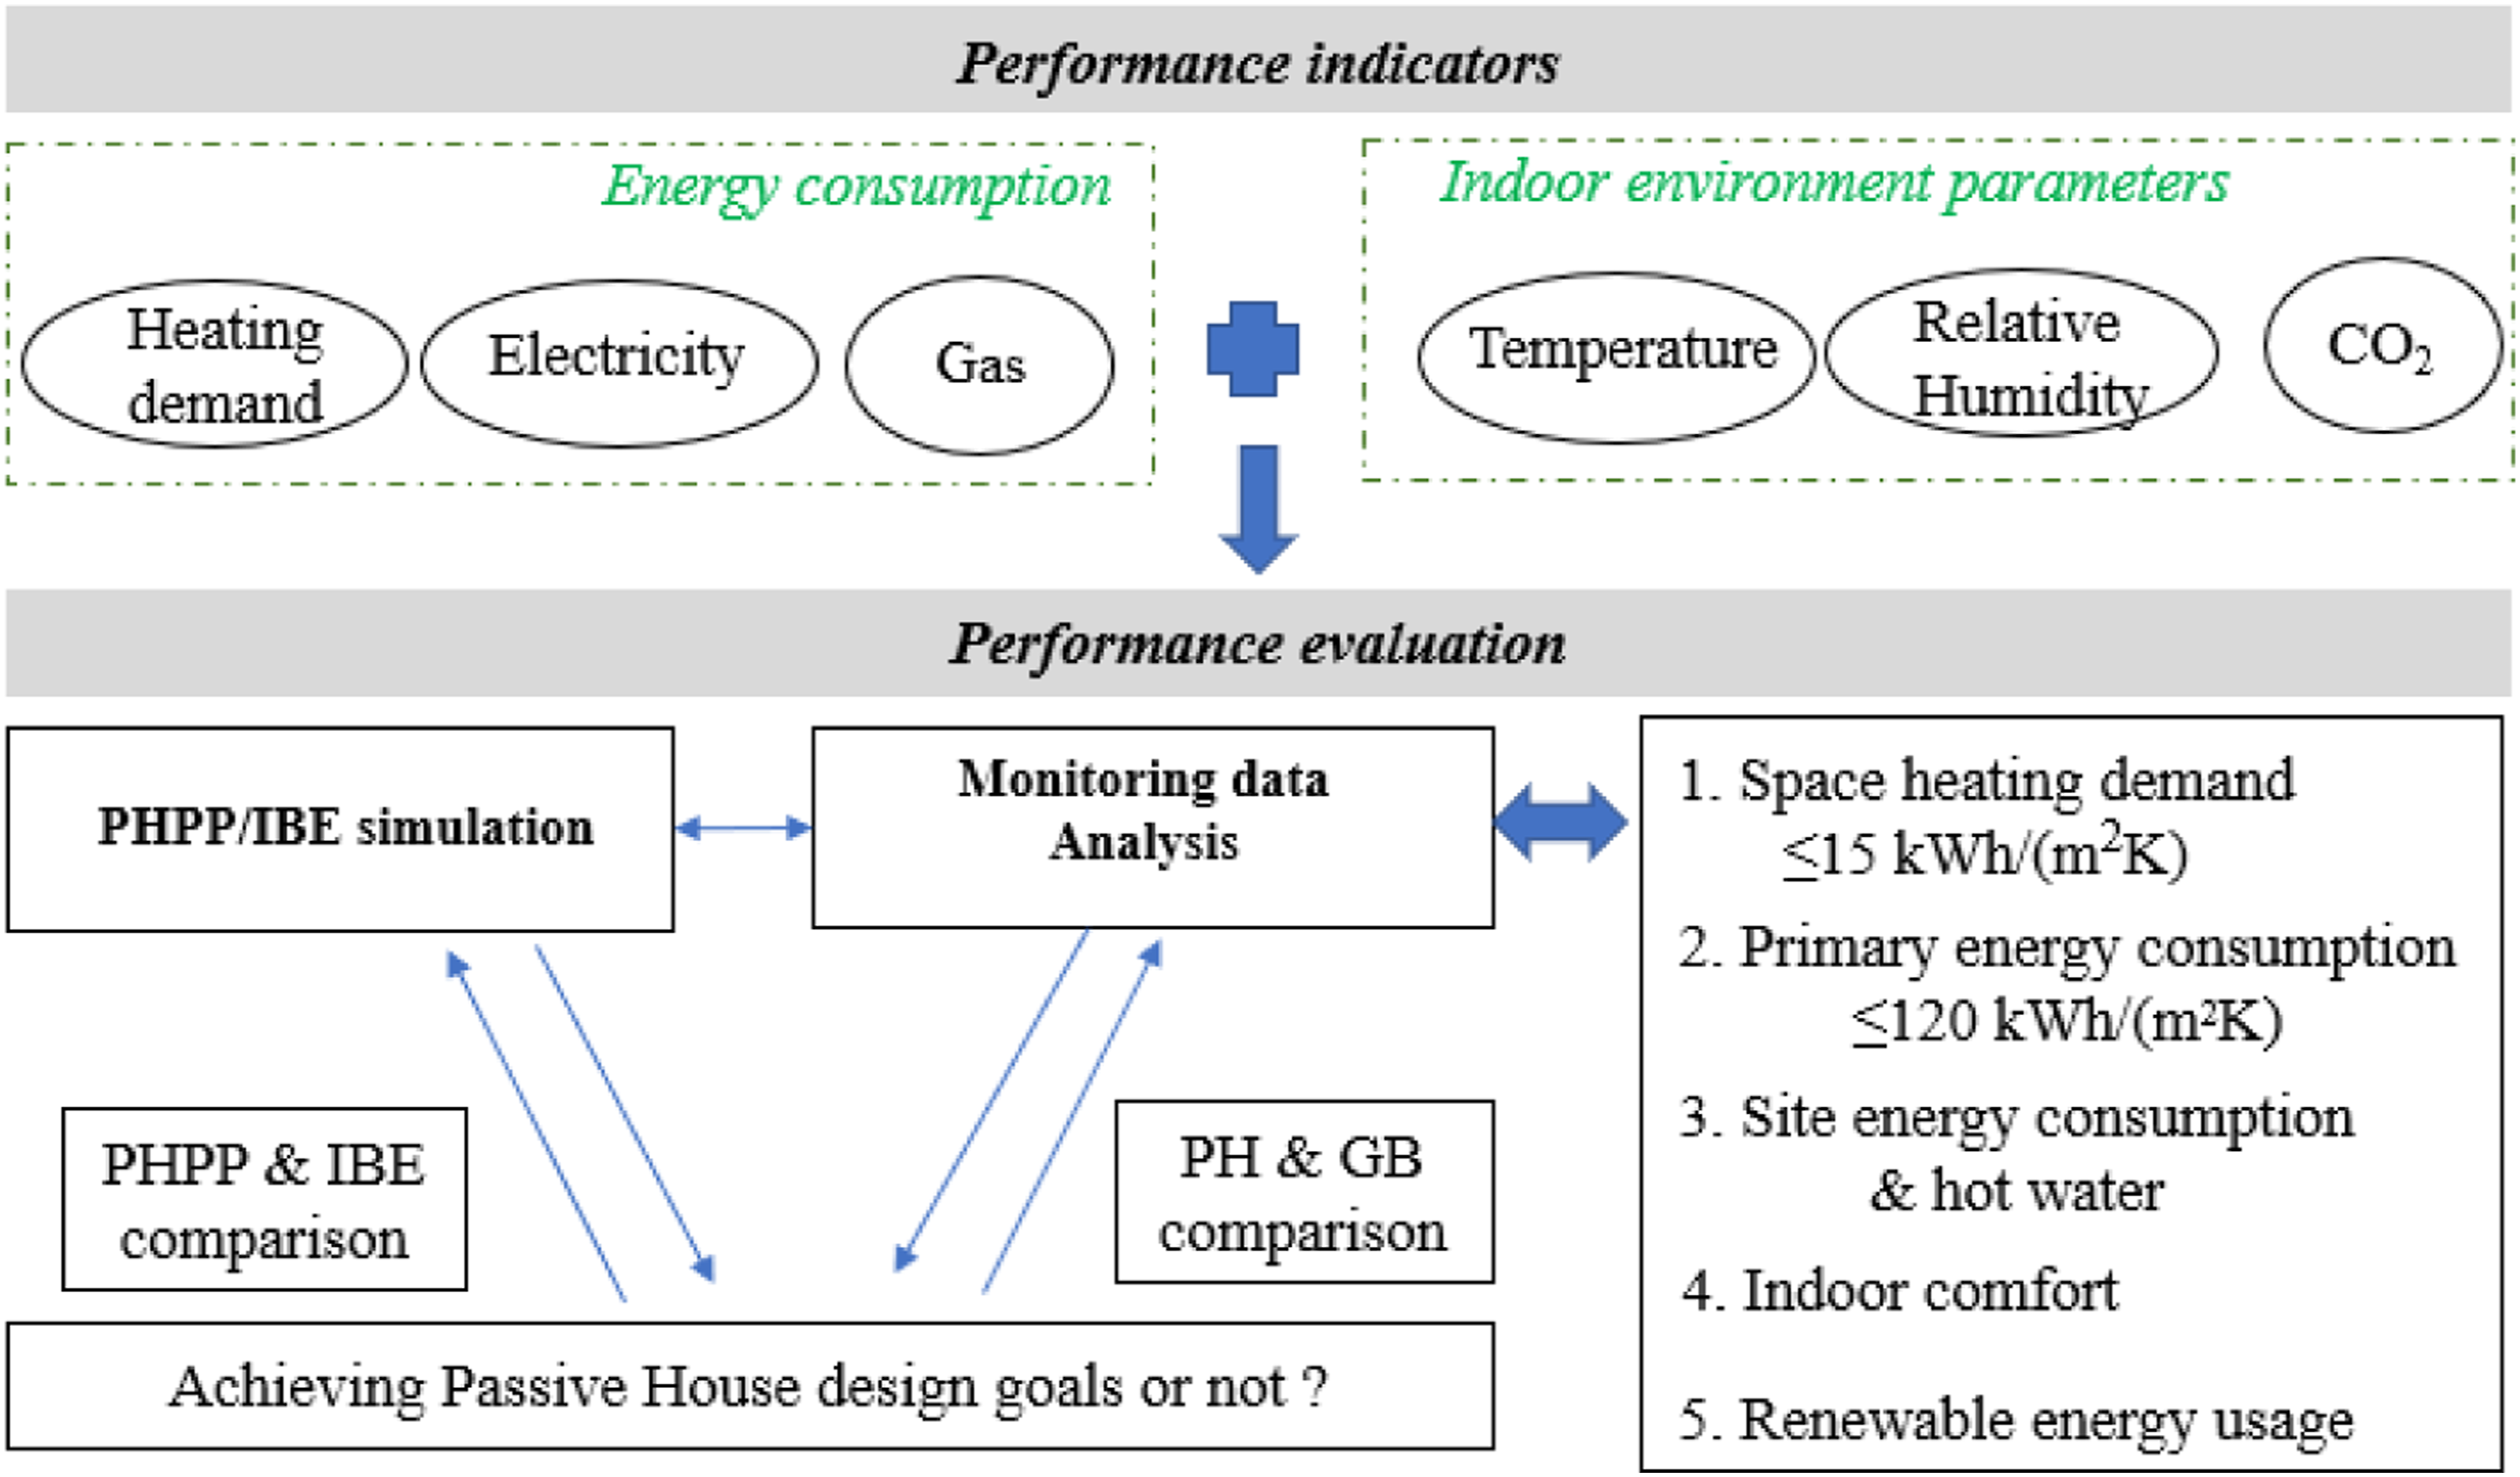
Basic information on the investigated building
Qingdao is a coastal city in northern China. The summer in Qingdao is hot and humid. The hottest month is August, with an average daily temperature of 25°C, so active cooling and dehumidification are necessary to maintain a comfortable indoor environment. The winter is cold. The coldest month is January, with an average daily temperature of −2°C, and space heating in the winter is a national requirement. 25 During spring and autumn, natural ventilation can provide a comfortable indoor environment. Even so, sudden weather changes do occur at any time. For example, cold fronts with strong winds occurred from 6th to 7th January 2021. The lowest temperature in Qingdao’s urban area on the 7th January was −15.9°C, which was the lowest temperature monitored by the Qingdao weather station since 1961. 26
A PH district
25
was constructed in 2019 that has been certified by the German Passive House Institute (PHI),
27
and also certified as a two-star GB by China GB Council.
28
A PH is a building in which thermal comfort can be guaranteed by post-heating or post-cooling the incoming fresh-air mass required for good IAQ.
29
The Chinese Standard, GB/T 50378-2019, refers to the buildings, which save resources, protect the environment, reduce pollution and provide people with healthy, suitable and efficient spaces as much as possible throughout the building’s life cycle.
30
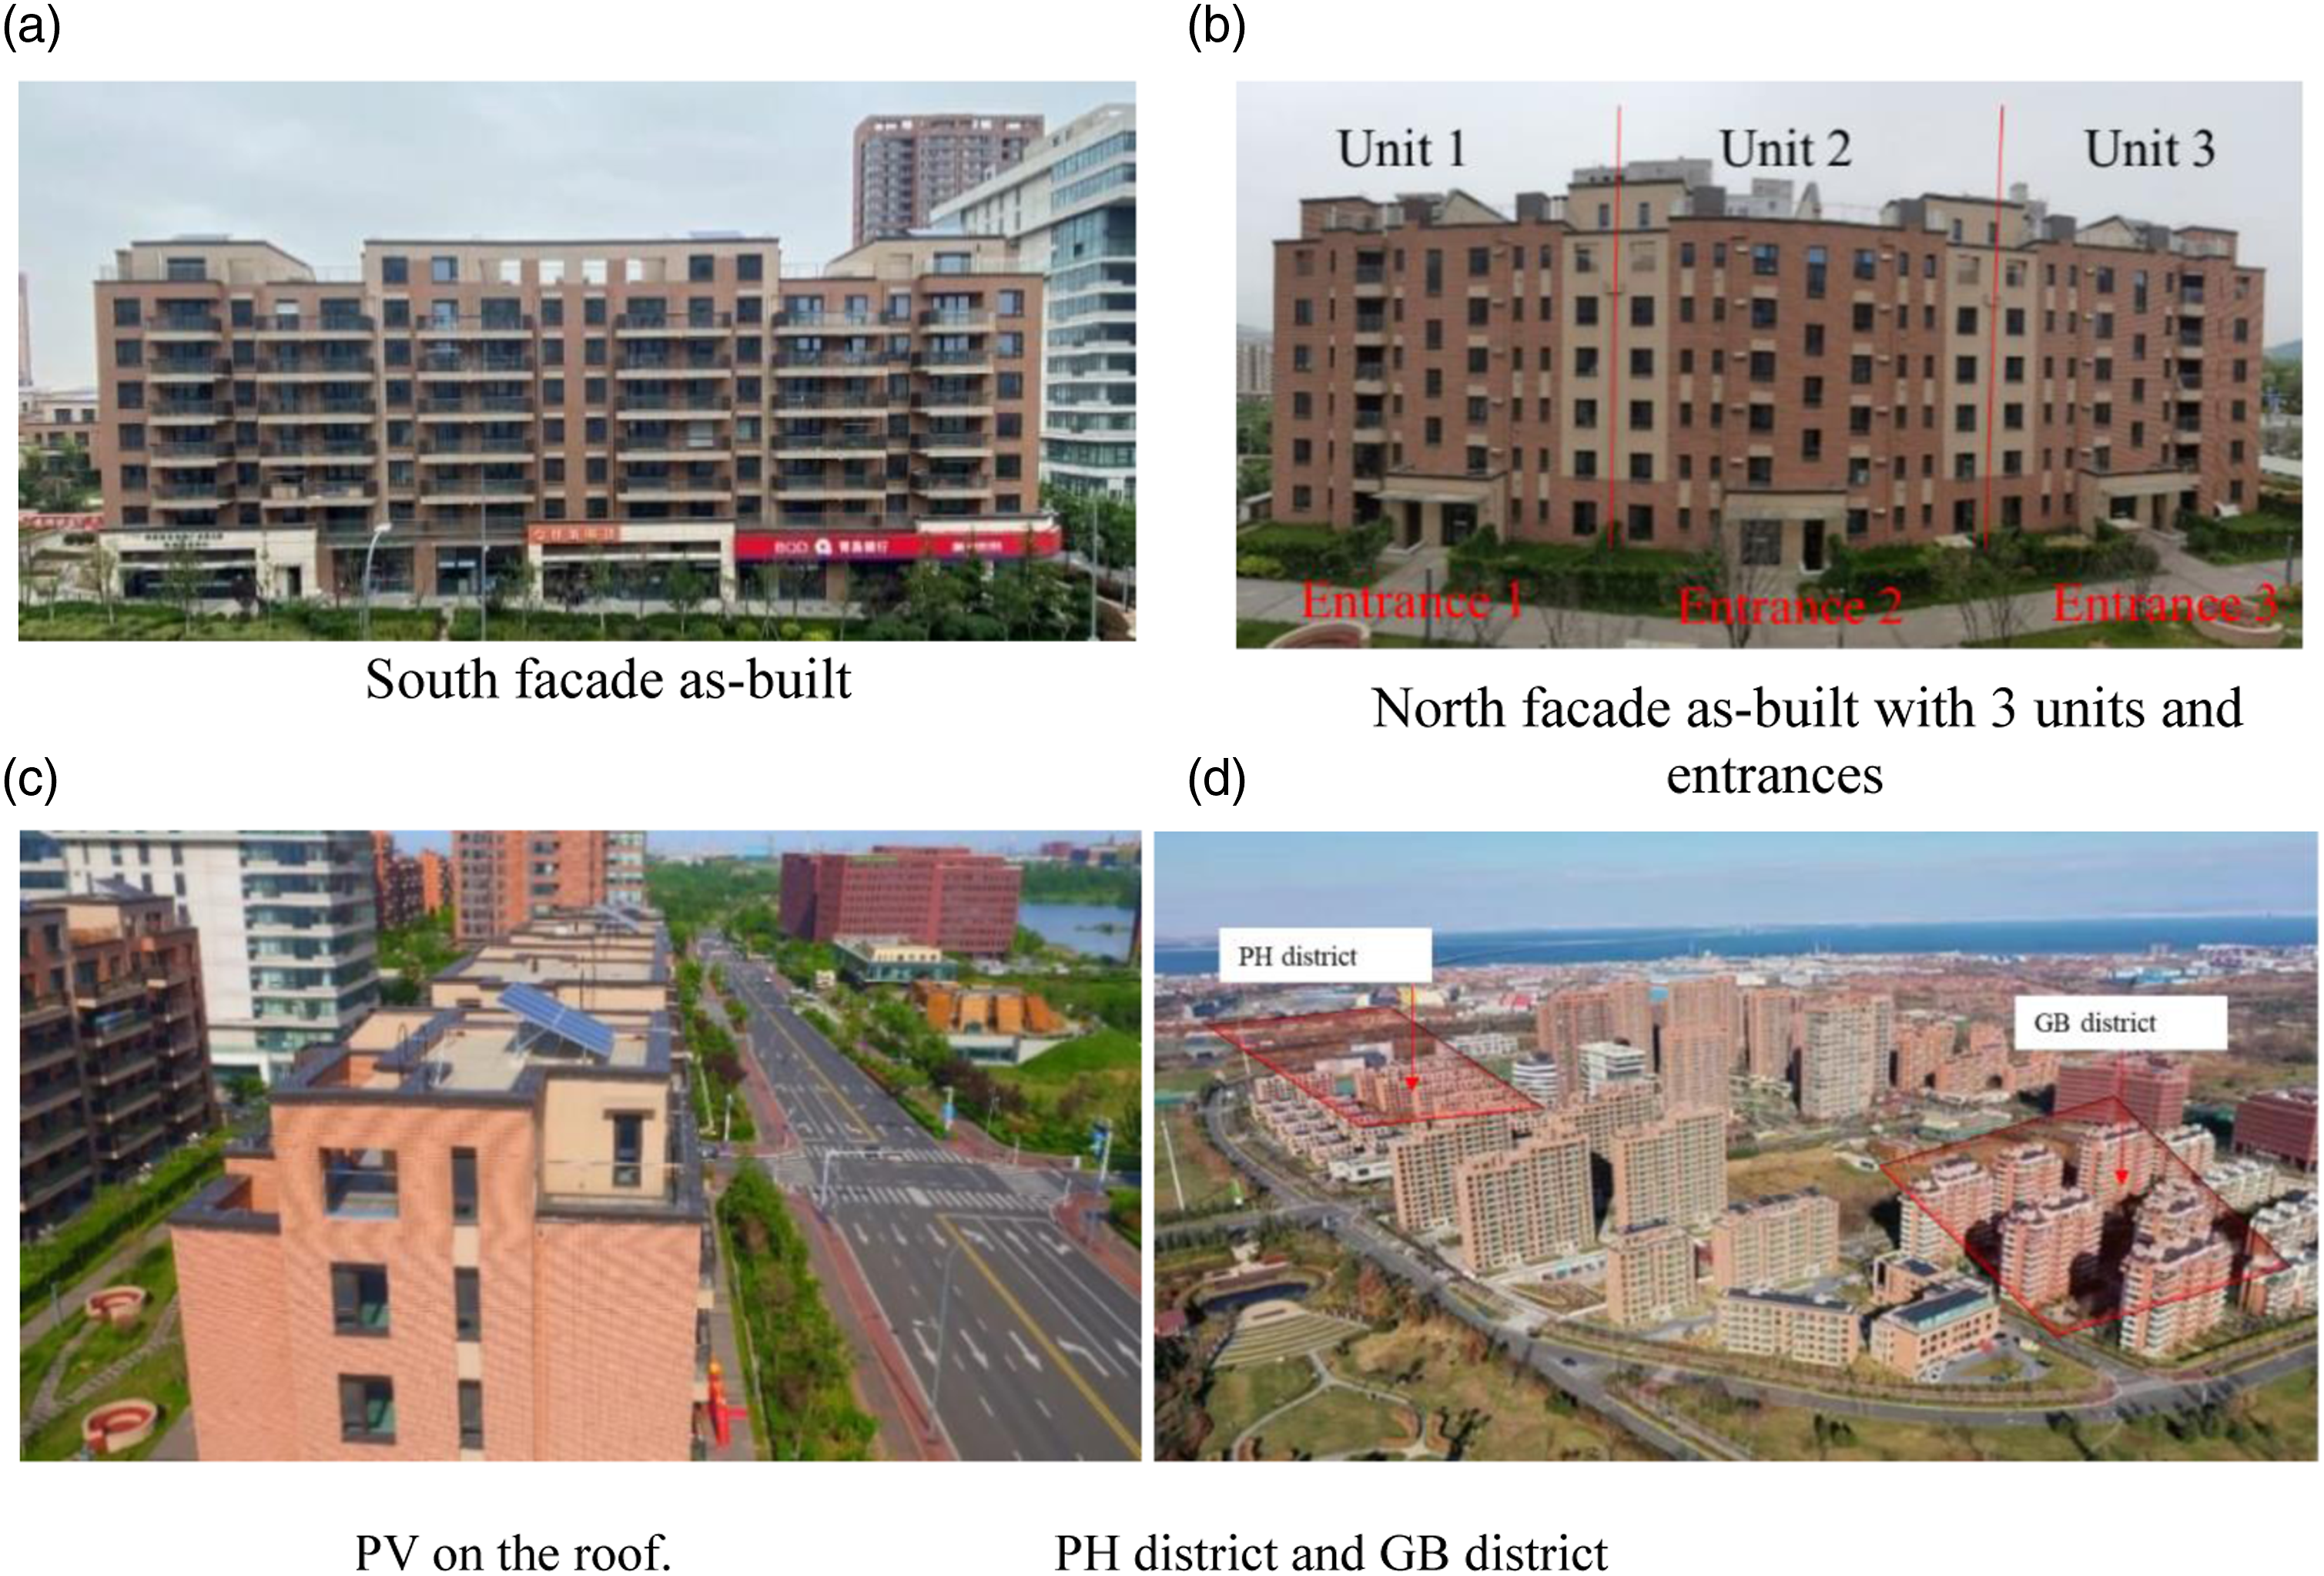
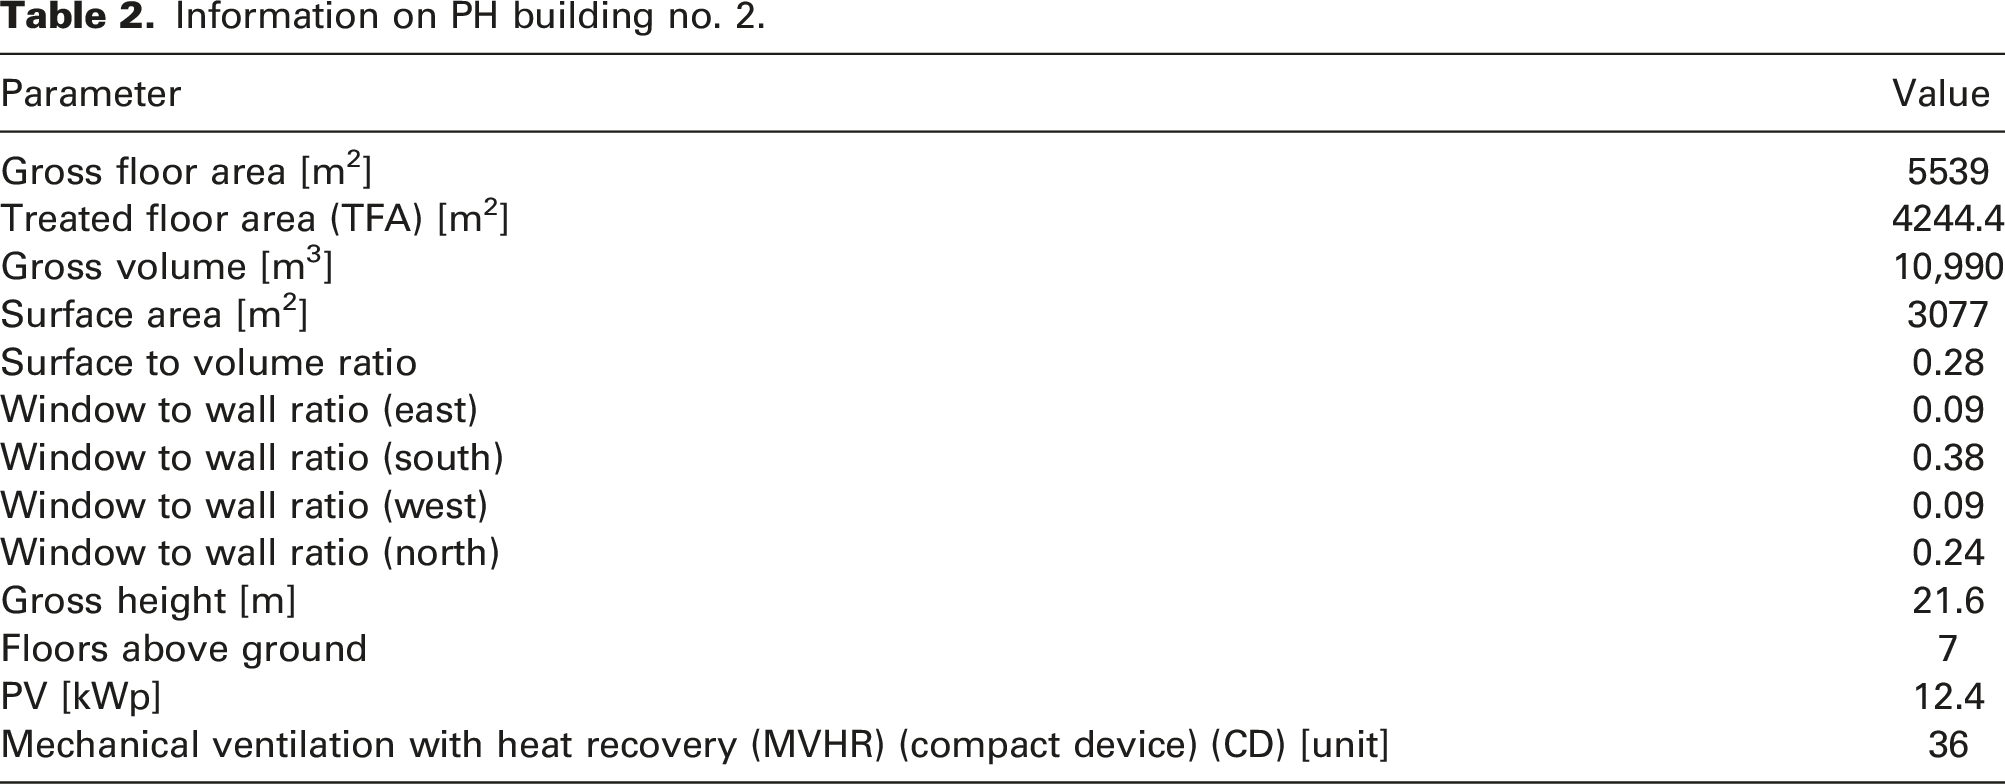
The PH building No. 2 with 3 units and 36 apartments is one of the buildings in this district (Figures 2 and 3). Ground source heat pumps (GSHPs) and PV are used in this district as renewable energy (Figure 2). The basic building dimensions are given in Table 2. For comparison, a building from an adjacent two-star GB district built in 2016 was selected
25
(see Figure 3(d)). The PH and GB districts and buildings were introduced in detail in previous publications.
25
The details of GB are not included herein. Section drawing of PH building no. 2. The outer yellow line is the building envelope and the inner red line is the airtight layer. On the roof, PV is installed and there are GSHP service rooms in the basement. Photos of PH and GB buildings. Information on PH building no. 2.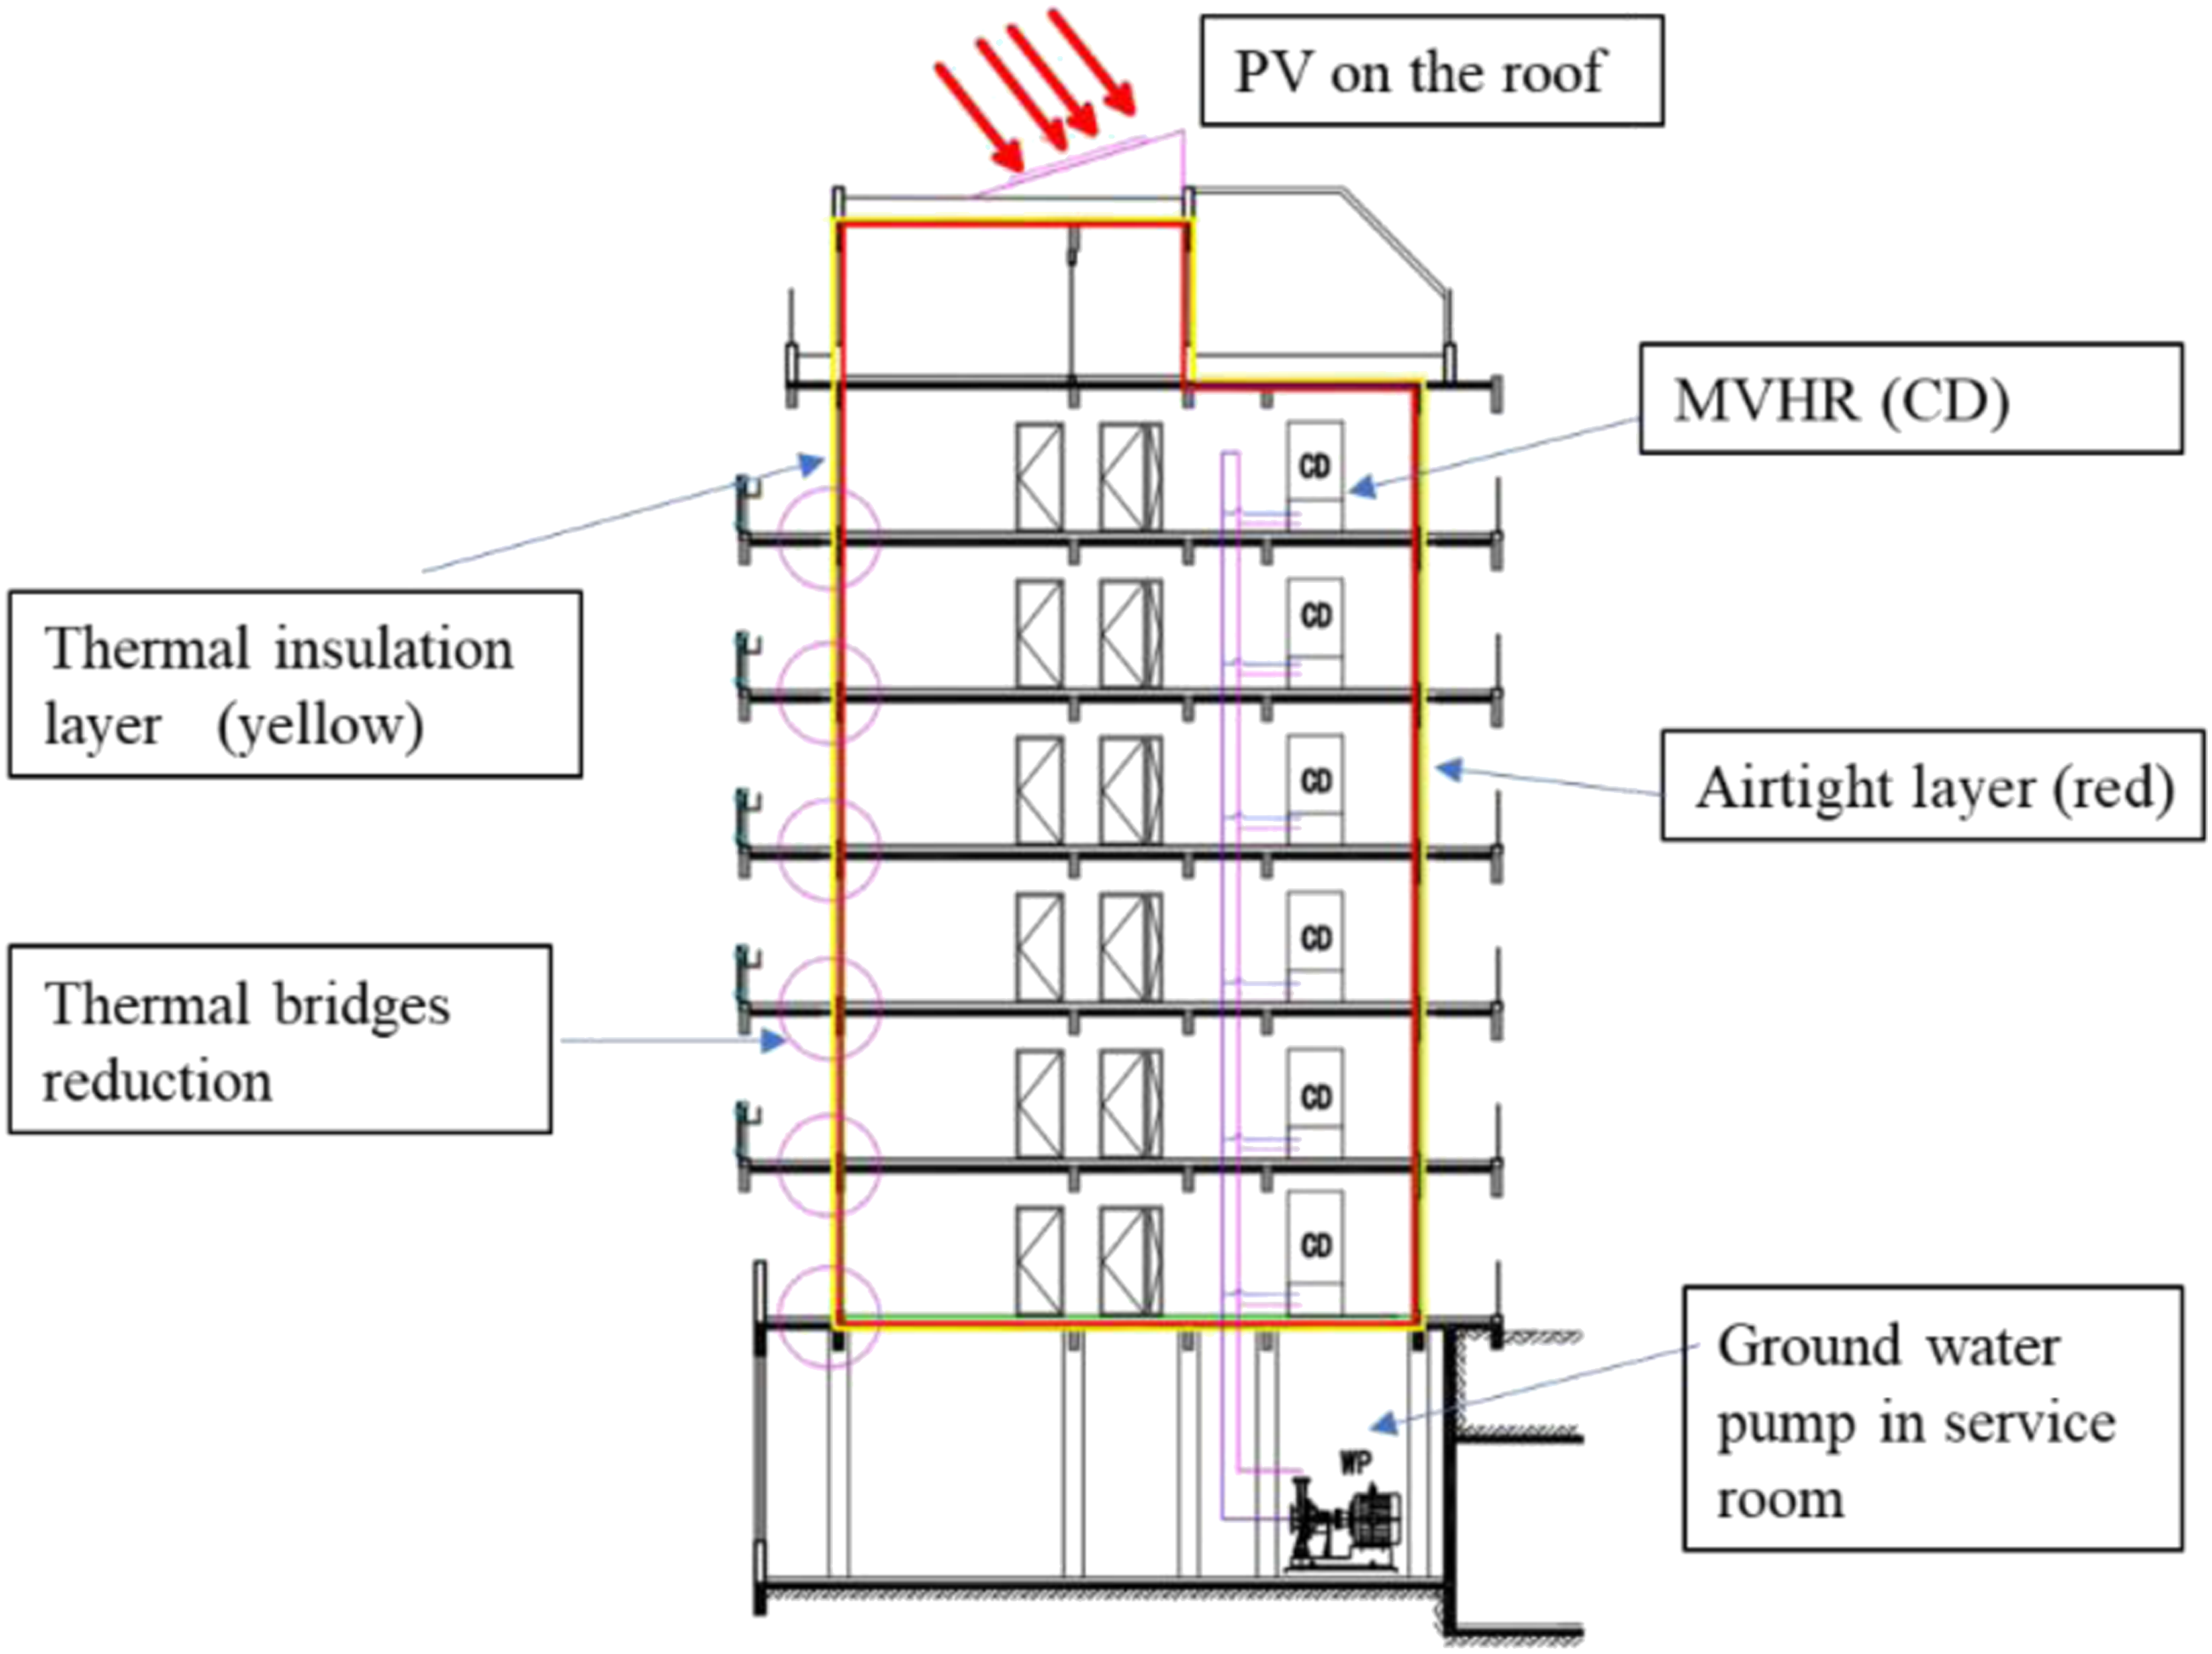
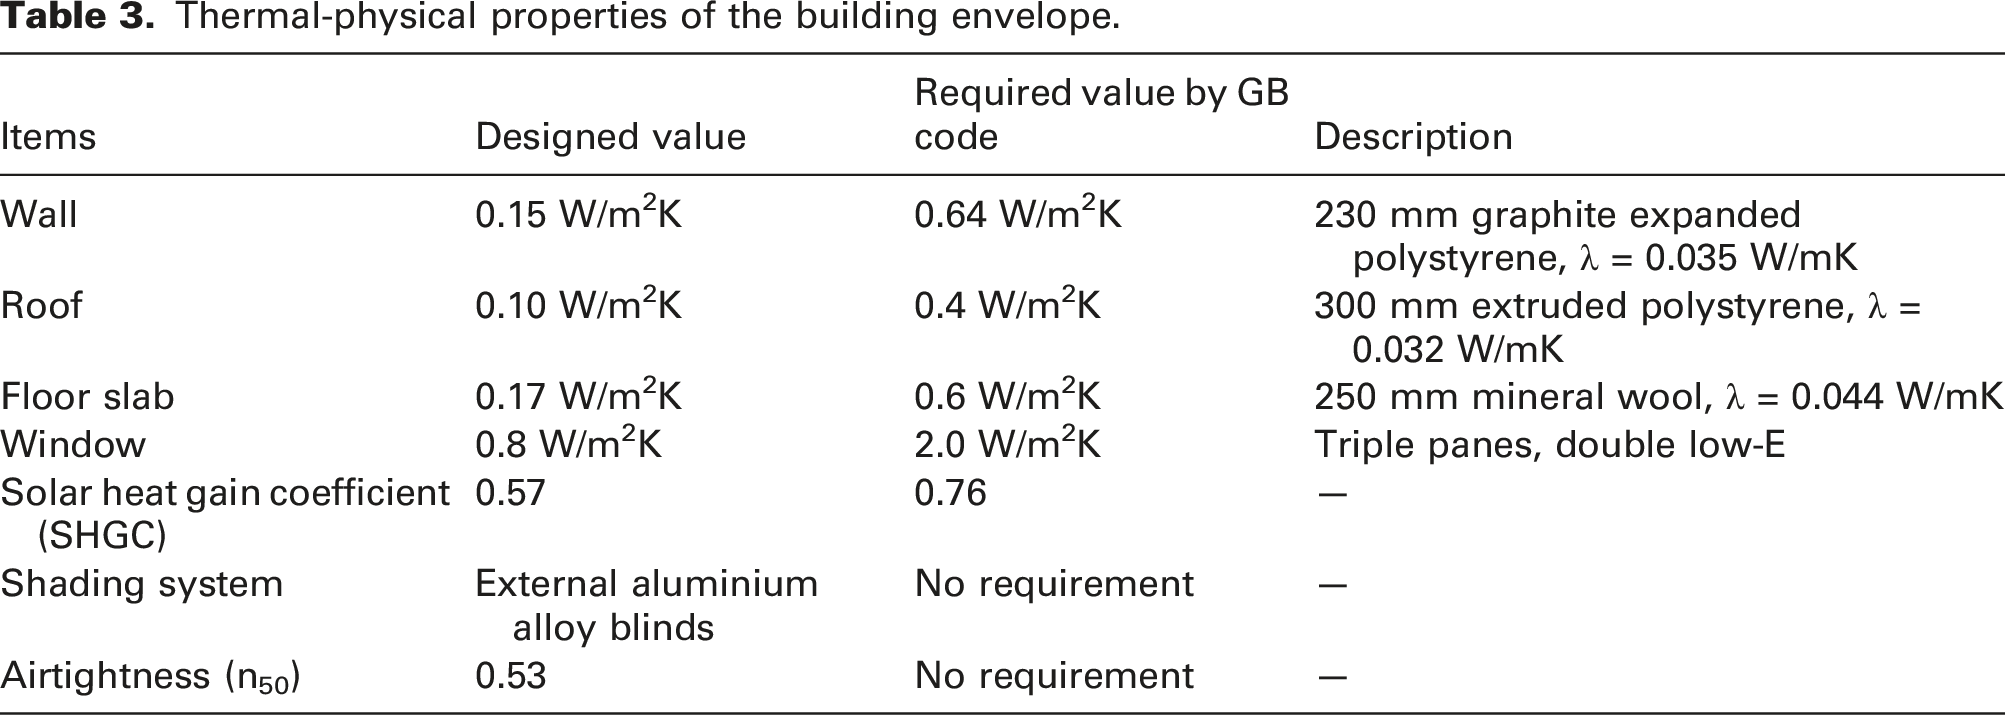
Thermal-physical properties of the building envelope.
The PH building’s energy consumption was simulated via PHPP, 31 which guided the entire period of design and construction. PHPP is an EXCEL table-based software for calculating the energy consumption of PH buildings. It can provide the following results reliably: annual heating demand and maximum heating load, annual cooling demand and maximum cooling load (in case of active cooling); comfort level during summer (frequency of overheating); annual demand for renewable PE and PE demand of all energy services in the entire building; assessment of the annual renewable energy gains.32,33 First of all, compared with the scattered and short duration of cooling demand of customers in summer, the heating demand is more constant and concentrated in winter, and the energy-saving and carbon-reducing effect is more obvious. In addition, heating demand is the most important indicator of PH, so this article covers the monitored project in winter and is compared with the simulated indicators in winter, while the summer indicators, such as the cooling demand and frequency of overheating, are not the primary focus of this article.
Main information about the compact devices.
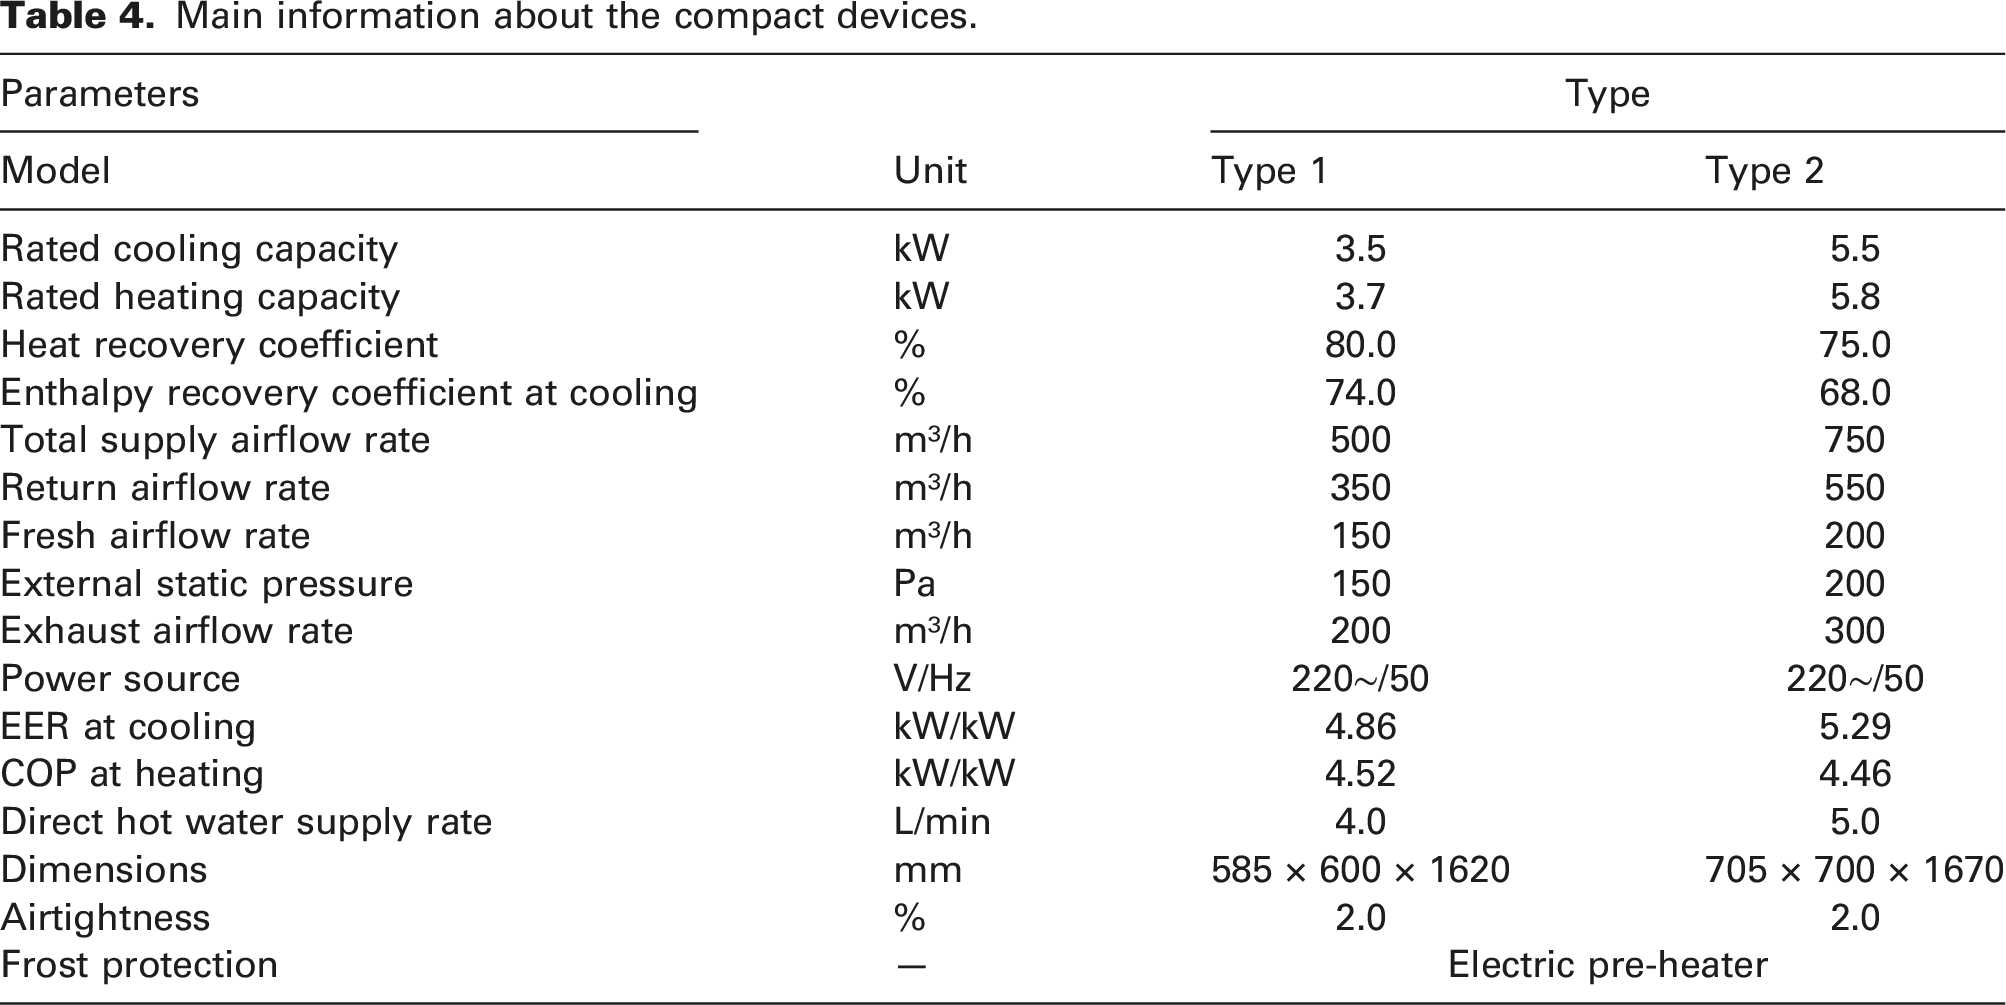
Figure 4 depicts the location and airflow organization of the CDs in two typical apartments. In the left apartment, the CD is positioned on the northern exterior balcony, which is outside of the building envelope. In the apartment on the right, the CD is placed in the kitchen, which is within the building envelope. The circulation air as well as the supply air is conditioned to provide space heating and cooling. Two typical floor layouts and airflow organization. The CDs are rationally positioned. Orange dots are sensors for IEQ monitoring.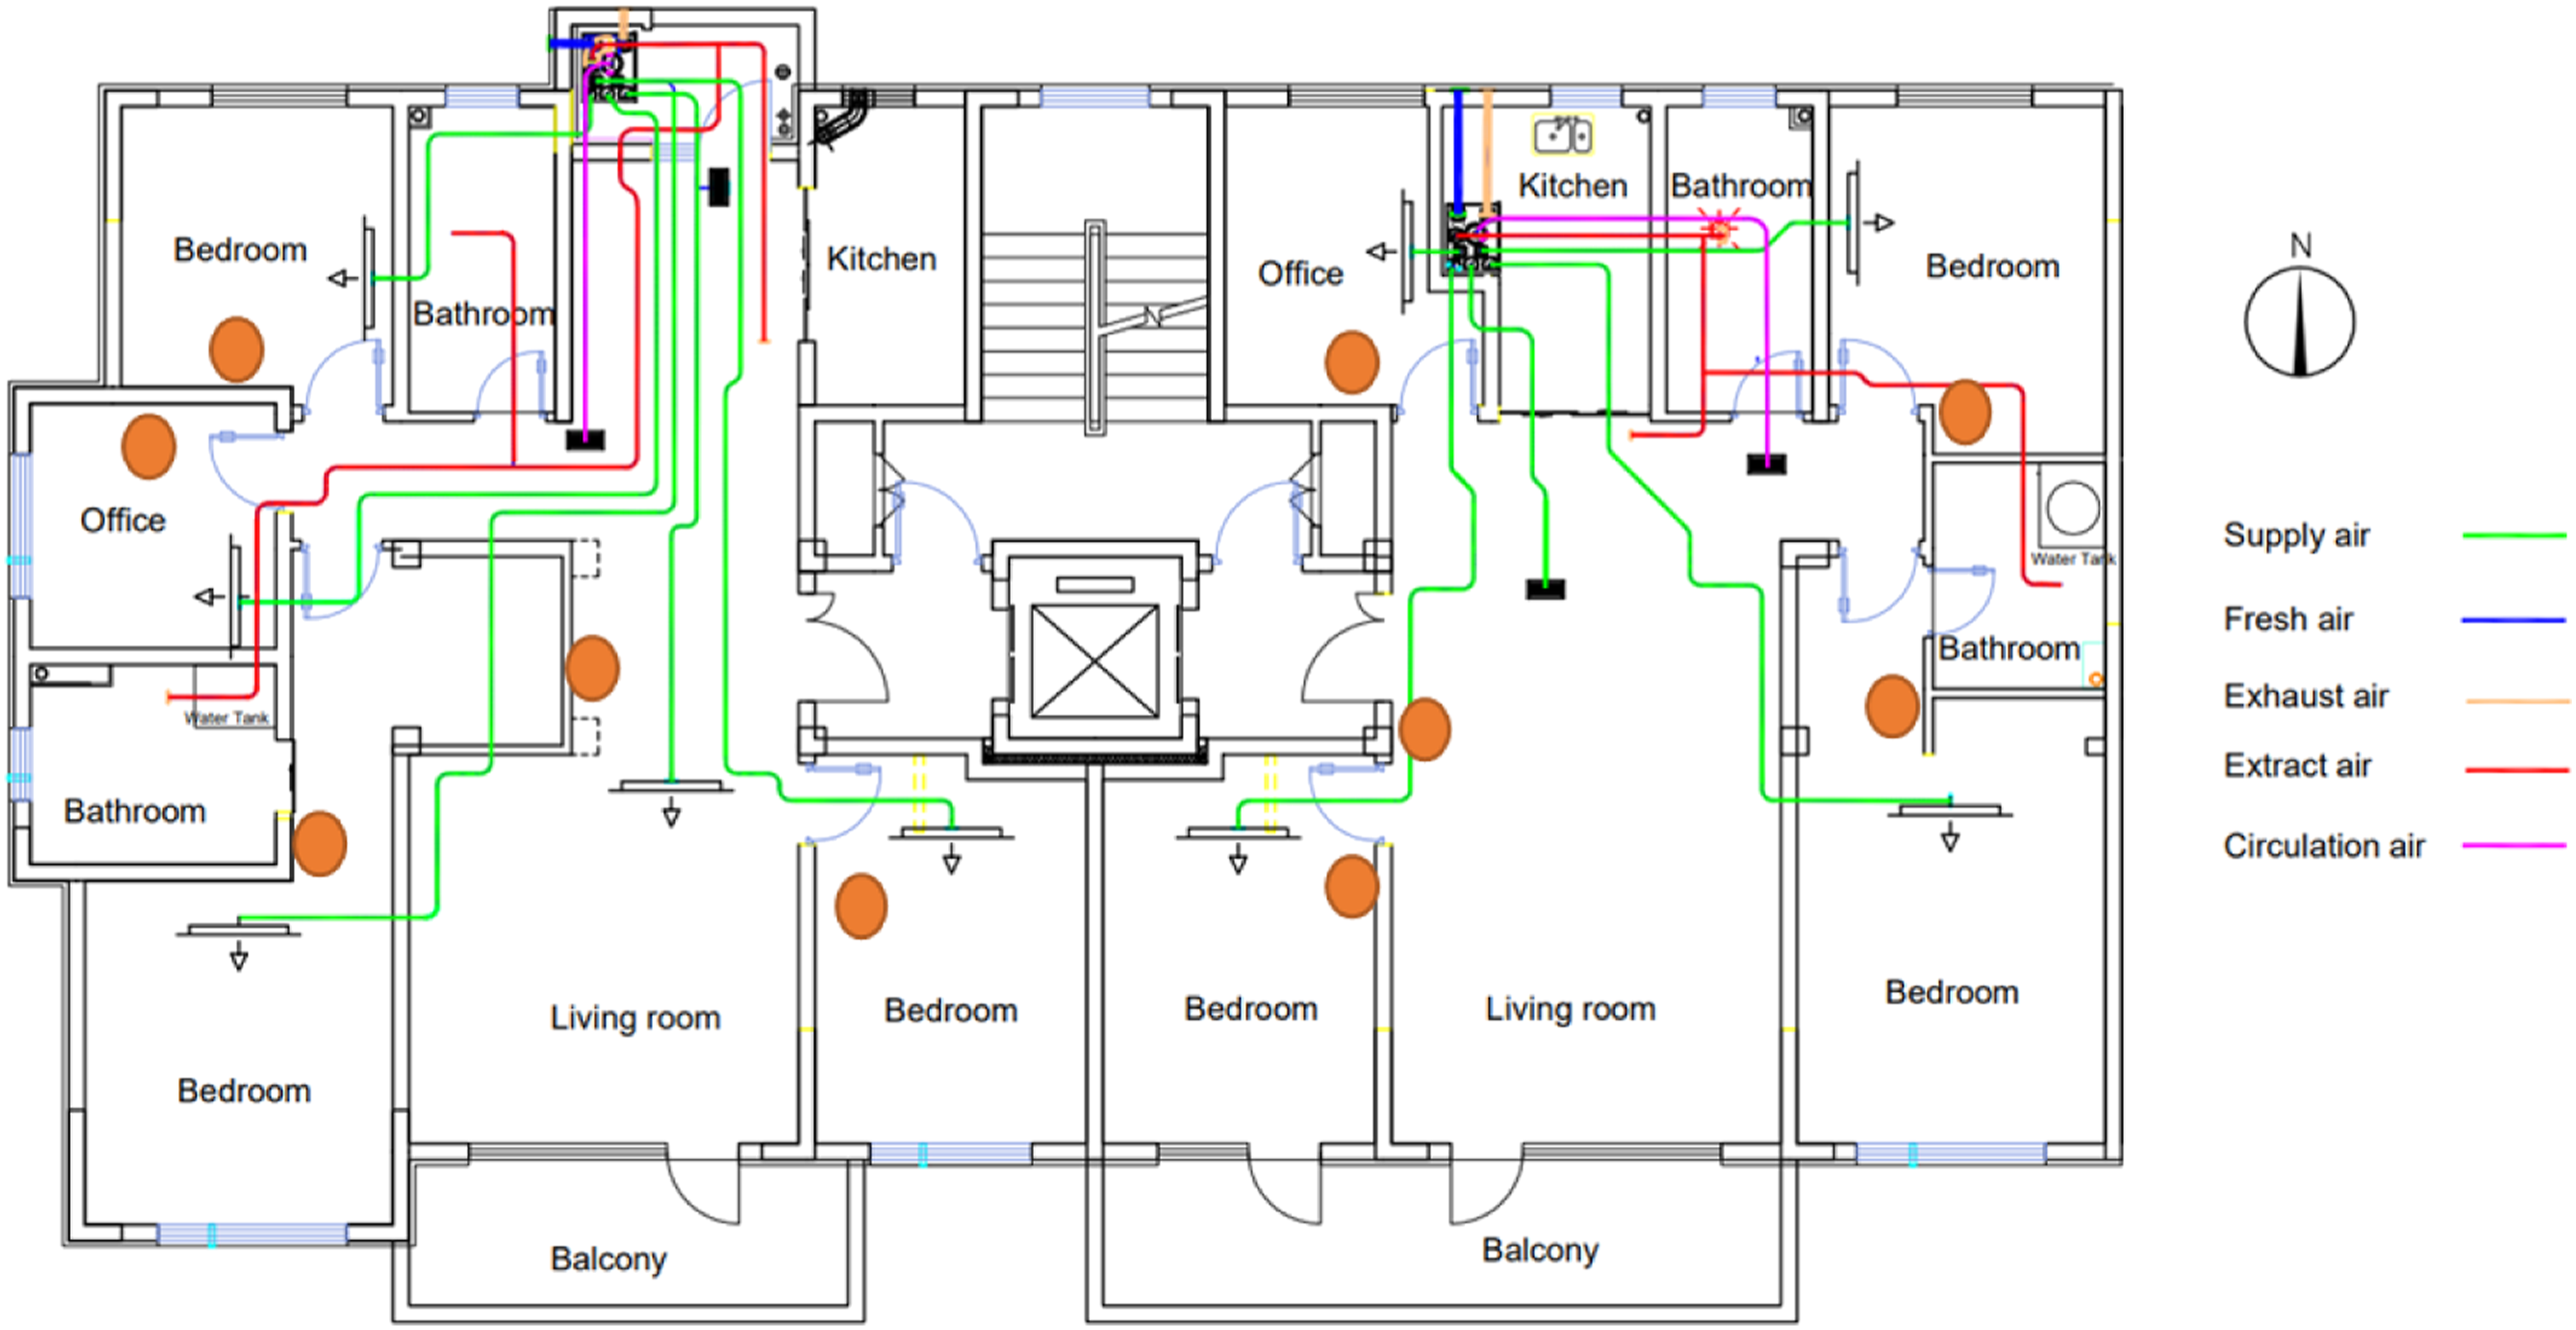
Monitoring system setup
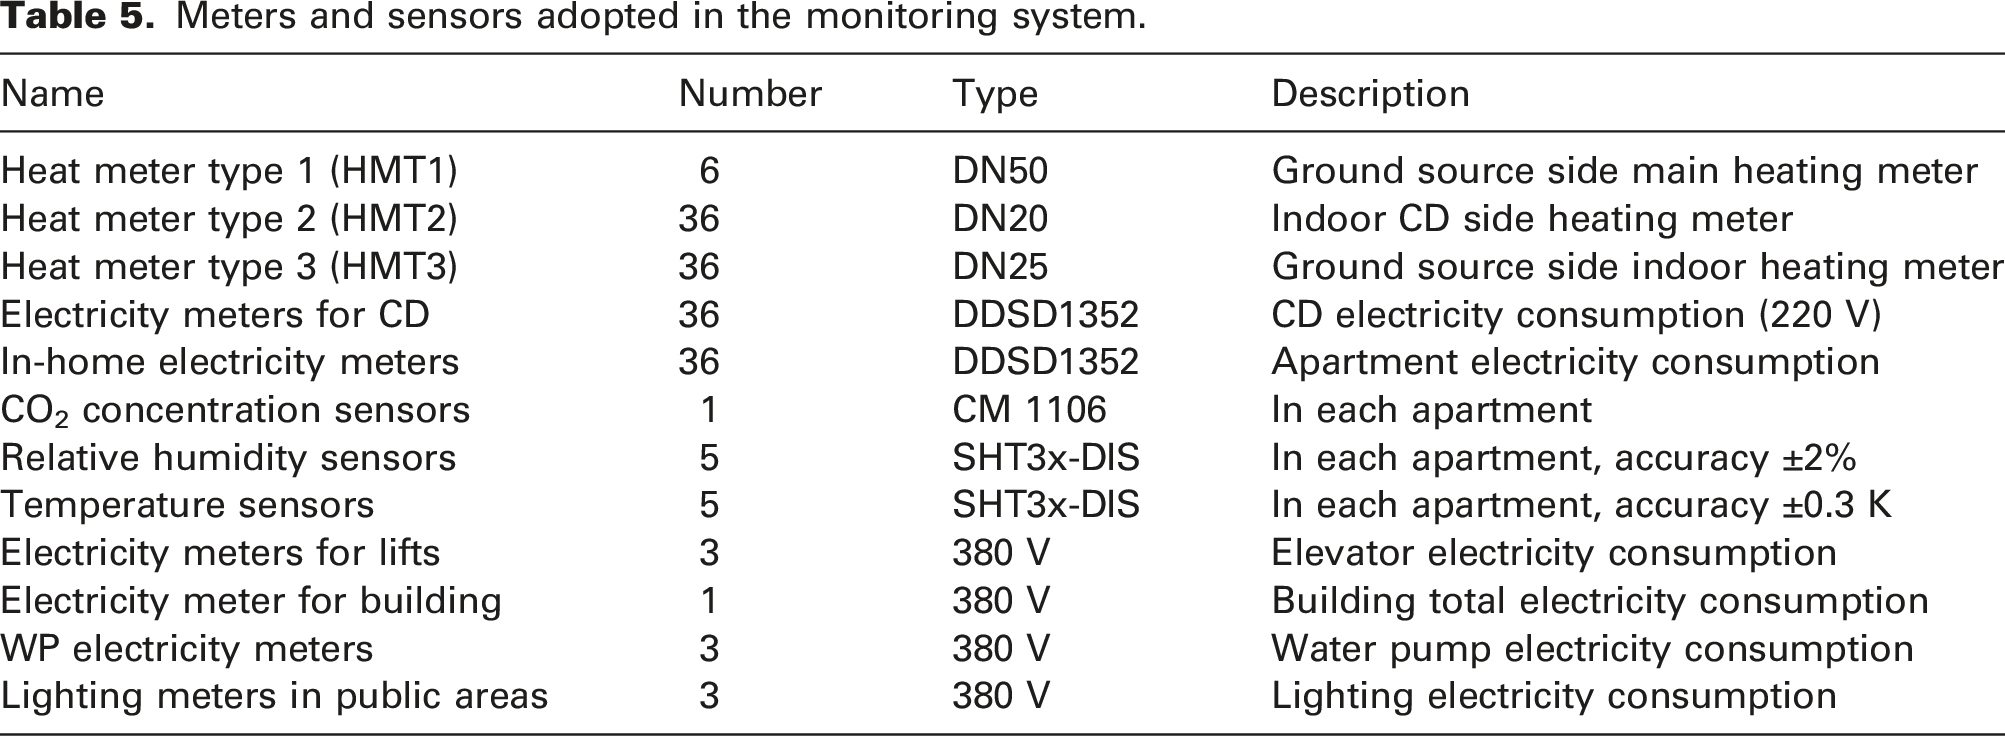
Meters and sensors adopted in the monitoring system.
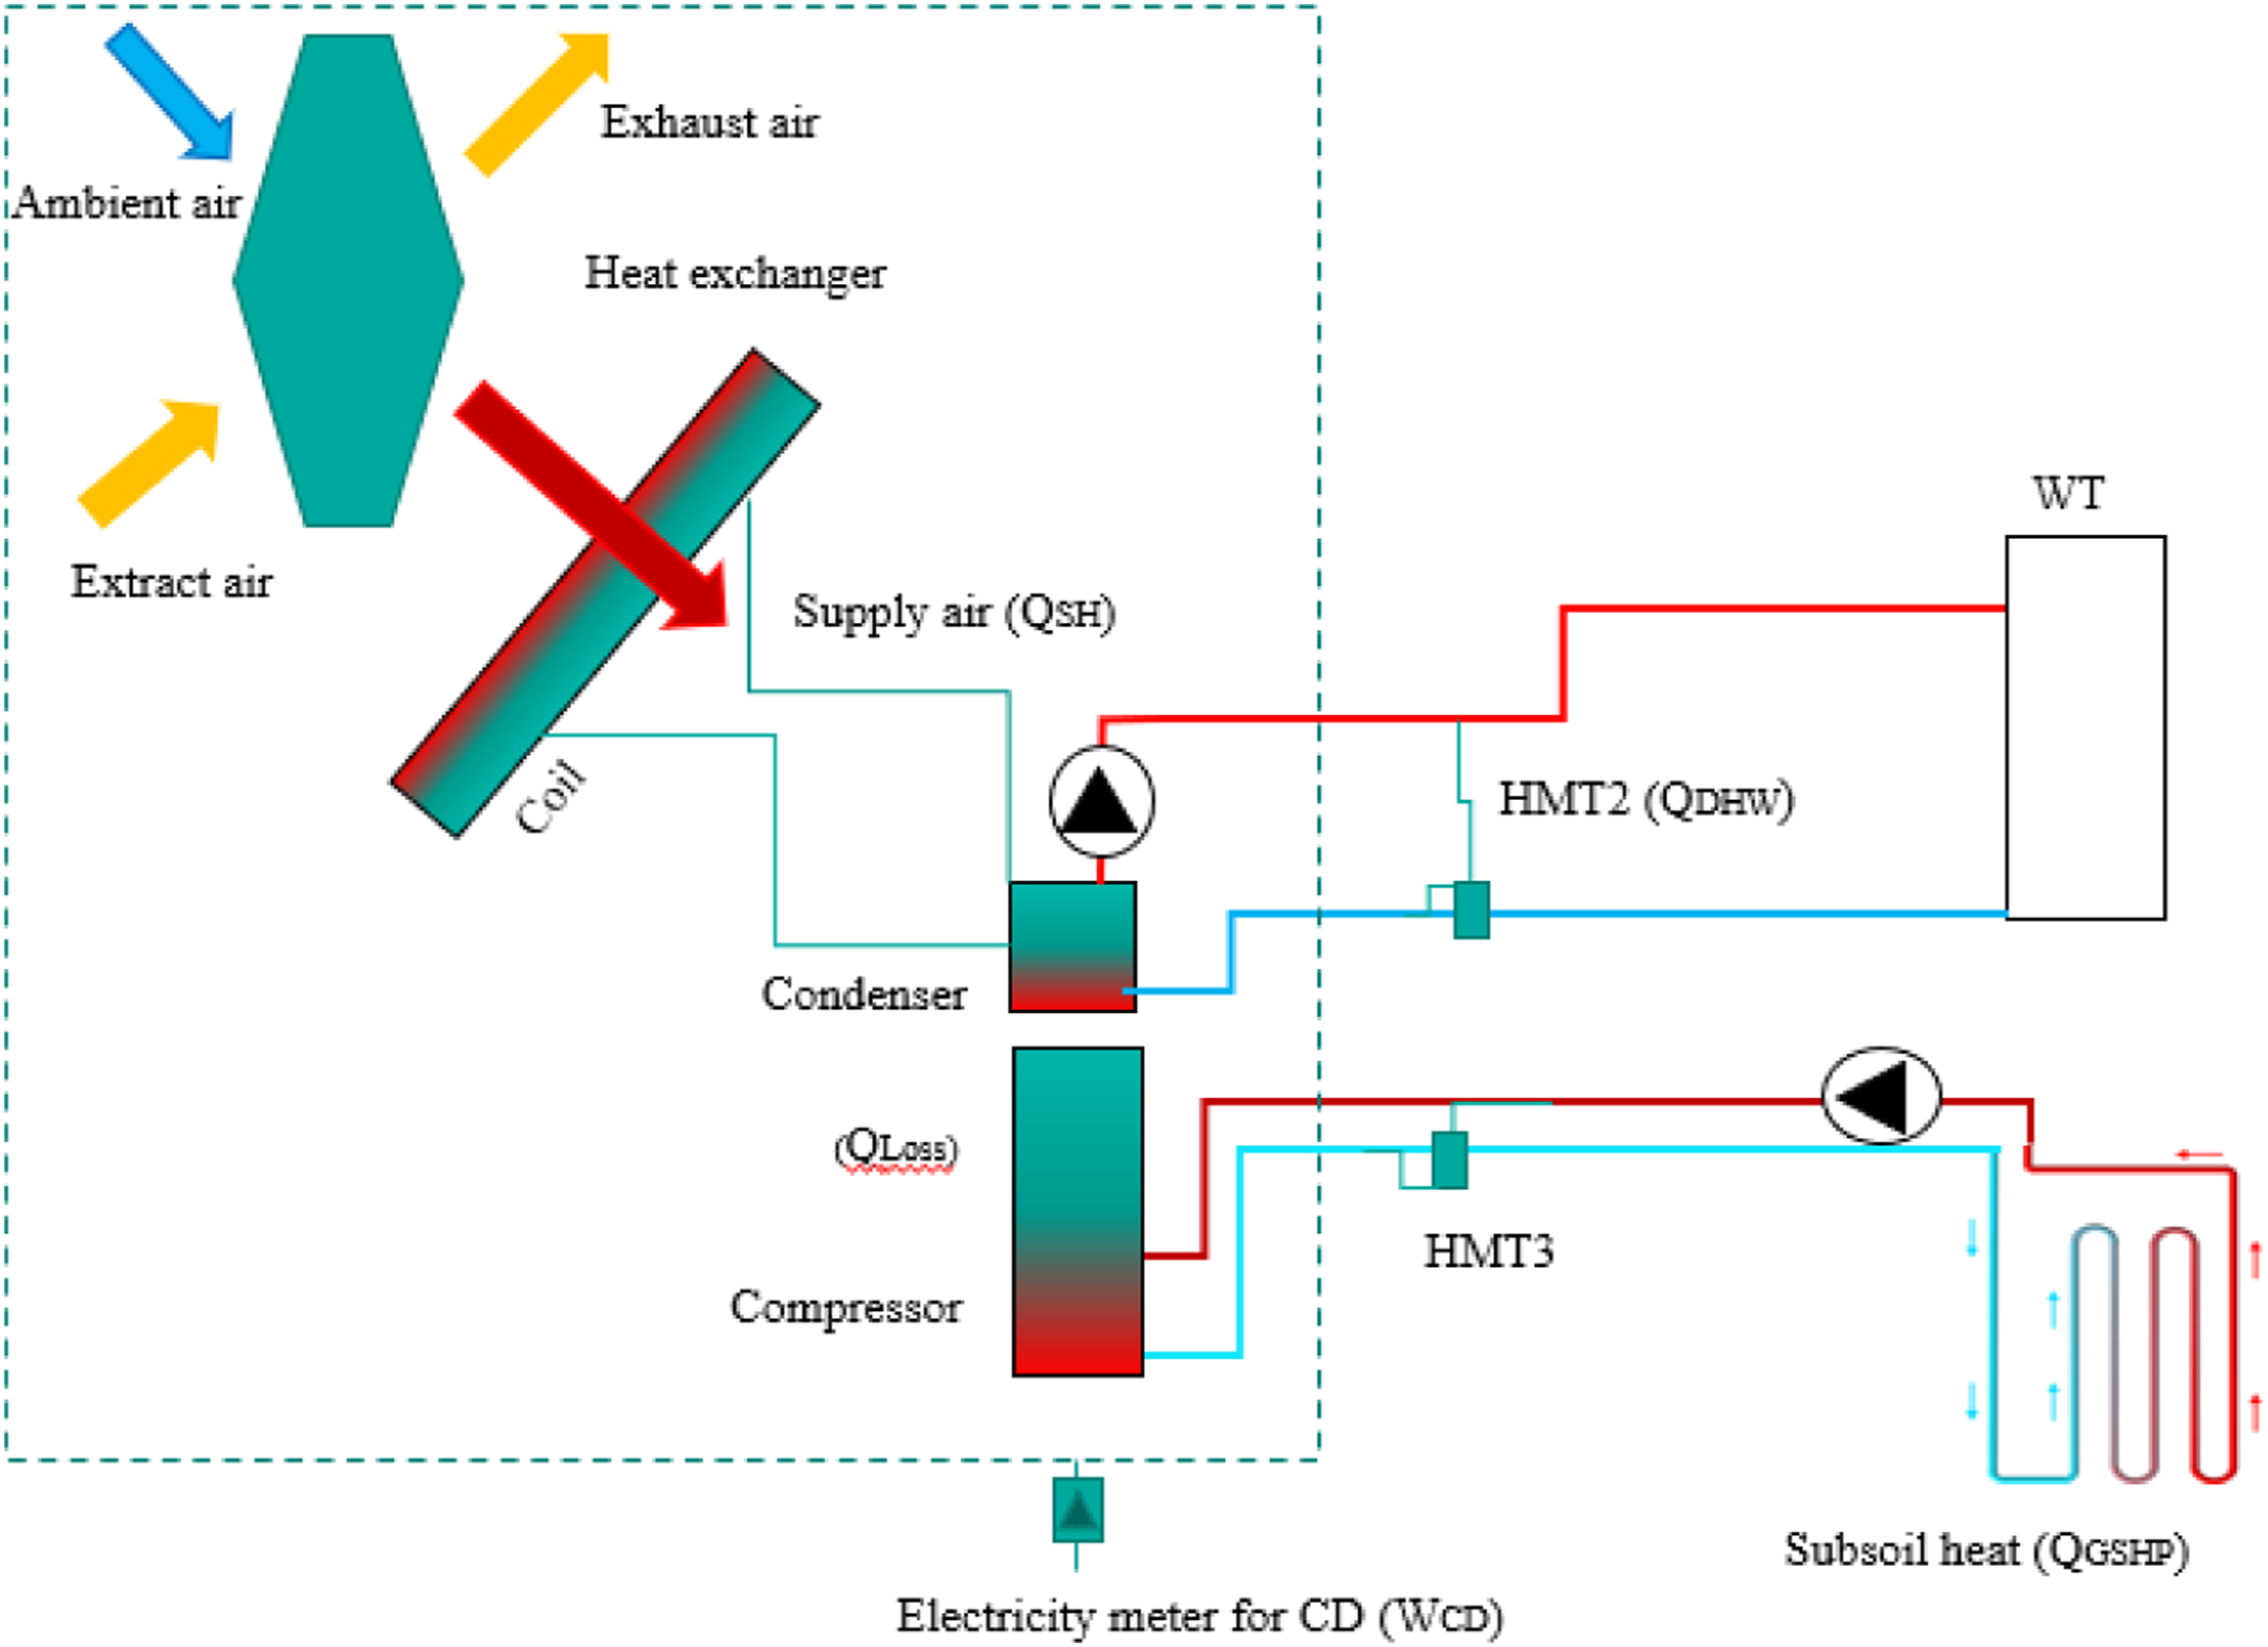
Schematic diagram of energy balance in a CD.
Each apartment has 5 SHT3x-DIS IEQ sensors, shown as orange dots in Figure 4. The accuracy of the main sensor is ± 0.3 K of temperature and ±2% of relative humidity. The heat meters have a relative uncertainty of 2% for volume flow measurements, and the electricity meters selected have a 1% relative uncertainty. If the main sensor fails during measurement, the average value of the other four sensors will be used as the IEQ of the apartment.
A weather station was installed on a neighbouring building’s roof to obtain outdoor climate information, including temperature, relative humidity and solar radiation. Each apartment has a data collector that can communicate with the building energy management system (BEMS) through fieldbuses to transmit IEQ data.
From Figure 5, the CD input energy includes subsoil heat (marked as QGSHP) and electricity (WCD). The energy generated by the CD is divided into three main parts: the first part heats the DHW (marked as QDHW) to ensure that the household has hot water for bathing and washing. The second part heats the supply air (marked as QSH) that comes out from the heat exchanger for the space heating. The last part is distributed to the apartment by the CD itself as heat loss (marked as QLoss); however, the proportion of this part, including conversion loss, distribution loss and storage loss, is very low and difficult to measure. From another perspective, the heat losses are within the envelope and indirectly heat the apartment, so they can be considered negligible.
According to the law of conservation of energy, the energy input on the left is equal to the energy output on the right, as in equation (1):
From equation (1) above, the SHD can be calculated via the three datasets (QGSHP, WCD and QDHW) derived from monitoring.
The trial monitoring and commissioning of the system were carried out in the winter of 2020–2021. At that time, the building’s occupancy rate was very low, only a few of the 36 apartments were occupied and the data deviation was large. Hence, the monitored data from 1st Nov. 2021 to 31st Mar. 2022 were used as the data for the case study. In addition, the measured SHD and IEQ were analyzed by this study according to the area-weighted average method.
Distribution of the monitored inhabited and heated apartments.
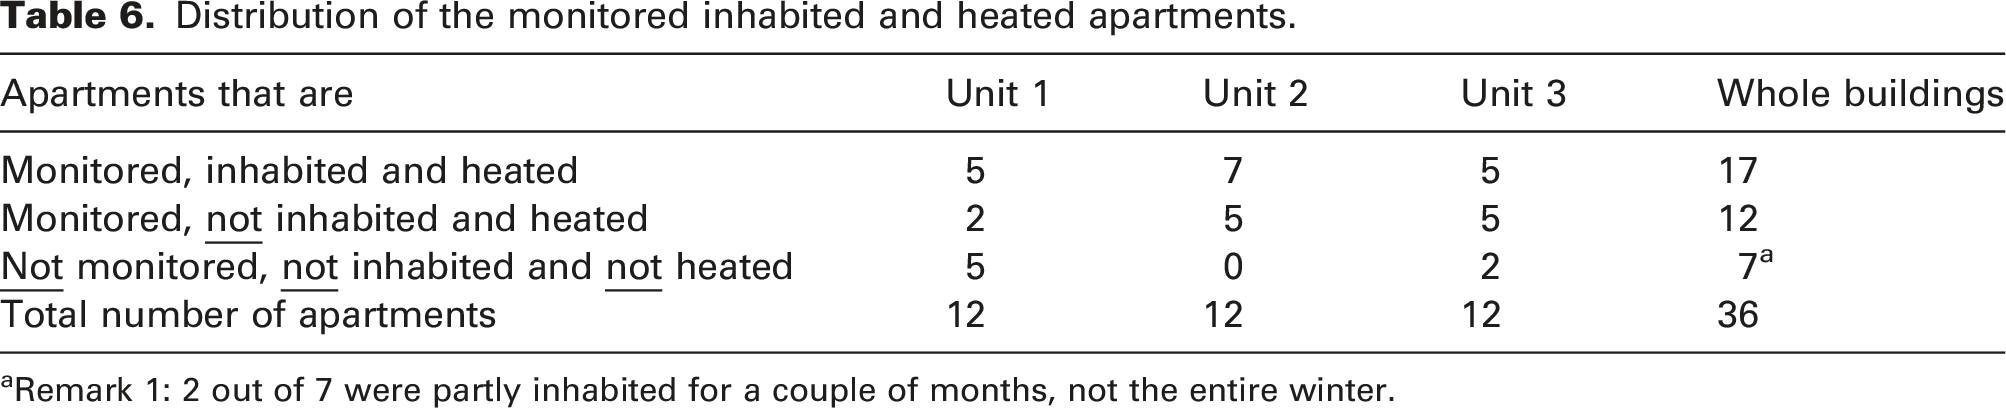
aRemark 1: 2 out of 7 were partly inhabited for a couple of months, not the entire winter.
Results
Space heating demand
The measured energy consumption for SHD of the 29 apartments in this PH building is shown in Figure 6. The treated floor area (TFA) of these 29 apartments was 3202.8 m2, and the average SHD accounted for 28 kWh/(m2·a). However, 12 of the 29 apartments were not occupied but heated, and 7 empty apartments have influenced the rest. The space heating demand of 29 apartments in the winter.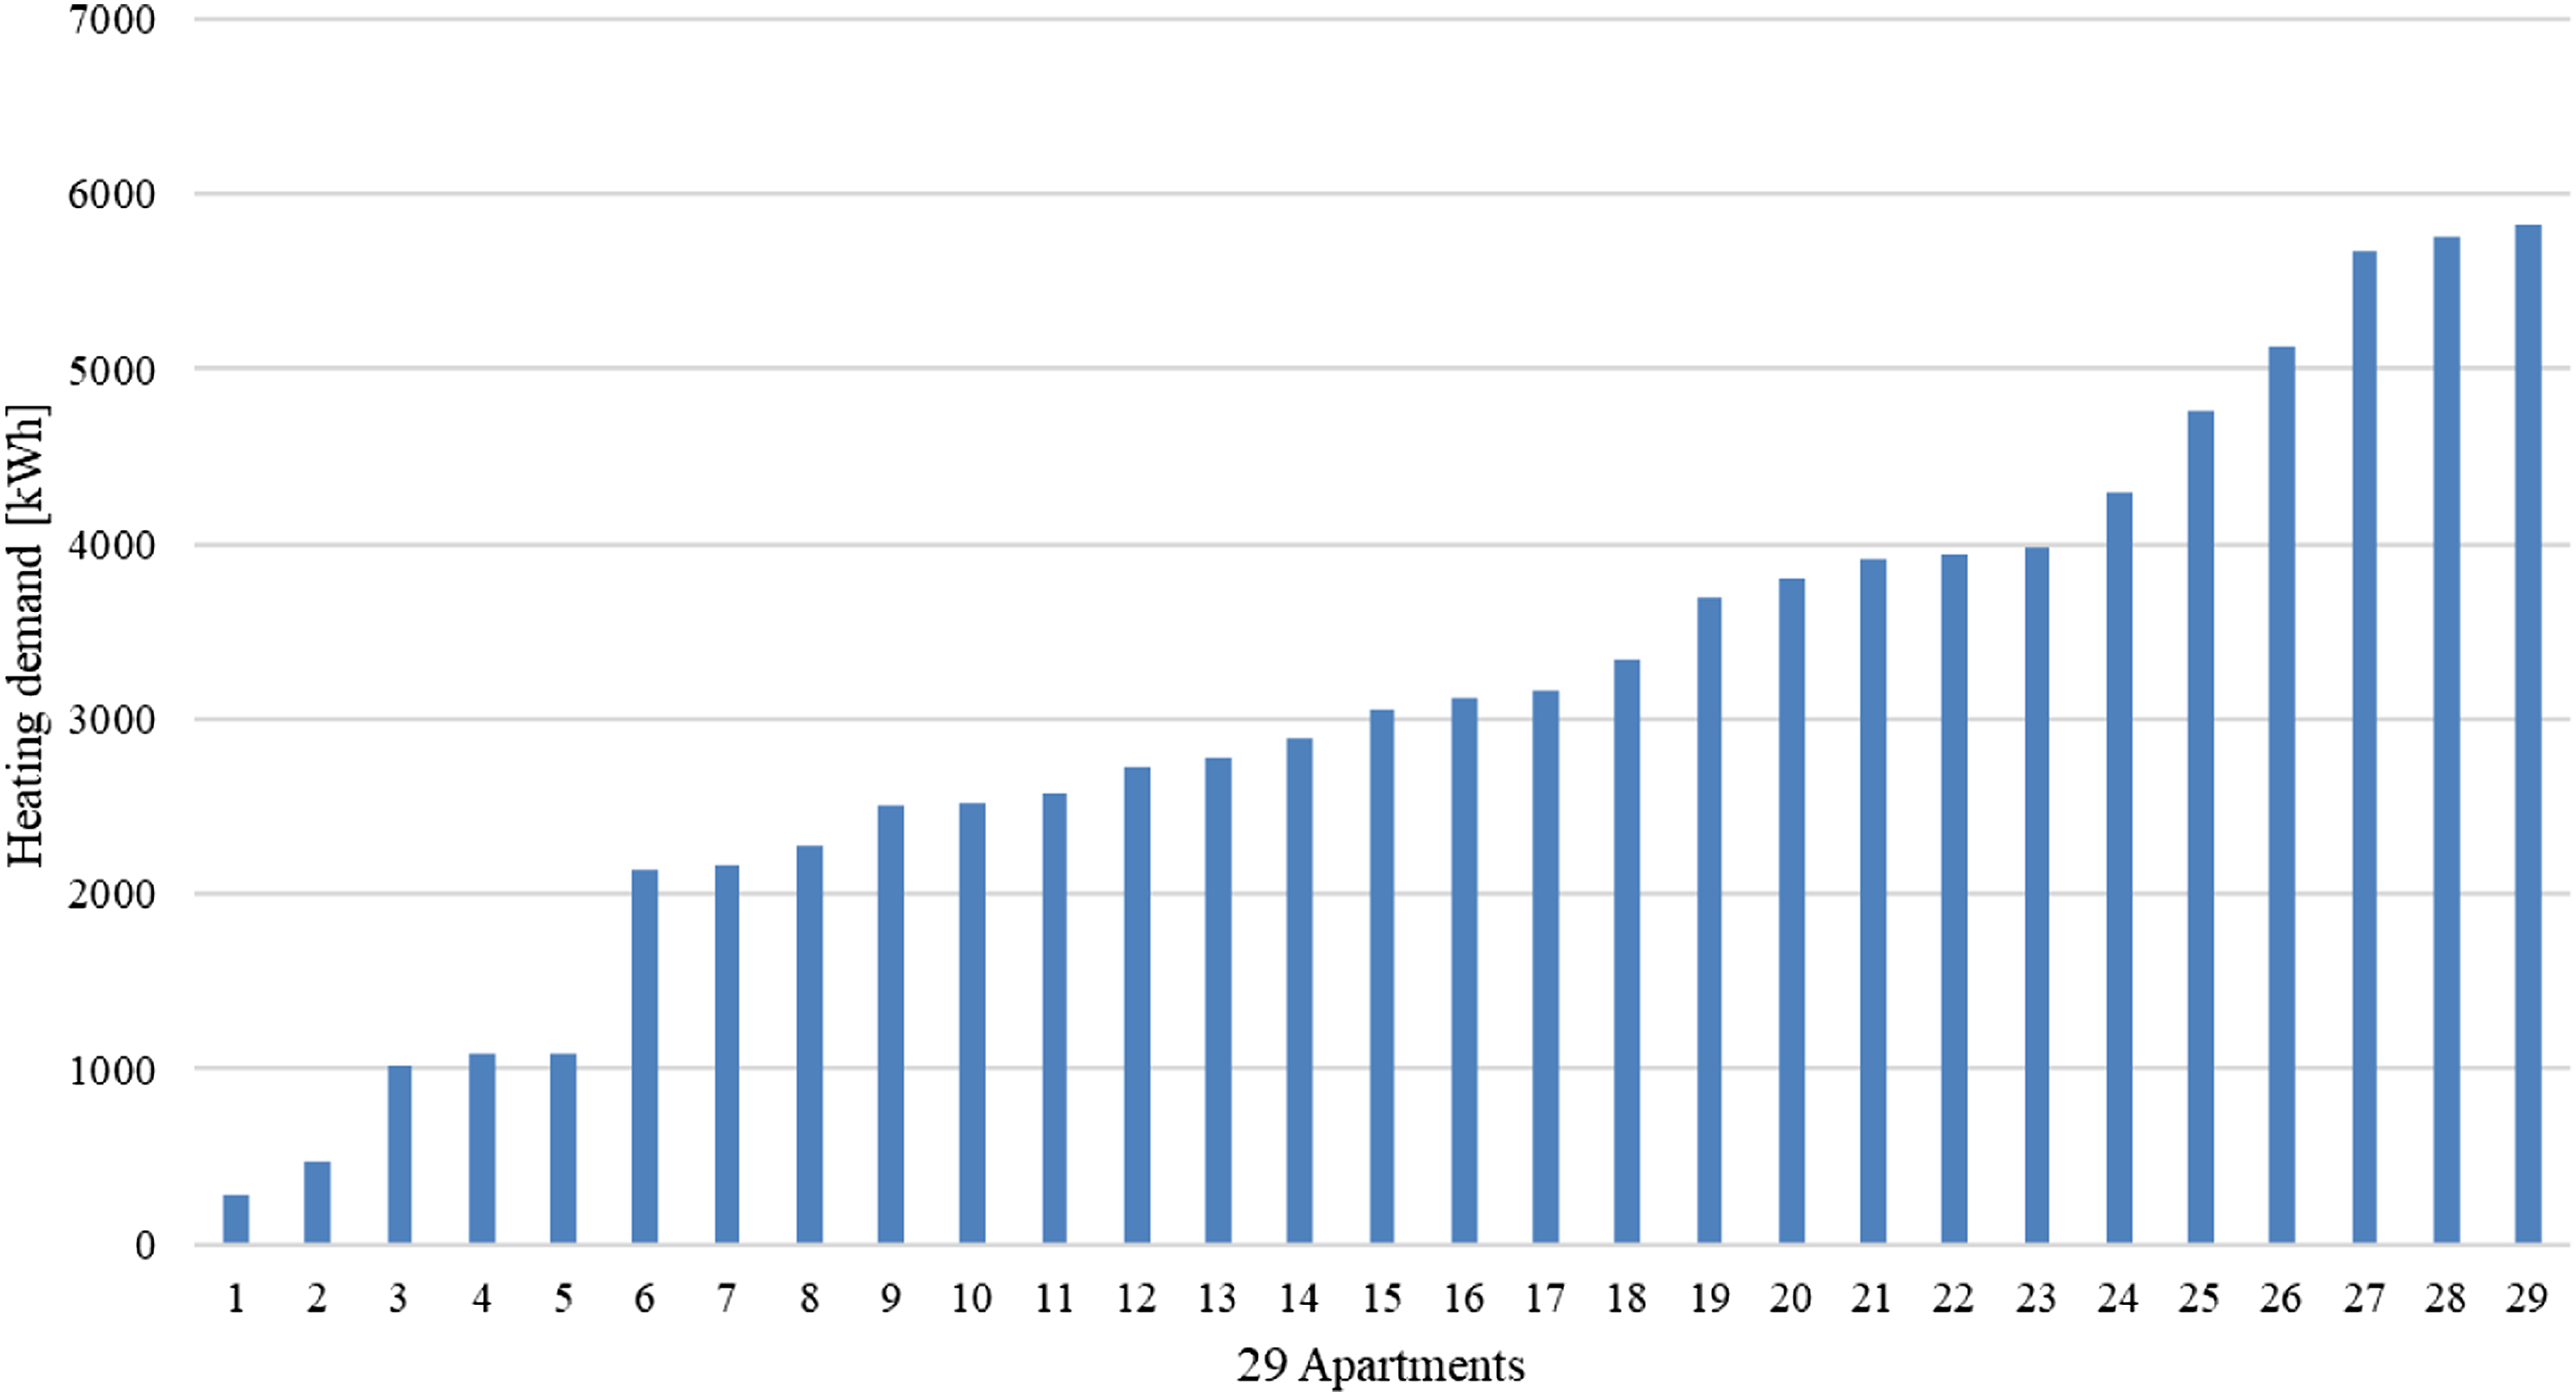
As previously stated, this building has a total of 36 apartments, which are evenly distributed into 3 units. The middle unit, ‘unit 2’, includes 12 apartments, of which 7 apartments are occupied and 5 apartments are unoccupied, but heated by CDs after obtaining the permission of the owners (see Table 6). So, this unit can be seen as a PH building with smaller dimensions, which has the same building envelope and HVAC system as the monitored PH building. The energy consumption for monthly SHD in unit 2 is shown in Figure 7. The average SHD accounts for 19.7 kWh/(m2·a) based on the TFA that includes the staircase as in PH design, which is 4.7 kWh/(m2·a) more than 15 kWh/(m2·a) of the PH standard. The ‘small PH building’ unit 2 has a better energy performance than the whole building. Monthly average space heating demand of unit 2.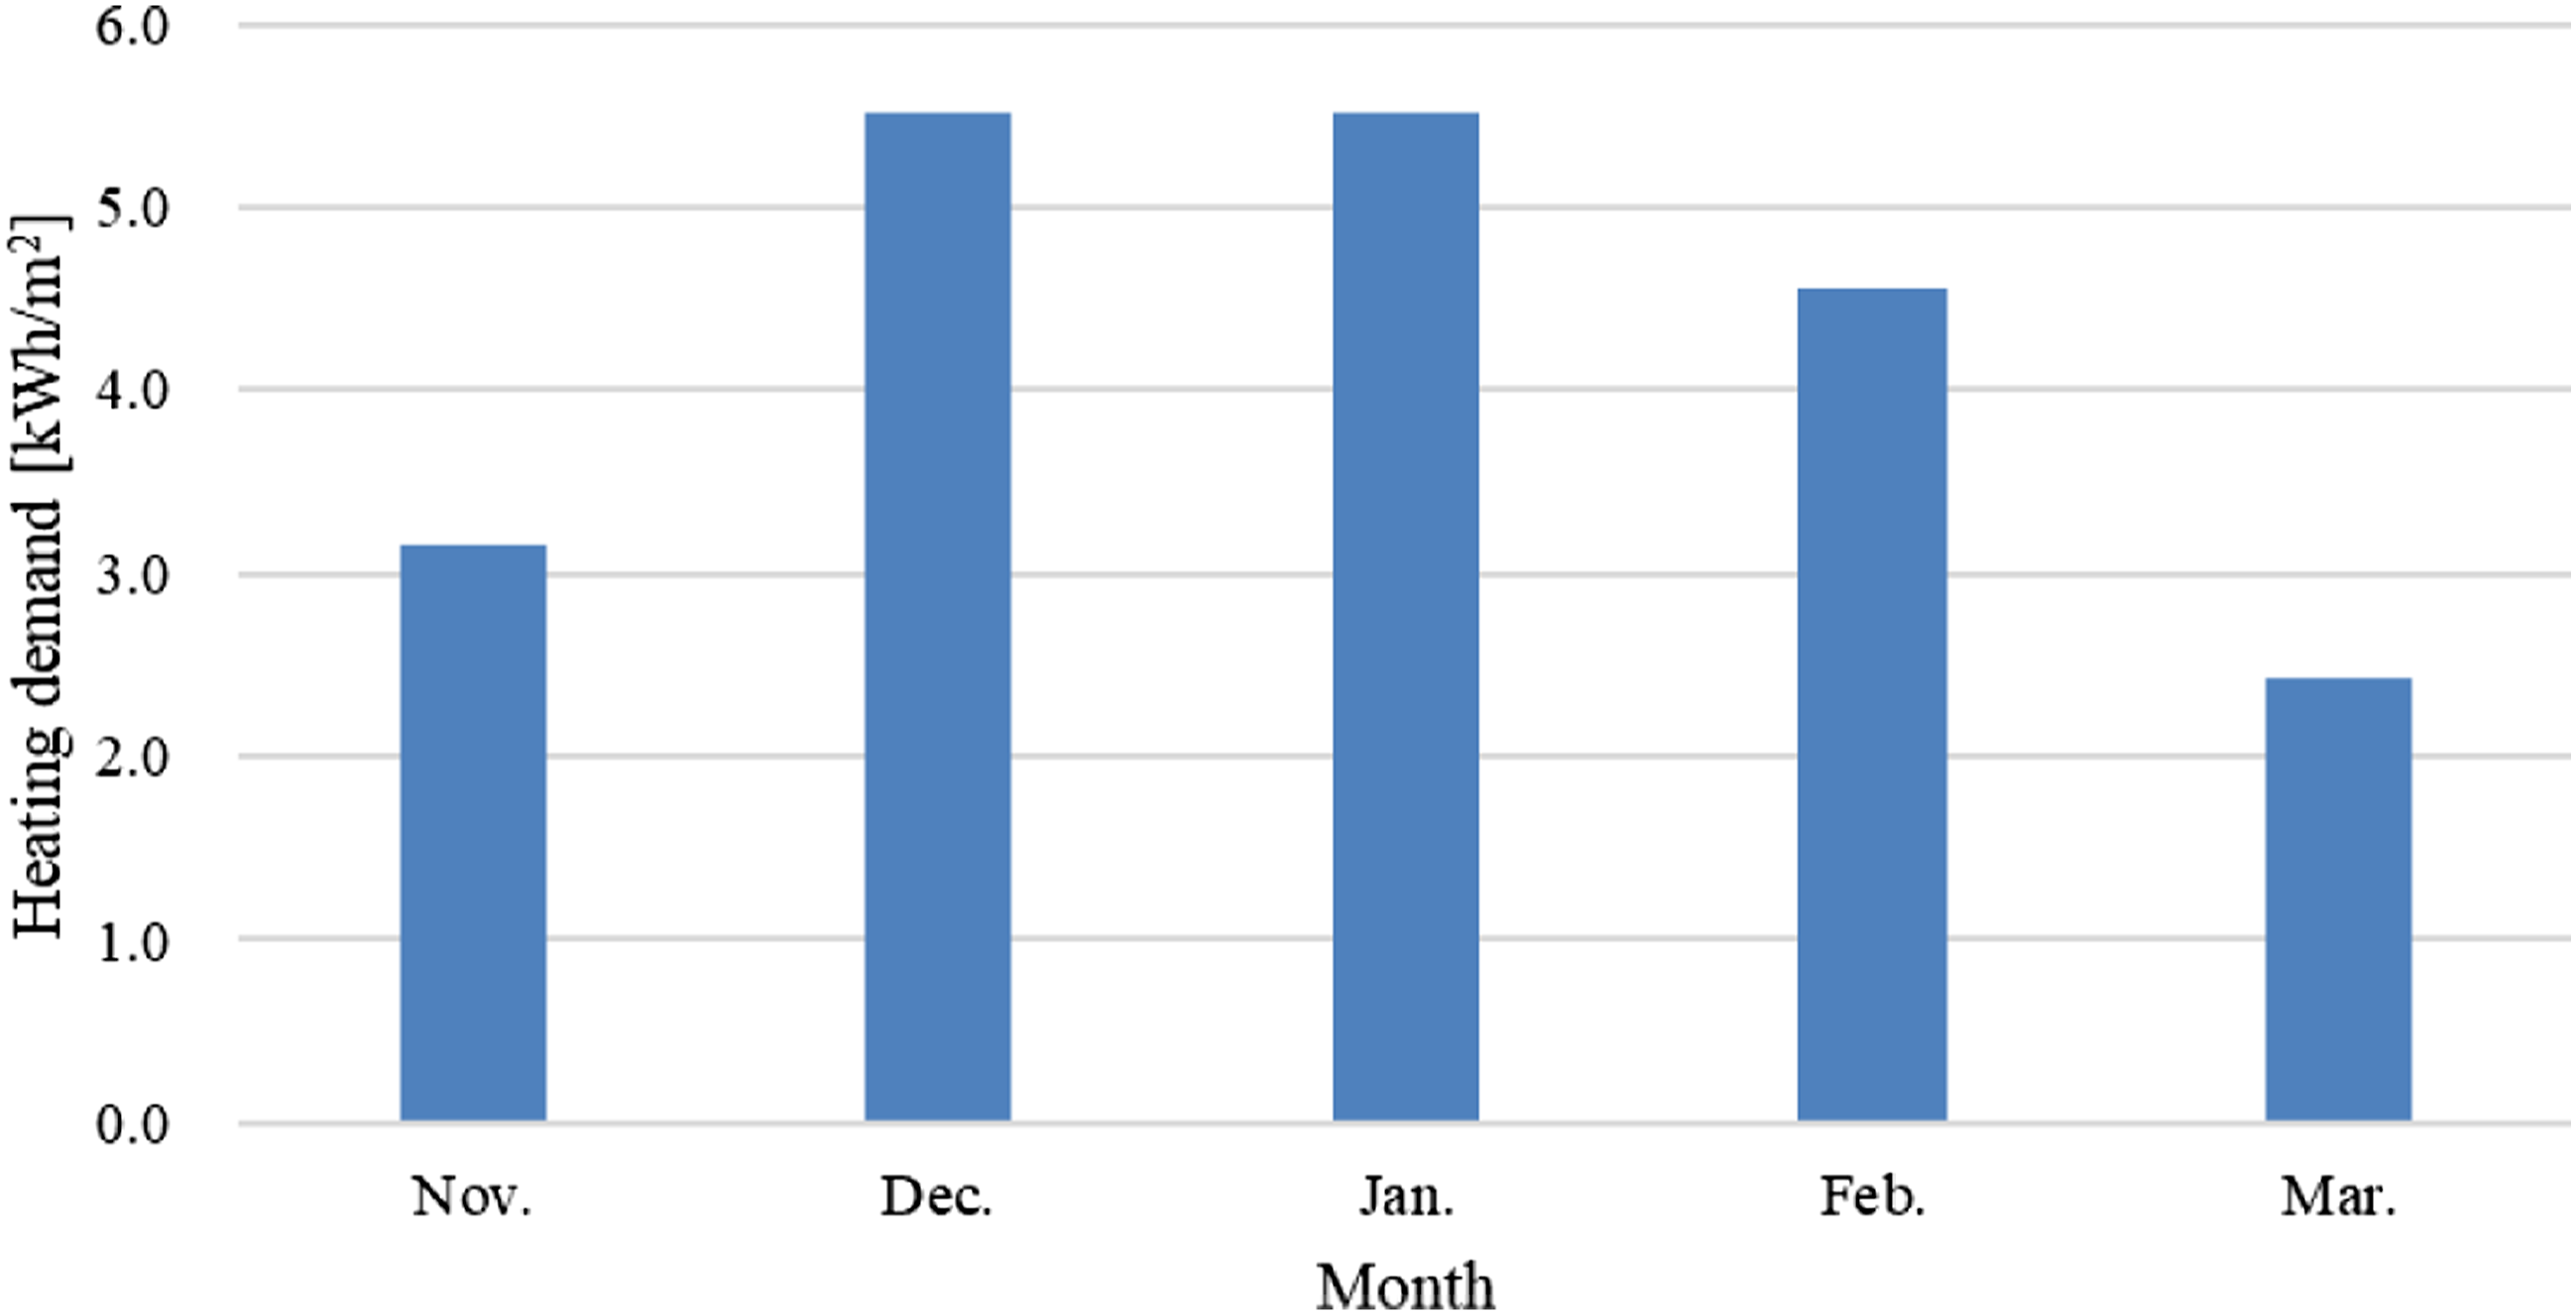
Monitored results of 10 apartments for 8 days.
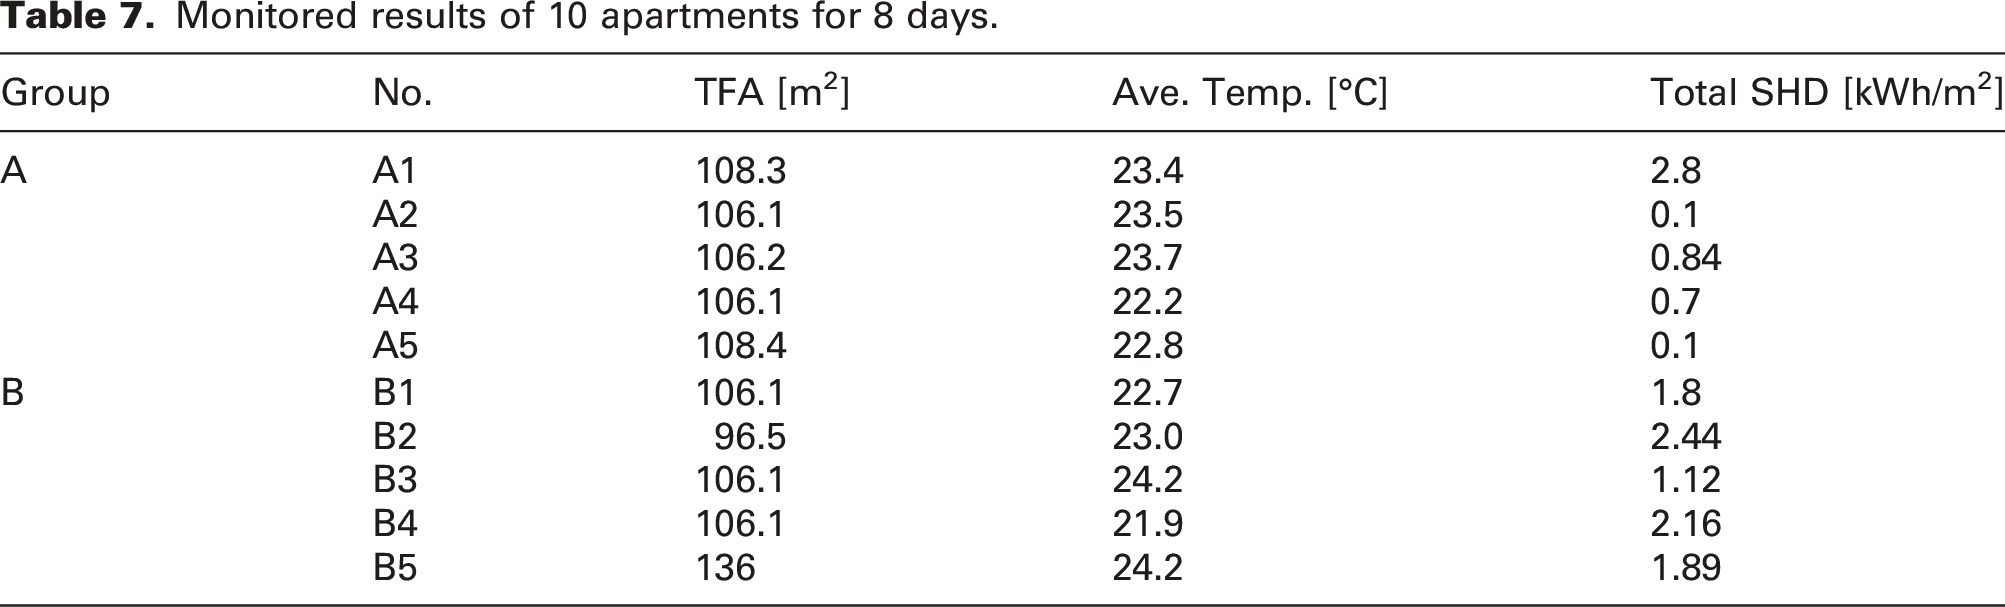
The results of the 8 days of data show that the average temperature of group A was 23.1°C, and the average SHD was 0.11 kWh/m2. The average temperature of group B was 23.3°C, and the average SHD was 0.23 kWh/m2. So, the SHD of group A was 0.12 kWh/m2 less than that of group B, and the temperature of group B was 0.2°C higher than that of group A. If the temperature difference per degree brings 2 kWh/m2 of additional energy consumption,
34
after adjustment, the result is approximately equal to 2.9 W/m2 when the values are input in equation (2). Thus, 2.9 W/m2 is the average IHG (QIHG) of group A.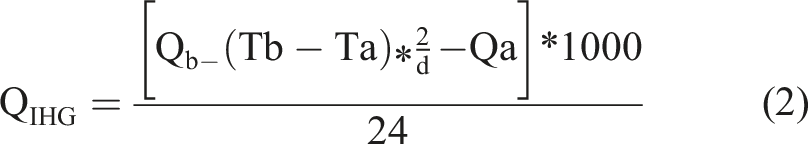
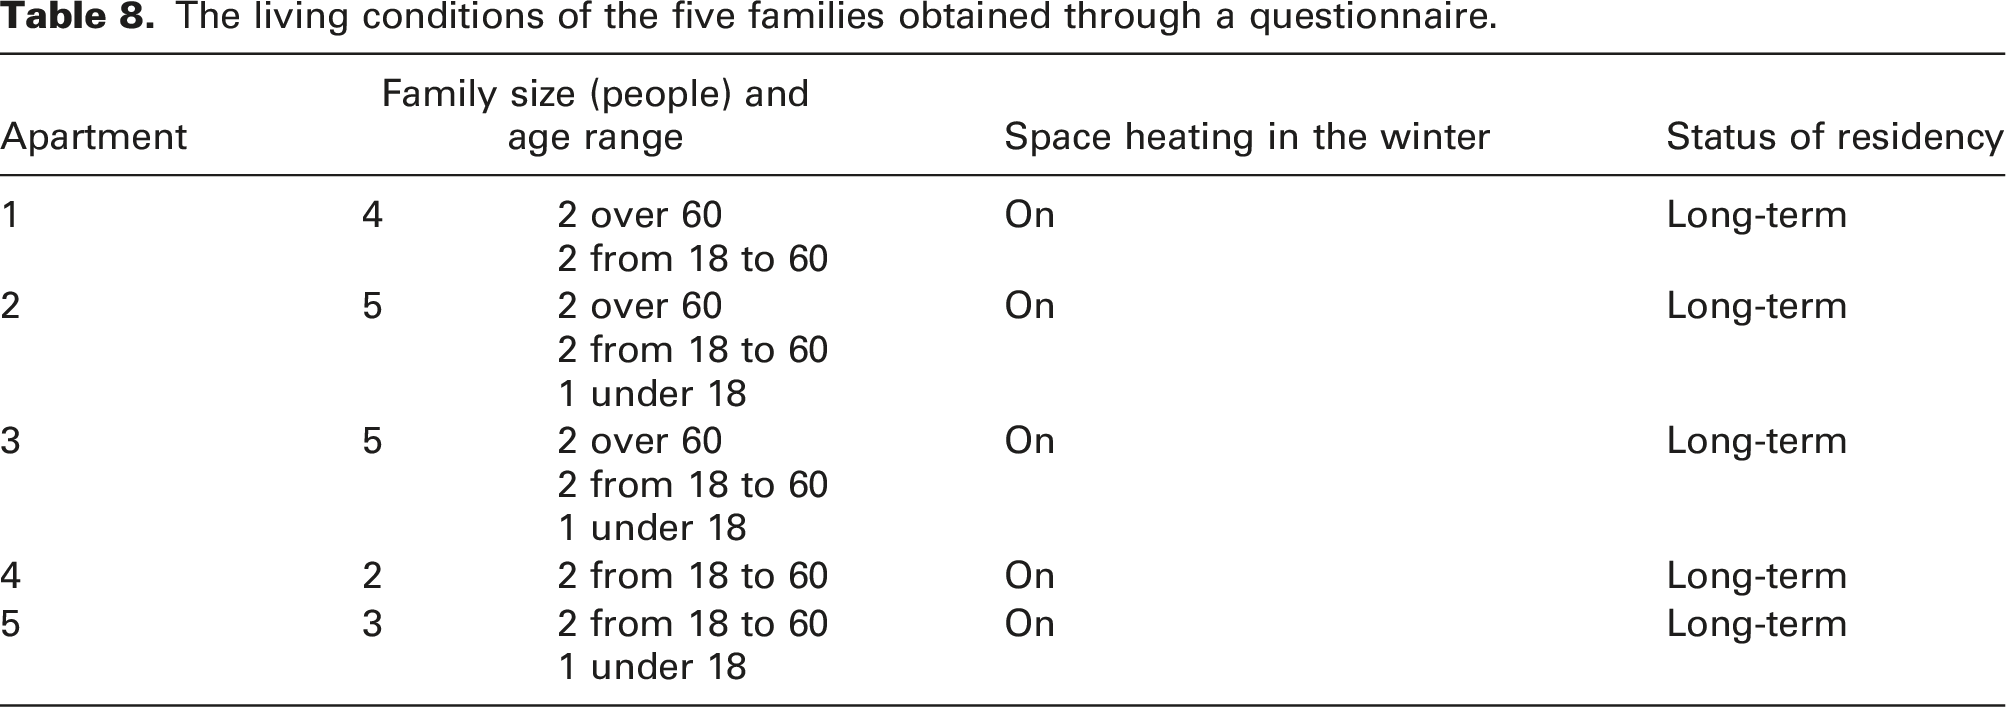
The living conditions of the five families obtained through a questionnaire.
From the monitored data in the winter, the average electricity consumption of the 17 apartments that were inhabited was 24.7 kWh/m2, and the average electricity consumption of the 12 apartments that were not occupied was 15.9 kWh/m2, which was 8.8 kWh/m2 less than the electricity consumption of the occupied apartments. This difference reflects the level of the electricity demand of households, aside from the electricity consumption of CD (see Figure 8). The average electricity consumption of 29 households, charts on the left for the 17 inhabited apartments and charts on the right for the non-inhabited 12 apartments.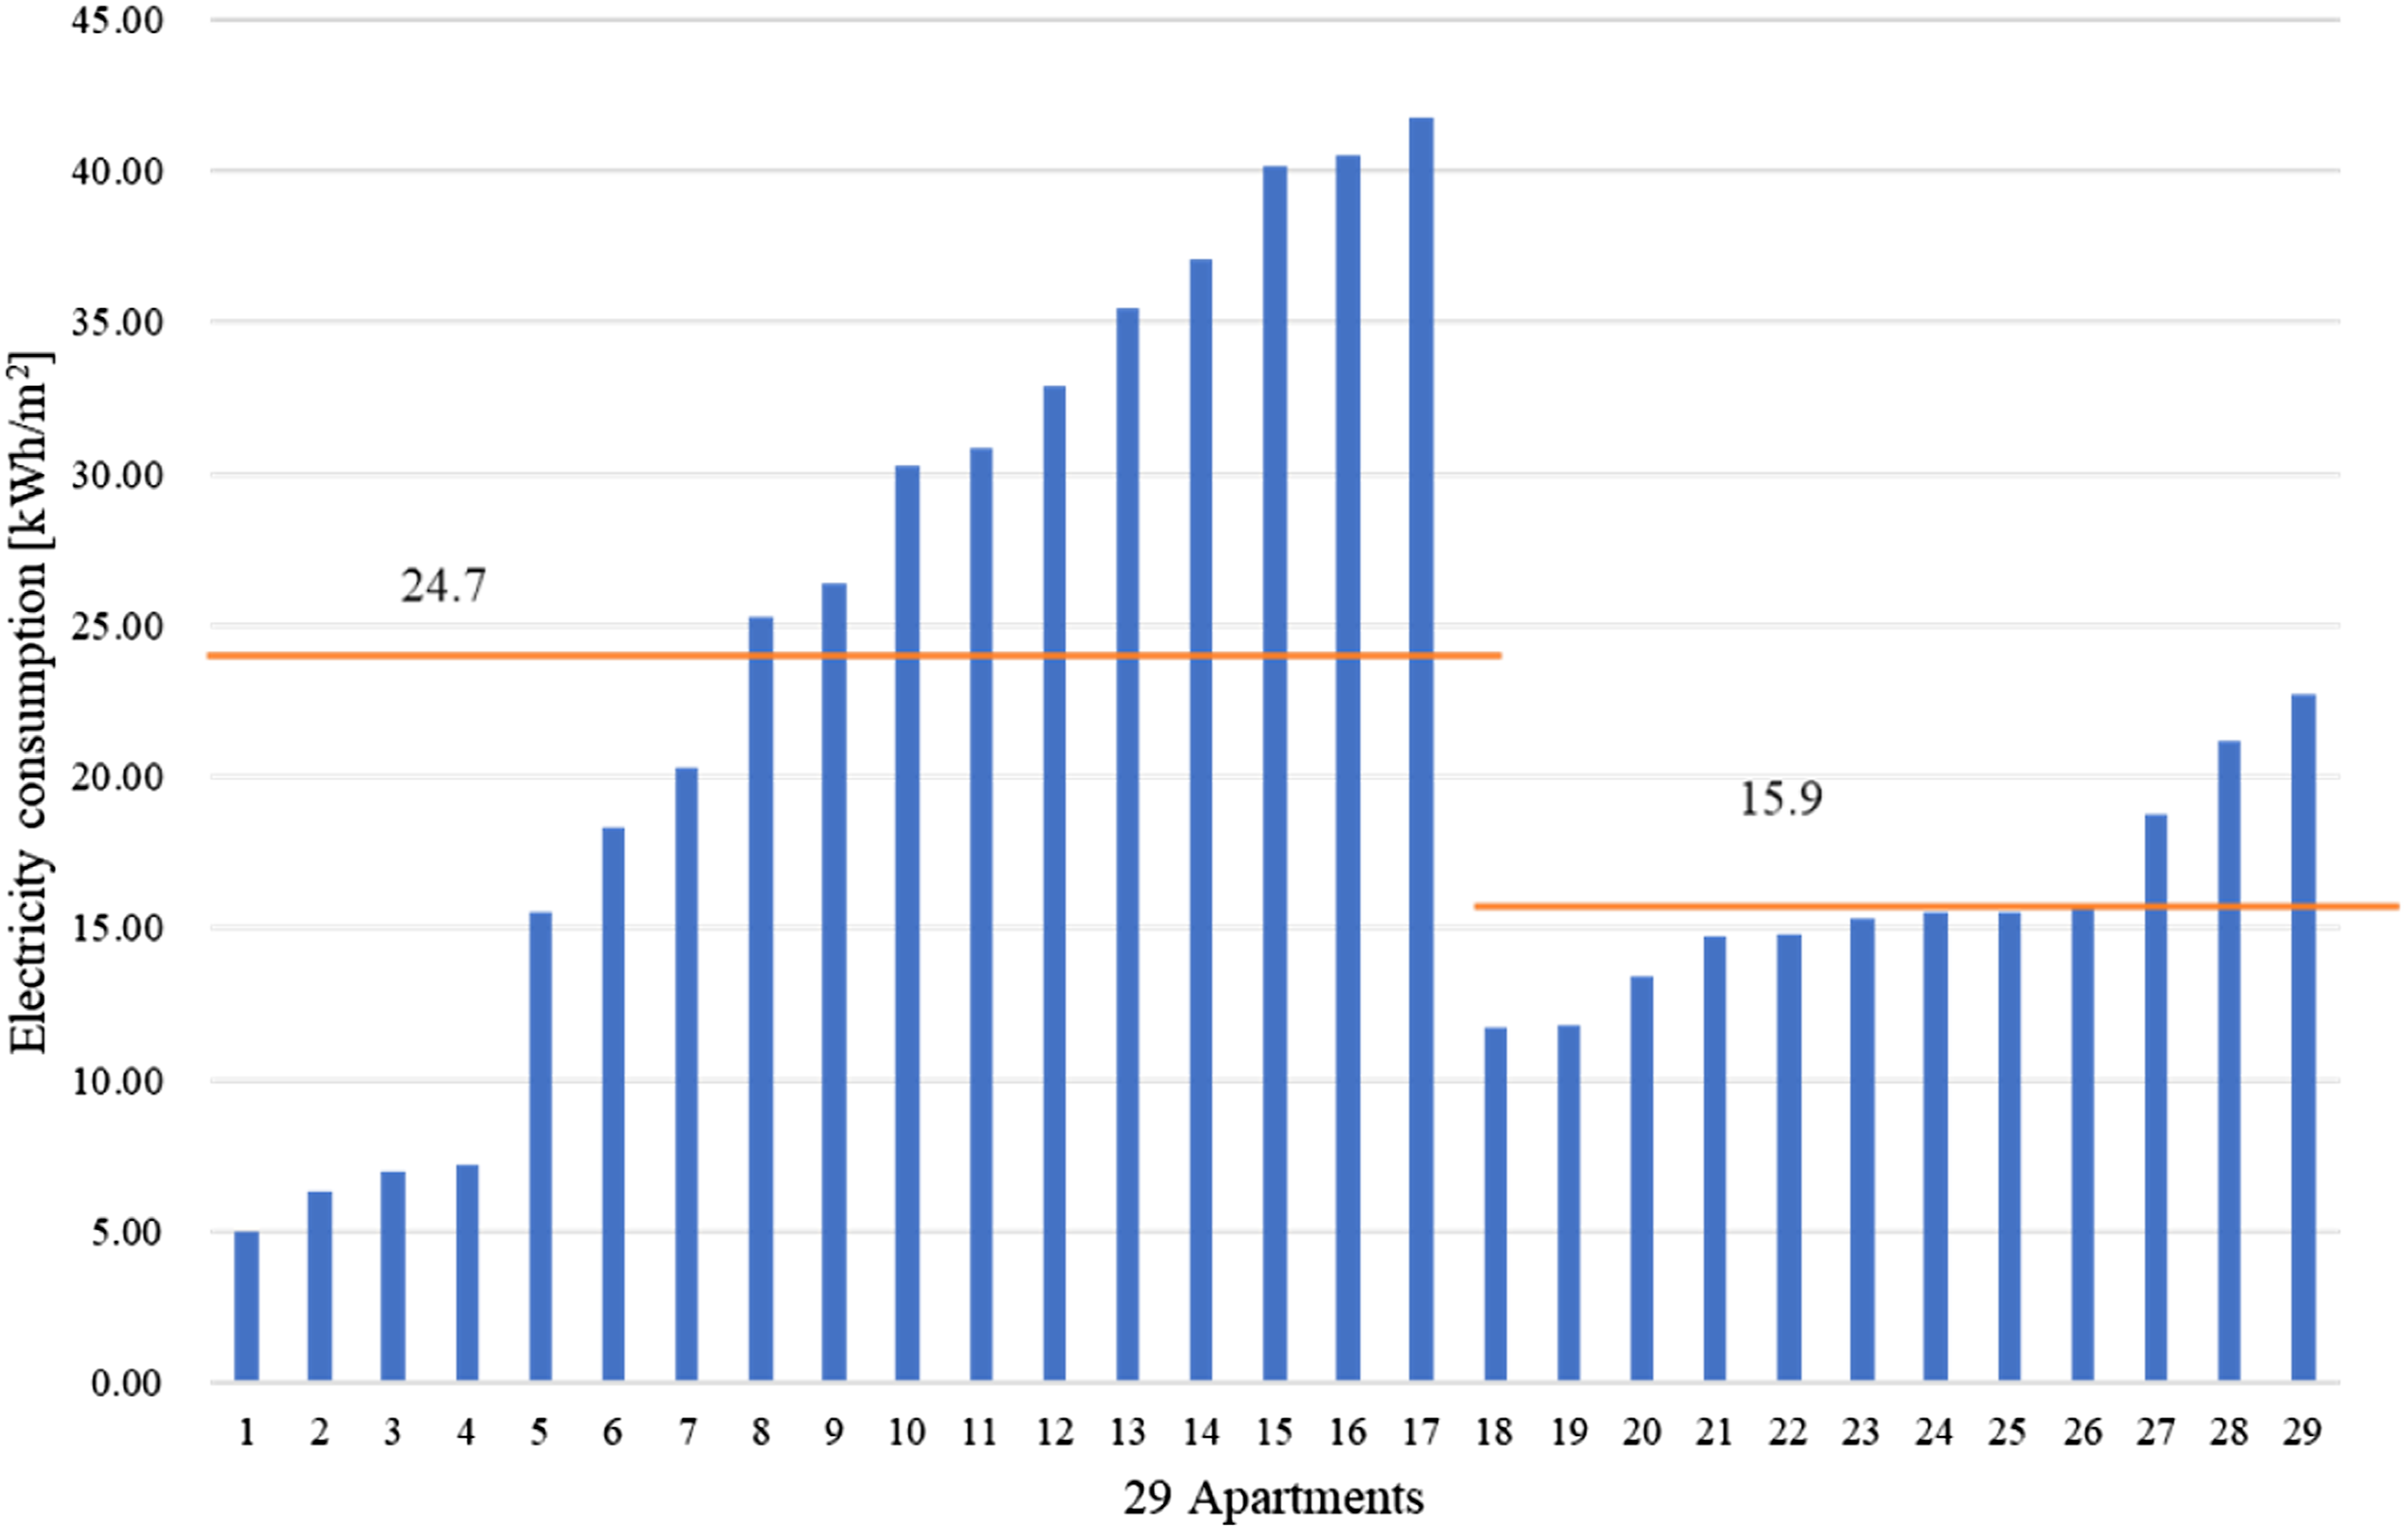
Indoor environment quality
The measured interior environment of PH building.
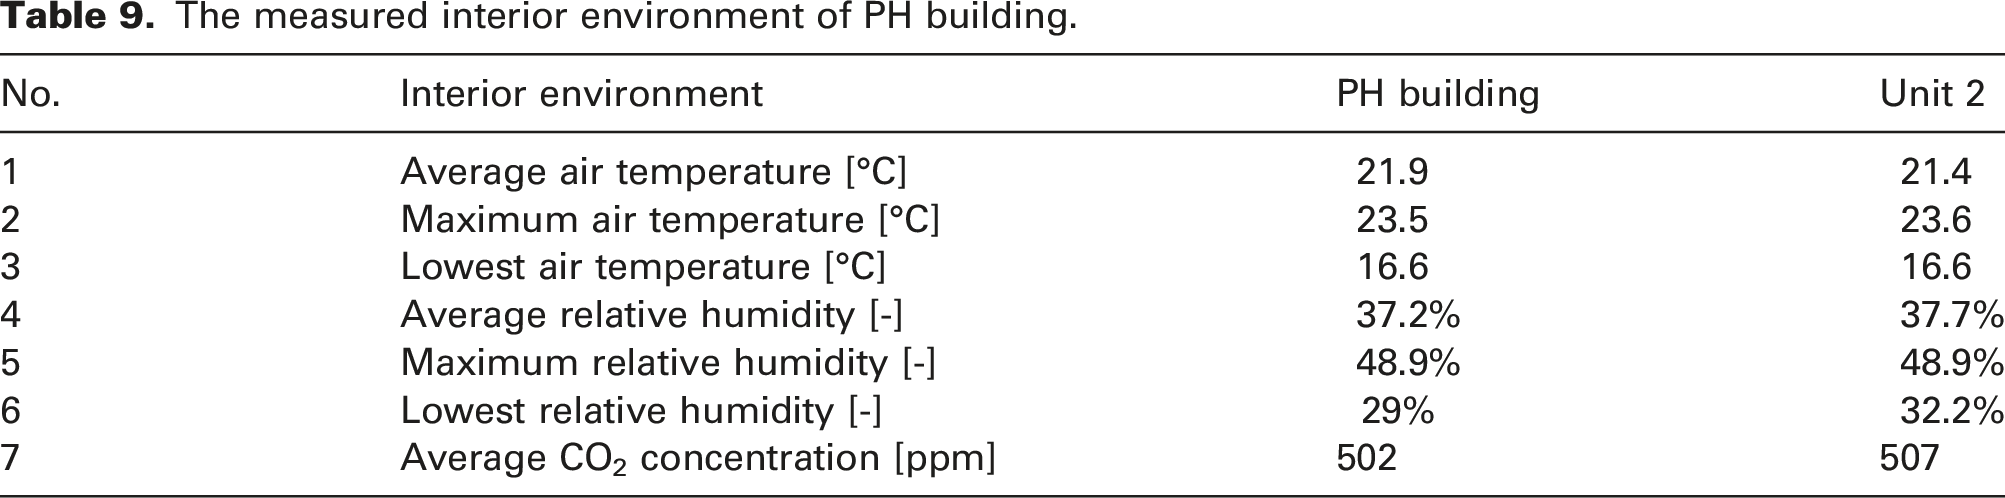
The interior environment of the 29 apartments in the winter: (a) the average indoor air temperature, (b) the average indoor relative humidity and (c) the cumulative distribution function (CDF) of the indoor CO2 concentration in 17 inhabited apartments.
In general, the indoor relative humidity during the winter varied from 30% to 60% and the indoor air temperature stayed in a comfortable zone in this PH building. However, compared with the IEQ in Table 9, the outdoor temperature and relative humidity show big fluctuations. The maximum outdoor temperature peaked at 17.2°C in November and the lowest was −6.1°C in December. The average outdoor temperature in the winter was 4.5°C. The outdoor relative humidity was from 28% to 95% and the average relative humidity was 63% in the winter. Figure 9(c) shows the cumulative distribution function (CDF) of the indoor CO2 concentration in 17 apartments. The CO2 concentration was mainly under 800 ppm and only above 1000 ppm 6% of the time.
Electricity, natural gas and domestic hot water consumption
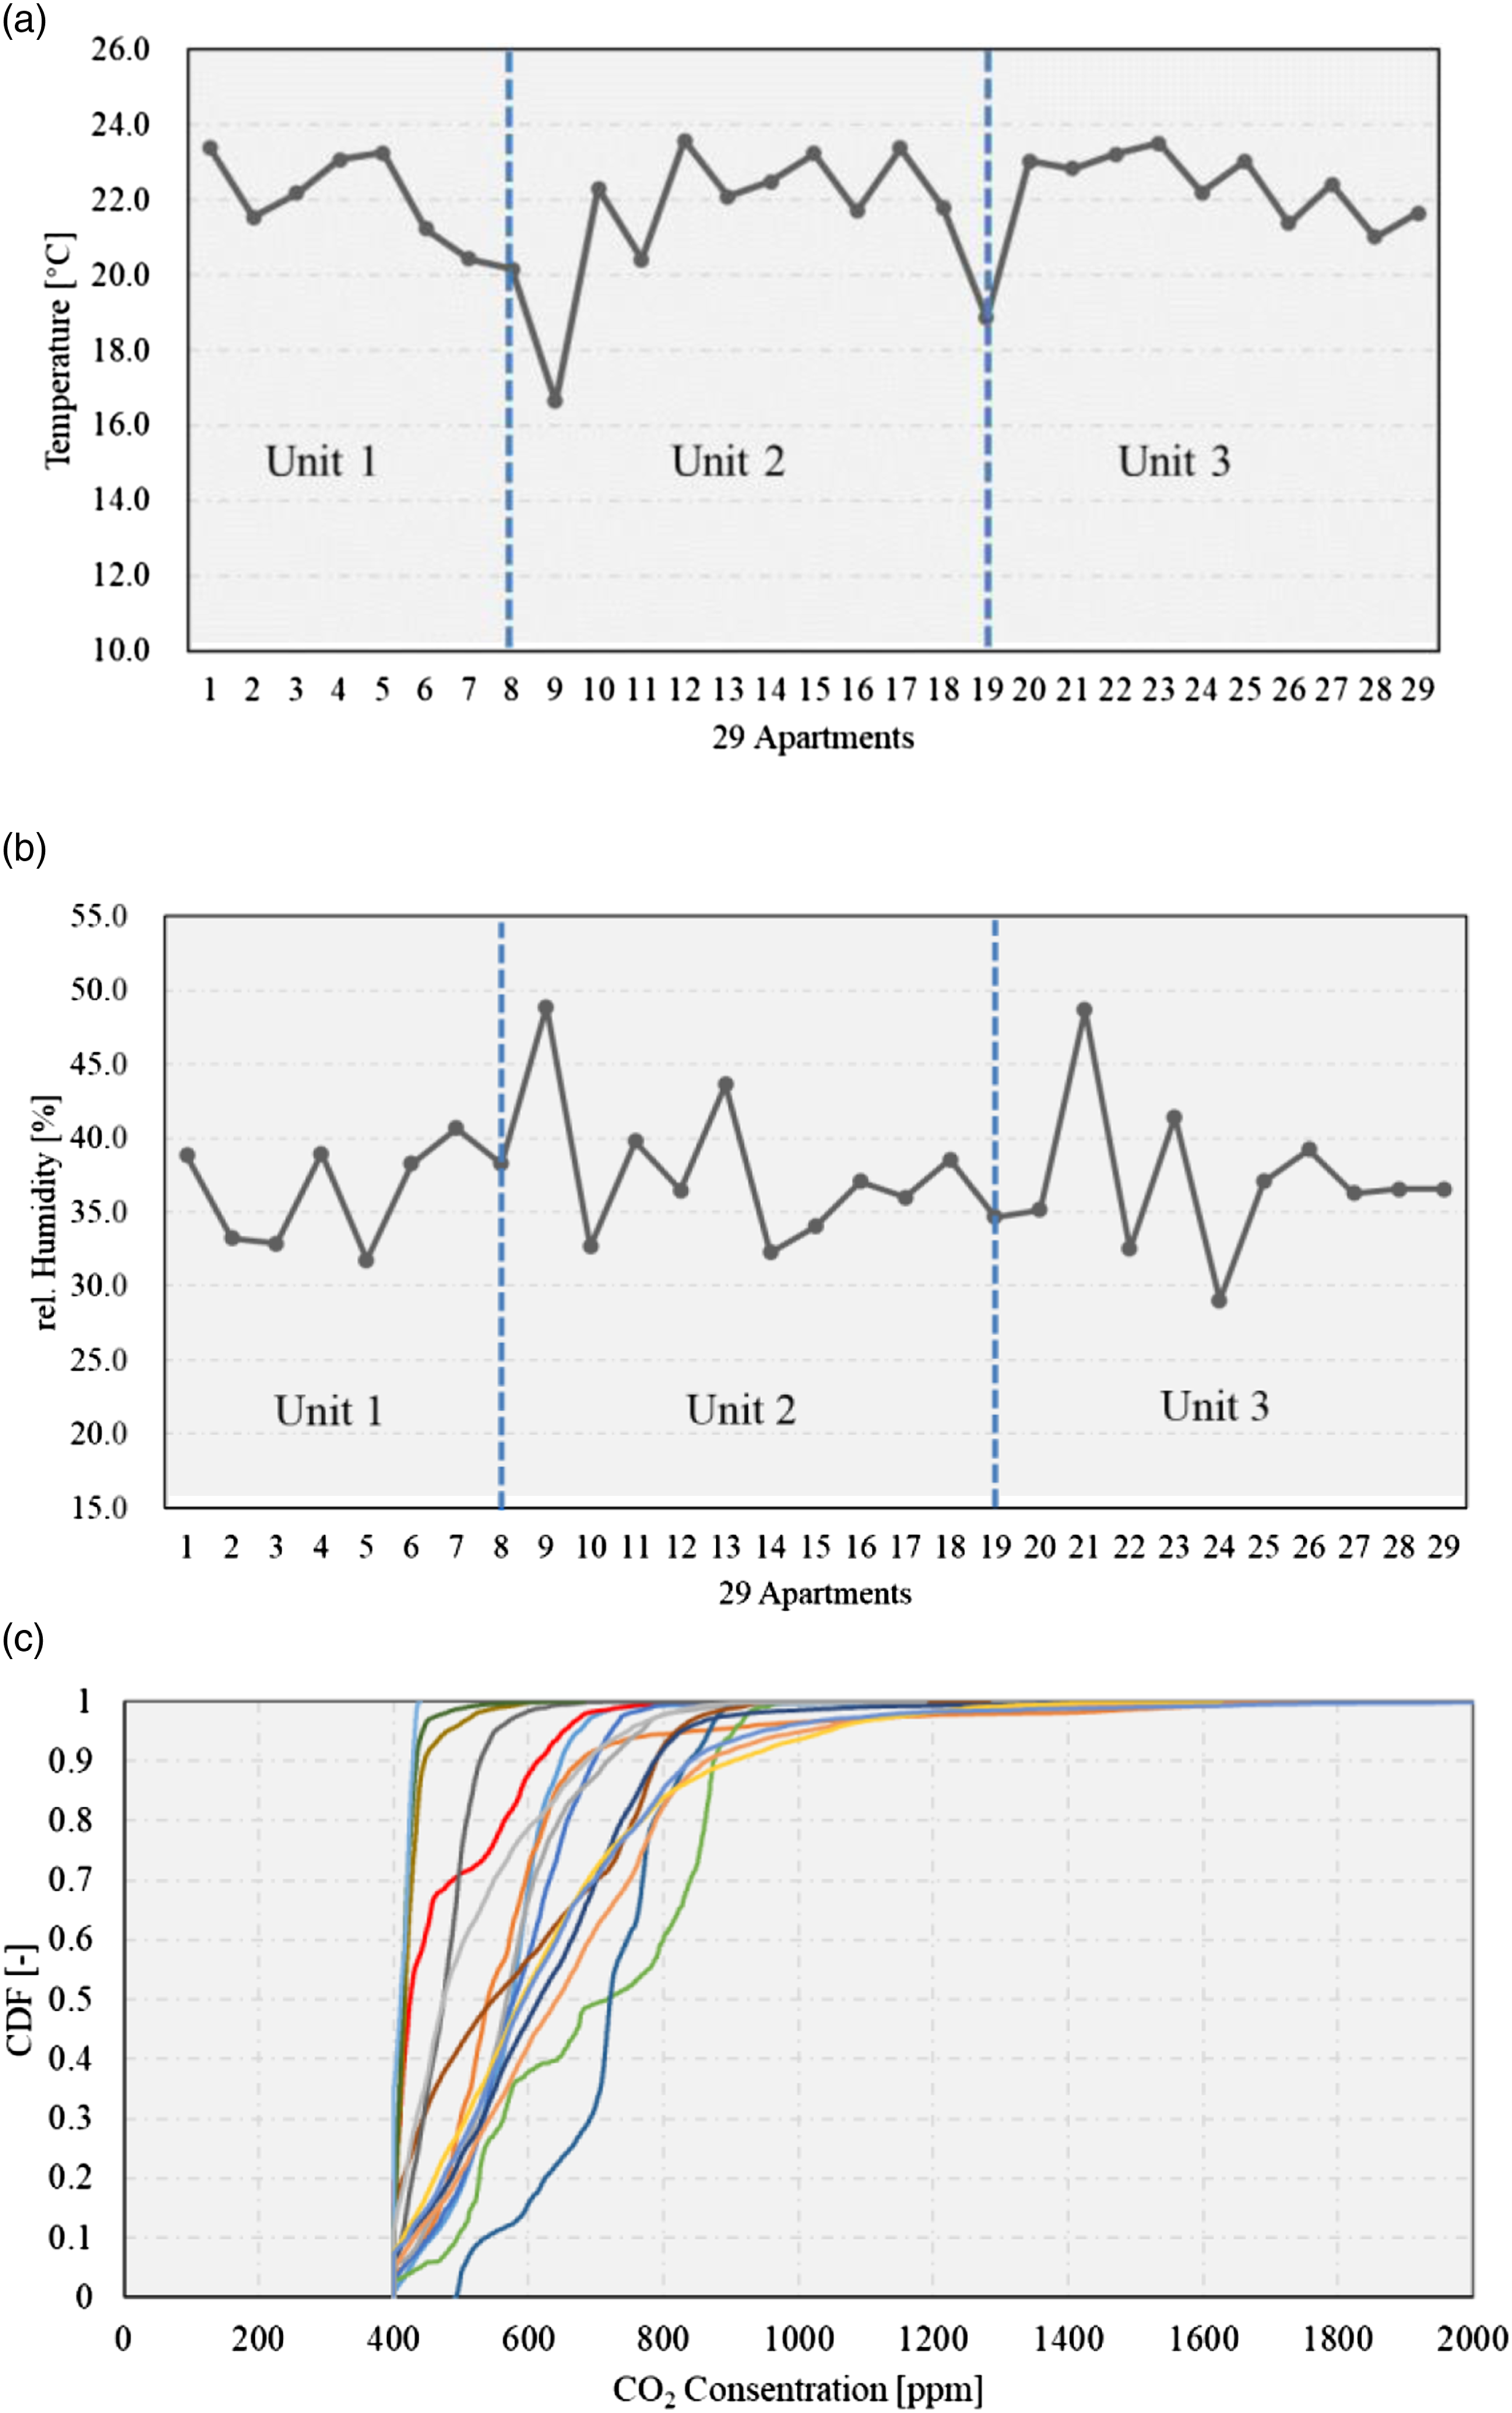
The electricity monitoring of this PH building was performed from April 2021 to March 2022, for a total of 1 year. The accumulative electricity consumption was 191,822 kWh, including 158,040 kWh for households, 4668 kWh for the lighting of public spaces like staircases, 6257 kWh for elevators and 22,857 kWh for water pumps in the service rooms, all of which are electricity input within the building envelope (see Figure 10). The results show the household electricity consumption (including CD electricity consumption) accounts for 82% of the total electricity consumption and other auxiliary electricity consumption totals 18%. The electricity consumption during transitional seasons and summer accounted for 39% of the whole year, and the 5 months in winter accounted for 61%. The total electricity consumption was 45.2 kWh/(m2·a) considering a TFA of 4244.4 m2 of this PH building, whereas the average electricity consumption of households (including CD electricity consumption) was 37.2 kWh/(m2·a) considering the same TFA. (a) Electricity consumption and distribution of the entire building in 1 year and (b) monthly electricity consumption and distribution. The dark blue is the electricity used by CDs, and the light blue is the electricity used by other things (lighting, sockets, appliances, etc.) in the apartments.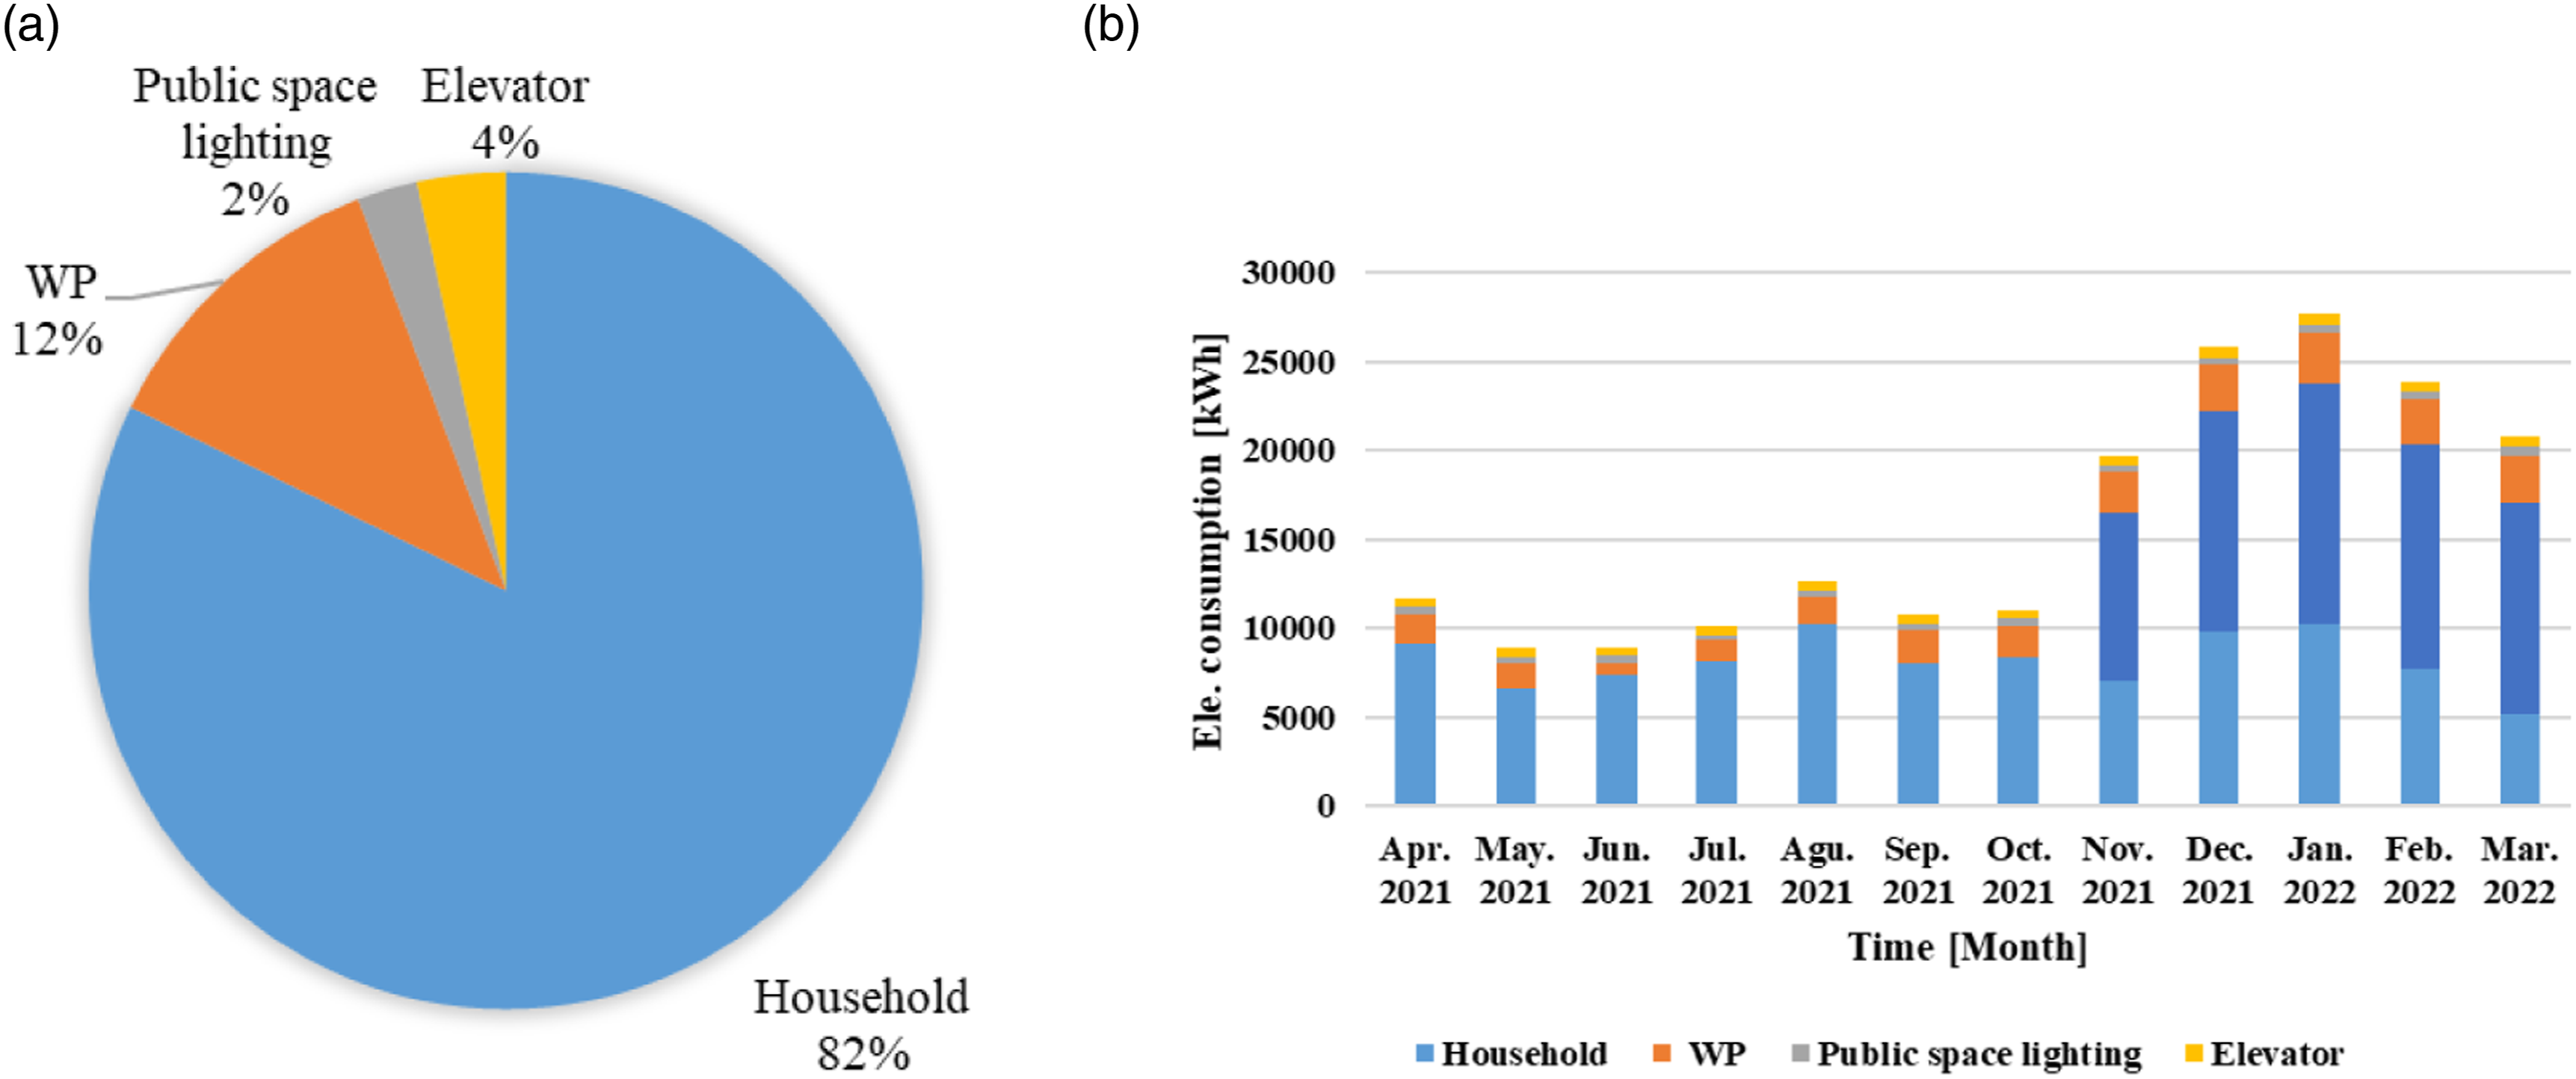
Components of electricity consumption in the winter.
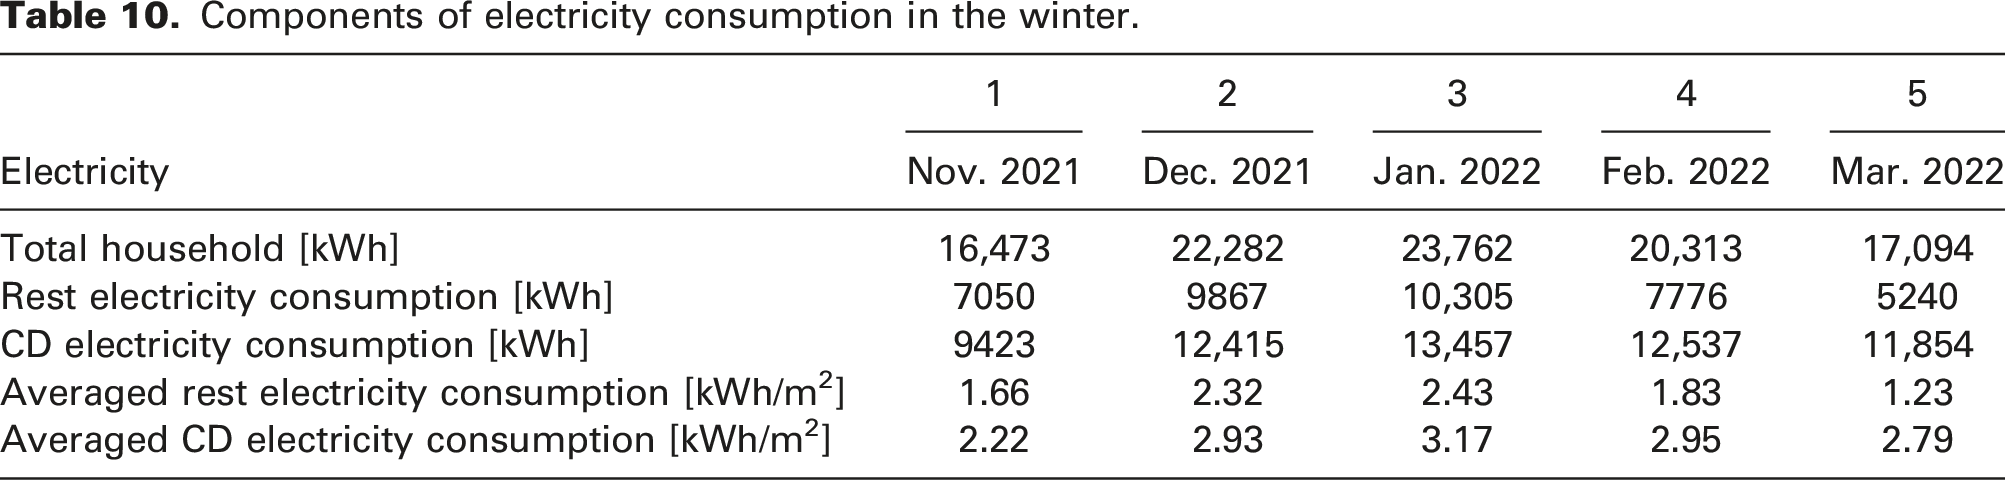
As installation of meters on gas lines is prohibited, the natural gas consumption data of the PH building comes from the natural gas company. The annual average natural gas consumption of each apartment in this PH building is 159.9 m3 and equal to 14.6 kWh/(m2·a), which is only used for cooking. In this study, if the energy content of natural gas is simplified to 10 kWh/m³, then the daily average consumption is 4.4 kWh. For comparison, the annual average natural gas consumption of each apartment in the GB building is 175.7 m3 and equal to 20.5 kWh/(m2·a).
The system for preparing DHW is complicated in the PH building, and it is mainly divided into three modes.
Mode 1: The CD and electrical heater can produce DHW at the same time. First, the CD starts to heat the DHW to 45°C and then stops. After that, the electric heater inside the WT starts to heat the DHW to the set temperature of 55–60°C. In this mode, the DHW used subsequently is mainly heated by the electric heater.
Mode 2: Only CD heats the DHW. The CD will heat the DHW to the set temperature of 40–45°C and switch to heat the supply air. In this way, the water temperature in the WT can be a maximum of 45°C.
Mode 3: Only electric heaters heat DHW. They will heat DHW until the set temperature of the WT reaches 55–60°C.
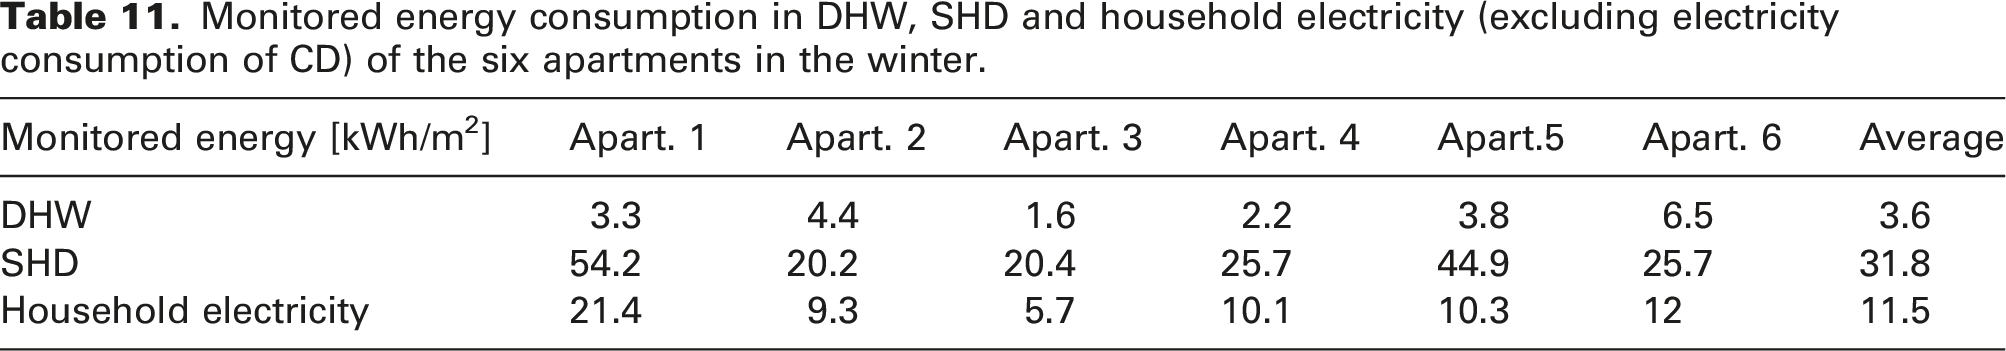
Amongst the 17 apartments that are inhabited, only 6 apartments use mode 2 to produce DHW, which means, the DHW energy consumption of these 6 apartments can be measured due to the heat meters on the pipes of DHW from the CD to the WT (see Figure 5). Hence, these six apartments were selected to analyze the DHW, SHD and household electricity consumption.
As shown in Figure 11 and Table 11, the DHW energy consumption, SHD and household electricity consumption (excluding electricity consumption of CD) of the six apartments in the winter were directly measured and their average value was 46.9 kWh/m2. Monitored energy distribution of six apartments in the winter: (a) the percentage of the three energy consumption types, arranged in circles from inside to outside are apartments 1 to 6, and (b) the total energy consumption. Monitored energy consumption in DHW, SHD and household electricity (excluding electricity consumption of CD) of the six apartments in the winter.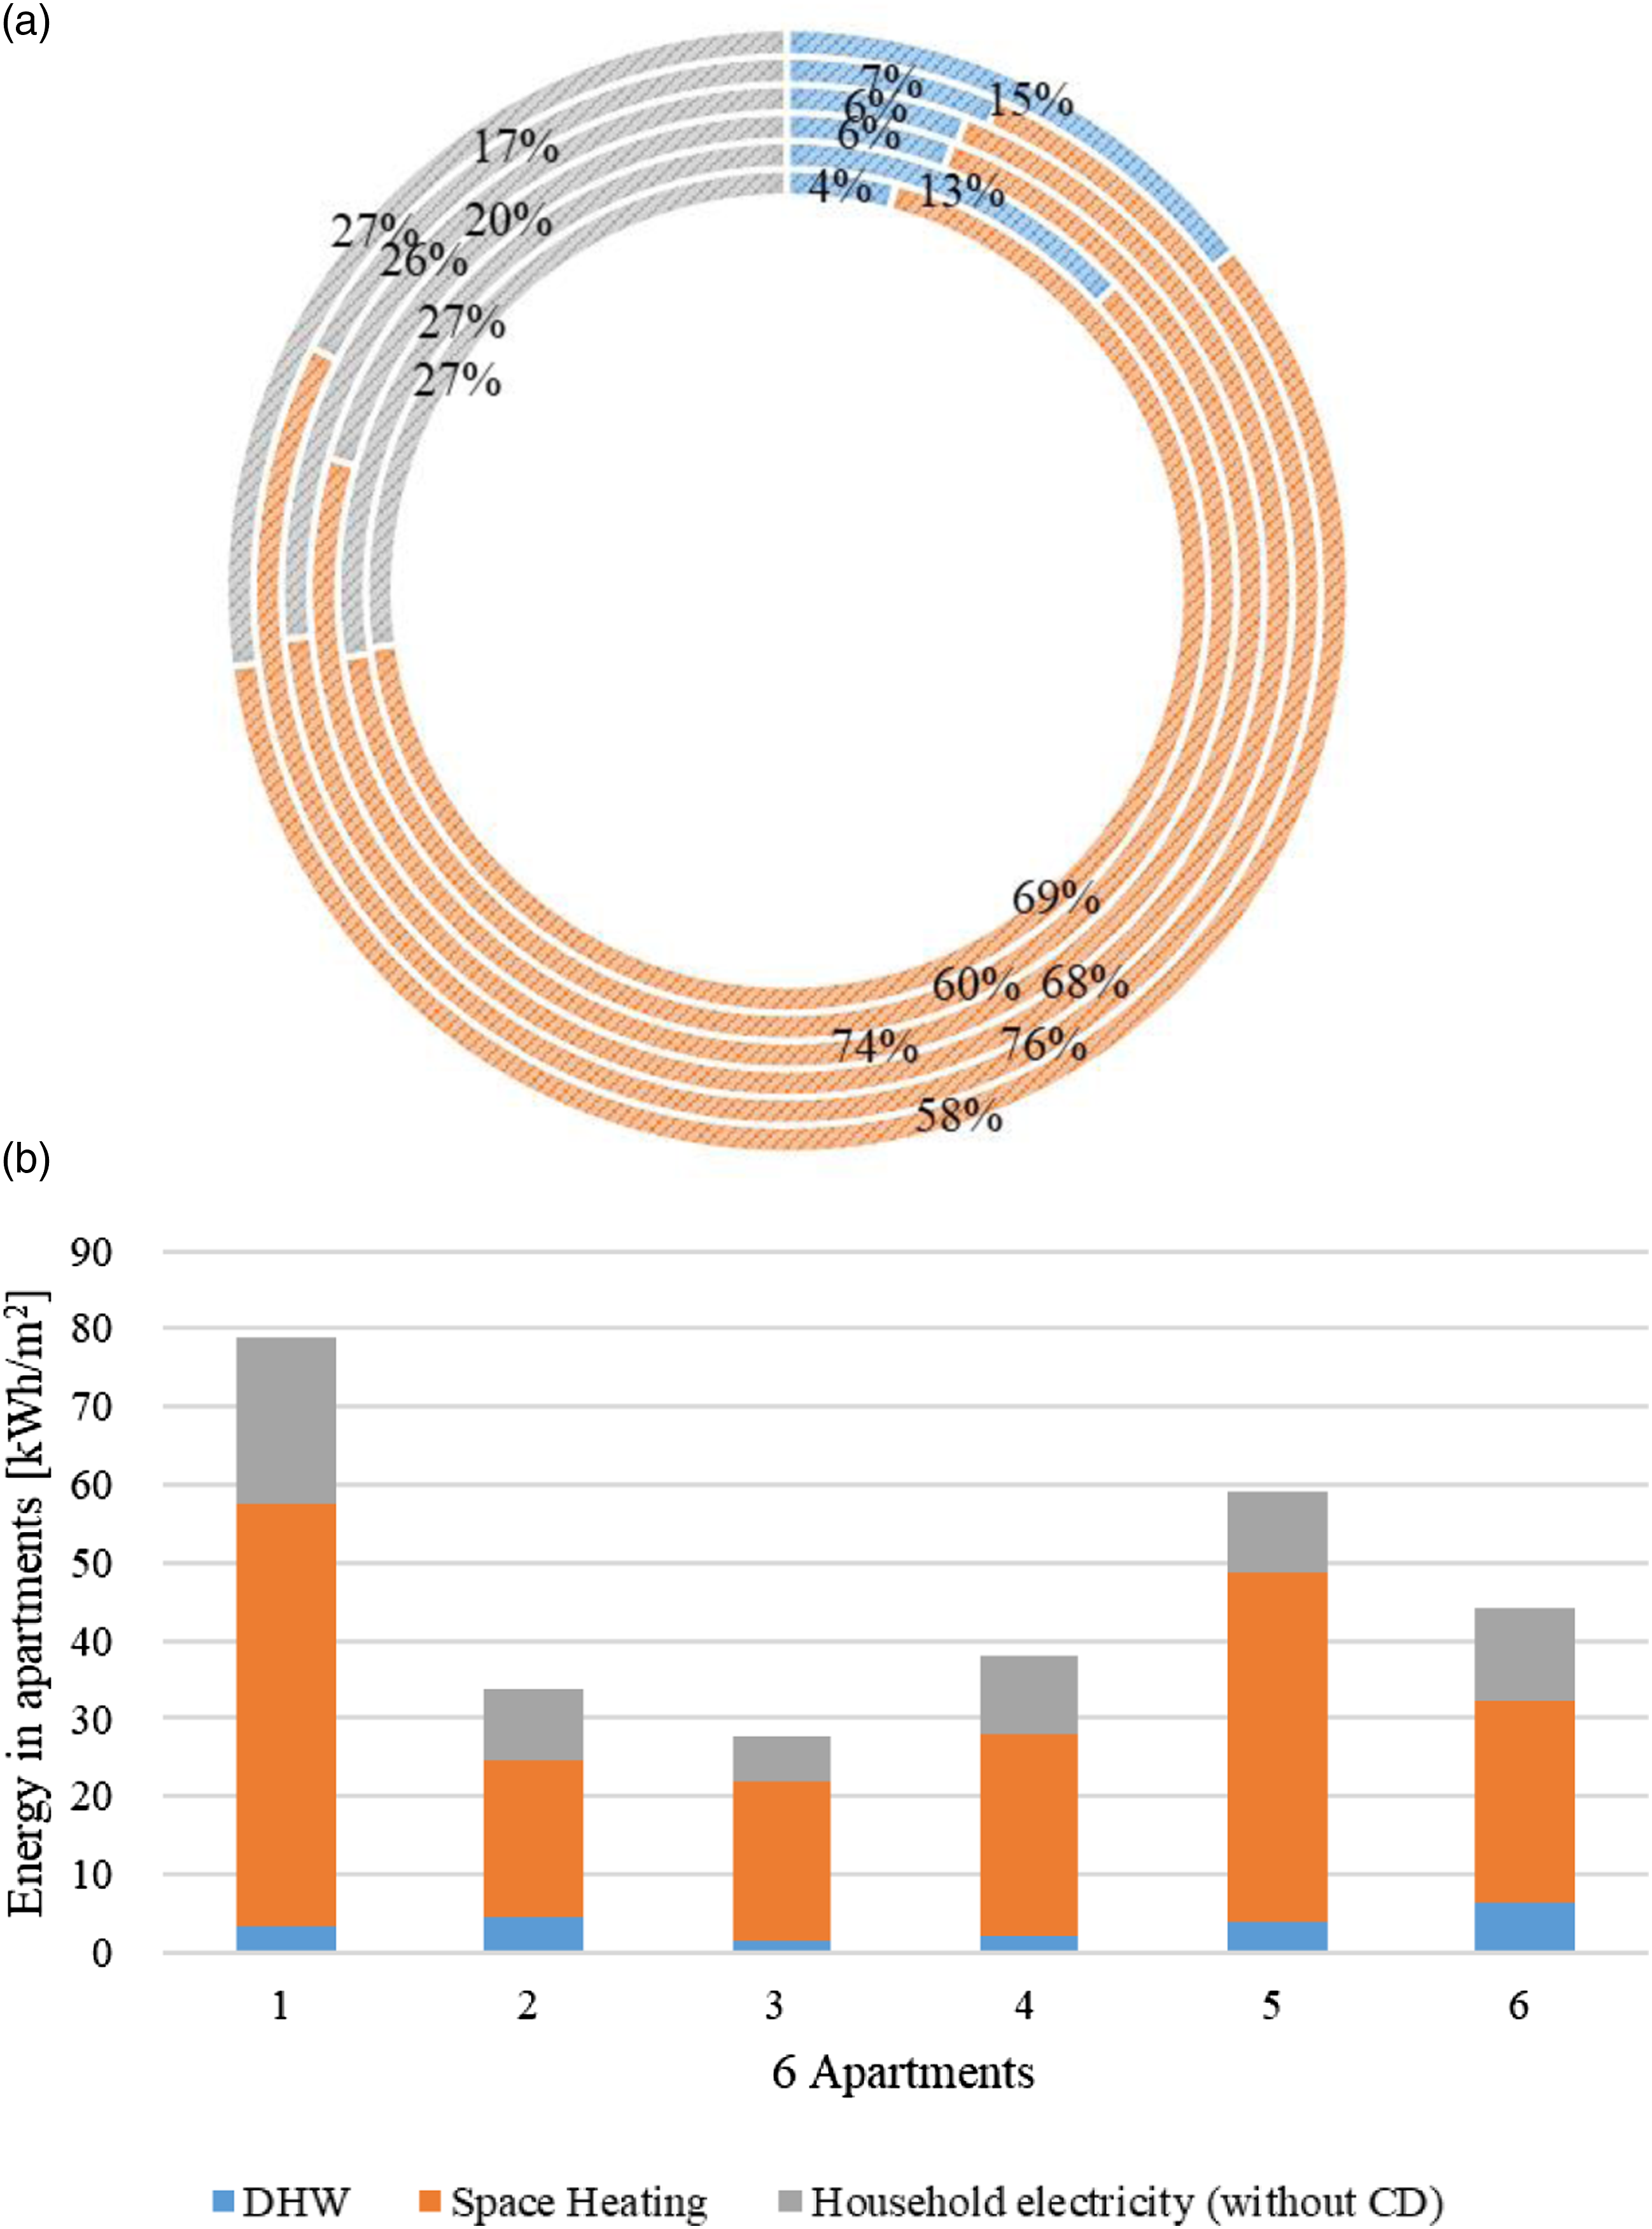

SPF of six CDs in the winter.
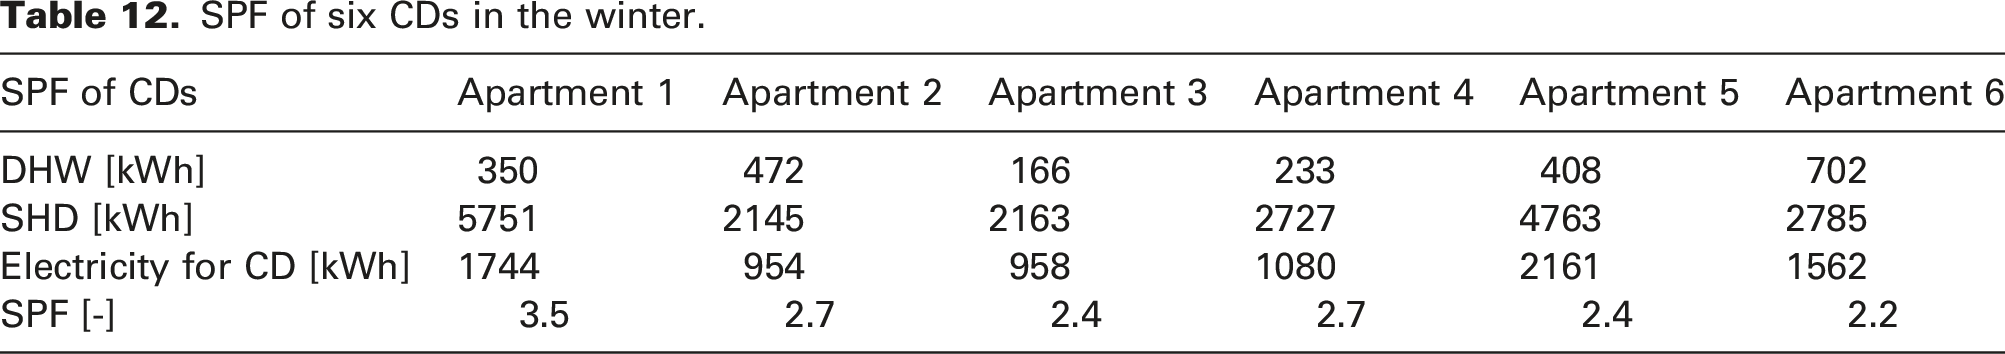
The electricity consumption of 17 apartments was analyzed, and since in one of them, the CD was hardly turned on, this apartment was excluded. As can be seen from Figure 12, there is a huge difference in the proportion of household electricity consumption and CD electricity consumption in 16 apartments. In general, the proportion of CD electricity consumption ranges from 29% to 74% and the average value is 51%, and the remaining 49% is household electricity consumption. Ratio of CD and household electricity consumption.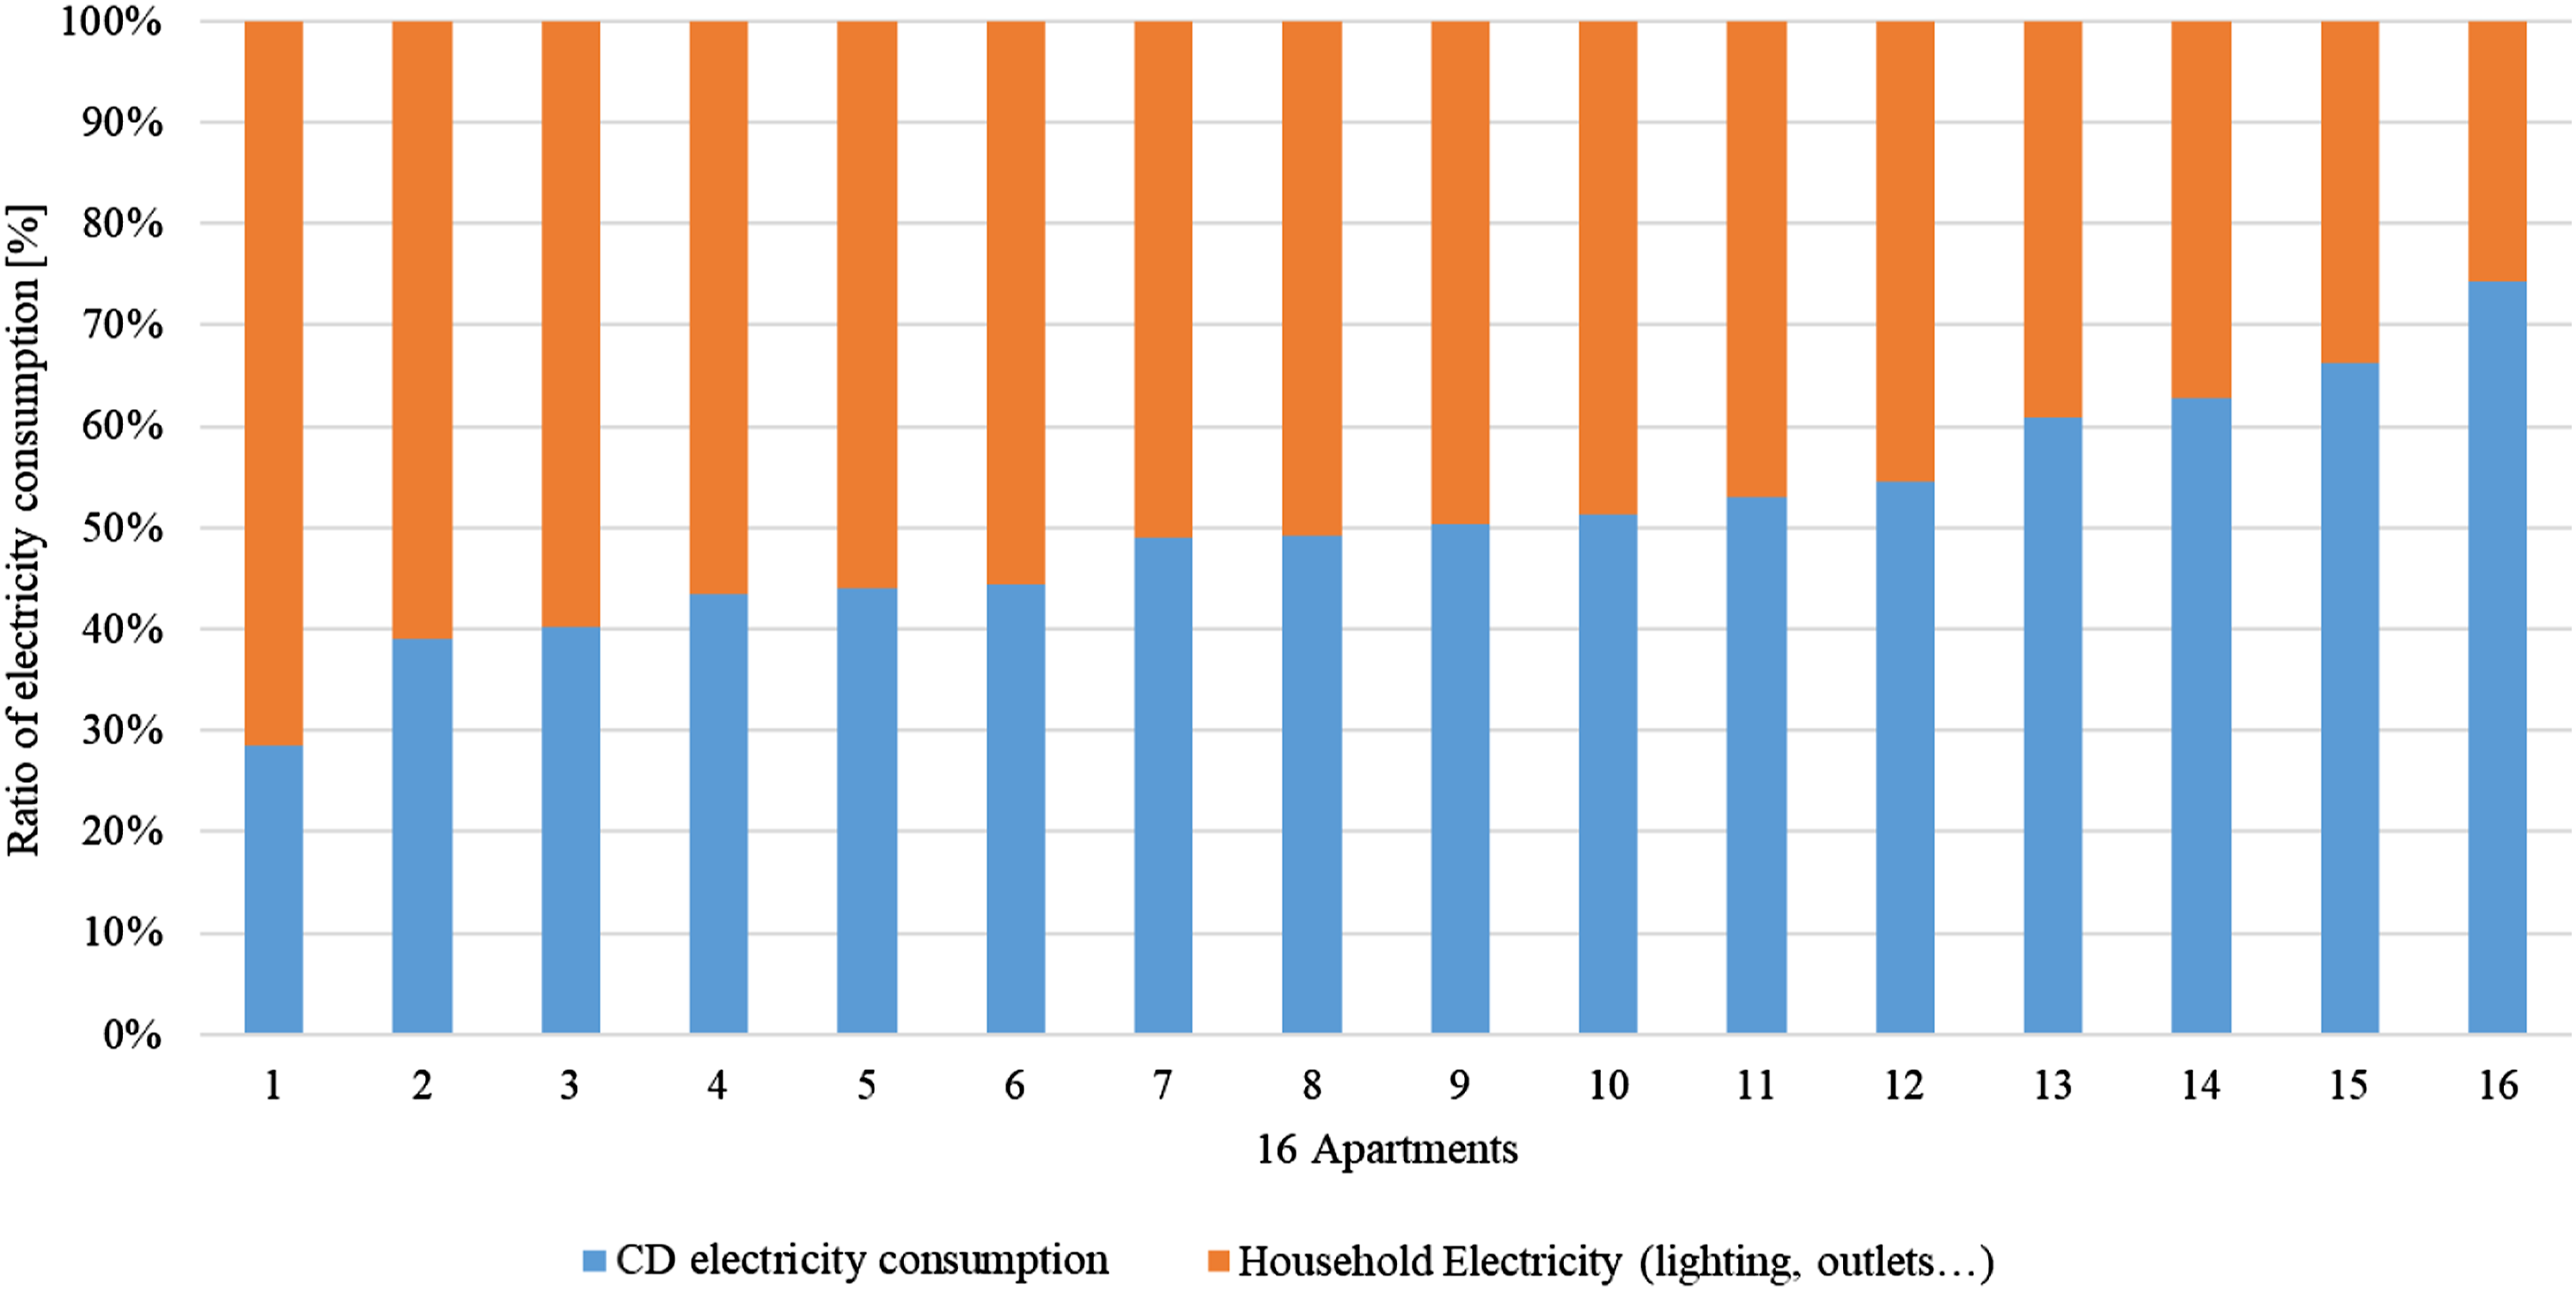
Renewable energy usage
Two kinds of renewable energy sources are used in this PH building. The GSHP is used as a major cooling and heating source. This building is also equipped with a PV system, which consists of 46 polysilicon cells with a maximum capacity of 12.4 kWp. The inclination angle of the south-facing solar panels is 25 degrees (see Figure 2). The electricity production from April 2021 to March 2022 (1 year) was 11,653 kWh, approximately 6% of the total electricity consumption. The energy consumption for DHW in the GB district is 15.2 kWh/m2, 25 which is prepared by the solar thermal collectors.
Comparative analysis of simulation tools PHPP and IBE
Results of IBE.
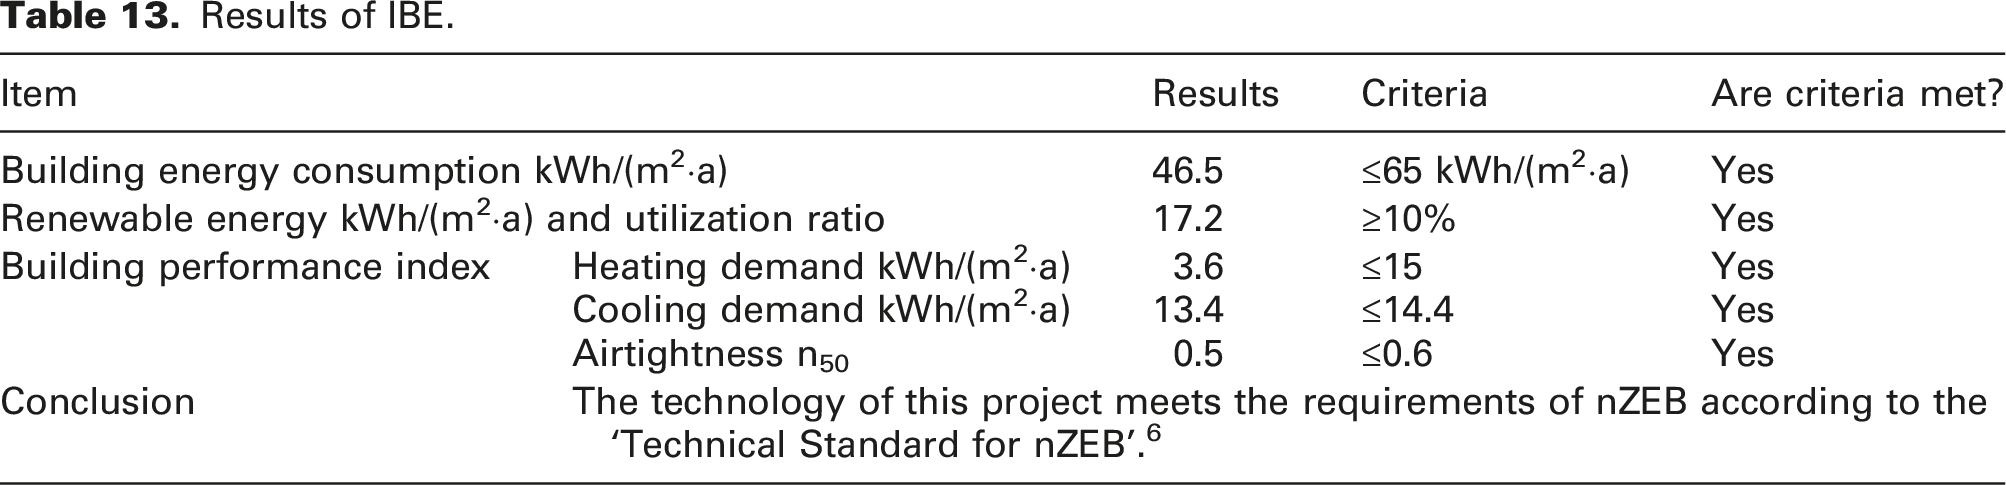
The PHPP, used during design, corresponds to a fully occupied PH building. After this building is put into operation, it is necessary to update the PHPP simulation with the real conditions such as the real occupancy rate and the monitored climatic conditions (e.g. outdoor temperature and global radiation). In summary, the following conditions are updated: 1. The actual occupancy rate (and the corresponding internal heat gains) and the average indoor temperature of this winter are entered into PHPP. It is calculated as one single zone for the entire building and does not distinguish between different apartments. 2. The actual climate data includes outdoor temperatures, global radiation and dew point temperatures. 3. The horizontal shading coefficient was reconsidered, because a new high-rise building, rather than the expected multiple-family house was built on the south side, which had a height of 51.3 m and a horizontal distance of 67 m to the PH building.
Since the monitored data is from 29 apartments and not from 36 apartments, in order to update the PHPP simulation of the whole building, it is necessary to assume the energy consumption of space heating and indoor temperature of the other 7 apartments, as shown in Table 6. For two of the seven apartments that were partly occupied, the average temperature of the adjacent apartments was used, and their energy consumption could be automatically monitored. For five of the seven apartments that were not occupied, the energy consumption was 0, and the indoor temperature was assumed 3 K less than the average temperature of the adjacent apartments. The temperature of the 3 staircases was assumed 3 K lower than the average temperature of the 36 apartments due to no direct space heating. In this way, the SHD of this PH building was calculated to be 21.3 kWh/(m2·a) and the average indoor temperature was calculated to be 21.1°C. Thus, this temperature was then inserted as the indoor temperature in the updated PHPP and this SHD was compared to the SHD calculated by the updated PHPP.
Figure 13 shows the comparison of monitored data and the results of the simulation tools for the SHD. The updated PHPP results in an increase of SHD by 4 kWh/(m2·a). The monitored outdoor temperature and global radiation of this winter impacted the SHD by −3 kWh/(m2·a). The IHG calculated for all apartments was 1.25 W/m2 resulting in an additional 4 kWh/(m2·a) of SHD in PHPP. Higher internal temperature and shading from neighbouring buildings increased the SHD by 2 and 1 kWh/(m2·a), respectively. Thus, the updated PHPP calculated an SHD of 12 kWh/(m2·a) which is 9.3 kWh/(m2·a) lower than the monitored SHD for the whole building. The difference between the monitored results and PHPP simulation is mainly because of construction moisture21,37 and the behaviour of users (an increased use of natural ventilation), which cannot be measured or completely quantified here, since, for example, according to our observations, the doors of unit entrances were often left open rather than closed, although the notice ‘please close the door’ was posted on the doors. In addition, the assumed indoor temperatures of unoccupied apartments and staircases can cause a deviation of SHD. This error consideration is inevitable because of the limitation of monitoring. Analysis of calculated SHD in PHPP based on monitoring data and other changes.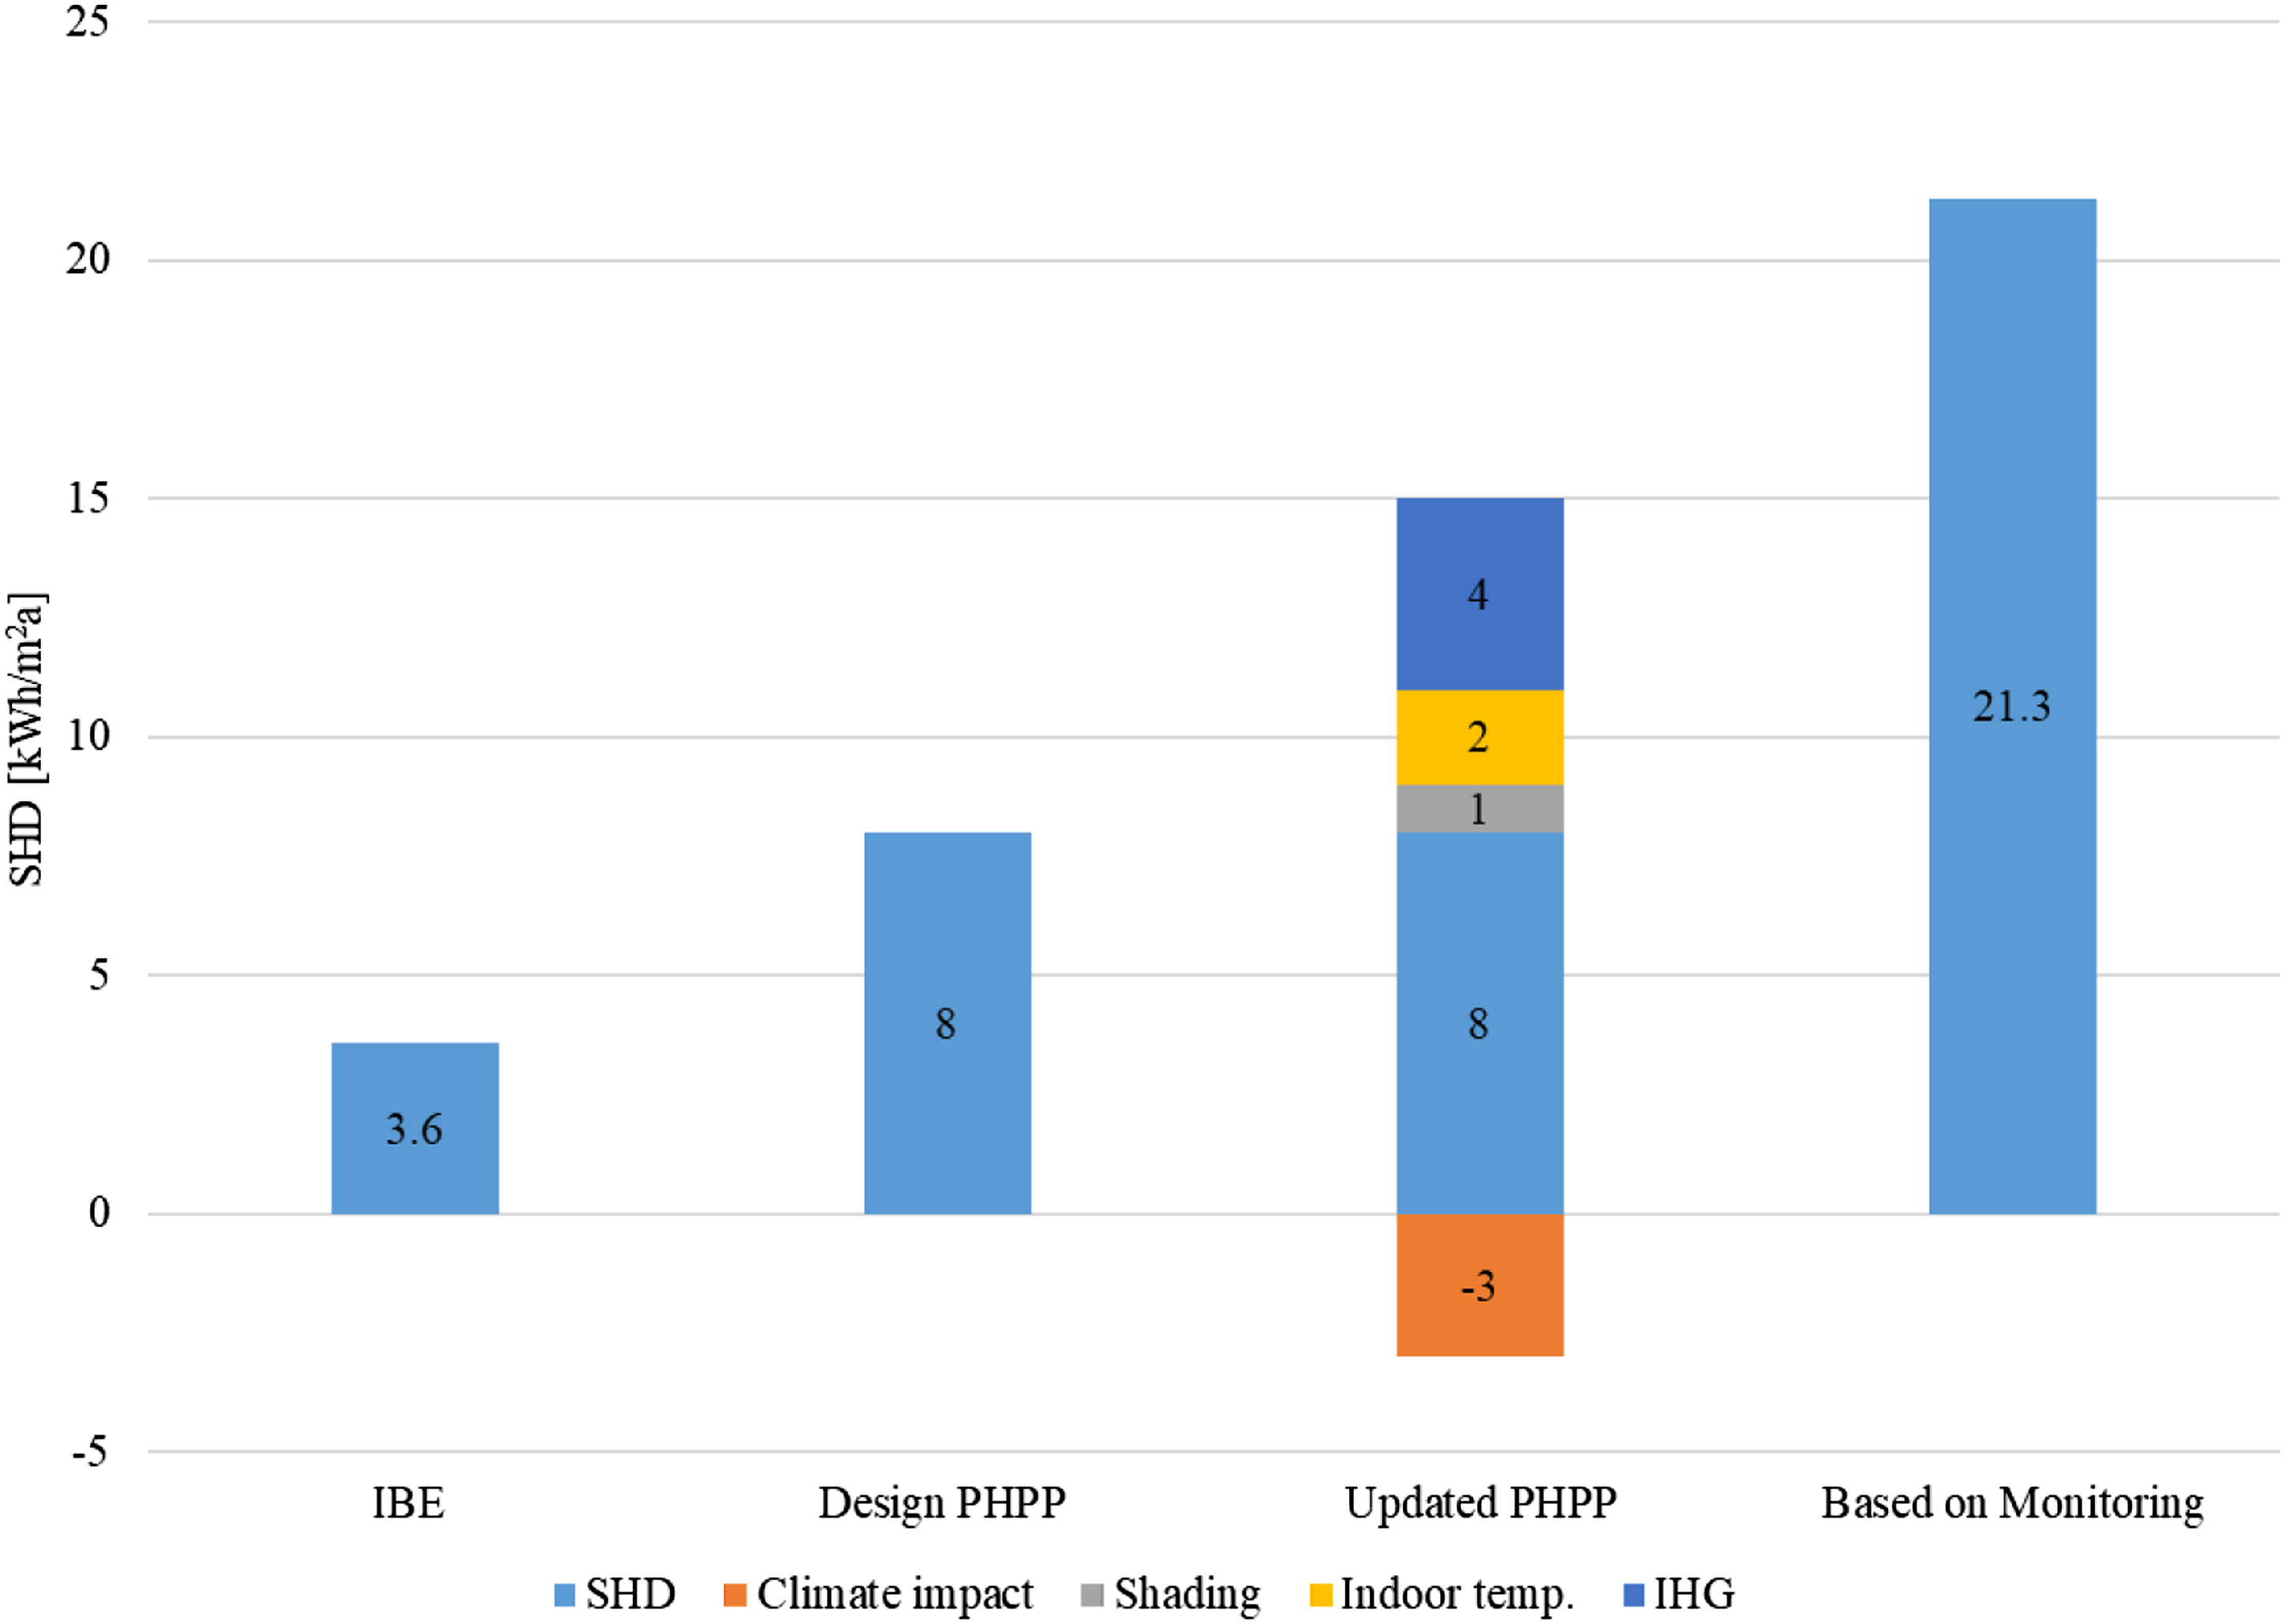
The following comparison of the IBE simulation and the PHPP simulation, see Figure 13, is found: 1. From a design point of view, the PHPP certified design (8 kWh/(m2·a)), the IBE result (3.6 kWh/(m2·a)) and the updated PHPP result (12 kWh/(m2·a)) are all less or equal to the criteria of PH 15 kWh/(m2·a). Also, IBE gives a larger deviation from 15 kWh/(m2·a) than PHPP. That means, the SHD of the IBE simulation is too optimistic and IBE has some issues that need to be worked out, for example, the shading effect on the target building by the neighbouring buildings is not considered a boundary condition input in the current version yet. During communication with software developers, they also admitted this was an existing problem. 2. Result of updated PHPP is closer to the monitored energy consumption than IBE.
The data in Figure 13 focuses on the comparison of the SHD because the simulations are all aimed at the energy consumption of space heating, which can be directly compared. The PE simulated by PHPP and IBE was used as an auxiliary reference. The reasons for this consideration are as follows: 1. The scope of PE is different. IBE tool excludes electricity consumption from sockets, cooking and household appliances
6
; however, PH includes all kinds of electricity consumption in the apartment. 2. The coefficients of PE conversion are also different. In China, the standard coal equivalent replaces energy consumption, that is, different types of energy are converted to standard coal equivalent according to low calorific value and coal consumption for the electricity supply of coal-fired generator sets. For PH, the coal consumption of thermal power plants is adopted uniformly.
6
In addition, a sensitivity analysis was performed in PHPP to identify the range of SHD by varying the IHGs and the indoor temperature (see Figure 14). The SHD varied from 5 kWh/(m2·a) with the highest IHG and the lowest indoor temperature up to 18 kWh/(m2·a) with the lowest IHG and the highest indoor temperature. Sensitivity analysis of SHD in PHPP with the indoor temperature and IHG.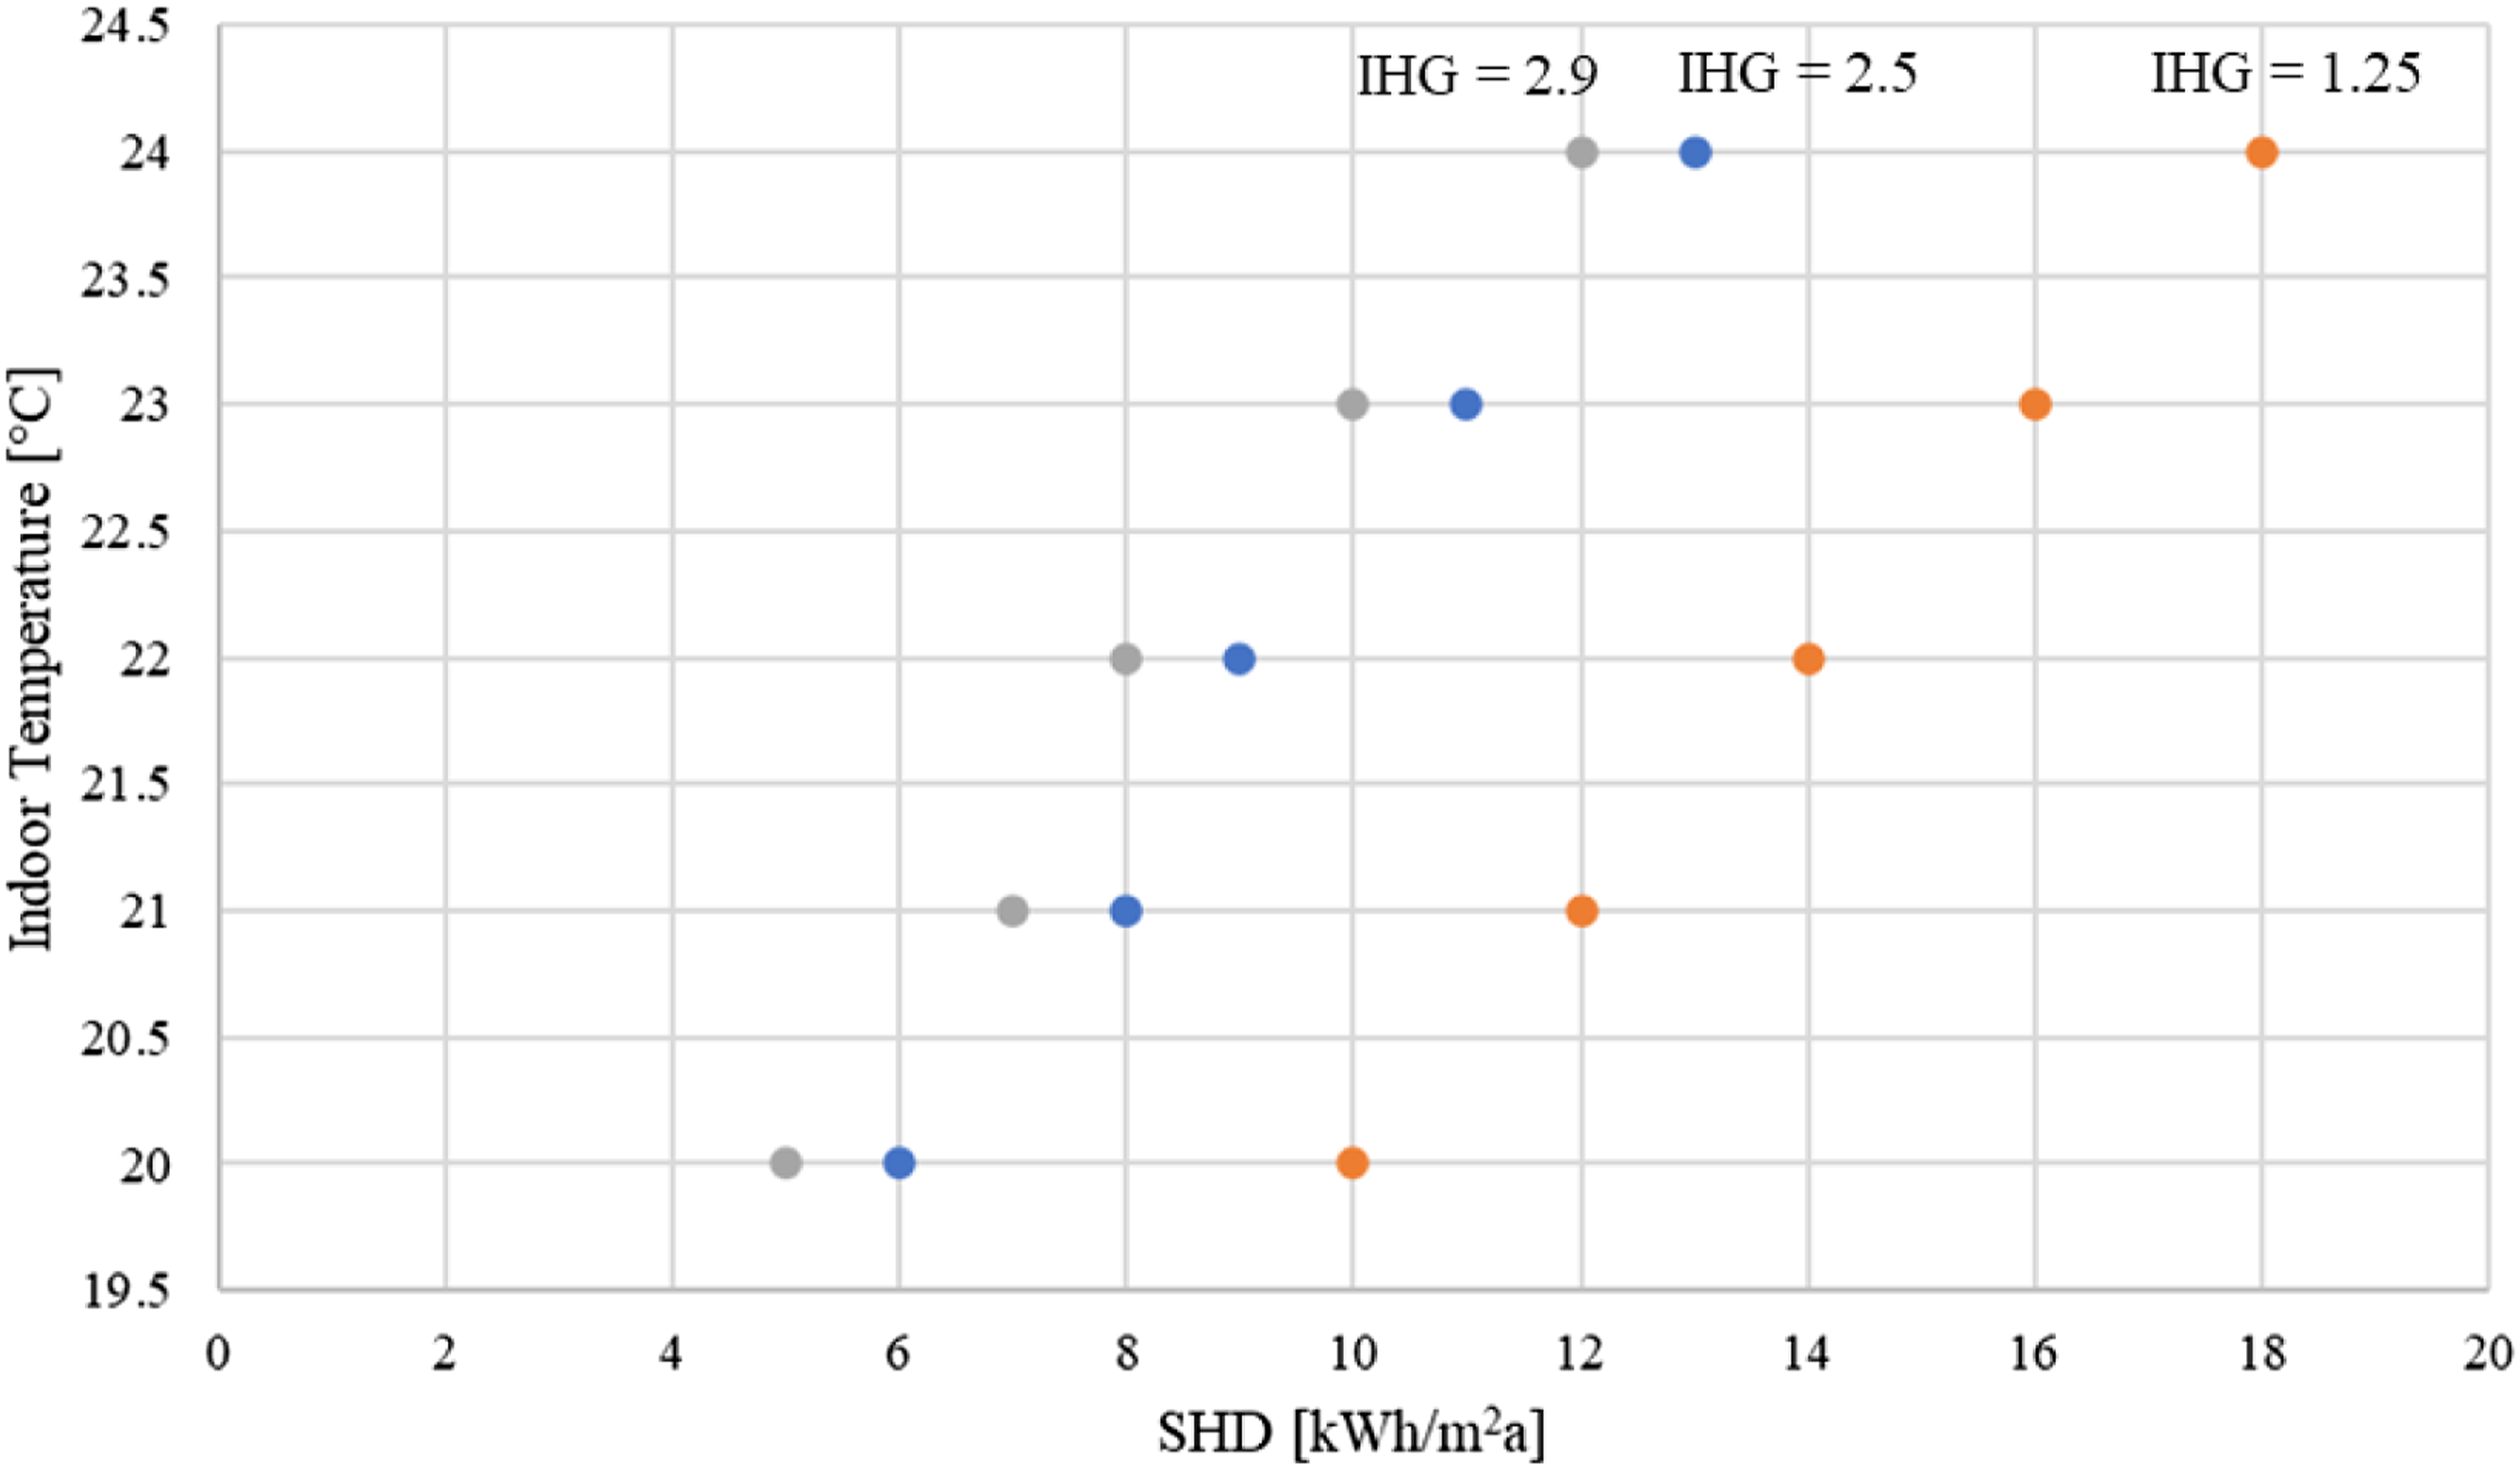
Comparison of energy consumption in PH and GB buildings
According to the China Urban Heating Development Report 2021, 32 the average SHD in cold regions of China in the winter is about 0.4 GJ/m2 (per TFA), which is equivalent to 111 kWh/m2. The monitored energy consumption of the GB district in the winter of 2021–2022 showed that with an occupancy rate of 57.8%, the average SHD provided by the district heating company was 155.3 kWh/m2. The simulation result of the SHD of the GB district was 134.4 kWh/m2. 22
Comparison of site energy consumption in PH and GB building.
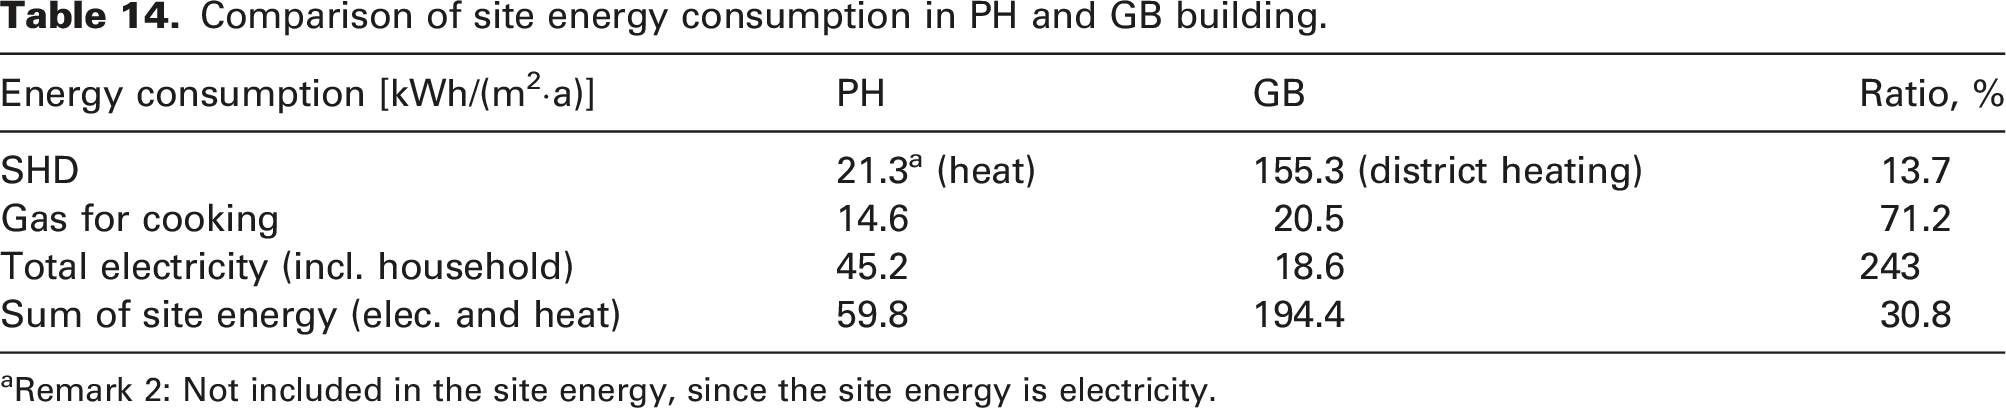
aRemark 2: Not included in the site energy, since the site energy is electricity.
Discussion and recommendations
The energy-saving performance of the PH
From the monitored results, the average indoor air temperature of 29 apartments in the winter is 21.9°C and the corresponding SHD accounts for 28 kWh/(m2·a) on average, which is more than the monitored results in Germany. 22 However, this value of SHD cannot be directly compared to the designed SHD 15 kWh/(m2·a) in PHPP mainly for two reasons: a) the occupancy rate of this PH building is 47%, 12 of the 29 apartments were not occupied but heated and therefore, much more heat has been supplied due to a lack of IHG, and b) there were 7 empty apartments (thus, no IHG and the heating system was not in operation) that were ‘heated’ by the neighbouring apartments due to the high thermal fluxes between them (because of temperature difference and very well-insulated thermal envelope). These result in a significantly higher SHD of the investigated 29 apartments than intended during design.
Considering the whole PH building, the SHD was calculated to be 21.3 kWh/(m2•a) and the average indoor temperature was calculated to be 21.1°C, which is higher than the updated value in PHPP by 9.3 kWh/(m2·a). In addition, the monitored data in the first year are often on the high side,21,38 and some uncertain factors will also bring measurement errors to a certain extent such as construction moisture and users’ behaviour. Various lifestyle habits of families and their usage patterns of CD lead to different energy consumption in these apartments. One more reason could be that the inhabitants probably opened the windows more often than in other years due to the pandemic. If the occupancy rate could reach 100%, the SHD could be expected to be close to the target of 15 kWh/(m2·a). Although there is a difference between the monitored and designed SHD, the SHD of the PH building is only 13.7% of the SHD of the GB building, saving 86.3% energy consumption. This result is consistent with a previous article, in which the PH building was found to consume only 11% of space heating required by the GB building. 25
The PE consumption converted from household electricity and total electricity consumption was 96.7 kWh/(m2·a) and 117.5 kWh/(m2·a), respectively, both of which are less than the limit of 120 kWh/(m2·a) required by the PH standard if the PE coefficient is assumed to be 2.6. 11
In the summer, the electricity consumption was relatively lower. According to the questionnaire of some inhabitants, many of them did not turn on the CDs for cooling in the summer due to habitual ‘cost-saving behaviour’ and relied entirely on natural ventilation or electric fans to cool down. This is one of the main reasons why the electricity consumption in the summer does not have the same ‘peak’ as in the winter (see Figure 10). In addition, the occupancy rate last summer was not as high as in the winter, many residents moved in before winter. So, the total electricity consumption for cooling was not as high as during the heating period.
In the PH building, the total gas and electricity consumption was 59.8 kWh/(m2·a) and the proportion of electricity consumption was 75.6%. On 11th March 2022, the MoHURD officially released the ‘14th Five-Year Plan for Building Energy Efficiency and Green Building Development’, proposing that the proportion of electricity consumption in urban building energy consumption should exceed 55% by 2025. So, this PH building has reached this regulation.
Figure 11 and Table 11 show the range of different energy usages of the apartments in the winter. The SHD was the largest part of energy consumption, followed by household electricity consumption and DHW energy consumption was the least. The energy consumption for DHW is less, partly because electric kettles are used to boil water for tea, coffee and cooking, and there is no hot drinking water from the WT directly. Part of the energy consumption of DHW is transferred to the household electricity consumption, because of the use of an electric heater in WT.
Figure 12 indicates that in the winter months, the average CD electricity consumption is almost equal to the household electricity consumption considering all the inhabited apartments in the PH building.
The equipment and methods required to achieve high energy-saving in PHs requires a large initial investment and good operational management in comparison with the conventional GB buildings. Their economics were analyzed in detail in previous publications. 25 The result is that the initial investment of PHs exceeds that of GB building by ¥864RMB/m2, which can be recovered in 17 years through energy-saving during the operational period.
Better indoor environment in the PH
The goal of reducing building energy consumption has to be done without lowering the comfort of the indoor environment. The indoor temperature was set at 20∼26°C and the set points of relative humidity are 30%–60% throughout the year in this PH building. Figures 15 and 16 show the monitored indoor temperature and relative humidity of PH buildings in the winter. Monitored average indoor temperature. The CDF of the monitored indoor relative humidity in November 2021 in 17 inhabited apartments.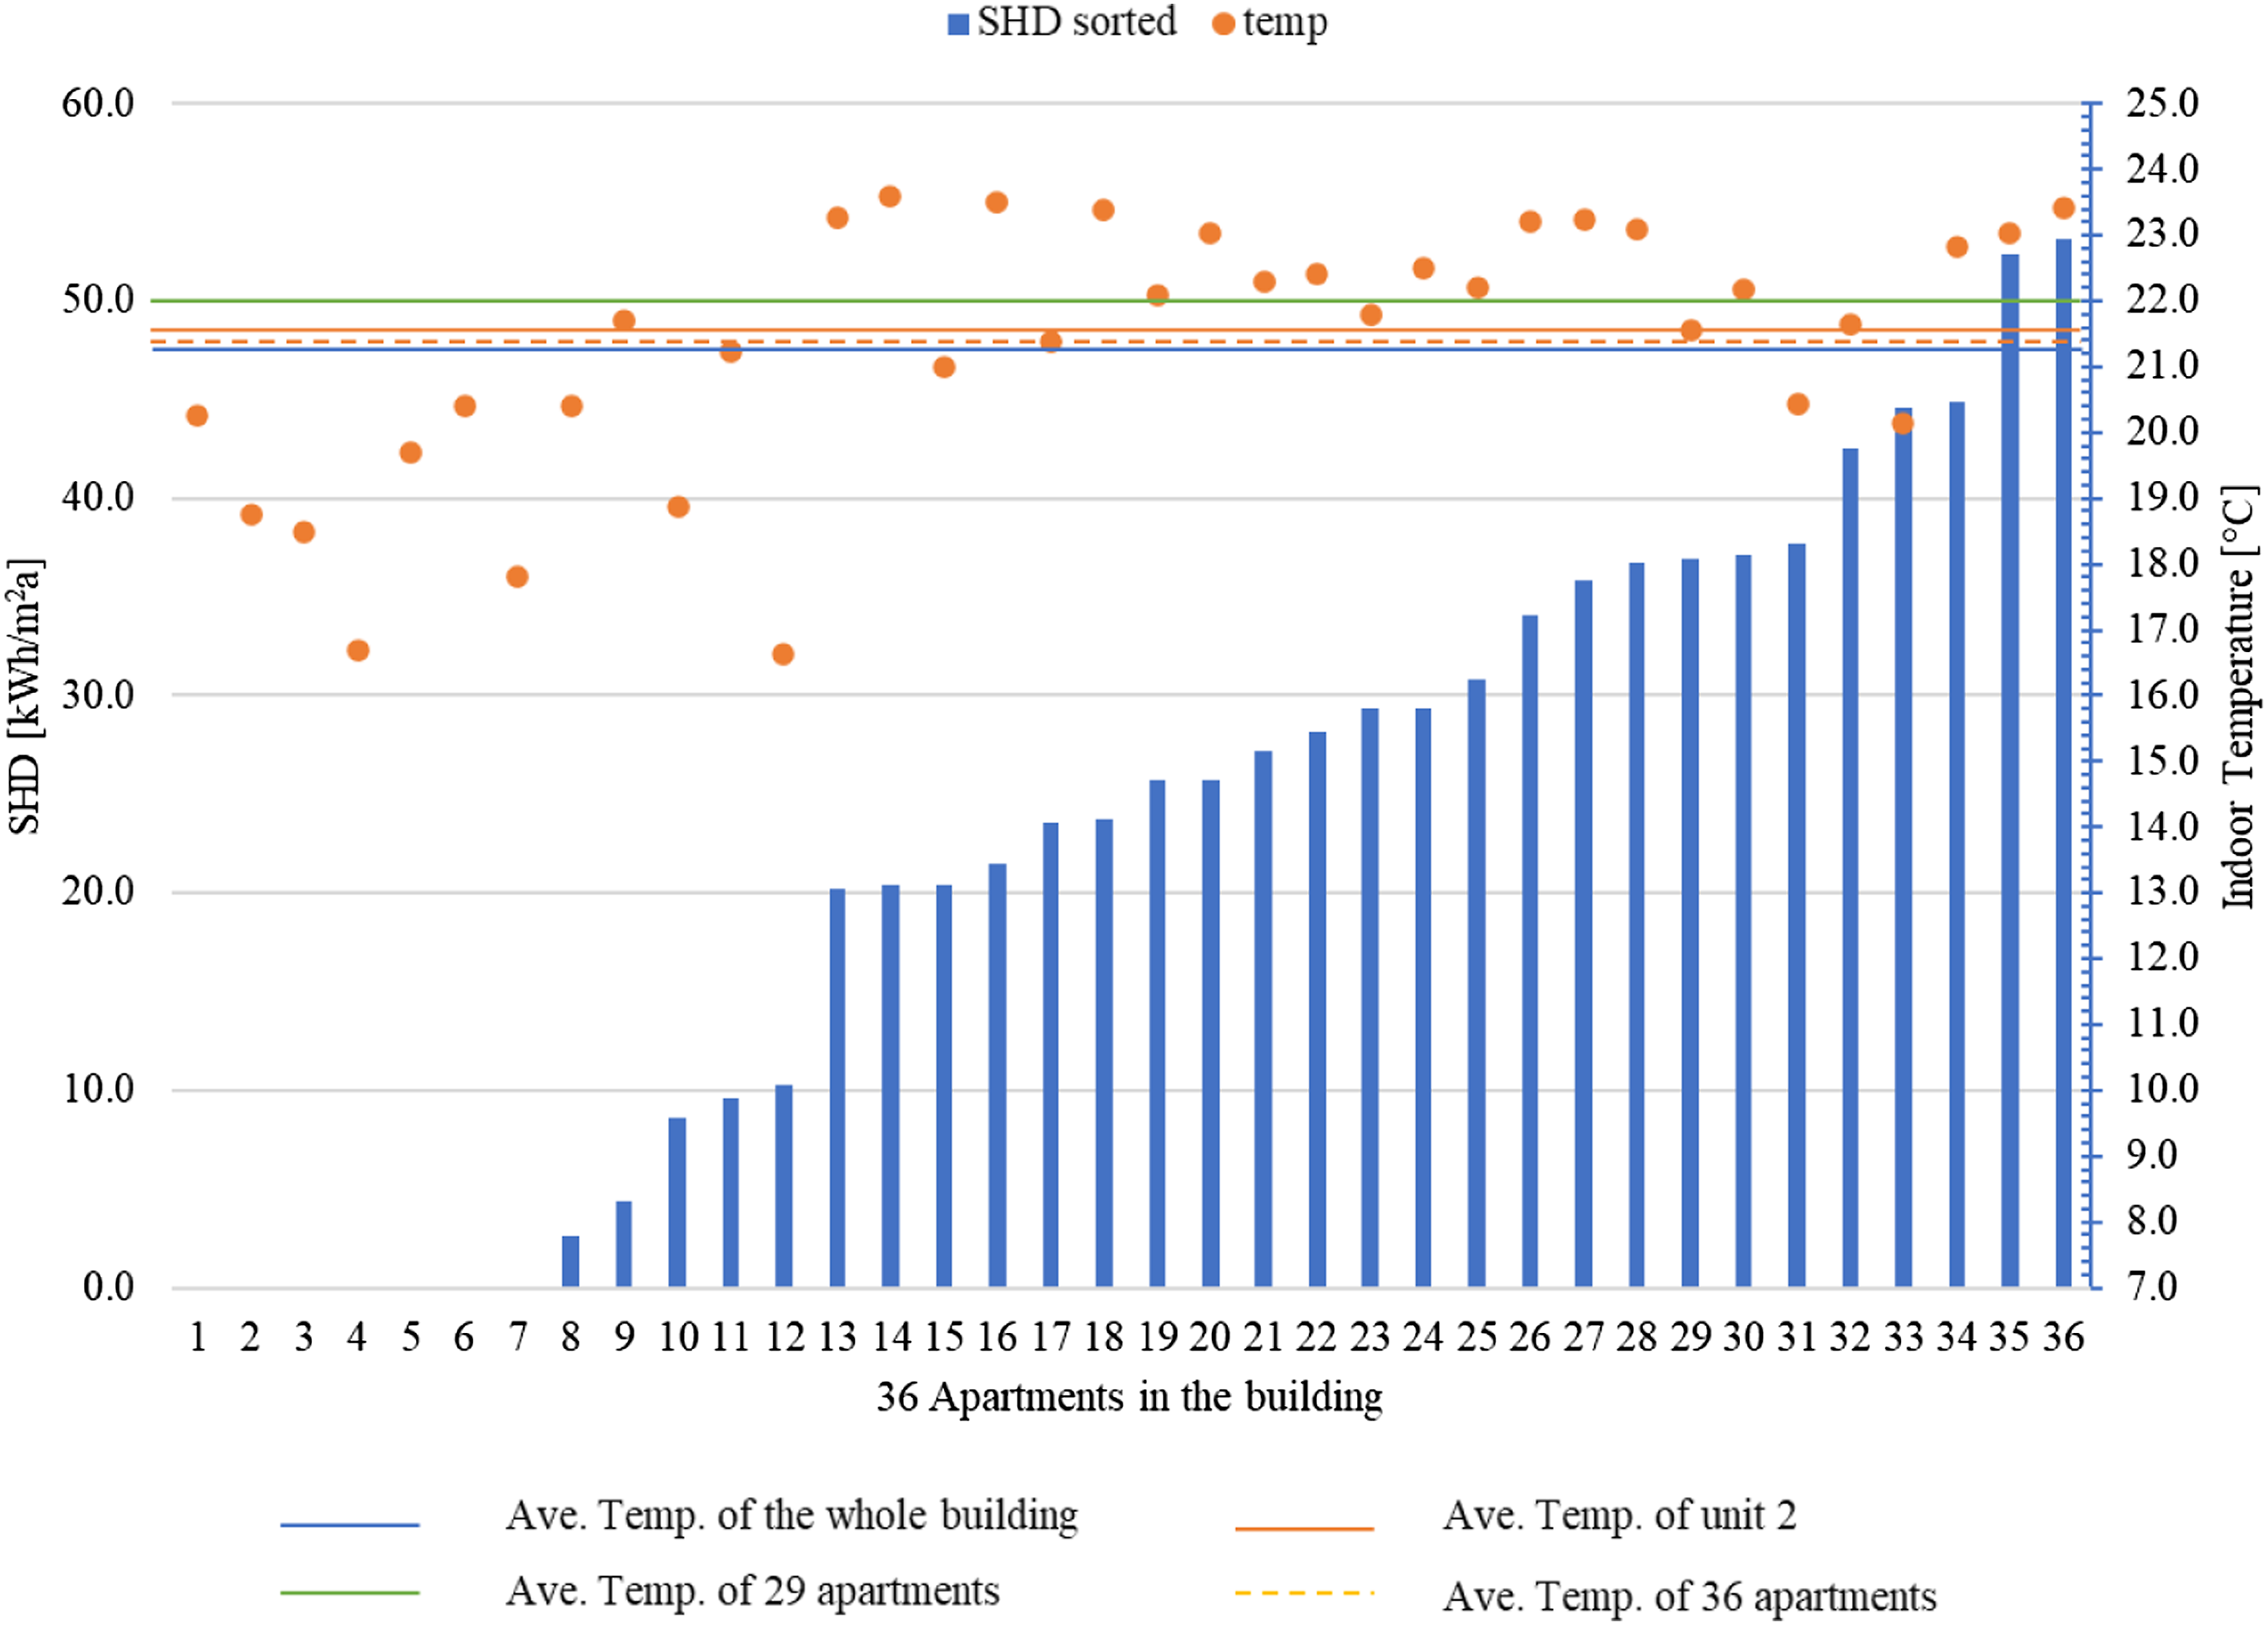
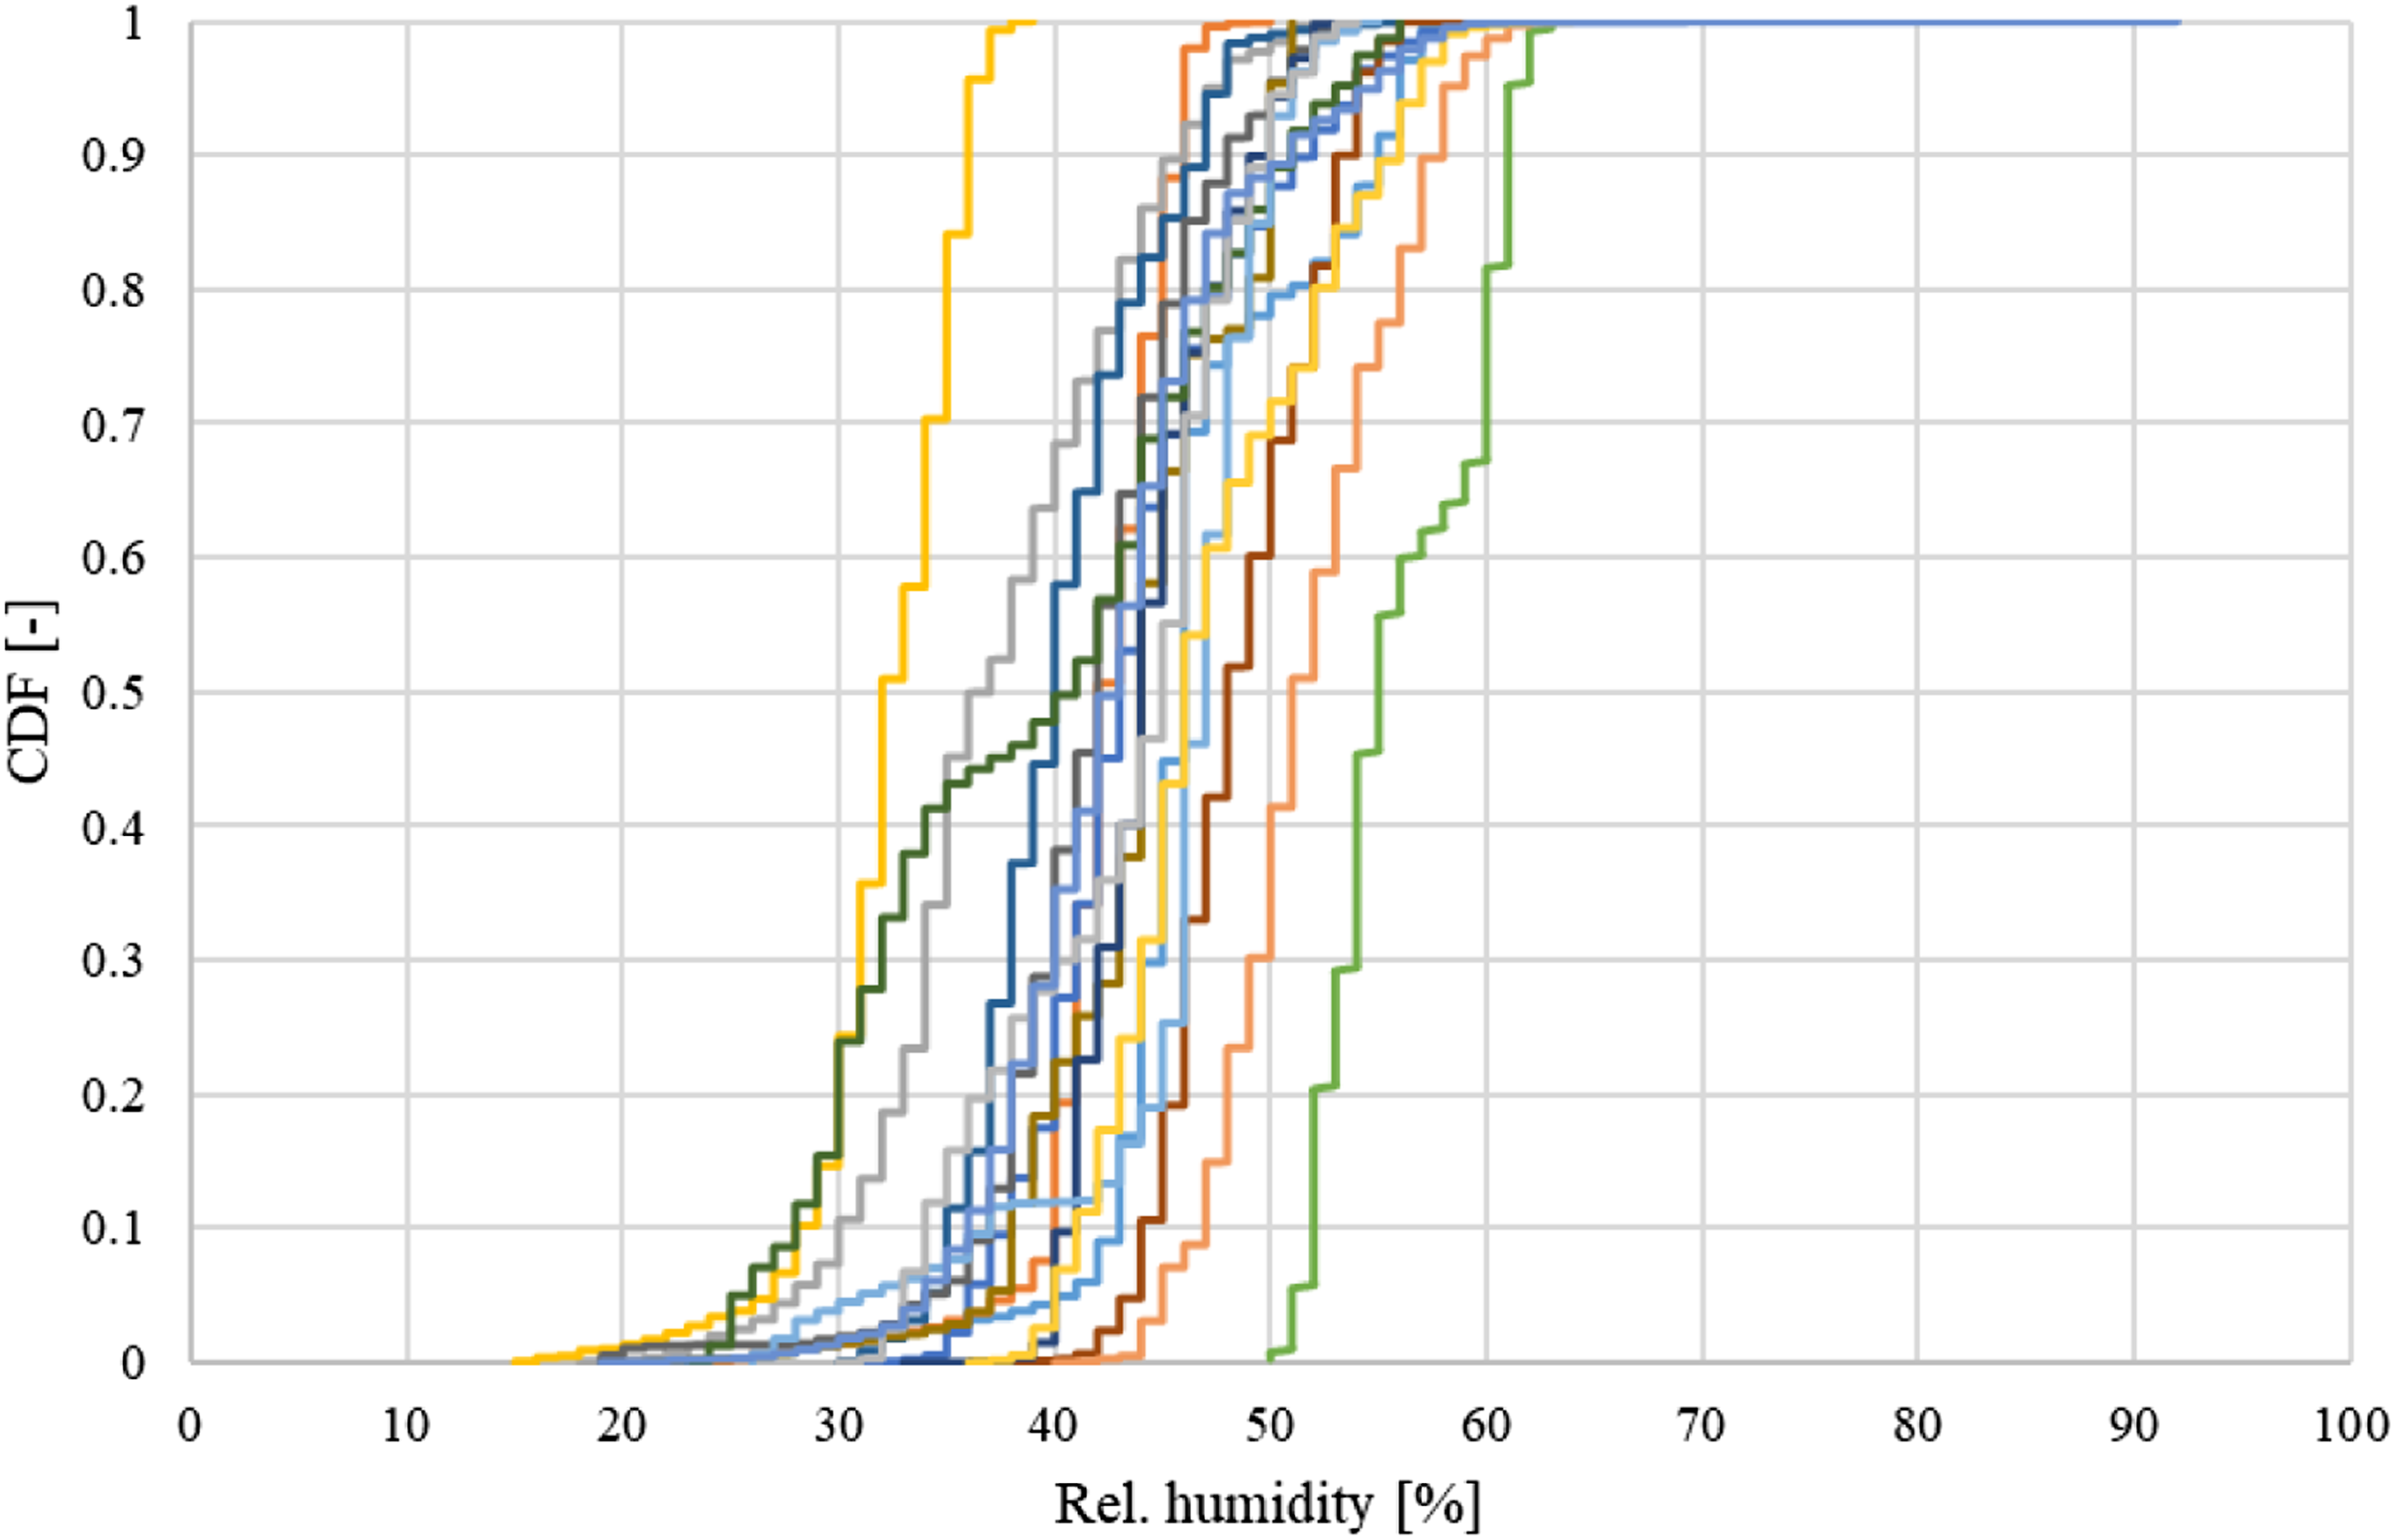
The monitored IEQ of this PH building shows that the average internal air temperature and relative humidity have reached the comfort zone 39 stipulated by the PH standard. Users’ complaints about uncomfortable conditions have been significantly decreased compared with the previous winter. Due to differences in users’ habits, the average monitored air temperatures of 29 apartments fluctuated from 16.6°C to 23.6°C, with an average temperature of 21.9°C compared to the average outdoor temperature of 4.5°C. One of the apartments was not often occupied, resulting in the lowest average indoor temperature of 16.6°C. The overall relative humidity in the building was also very suitable, distributed in the range of 29%–48.9%, and the average relative humidity was 37.2%. The duration of the relative humidity falling below the lower limit of 30% was significantly reduced (e.g. Figure 16), which shows that it is more comfortable than the adjacent PH public building PHTEC. 11 Indoor CO2 concentrations also remained very low, within 800 ppm, highlighting the advantages of a mechanical ventilation system that continuously provides fresh air. The interior environment of this PH building generally maintains a high degree of comfort.
Recommendations and limitations
Besides the building envelope and service systems, users’ behaviour is also important when discussing PH building energy performance.
The PHI does not recommend an insulation layer on the house partition walls to reduce the heat 38 and noise transfer; however, footstep sound insulation is recommended in the intermediate ceilings and has been proven to be sufficient. This PH building was built as the PHI recommended. During the operation, many inhabitants complained about noise being heard through the partition walls. Hence, it is recommended that a sound and heat insulation layer can be added to the partition walls of the PH residential buildings in the future, to meet the requirements of Chinese residents. For example, on both sides of the partition wall, 40 mm thick rock wool could be added for a thermal and sound insulation layer. In this way, within the building envelope, the already occupied apartments do not need to consume additional energy to heat the vacant apartments, and more importantly the noise transmitted through the partition walls would be reduced.
During a survey of some residents, insightful operating experiences were shared. 1) Maintain the room temperature at 25°C in summer and 21–22°C in winter. Try not to open windows in winter and summer. 2) Adjust the set temperature according to weather changes throughout the year. 3) Open windows for natural ventilation and turn the CD off during transitional seasons. 4) In winter, increase the set temperature and do laundry during the discounted electricity hours (between 8 p.m. and 8 a.m.) to save electricity costs. 5) The design of the HVAC system should be as simple and intuitive as possible, allowing users to reduce manual operation and mode conversion, otherwise, misoperation could occur, resulting in operating problems and an increase in energy consumption. Such operating strategies are publicly recommended to more residents to improve the operating efficiency of their apartments and achieve the purpose of energy-saving and reduction of CO2 emissions. Hence, user’s manuals are delivered to improve energy-saving behaviours.
Highly efficient thermal insulation, passive doors and windows, high level of airtightness, TB-free design and construction together with CD ensure that this project results in high energy efficiency and high IEQ. In addition, the commissioning of the CD that was carried out in the winter of 2020 provided the necessary guarantee for smooth operation this winter. Therefore, PHPP simulations and construction quality control are important methods to realize successful PHs.
As mentioned above, passive technology and active performance optimization provide an explicit path to promote energy-efficient buildings – PHs, which can be applied not only in cold climate zones but also all kinds of climate zones. If the minimal amount of energy consumed by PHs can be covered by renewable energy, then the building can reach a level of net-zero energy consumption.
The research results of this article are only based on the monitoring of the first heated winter. The project should be continuously monitored for 2–3 years including cooling energy consumption, and more feedback from residents on usage habits can be obtained through questionnaires.
Conclusions
The PH residential building is monitored concerning the energy performance. The main conclusions are as follows: 1. This PH building operates properly in the cold climatic region and shows great energy-saving potential; meanwhile, it also provides a comfortable indoor environment. The SHD is only 13.7% of local conventional GB buildings, resulting in an 86.3% energy-savings. The total site energy consumption for the whole building is only 30.8% of the GB building. So, PH technologies can be widely promoted in cold climate zone in China. 2. When the occupancy rate of this PH building is 47%, the SHD is 28 kWh/(m2·a). The SHD generated in initial PHPP design was 8 kWh/(m2·a), the SHD of updated PHPP was 12 kWh/(m2·a) and the monitored SHD was 21.3 kWh/(m2·a). The monitored SHD was 9.3 kWh/(m2·a) higher than the simulated in updated PHPP. The main reasons for the difference in SHD are construction moisture, users’ behaviour and occupancy rate. 3. By comparing the simulation results of PHPP and IBE, a deviation was found. This project provides evidence that an update of IBE is desirable. Hence, PHPP is always recommended for the design of PHs. The study also indicates that the performance-oriented design, refined construction and robust system commissioning are prerequisites and favourable guarantees for realizing reliable PHs.
This case study provides a path to the actualization of the ‘Carbon emissions peak before 2030 and carbon neutrality before 2060’ targets. If more PHs could be built and monitored in different climatic zones in China in the future, the accumulated data would help to optimize the design and construction of PHs in different regions, resulting in improved savings and energy efficiency.
Footnotes
Acknowledgements
We thank all of colleagues from the Sino-German United Group in Qingdao for opening the PH building district and its drawings for us. We also thank the colleagues from PHI for their support in the PHPP simulation. We would also like to thank all of the residents of this PH building for their friendly cooperation during the monitoring period.
Authors' contributions
Fei Han undertook the main review tasks, writing and analysis of the monitoring. The monitoring and the commissioning of the HVAC were carried out by Bin Liu. Georgios Dermentzis approved the monitoring process and results. Wolfgang Feist and Rainer Pfluger contributed to the conception and reviewed the results.
Declaration of conflicting interests
The author(s) declared no potential conflicts of interest with respect to the research, authorship, and/or publication of this article.
Funding
The author(s) received no financial support for the research, authorship, and/or publication of this article.