
Abstract
Thermal comfort is essential to increase the modal share of rail transport by attracting more passengers. In this study, three novel low-momentum ventilation concepts were analyzed regarding the thermal comfort of railway passengers and compared to a conventional ventilation setting. Using an experimental approach, objective measurements of climate parameters and subjective assessments from 146 test subjects in a generic train compartment were analyzed. Results revealed significant differences in perceived thermal comfort amongst the four ventilation settings. Subjects reported comparatively higher thermal comfort in hatrack integrated low-momentum ventilation and hybrid ventilation (HV) than in cabin displacement ventilation (CDV) and microjet ventilation (MJV). Vertical temperature stratification was strongest in CDV, leading to losses in the comfort of the lower body parts. In MJV, some temporary and local exceedances of air velocities were observed, which contributed to lower comfort evaluations at heads and shoulders. For all ventilation settings, warmer air temperatures were preferred. Our findings demonstrated that subjective comfort assessments reasonably complement earlier results derived from thermal manikin studies. Therefore, low-momentum ventilation, especially in terms of HV, has the significant potential to improve thermal conditions for long-distance journeys in passenger rail cars.
Keywords
Introduction
To achieve a competitive and sustainable transport system in Europe, the White Paper on transport was published in 2011. 1 In its evaluation 10 years later, the defined roadmap had already initiated some progress; nonetheless, ‘the goal of tripling the number of kilometres of high-speed rail lines by 2030 is unlikely to be reached without additional significant efforts’. 2
One important aspect determining the attractiveness of long-distance rail journeys is the thermal comfort of passengers in a rail train carriage.1,3–5 The thermal situation influences the passengers’ well-being immediately as it can cause discomfort due to heat (e.g. generated by solar radiation or high passenger density), coldness or air draughts. With new flexible interior concepts and the increasing use of (individual) electronic devices, new demands arise for ventilation because larger heat loads are created in the rail car, which need to be dissipated effectively. 6 However, conventional microjet ventilation (MJV) systems, which create a mixing air distribution, are considered inefficient in this regard compared to other systems.7,8 Furthermore, MJV can generate uncomfortable draughts and noise, as experienced in an aircraft cabin.9,10 Therefore, this study analyzed three novel ventilation concepts for long-distance trains regarding passenger thermal comfort.
Thermal comfort in passenger rail cars
Comfort parameters are defined in relevant norms such that ideal climate comfort is provided for main line and commuter rail systems in different environmental conditions. In EN 13129, for example, comfort parameter definitions are specified for main line rolling stock, that is, long-distance trains. 11 Parameters are defined explicitly for the occupant zones of rail cars and relate to sedentary persons. The mean interior temperature can vary between 22 and 27°C, depending on outside temperatures. As a function of the mean interior temperature, air speed can vary between 0.25 and 0.6 m/s, and relative humidity ranges between 45% and 65%.
In the ASHRAE Standard 55, thermal comfort is defined as ‘that condition of mind that expresses satisfaction with the thermal environment and is assessed by subjective evaluation’.
12
Based on this definition, a working concept for the assessment of thermal comfort, which had been developed in the context of thermal comfort in the aircraft cabin, served as a conceptual framework for our study.
13
It illustrates the interplay of climate conditions, possible moderators and thermal comfort (Figure 1): A certain climate situation is objectively defined by several ambient climate parameters (e.g. (radiant) temperature, air velocity and humidity). These climate conditions have an effect on the passengers and are perceived individually regarding their intensity (climate sensation: high or low). As a second step, an evaluation takes place, where the individual determines how comfortable a single parameter is. Climate sensations and comfort evaluations can be influenced by a wide range of moderators as, for example, individual and environmental conditions, which are mentioned exemplarily in Figure 1. Finally, the individual’s thermal comfort can be derived from an integration of the comfort evaluations. Working concept for the assessment of railway passengers’ thermal comfort.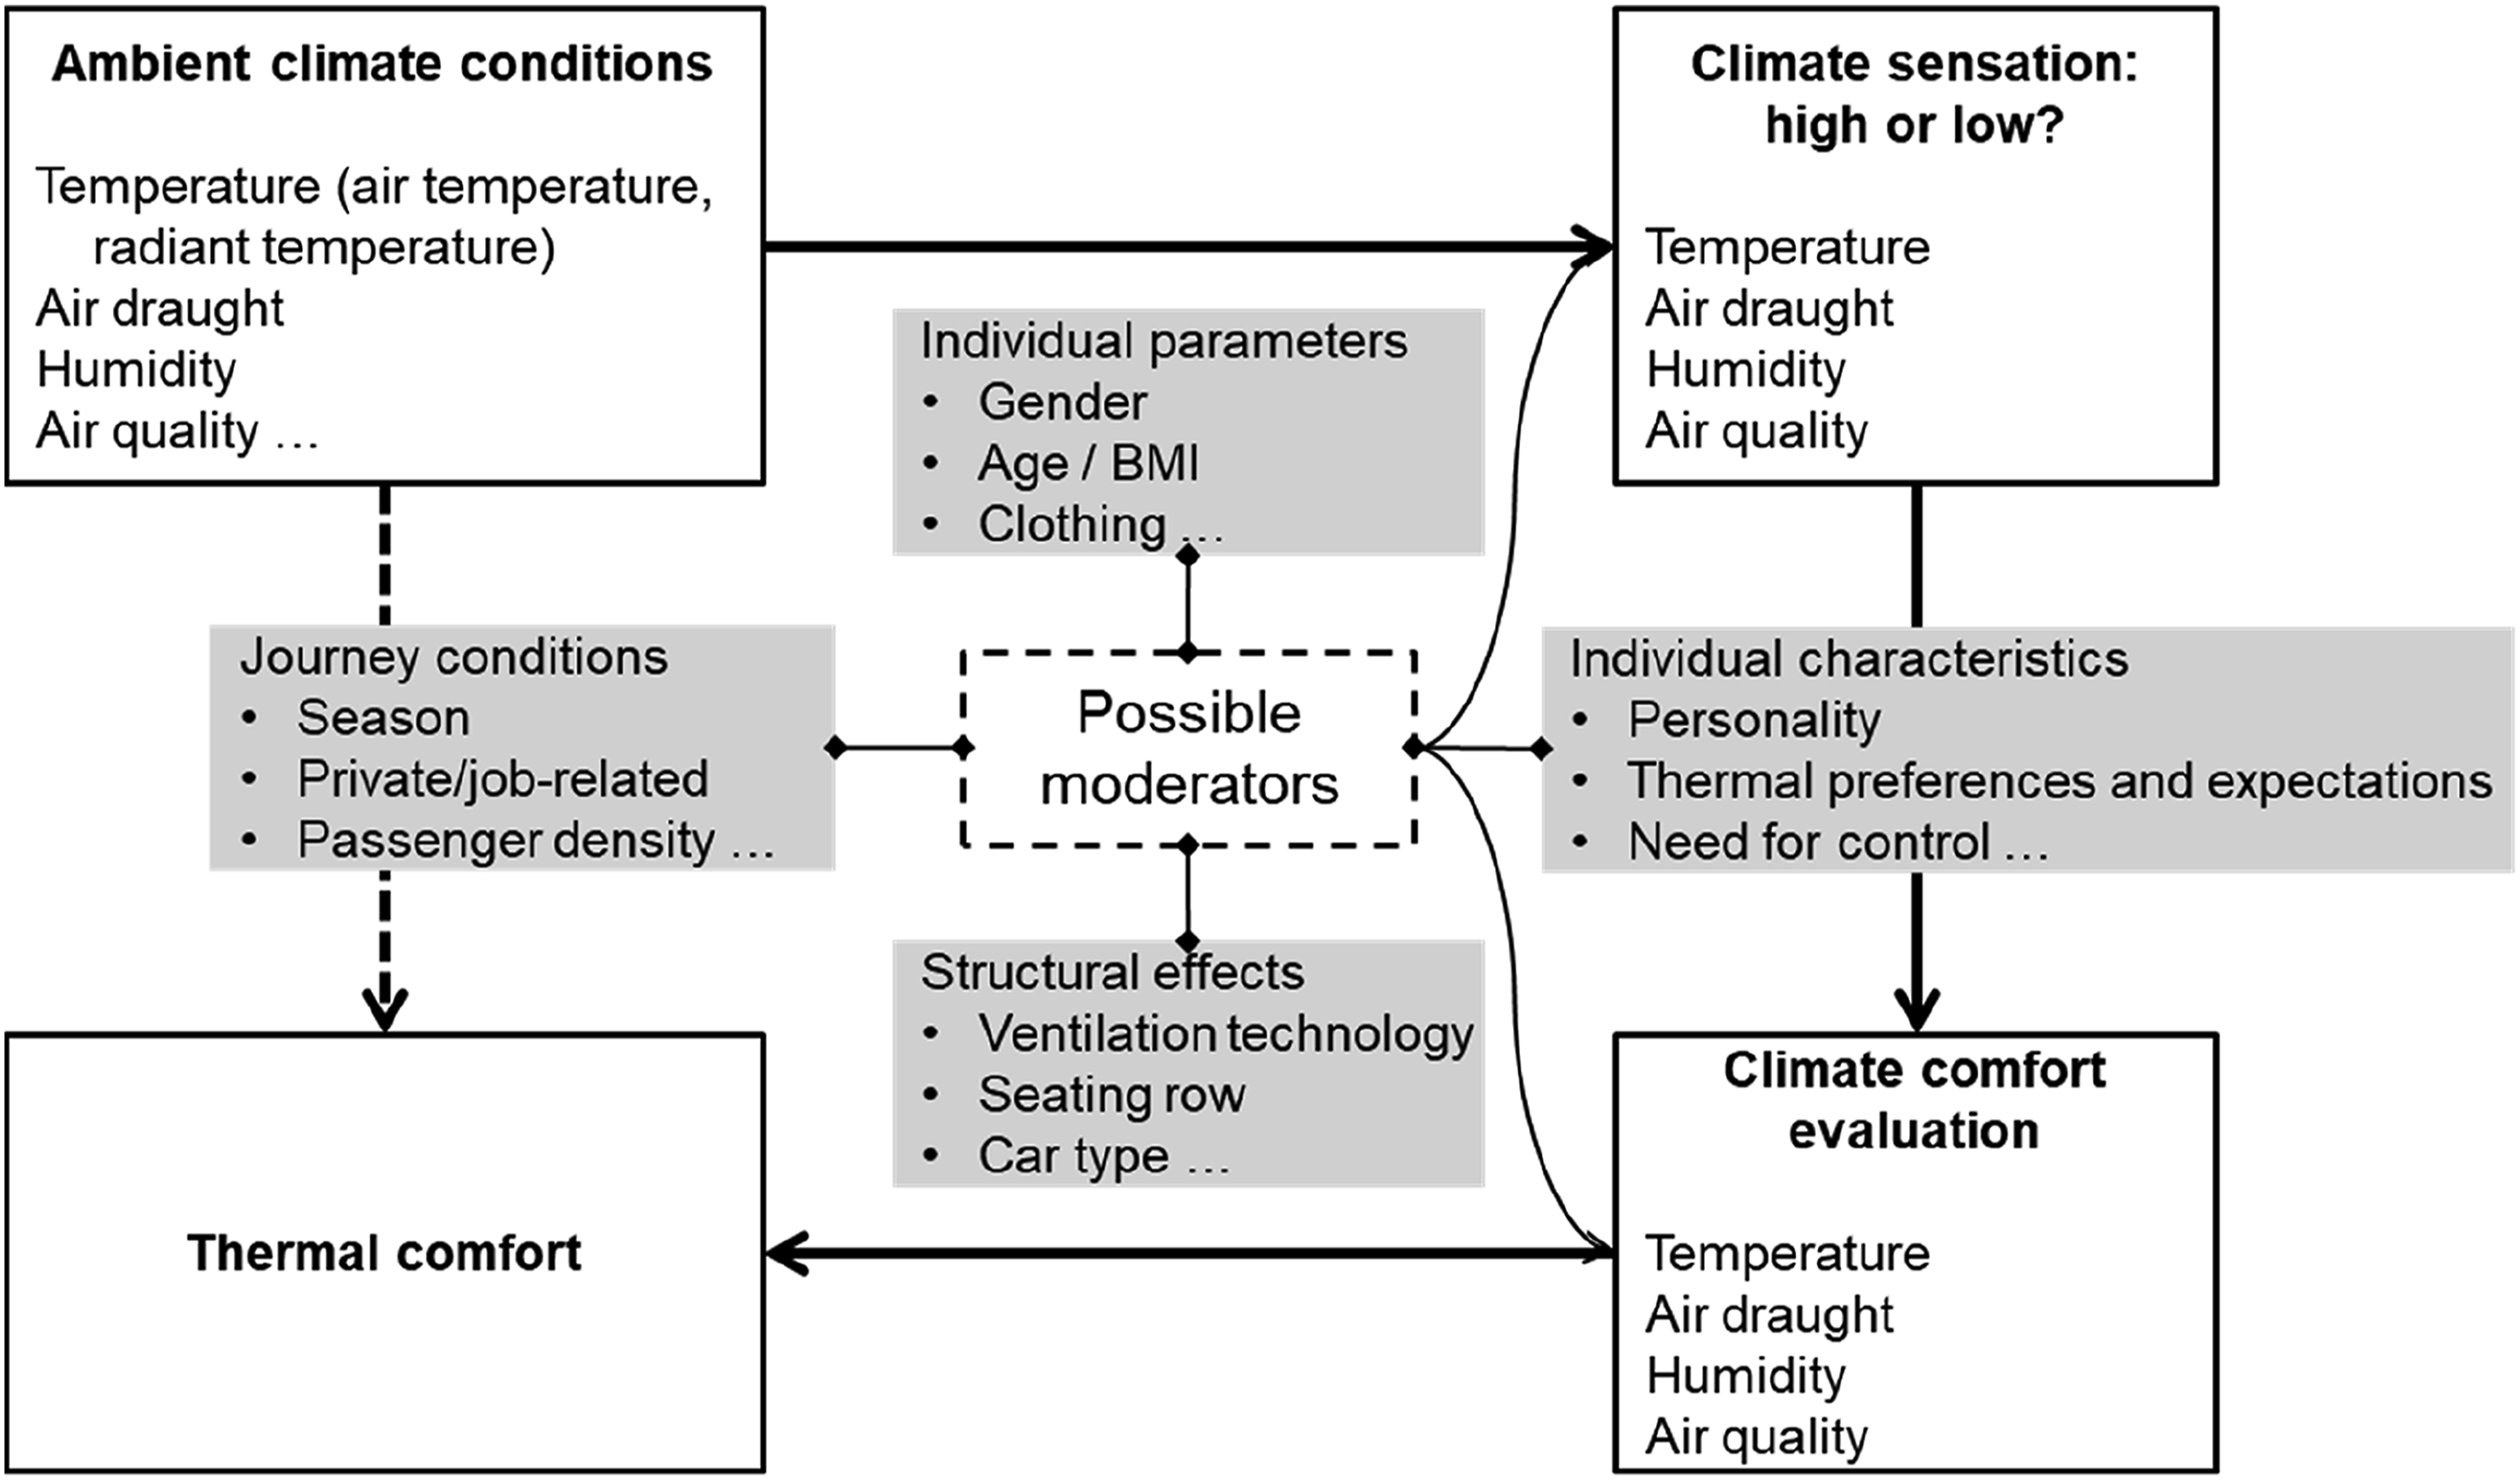
Until now, few empirical studies using test subjects have dealt with the thermal comfort of railway passengers. Thermal comfort and air quality in Chinese sleeping cars were analyzed by Ye et al., 5 who found that about 60% of passengers (N = 91) regarded their environment as comfortable during actual travel conditions with respect to these variables. Almost 53% wished for more fresh air, and 23% preferred improved air flows, especially in the middle of the passenger car.
In another study, a field survey of 2129 passengers in short- and long-haul trains and buses was conducted in Taiwan. 14 One main finding was that the temperature comfort zone ranged between 22.4 and 30.1°C in long-haul vehicles. In addition, higher temperatures, strong solar radiation and low air velocities were the primary reasons for the passengers’ thermal discomfort. As Nicol et al. 15 pointed out earlier, a globe temperature of 30°C should not be exceeded in a crowded train carriage, especially with standing passengers, to avoid an undesirable comfort level and even physiological hazards.
In a British field study, thermal sensations were assessed from 32 test subjects during a journey on an East Midlands Train. 4 During the trip, the PMV (predicted mean vote) remained similar across different outside conditions, staying within comfort limits (−0.5 > PMV <0.5), although passengers tended to prefer a slightly warmer train environment.
In a controlled laboratory environment, the comforting effect of locally installed infrared (IR) heating panels in combination with cabin displacement ventilation (CDV) was analyzed. 16 The results revealed that the IR panels compensated a cold-feet effect of floor-based CDV, which led to increased thermal comfort. Furthermore, when subjects were given control to adjust the IR temperature, the number of satisfied passengers increased significantly.
Low-momentum ventilation concepts for passenger rail cars
One focus of technical development has been the optimization of ventilation efficiency and reduction of air velocities in the passenger rail car using novel low-momentum ventilation concepts.7,17,18 These concepts provide thermal environments with lower air velocities and better spatial distribution of climate parameters in the passenger zone, enabling higher levels of thermal comfort, for example. 18 The advantages of a hybrid ventilation (HV) mode with respect to air distribution and energy utilization were recently demonstrated by Chang, Yi and Liu 8 in a simulation study of subway vehicles. A substitution of the common MJV with new ventilation systems can reduce energy consumption by the heating, ventilation and air conditioning (HVAC) system, owing to improved efficiency of heat dissipation from the passenger zone. 7
In a recent experimental study, four low-momentum ventilation concepts were implemented in a generic train compartment and analyzed using thermal manikins. 7 The following five criteria were assessed to reflect conditions of thermal comfort: vertical temperature stratification, air velocities, horizontal temperature distribution, heat removal efficiency and integration capability. Results were compared with findings for conventional MJV. The authors found that for all low-momentum concepts, air velocities were well within defined comfort limits, while the velocity threshold defined in EN 13129 was temporarily exceeded with MJV. 11 Low-momentum ceiling ventilation (LMCV) and hybrid concepts (HV, air supply 50% via LMCV outlets and 50% via CDV outlets) performed well with regard to all criteria and qualified as the best approaches. The conventional MJV concept performed slightly worse than the low-momentum ventilation concepts. 7 The results from this study provide a good overview of the strengths and weaknesses of new low-momentum ventilation approaches. However, regarding ASHRAE’s definition of thermal comfort, 12 the verification of these results with authentic feedback from human subjects is indispensable.
Study objectives
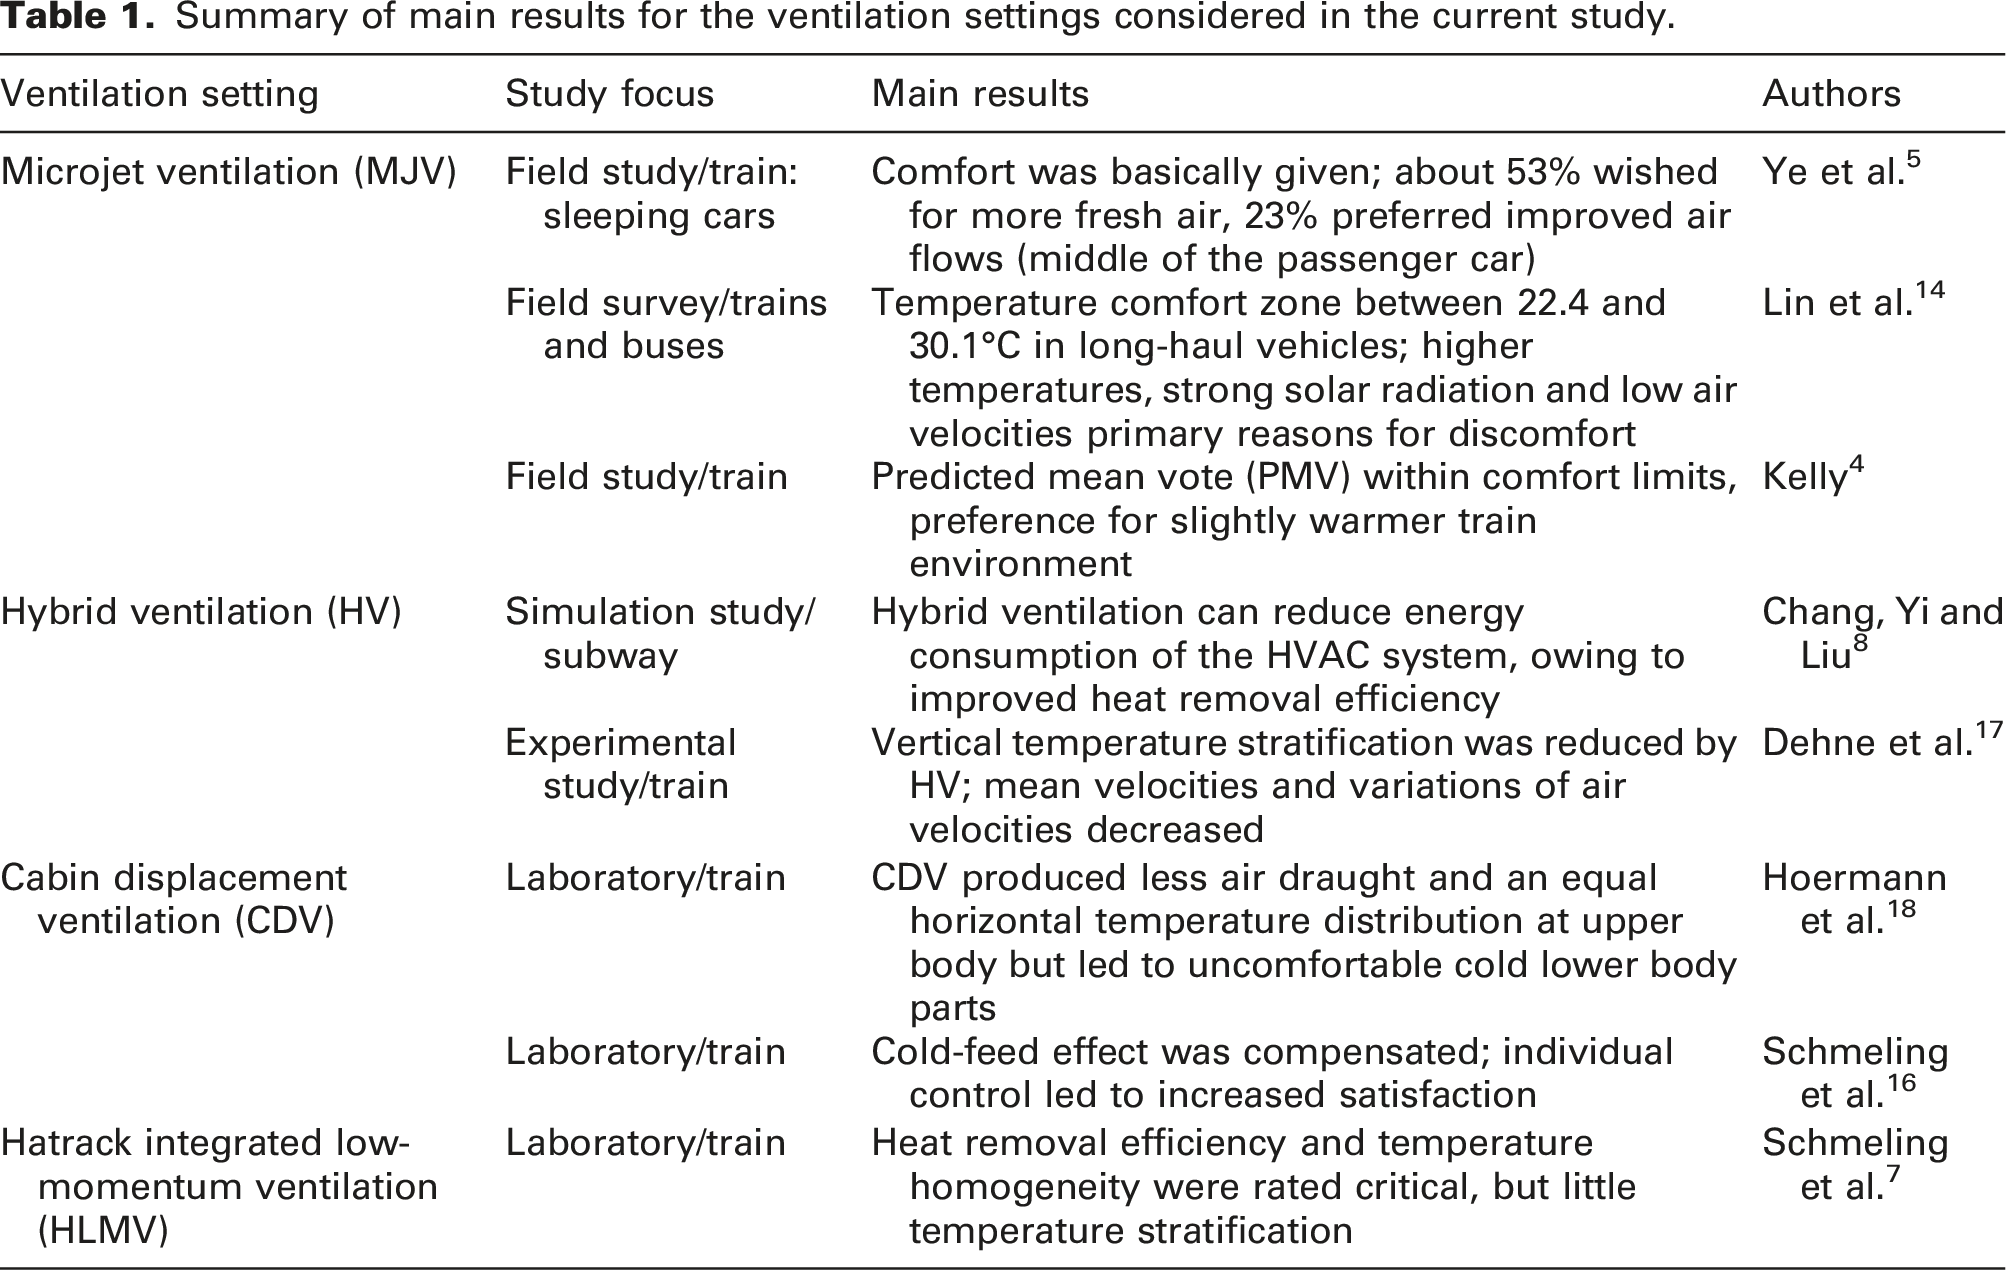
Summary of main results for the ventilation settings considered in the current study.
Our focus was to identify the best ventilation concept based on the subjects’ sensations and evaluations of the surrounding climate parameters. In addition, objective measurements were performed to document given climate conditions in the passenger zone. A further aim was to align passenger sensations to the objective measurements performed and the results obtained from thermal manikin studies.
We aimed to answer the following research questions: Do the advantages and disadvantages of different ventilation concepts as determined in thermal manikin studies translate to the subjective perceptions of humans regarding thermal comfort? Are the variations of ‘objective’ comfort parameters, like air velocity, mean air temperature and temperature stratification in low-momentum ventilation and MJV, perceived by human subjects? How are they evaluated with respect to ‘subjective’ thermal comfort? Do individual characteristics influence thermal sensations?
Methods
The present research was based on eight experimental sessions conducted as part of the German Aerospace Center (DLR) project Next Generation Train (NGT). 19 In each single session, the specific climate conditions for one of four different ventilation concepts were examined to compare corresponding thermal comfort parameters as assessed by human subjects.
Laboratory environment
All eight experimental sessions were conducted in a generic train laboratory at the DLR Institute of Aerodynamics and Flow Technology in Göttingen, Germany. The generic train laboratory represents a section of a passenger rail car consisting of six rows with two-by-two seats in each row separated by the middle aisle (Figure 2).20,21 Furthermore, it supports the installation of different ventilation concepts and sensor technologies so that a variety of climate conditions can be generated and maintained in a highly standardized manner. In each experiment, 20 human subjects were seated in rows 2 to 6 of the generic train laboratory, and four thermal passenger manikins were placed in the front row to simulate additional ‘standard’ passengers. A heat output of 75 W of each manikin was controlled and monitored during the experimental sessions.7,21 All experiments took place during the transitional season of either September/October or March/April in a moderate climatic zone (Göttingen, Germany). Transitional seasons were chosen to avoid confounding effects of larger outside temperature variations across the experimental sessions. Generic train laboratory with test subjects. © DLR.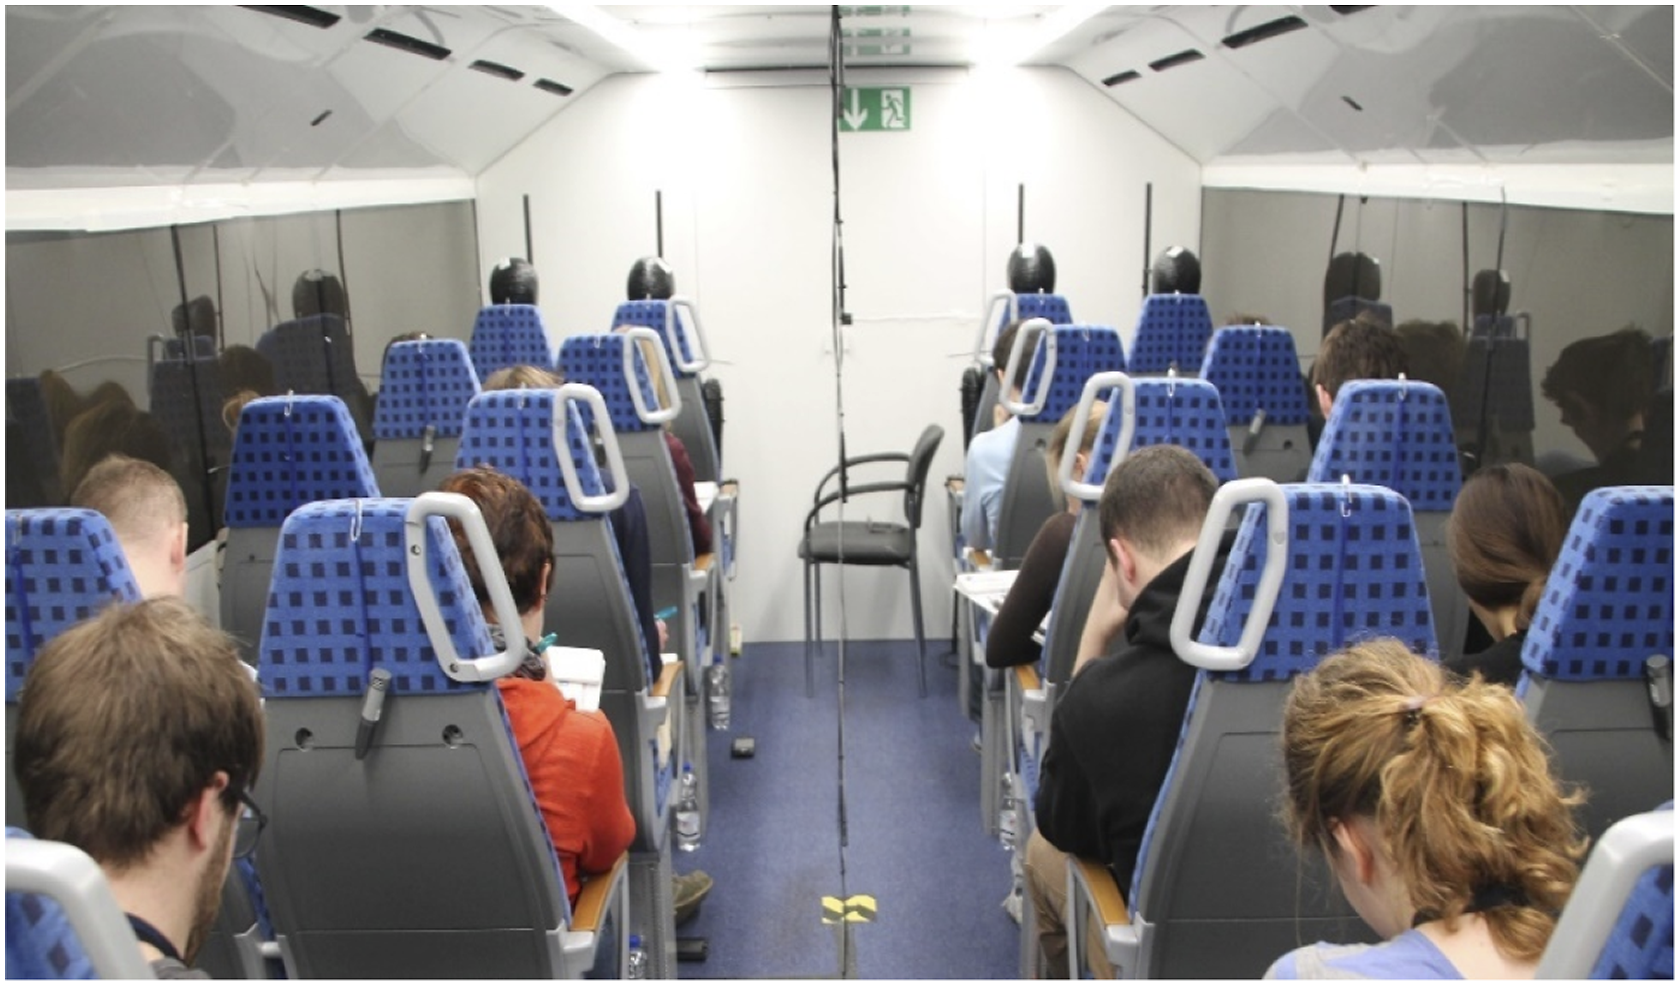
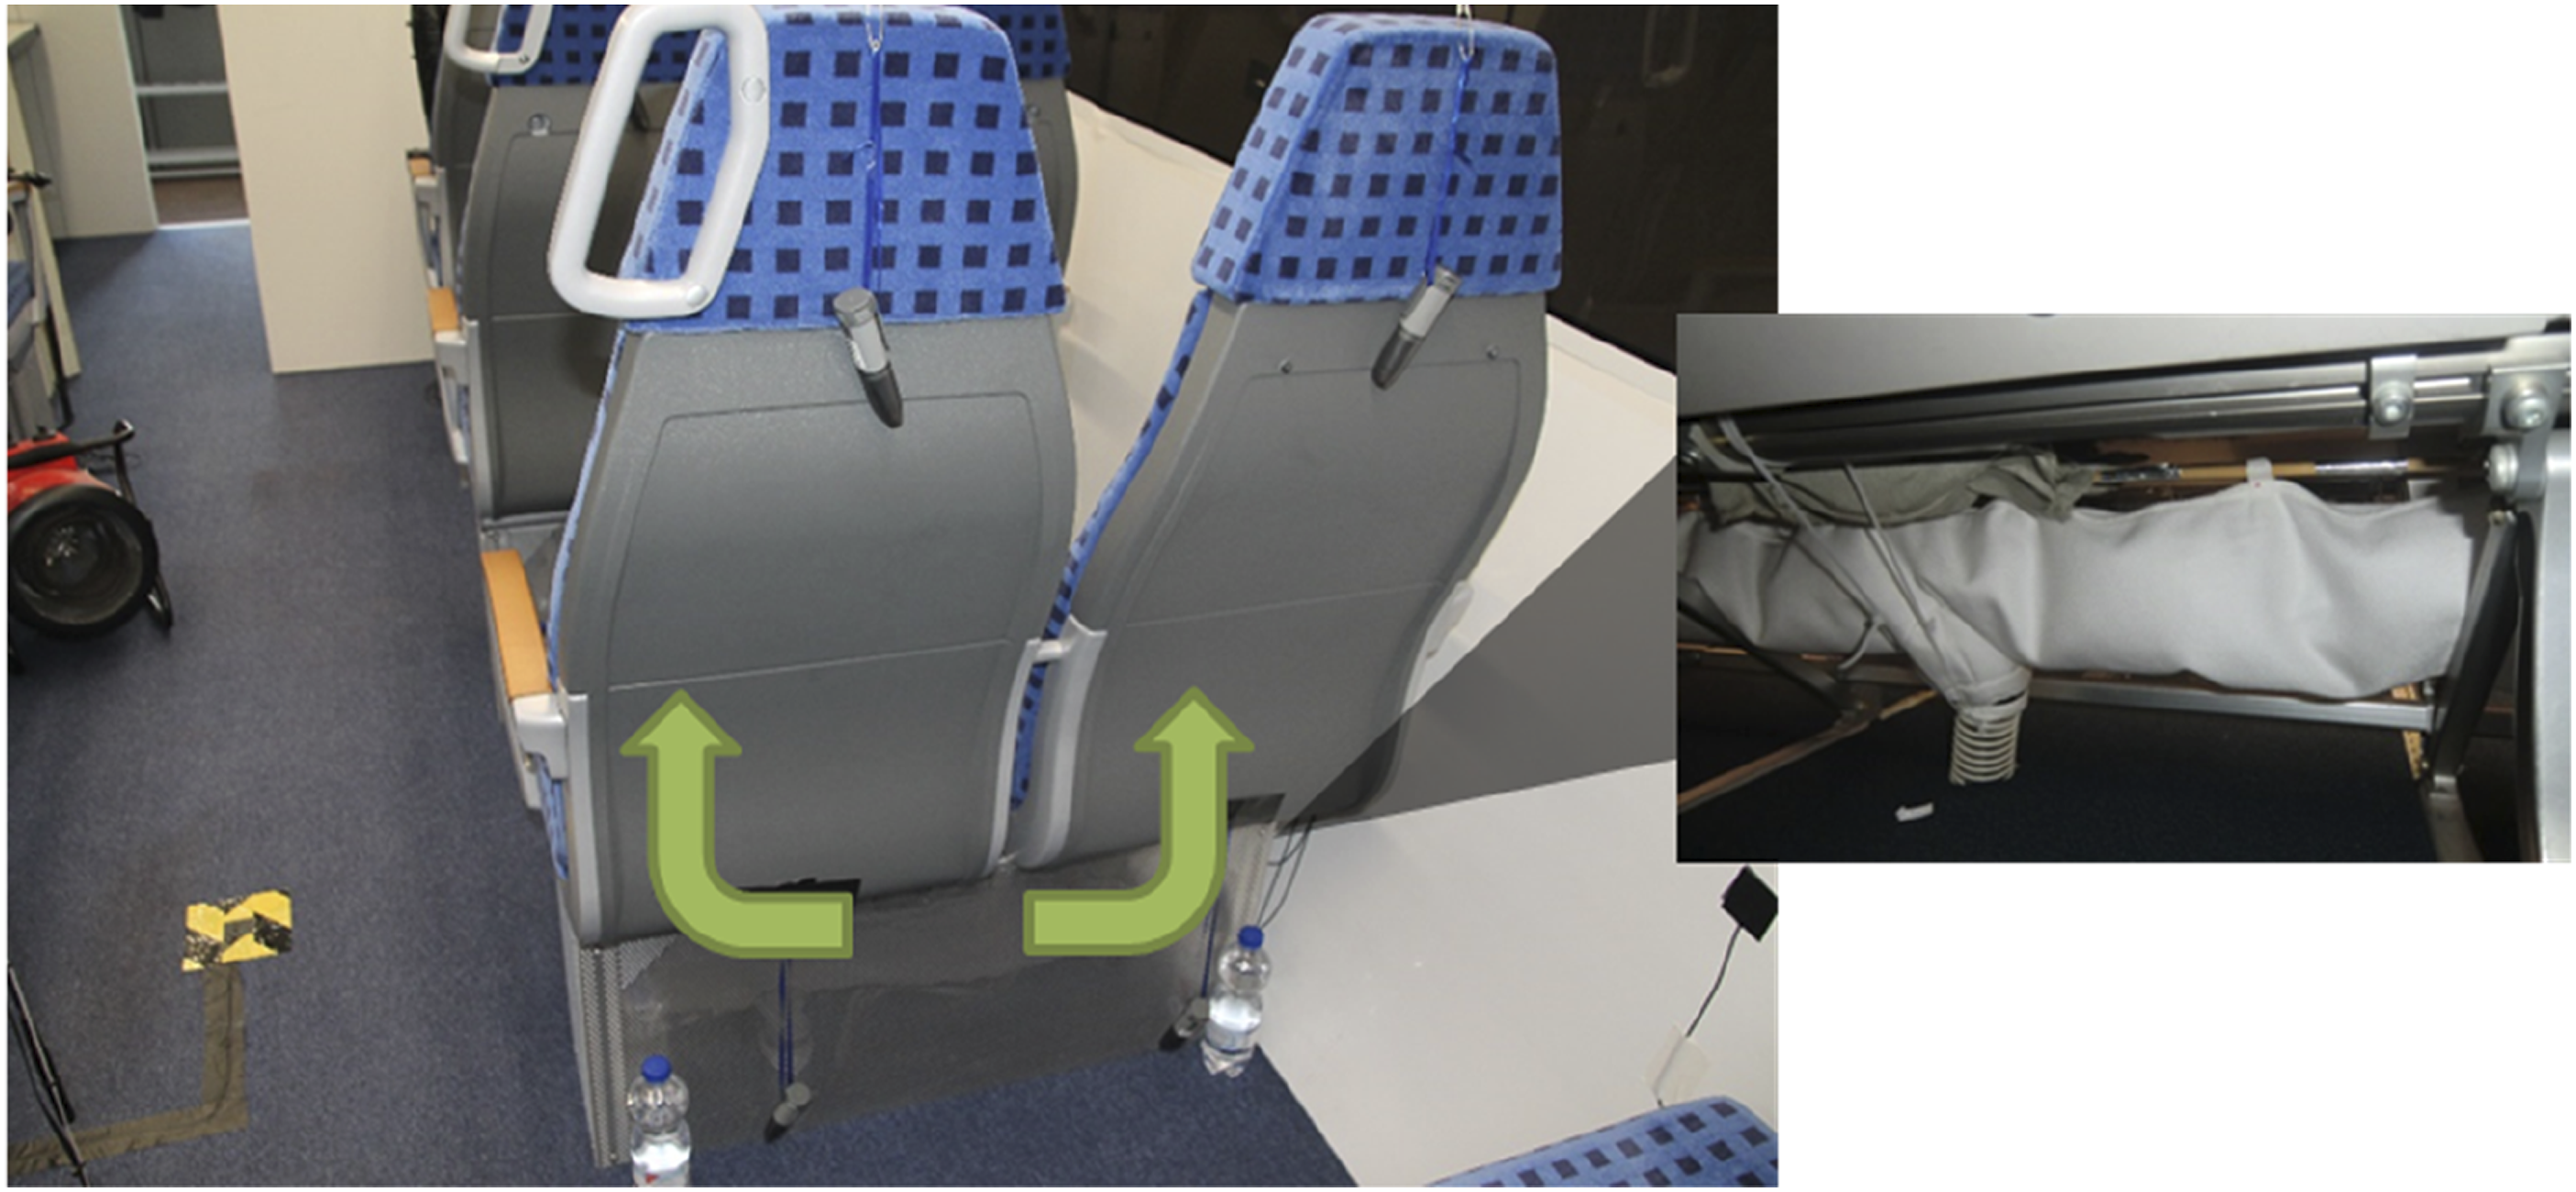
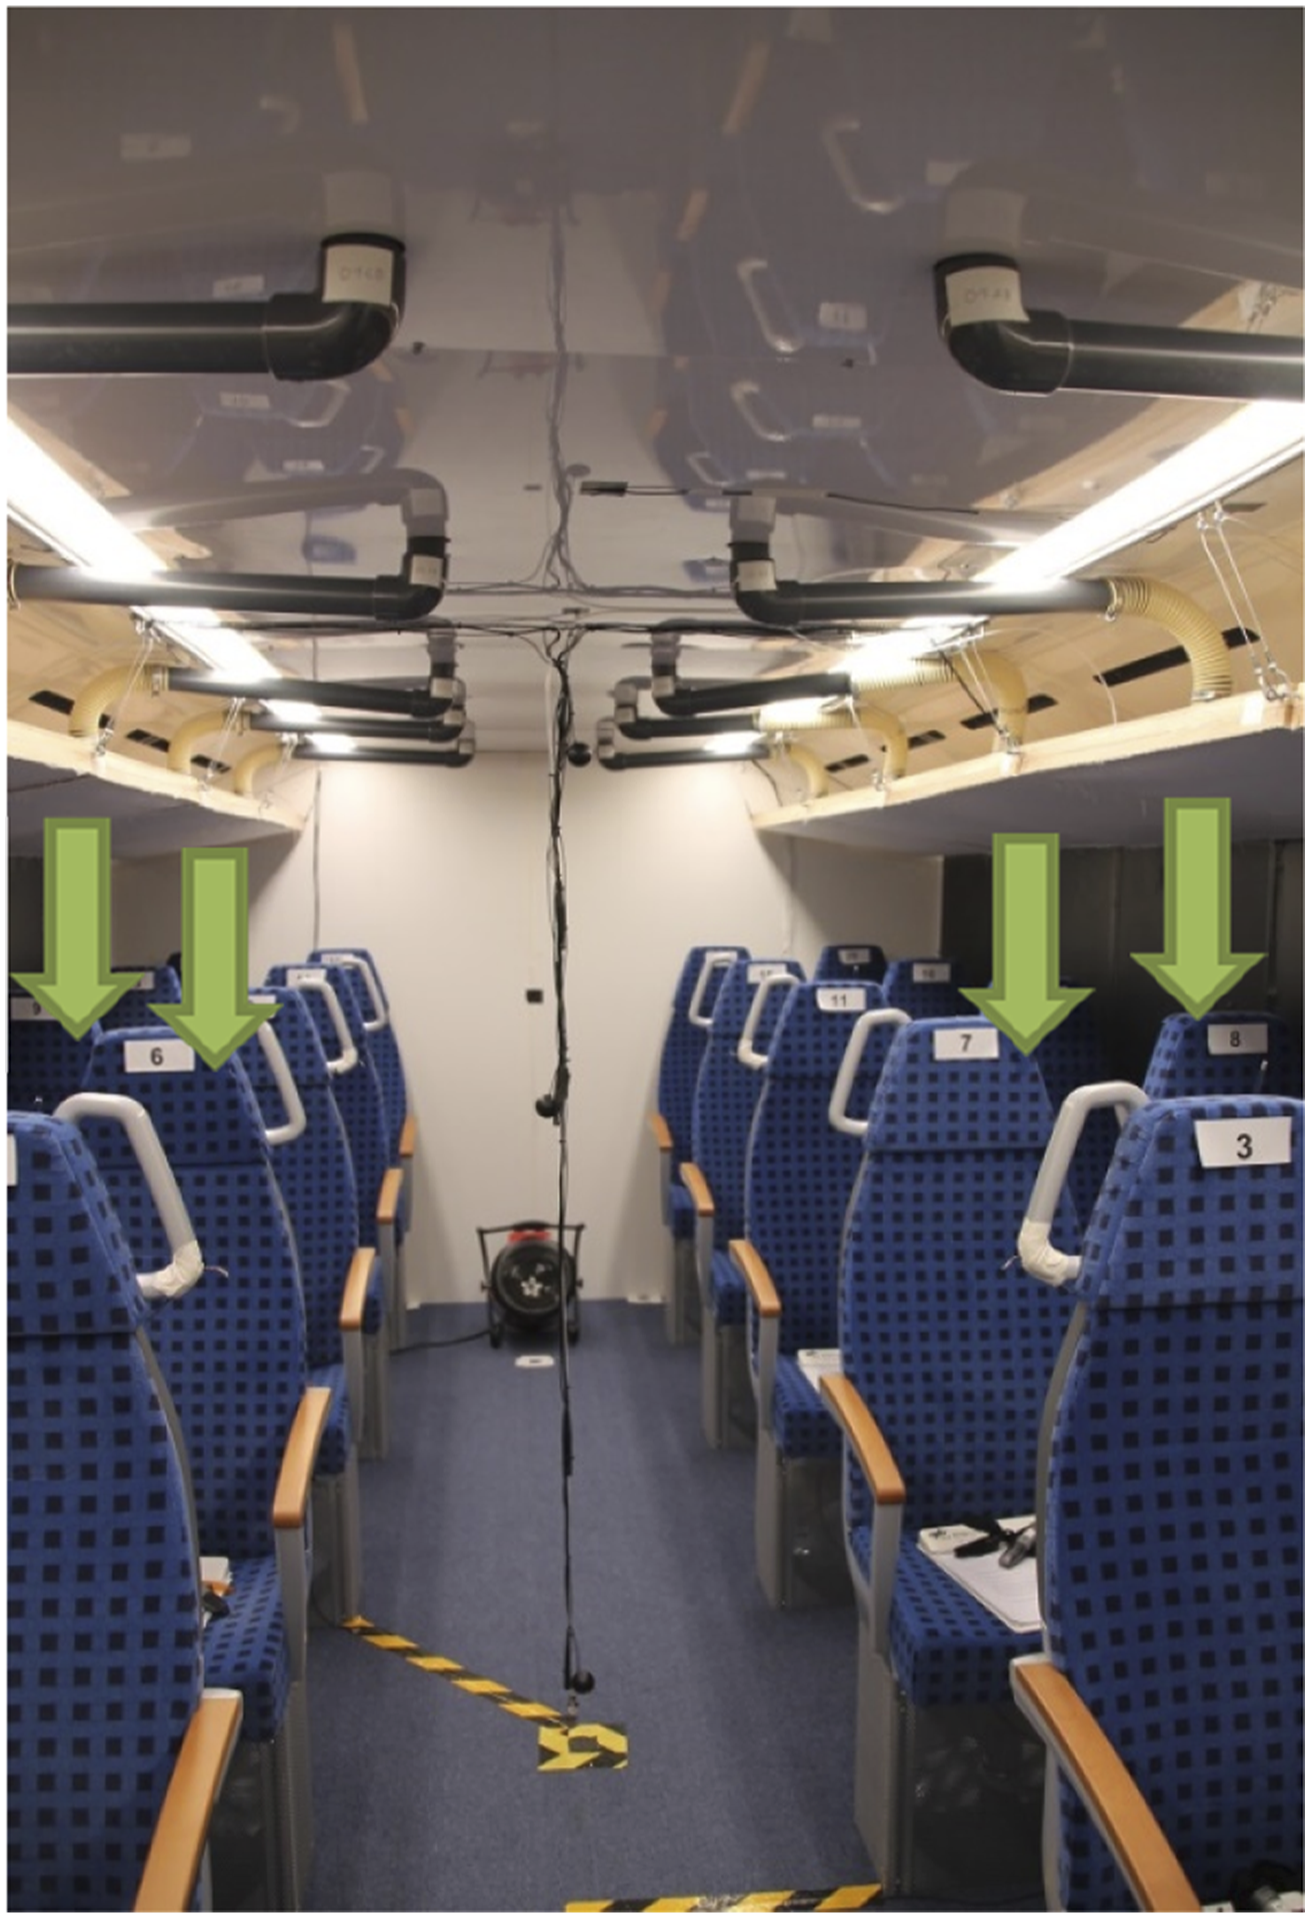
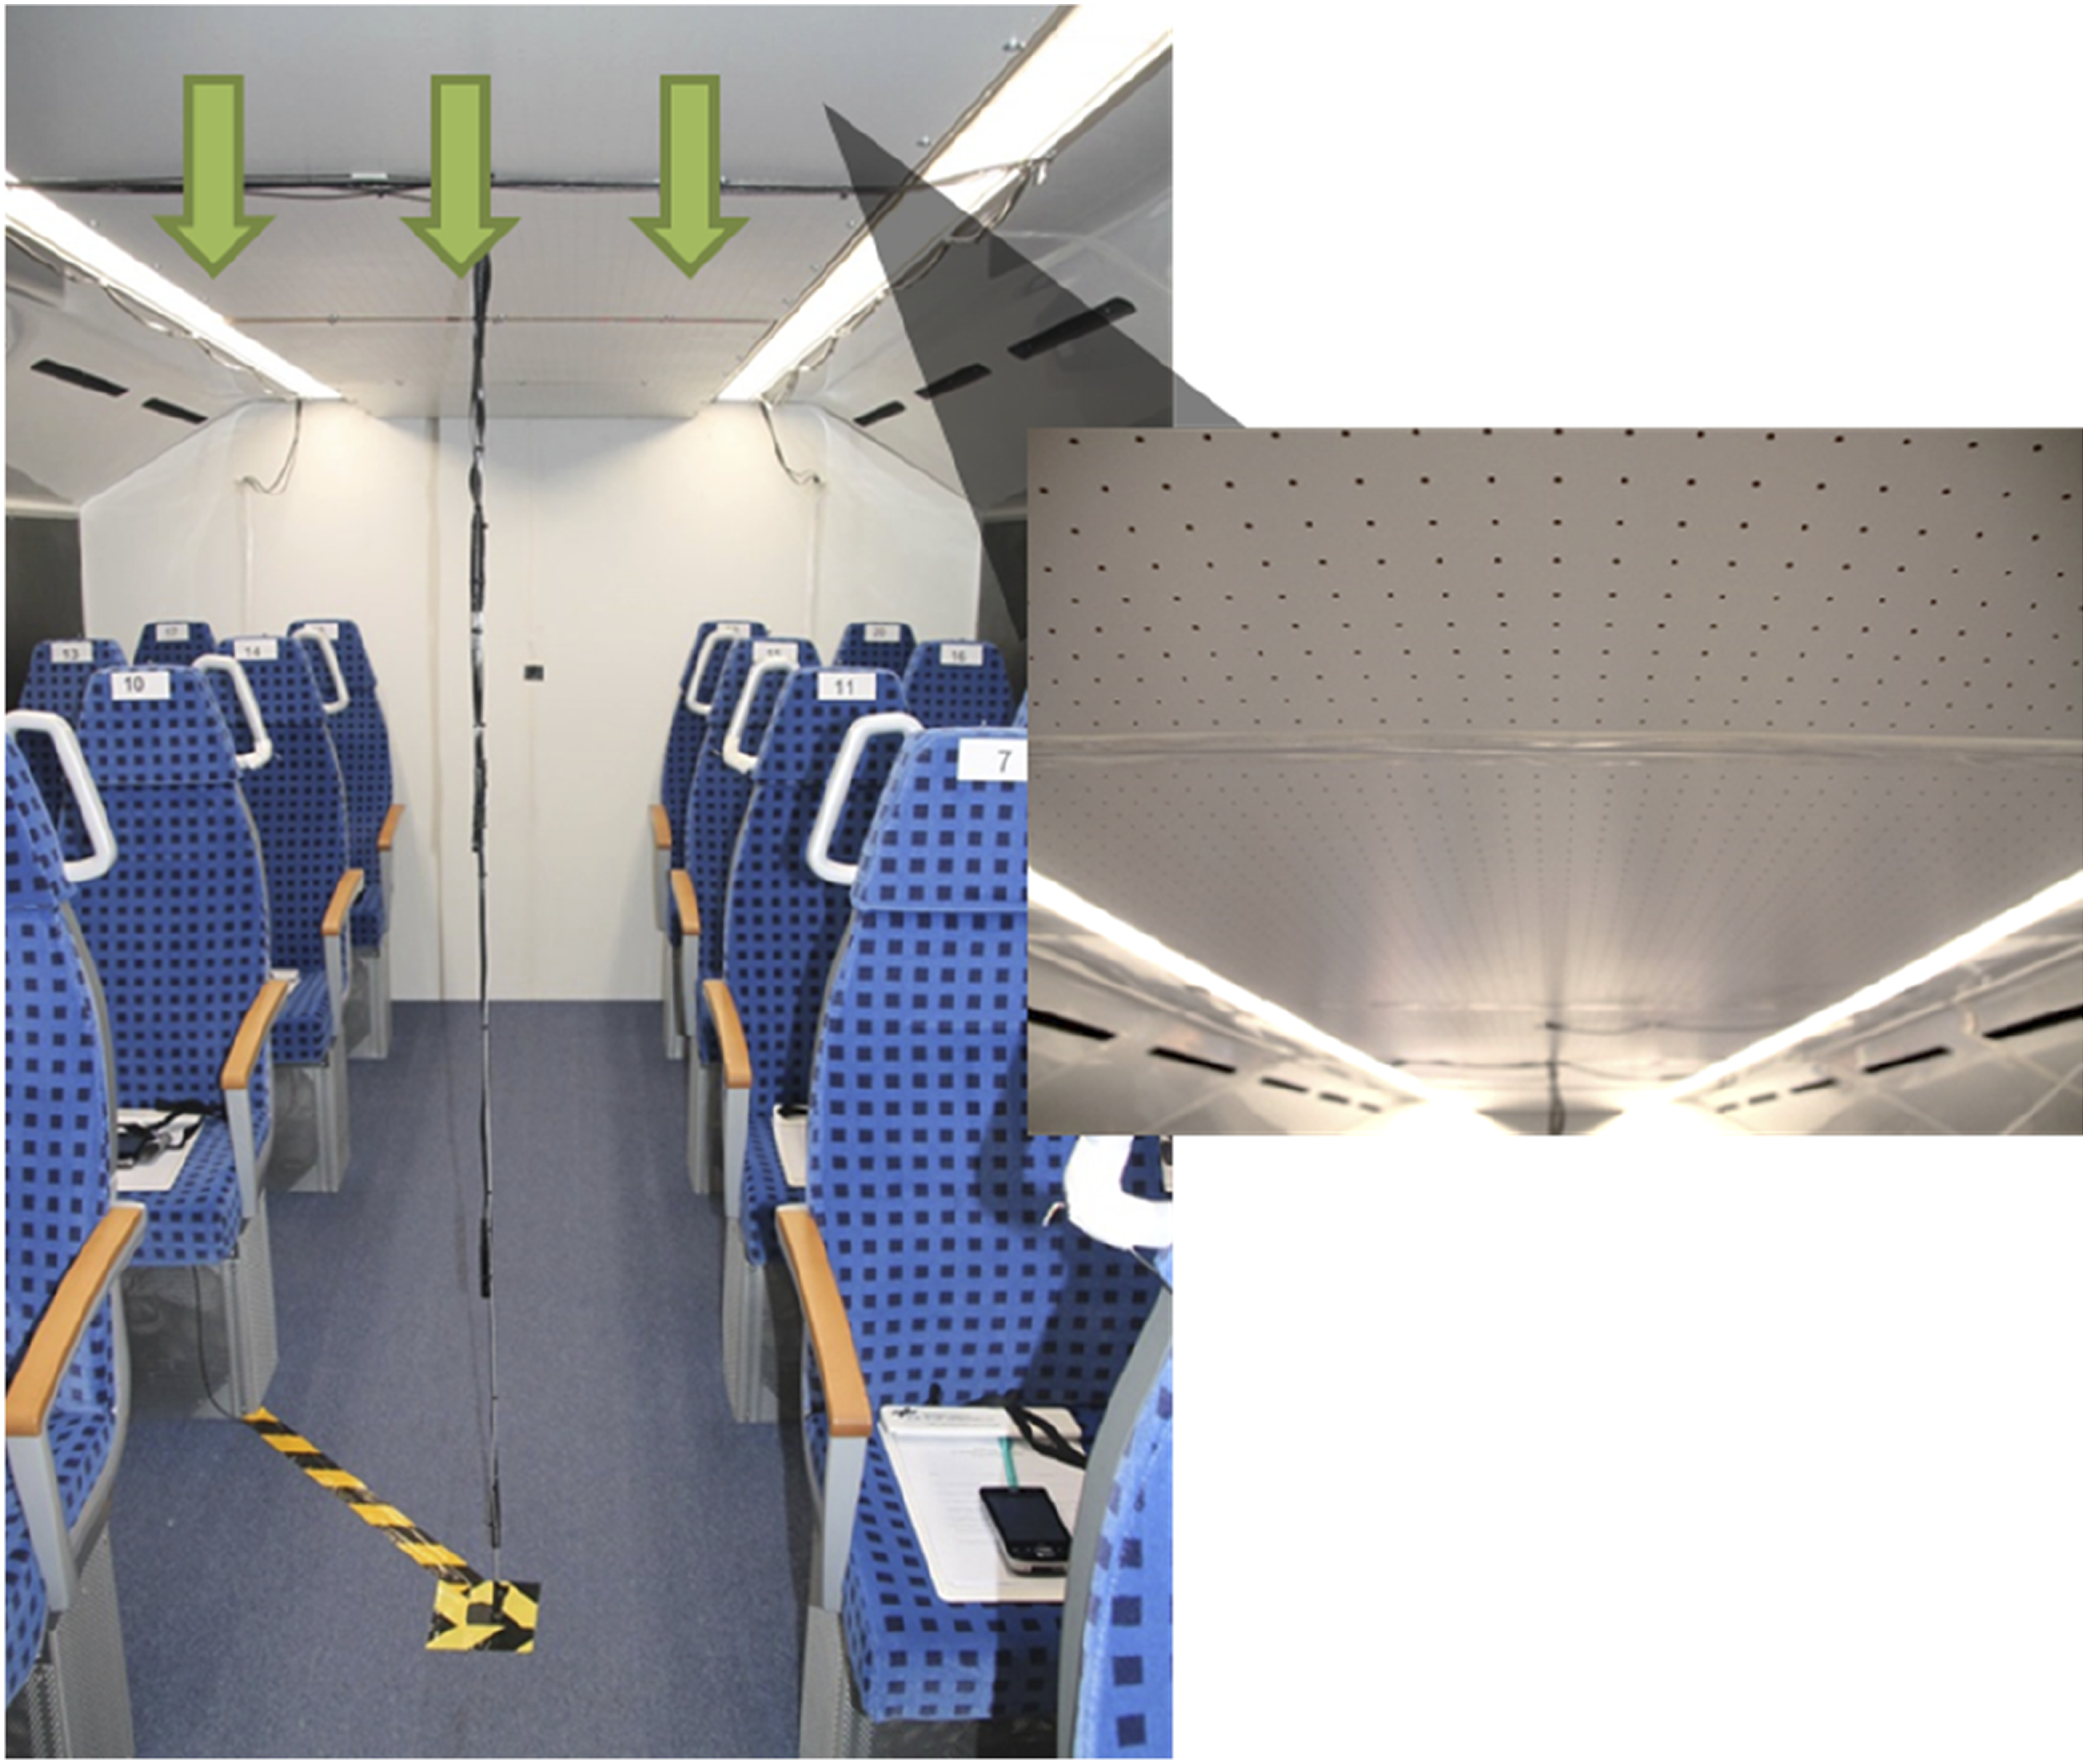
Four different ventilation concepts were examined: three variants of low-momentum displacement ventilation and a high-momentum MJV concept with mixing air distribution. These ventilation concepts are briefly described in the following. Comprehensive overviews of the generic train laboratory and the investigated ventilation concepts were published earlier.7,20,21 • In the floor-based cabin displacement ventilation (CDV), T-shaped air bags are mounted under the passenger seats, which discharge the fresh air with low momentum at the floor level (Figure 3). Through natural convection, the cool fresh air gradually ascends from the floor along the passengers to the outlets in the ceiling edges. • Hatrack integrated low-momentum ventilation (HLMV) uses air inlets mounted to the hatracks, which release the fresh air through a layer of fabric membranes at a low momentum overhead (Figure 4). The fresh air trickles to the passengers below. The contaminated air leaves the compartment through outlets close to the ceiling, which are visible as horizontal slots on both sides of the ceiling. • Hybrid ventilation (HV) is a combination of CDV and HLMV. Based on earlier findings, 70% of the total air supply is displaced through the HLMV and 30% through the CDV (cf. Figures 3 and 4). Contaminated air leaves the compartment through outlets close to the ceiling. • Microjet ventilation (MJV) releases fresh air as microjets through a perforated ceiling above the aisle. The contaminated air leaves the passenger compartment on the left and right sides of the ceiling. Compared to other ventilation concepts, the air is released at a significantly higher momentum and creates a mixed air distribution. MJV is a commonly used ventilation concept in trains (Figure 5). CDV in the generic train laboratory. © DLR. HLMV in the generic train laboratory. © DLR. MJV in the generic train laboratory. © DLR.
Sample
All participants for this study were recruited via an online platform. The sampling criteria were as follows: fluent German, age between 18 and 55 years, gender distribution equal, completed secondary education, maximum height 1.9 m and good health status. In total, 160 subjects participated in this study, 20 in each climate condition. Half of the subjects were female (n = 79), and the other half were male (n = 81). To enhance the quality of the subjective comfort assessments, a data cleaning procedure was conducted. 22 This step was effective in the identification of careless or otherwise obscure responses in subjective data in several independent studies. 23 We calculated four indicators of aberrant response behaviour, which marked subjects with peculiar invariance or repetitive contradictions in their ratings. Consequently, 14 subjects were flagged and filtered out. A total sample of 146 subjects (74 female and 72 male) remained. In order to determine the optimal sample size for the statistical tests, a power analysis according to Cohen was performed. 24 The optimal sample size for the analysis of variance depends on the following conditions: (a) the type I error of falsely rejecting a correct null hypothesis was set to p = 0.05; (b) the type II error of not rejecting a wrong null hypothesis was set to p = 0.20 and (c) only effects that are at least medium (η2 = 0.06) or large (η2 = 0.14) are considered relevant. According to Cohen’s power tables, 24 44 subjects per group are required for a medium effect and 18 subjects per group for a large effect. Hence, a total sample size of 72–176 subjects across four ventilation settings is large enough to detect medium to large effects. The sample size of our study (N = 146) is within this range.
The ages of the 146 subjects ranged between 16 and 63 years (M = 33.6, SD = 12.8); their heights were between 158 and 192 cm (M = 175.5, SD = 8.6), and their mean body mass index (BMI) was 24.1 (SD = 5.0). The basal metabolic rate (BMR; M = 1594, SD = 256) was calculated with the Mifflin-St. Joer equation, which compensates for the influences of age and gender. 25 All participants were advised to wear shirts with long sleeves, long trousers and low-top shoes. Scarfs were not allowed. Thus, we aimed to ensure equivalent clothing conditions (≙ 0.8–1 clo). Subjects were compensated monetarily for their participation in the experiment.
Measurement instruments
Sensors
To monitor the objective climate conditions during the experiment, air temperature, relative humidity and air speed Va were recorded by different sensors. Air temperature T and relative humidity Rh% were measured once per minute with data loggers at each passenger’s seat and at the train compartment centre 110 cm above the floor (Easylog USB-2 logger with an accuracy ±0.5°C for temperature and ±3% for RH; cf. Figures 2 and 3). The mean air temperature TIM was calculated according to EN 13129 by averaging five of these sensors distributed equally along the compartment diagonal. 11 Additionally, PT100 temperature sensors were installed at the ventilation inlets (TIN) and outlets (TOUT, sensor accuracy ±0.2°C). Temperature stratification was assessed by further PT100 temperature sensors mounted at four levels, feet, knees, shoulder and head (TFeet, TKnees, TShoulder and THead), onto a rack in front of each seat of the first row and in the middle of the train compartment (cf. Figure 2). Air speed was measured using omnidirectional sensors in individual replications of the test scenarios, each with 24 thermal manikins (accuracy better than 0.04 m/s within the measurement range). These separate measurement sessions for each ventilation concept were necessary to avoid disturbances in the velocity profiles caused by moving subjects. The entire measurement system in the generic train laboratory included over 200 sensors for air temperature, humidity and air velocity, which were positioned to fulfil the requirements as described in EN 13129. Illustrations of the sensor positions in the vicinity of the subjects can be found in Schmeling and Bosbach. 21
Questionnaire
Thermal comfort was assessed with standardized rating scales via individual tablet computers. 26 According to our working concept (see Figure 1), and based on the scales originally introduced by Gagge et al. 27 (see also e.g. Schweiker et al.), 28 subjects were asked to rate two comfort aspects, climate parameter sensations and comfort evaluations, of three indoor climate parameters (air temperature, air speed and air humidity). The sensation aspect referred to how a climate parameter was perceived individually regarding its intensity (high or low). It was rated on seven-point scales including the following scale anchors: temperature: 1 = very cold, 4 = neutral, 7 = hot; air draught: 1 = not at all, 4 = neutral, 7 = very strong; humidity: 1 = very dry, 4 = neutral, 7 = very humid. Five-point scales were used for the evaluation aspect using the scale anchors 1 = very uncomfortable, 3 = neutral, 5 = very comfortable, which indicated how comfortable a climate parameter was for the subjects. Comfort assessments for temperature and air draught were collected locally with reference to different body parts (feet, thighs, shoulders and head) and globally concerning the whole train compartment; humidity was assessed only globally. Finally, an overall indoor climate satisfaction judgement was given on a five-point rating scale ranging from 1 = very dissatisfied to 5 = very satisfied. This satisfaction judgement and the climate parameter comfort evaluations (for temperature, air speed and air humidity) were averaged to form an overall comfort rating. We refer to this overall judgement as ‘thermal comfort’.
Experimental design and procedure
Two experimental variables were investigated in a 4 × 2 design: four ventilation systems (CDV, HLMV, HV and MJV) at two air temperature levels (cooler vs warmer). The predefined target temperatures TIC were 22°C for the cooler conditions and 24°C for the warmer conditions. Consequently, eight climate scenarios were realized in the generic train laboratory. In each climate scenario, one of the four different ventilation settings was operative with either cooler or warmer air temperatures. In all scenarios, an air volume flow rate of 230 L/s, that is, 9.6 L∕s per passenger, was established, which conforms to the value required by the standard for the fresh air supply per passenger.
The procedure was as follows: After the 20 subjects for each setting were seated in rows 2 to 6, a 30-min pre-conditioning phase occurred, during which the climate conditions in the compartment stabilized. This phase served also to acclimatize the subjects and to introduce them to the experimental procedure and measurements. Short examples were used to practice data entering with the tablets. The experimental phase followed. The entire exposure time for each of the two scenarios presented was about 60 min with stable conditions. It was marked acoustically by the sound of a fast-moving train. During this time, the subjects rested, and they were offered non-exciting crosswords or Sudoku grids in a magazine. No further communication took place, and mobile phones were switched off. After 15 and 45 min, the subjects filled out the comfort questionnaire. Thus, each climate scenario was assessed twice by the same subjects with a time lag of 30 min. This experimental protocol lasted about 3 h and was followed for all scenarios.
Data analysis
To examine our research questions, primarily multivariate analyses of variance (MANOVA) were calculated. MANOVA allow testing the effects of one or more factors on multiple dependent variables. The independent factors in our study were the ventilation concepts (CDV, HLMV, HV and MJV) and the temperature scenarios (cooler or warmer), in some analyses also gender (male or female). Subjects’ sensations and comfort evaluations of the surrounding climate parameters were the dependent variables. Wilks’ lambda is the multivariate test that is commonly used for testing the overall significance of the independent factor(s) in a multivariate situation. The associated F-statistic indicated the statistical significance depending on the degrees of freedom for the hypothesis (df1) and the error term (df2). Both were depicted as subscripts (i.e. F(df1, df2)). Effects of the individual factors were also tested separately with regular F-tests. The corresponding effect sizes were expressed as η p 2, representing the proportion of variance explained. 29 If needed, additional t-tests were applied as post hoc tests after the statistical tests for the main effects. In cases with only one dependent variable (overall thermal comfort) and one or more independent factors, analysis of variance (ANOVA) was applied. In ANOVA, regular F-statistics are used to test the effects’ significance and also η p 2 to determine the effect size. Both, MANOVA and ANOVA, are generally accepted as being robust against violations of basic assumptions, such as normality distribution or equality of variances.29,30 Finally, effects of metric personal passenger characteristics (e.g. age, BMI and BMR) were analyzed with bivariate correlation coefficients.
Results were illustrated by means of figures and tables with average group values for the respective variable and level of the relevant independent factor. To display the spread of individual scores around the mean values, we chose standard deviations (SDs), standard errors (SEs) and confidence intervals (CIs). SEs have the advantage that they are adjusted for different sample sizes. However, in descriptive tables, we also reported the SDs as information about the score variations.
Results
Objective climate situations in the train compartment
Objective measurements for climate parameters per climate scenario.
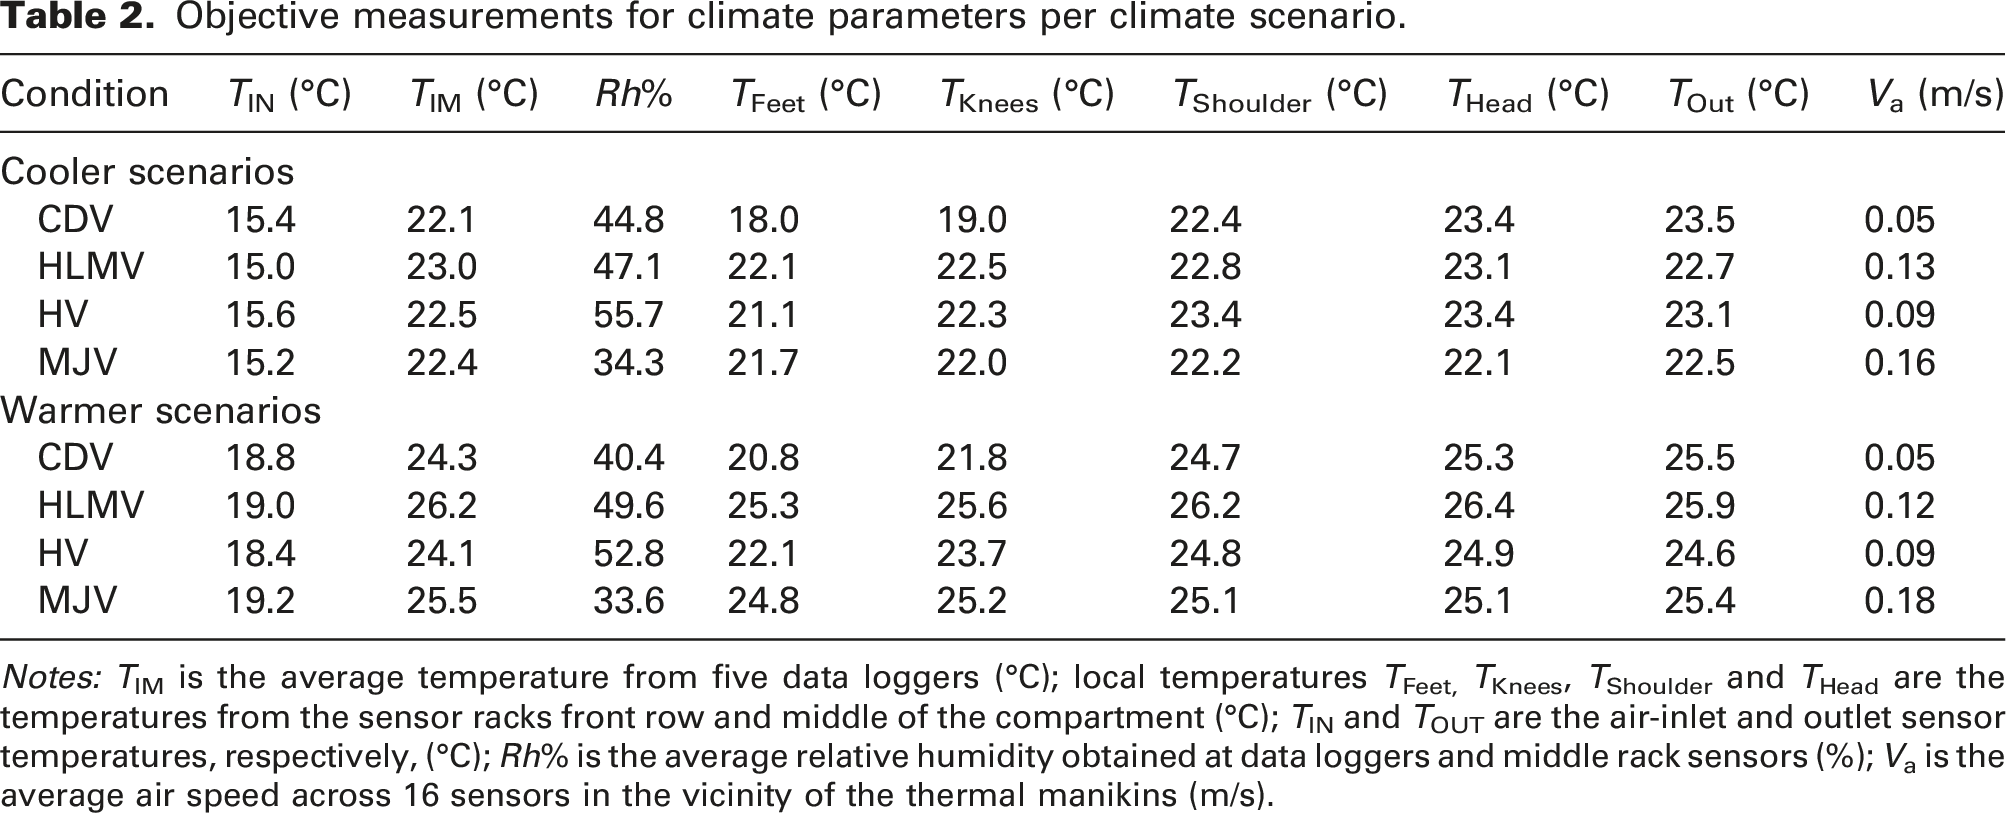
Notes: TIM is the average temperature from five data loggers (°C); local temperatures TFeet, TKnees, TShoulder and THead are the temperatures from the sensor racks front row and middle of the compartment (°C); TIN and TOUT are the air-inlet and outlet sensor temperatures, respectively, (°C); Rh% is the average relative humidity obtained at data loggers and middle rack sensors (%); Va is the average air speed across 16 sensors in the vicinity of the thermal manikins (m/s).
The vertical temperature distributions are illustrated in Figure 6. For CDV, the vertical temperature gradient was clearly above the quality standard (q) of q1 = 3 K as specified in EN 13129 in both scenarios. For the warmer scenario, the maximum temperature difference between the head and feet was just within the lower quality standard q2 = 4.5 K for the extended range. The temperature gradients for the other ventilation concepts were noticeably smaller, fulfilling the stricter q1 standard. Vertical temperature gradients in the cooler (a) and warmer (b) temperature scenarios. Error bars of +/−2 standard errors (SEs).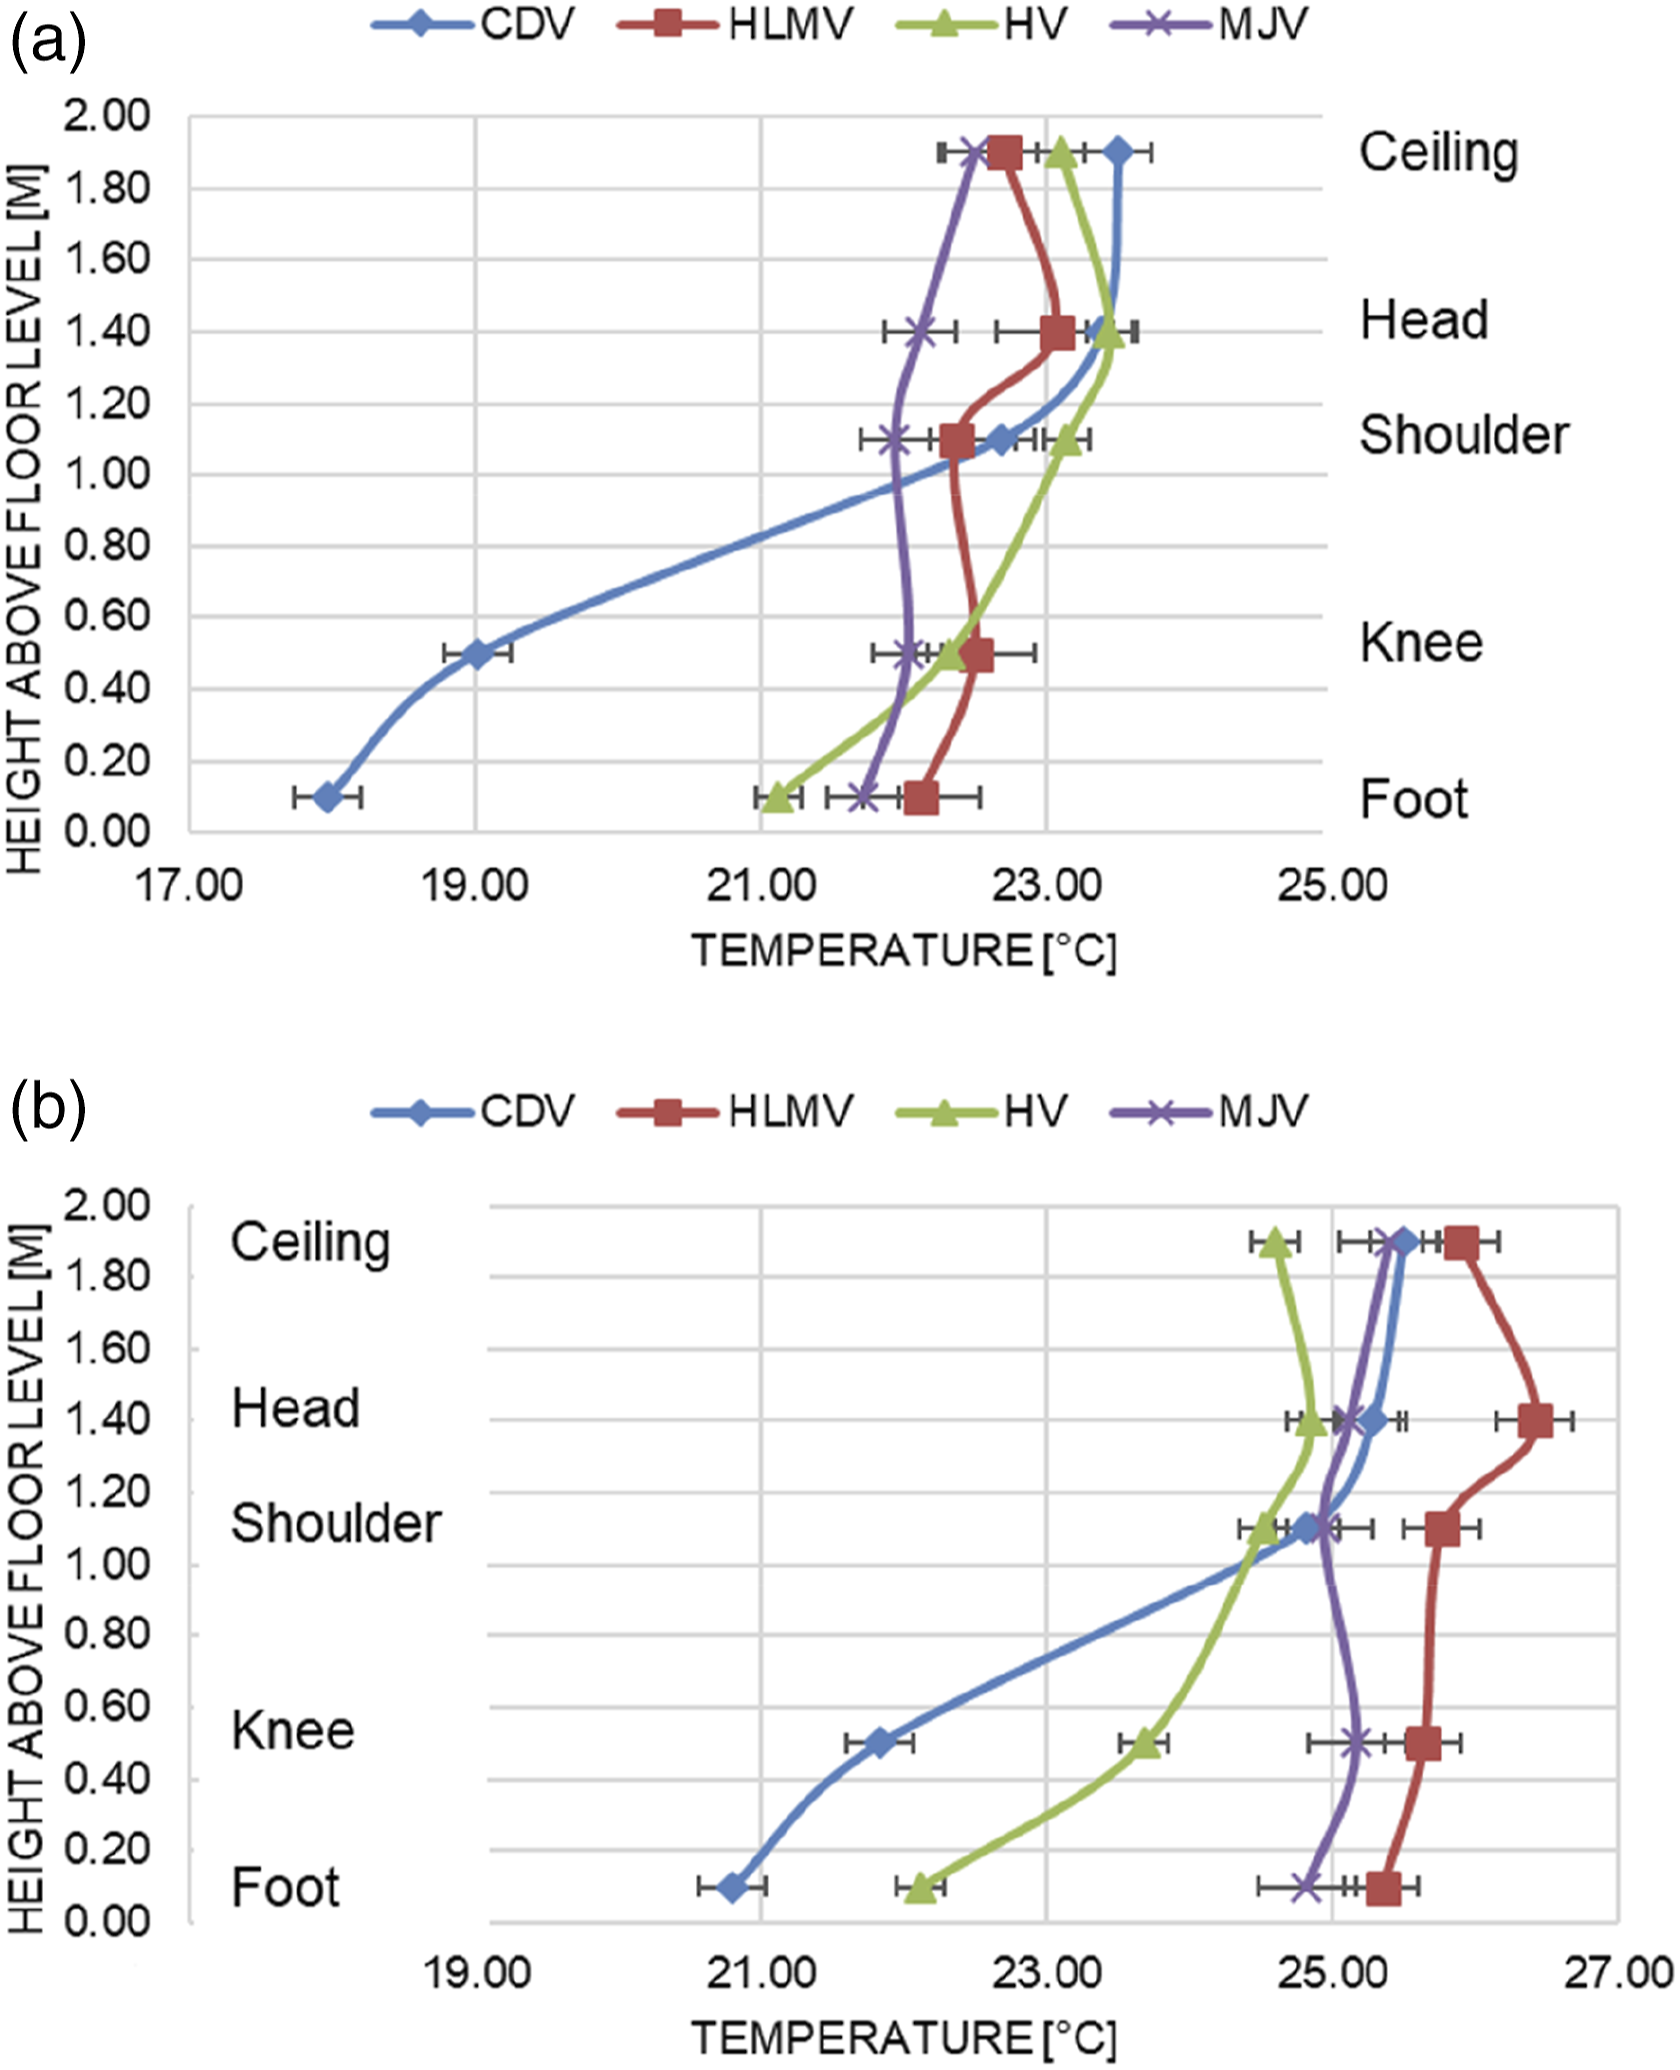
Subjective ratings for thermal comfort in the train compartment
For the analysis of subjective sensations and comfort evaluations, datasets of the 146 participants were considered. Data were averaged per climate scenario to increase reliability and statistical power.
Global thermal comfort
Descriptive statistics of climate parameter sensations and comfort evaluations and effect sizes for analyses of variance.
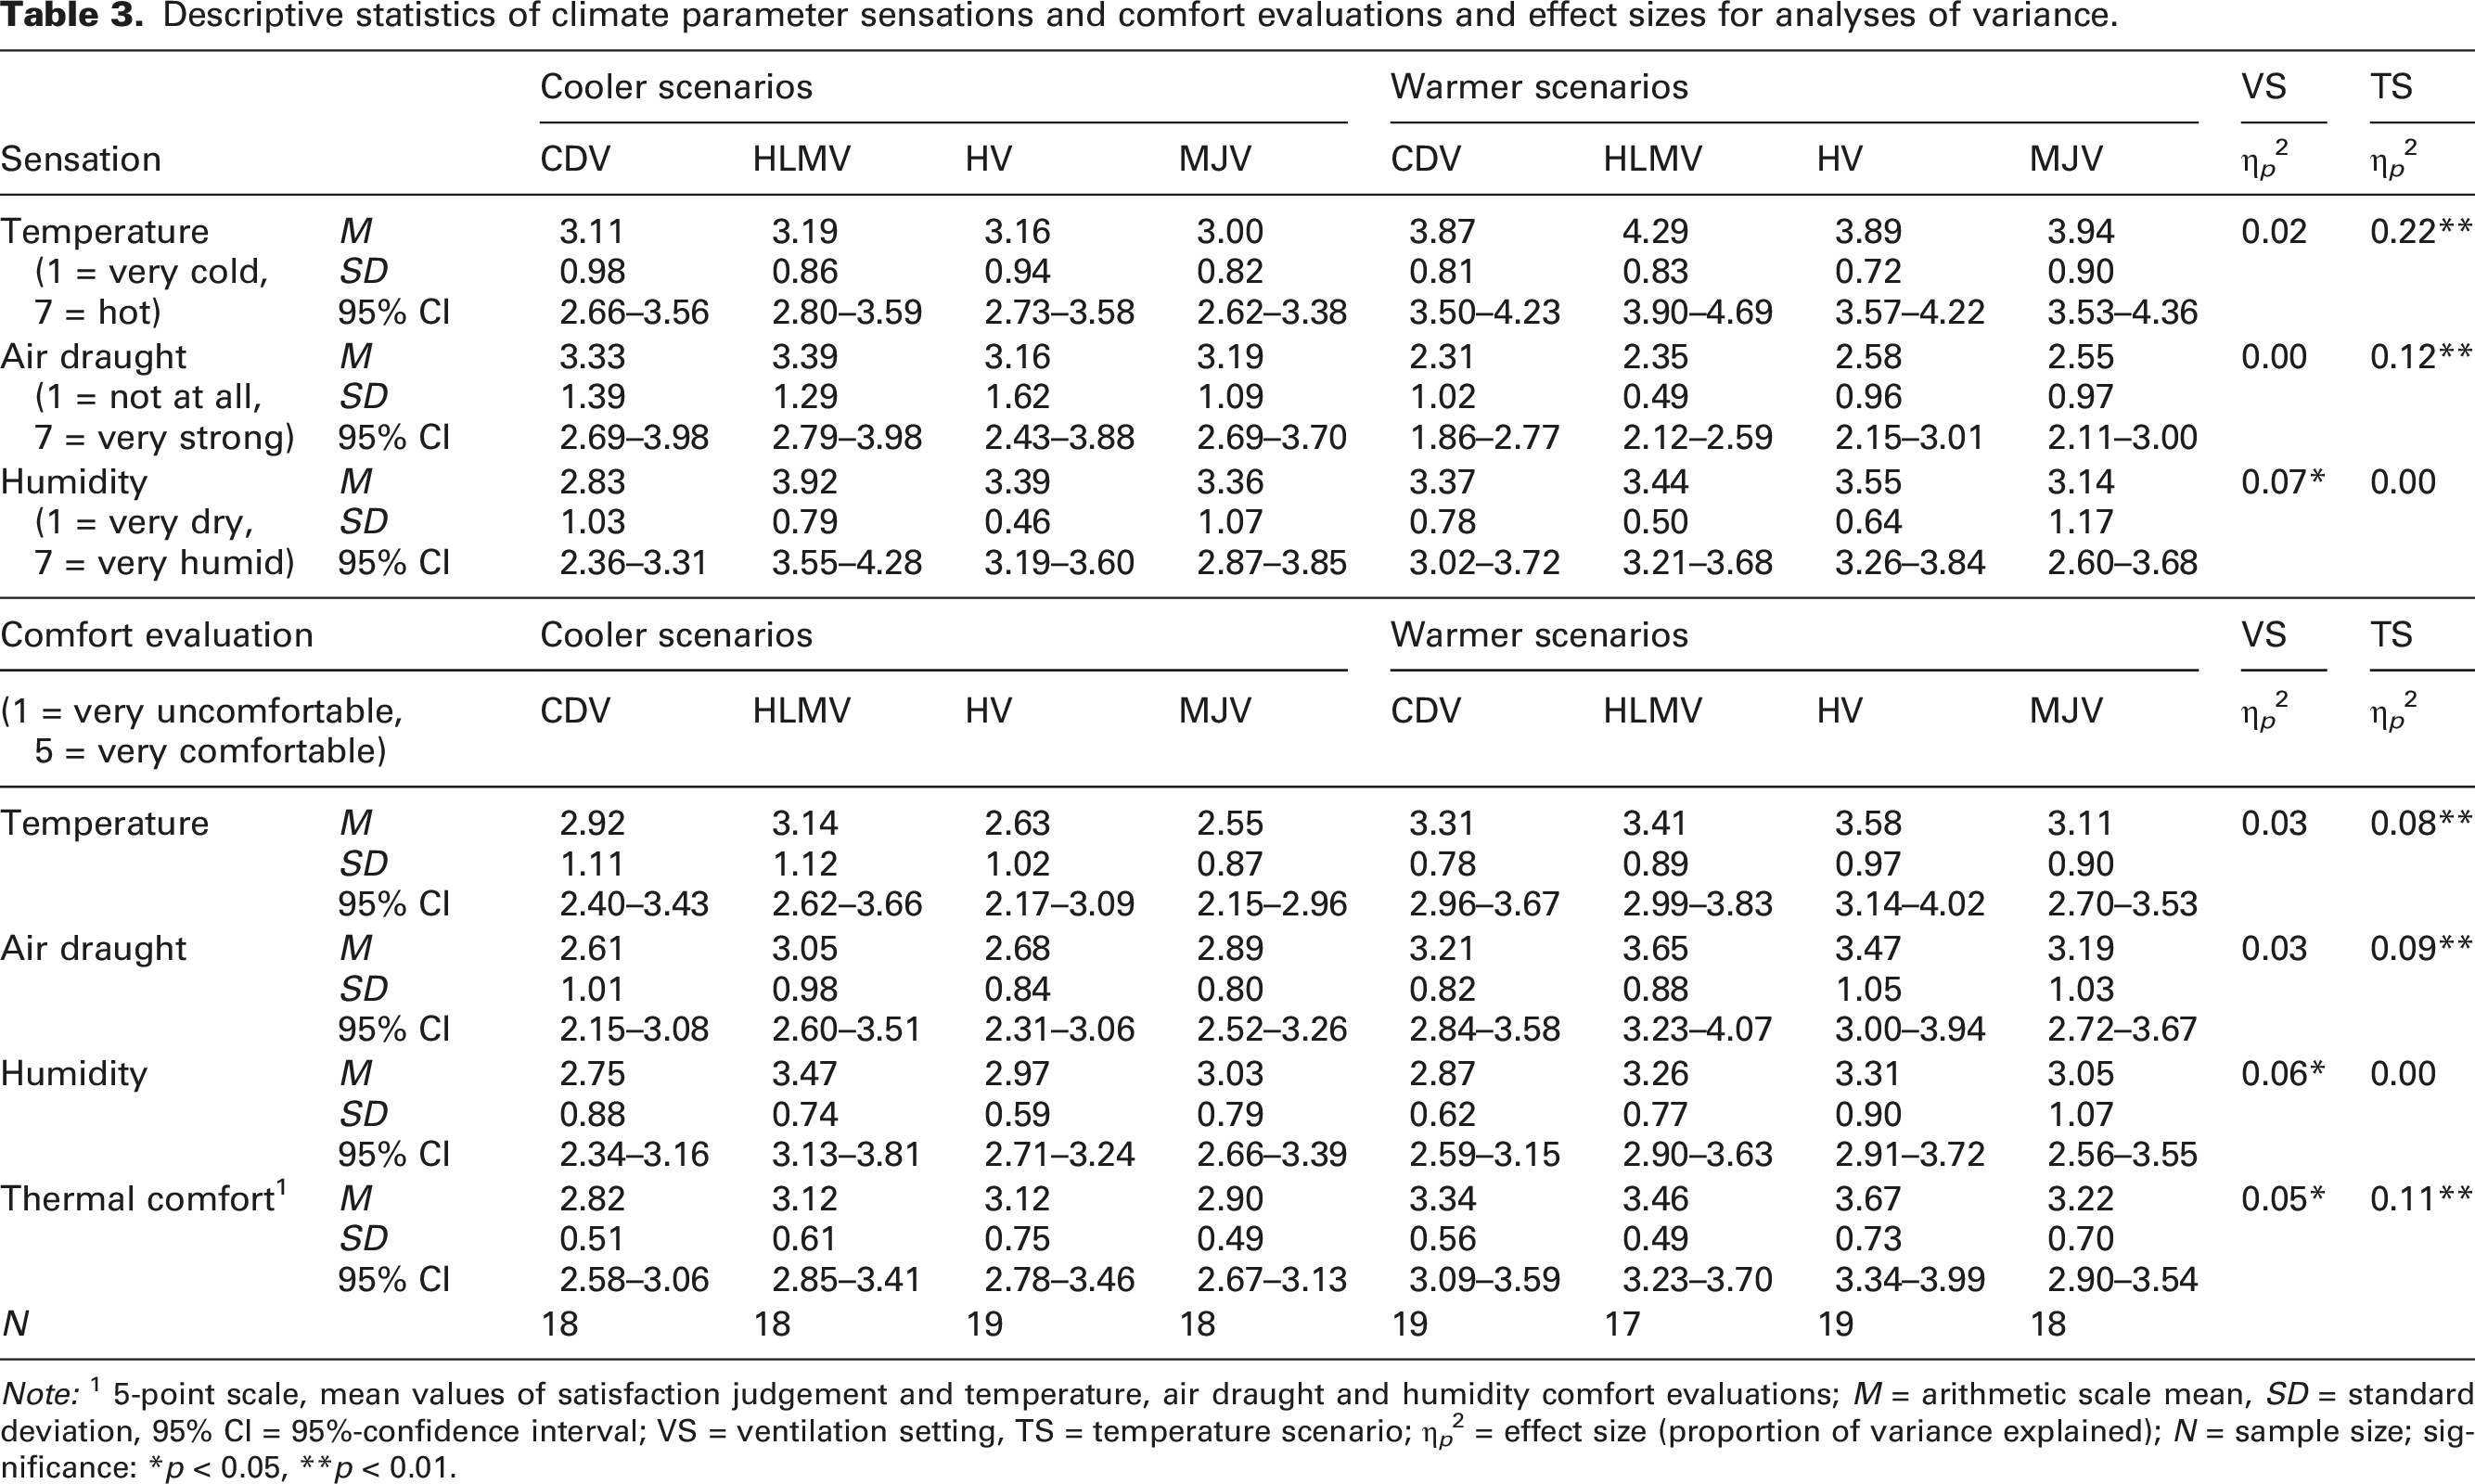
Note: 1 5-point scale, mean values of satisfaction judgement and temperature, air draught and humidity comfort evaluations; M = arithmetic scale mean, SD = standard deviation, 95% CI = 95%-confidence interval; VS = ventilation setting, TS = temperature scenario; η p 2 = effect size (proportion of variance explained); N = sample size; significance: *p < 0.05, **p < 0.01.
In the first step, the main effects of the factors ‘ventilation setting’ and ‘temperature scenario’ were analyzed (cf. Table 3). Climate parameter sensations did not generally differ in the four ventilation settings (Wilks’ lambda: F(9; 331) = 1.44, n. s.). Significant effects were observed for humidity only (F(3; 138) = 3.27, p < 0.05, η p 2 = 0.07). In HLMV, the humidity was rated as being comparatively high, while in CDV, it was rather low. Compared to this, comfort evaluations for the climate parameters tended to differ between the ventilation settings (Wilks’ lambda: F(9; 331) = 1.75, p < 0.10, η p 2 = 0.04). This was mainly attributable to significant differences in humidity evaluations (F(3; 138) = 2.98, p < 0.05, η p 2 = 0.06). HLMV was evaluated as being more comfortable regarding humidity than the other ventilation settings, especially CDV.
Furthermore, the factor ‘temperature scenario’ had an impact on climate parameter ratings (Wilks’ lambda: F(9; 136) = 13.73, p < 0.01, η p 2 = 0.23), which was reflected by differences in temperature and air draught sensations. As expected, temperatures were perceived as warmer (F(3; 138) = 38.38, p < 0.01, η p 2 = 0.22) and air draught as lower (F(3; 138) = 18.34, p < 0.01, η p 2 = 0.12) in the warmer temperature scenarios. The respective comfort evaluations also differed for temperature and air draught (Wilks’ lambda: F(9; 136) = 5.23, p < 0.01, η p 2 = 0.10). Both parameters were considered more comfortable in the warmer temperature scenarios (temperature: F(3; 138) = 11.53, p < 0.01, η p 2 = 0.08; air draught: F(3; 138) = 13.75, p < 0.01, η p 2 = 0.09; see Table 3).
We mainly examined if significant differences were present among the four ventilation settings regarding the overall thermal comfort. Results of the respective two-way ANOVA revealed significant differences in the perceived thermal comfort between the four ventilation settings (F(3, 138) = 2.59, p = 0.05, η
p
2 = 0.05). As illustrated in Figure 7, subjects reported comparatively higher thermal comfort in HLMV and HV than in CDV and MJV, especially for the cooler temperature scenarios. Moreover, differences between the cooler and warmer temperature scenarios were significant (F(1, 138) = 17.73, p < 0.01, η
p
2 = 0.11). The warmer temperature scenarios were judged as providing significantly higher thermal comfort. Differences between the temperature scenarios varied in magnitude (see Figure 3). To determine which effects were of statistical significance, additional t-tests were calculated between the cooler and warmer scenarios for each ventilation setting. Thermal comfort was found to be significantly higher for warmer temperature scenarios in CDV and HV and, by trend, higher in HLMV, but no statistical difference occurred between both scenarios in MJV (CDV: t(35) = 2.94, p < 0.01; HLMV: t(33) = 1.77, p < 0.10; HV: t(36) = 2.28, p < 0.05; MJV: t(34) = 1.59, n. s.). Thermal comfort per ventilation setting in a cooler (solid line) and a warmer (dotted line) temperature scenario with error bars of +/−1 SE.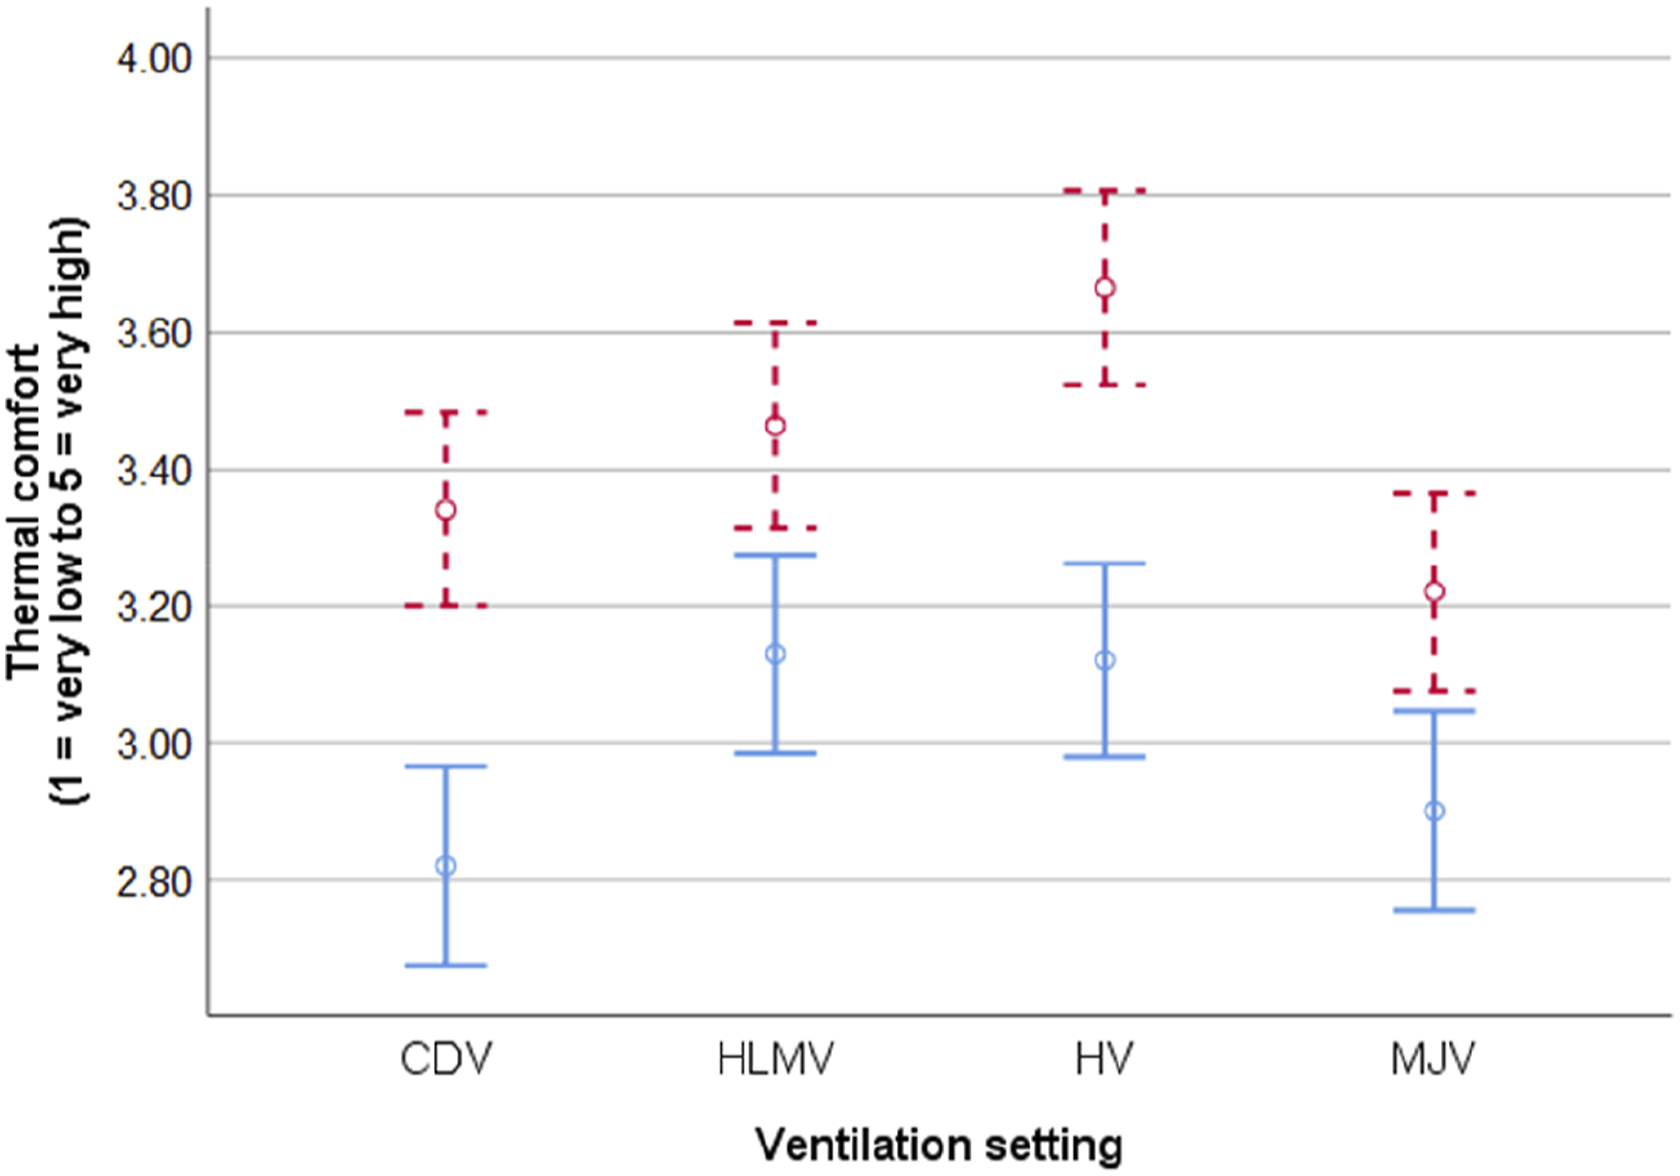
In summary, comfort advantages were found for HLMV and HV, while comfort disadvantages were observed for CDV (especially in the cooler temperature scenarios) and MJV (especially in the warmer temperature scenarios).
Local thermal comfort and stratification effects
To gain more insight into potential comfort differences among the four ventilation settings, local comfort ratings for temperature and air draught were analyzed (measurement points according to EN 13129: feet, thighs, shoulders and head) in addition to global climate parameter ratings. As regards effects of the seating row (front/rear, window/aisle), which are certainly of interest, subsamples in our dataset were too small to perform profound analyses. Therefore, we concentrated on the analysis of different body-parts and again, two-way MANOVAs were performed using the factors ‘ventilation setting’ and ‘temperature scenario’.
Temperature sensation and comfort evaluation
Multivariate tests revealed that the four ventilation settings differed significantly regarding the temperature sensed at the body parts (Wilks’ lambda: F(12; 357) = 3.03, p < 0.01, η
p
2 = 0.08). From Figures 8(a) and (b), we inferred that mainly CDV caused these differences since, in this ventilation setting, the participants sensed a rather strong temperature gradient from feet to head. Temperature was rated as being especially cold for the lower body parts. Thighs (F(3; 146) = 3.43, p < 0.05, η
p
2 = 0.07) and, most notably feet (F(3; 146) = 7.04, p < 0.01, η
p
2 = 0.13), were perceived as being significantly colder in CDV (Figures 8(a) and (b)). This result aligns with the objective conditions well, as shown in Table 2 and Figure 6. As expected, all body parts were rated as being colder in the cooler temperature scenarios (Wilks’ lambda: F(4; 135) = 6.99, p < 0.01, η
p
2 = 0.17). Local temperature sensations per ventilation setting in the cooler (a) and warmer (b) temperature scenarios. Error bars are +/−1 SE.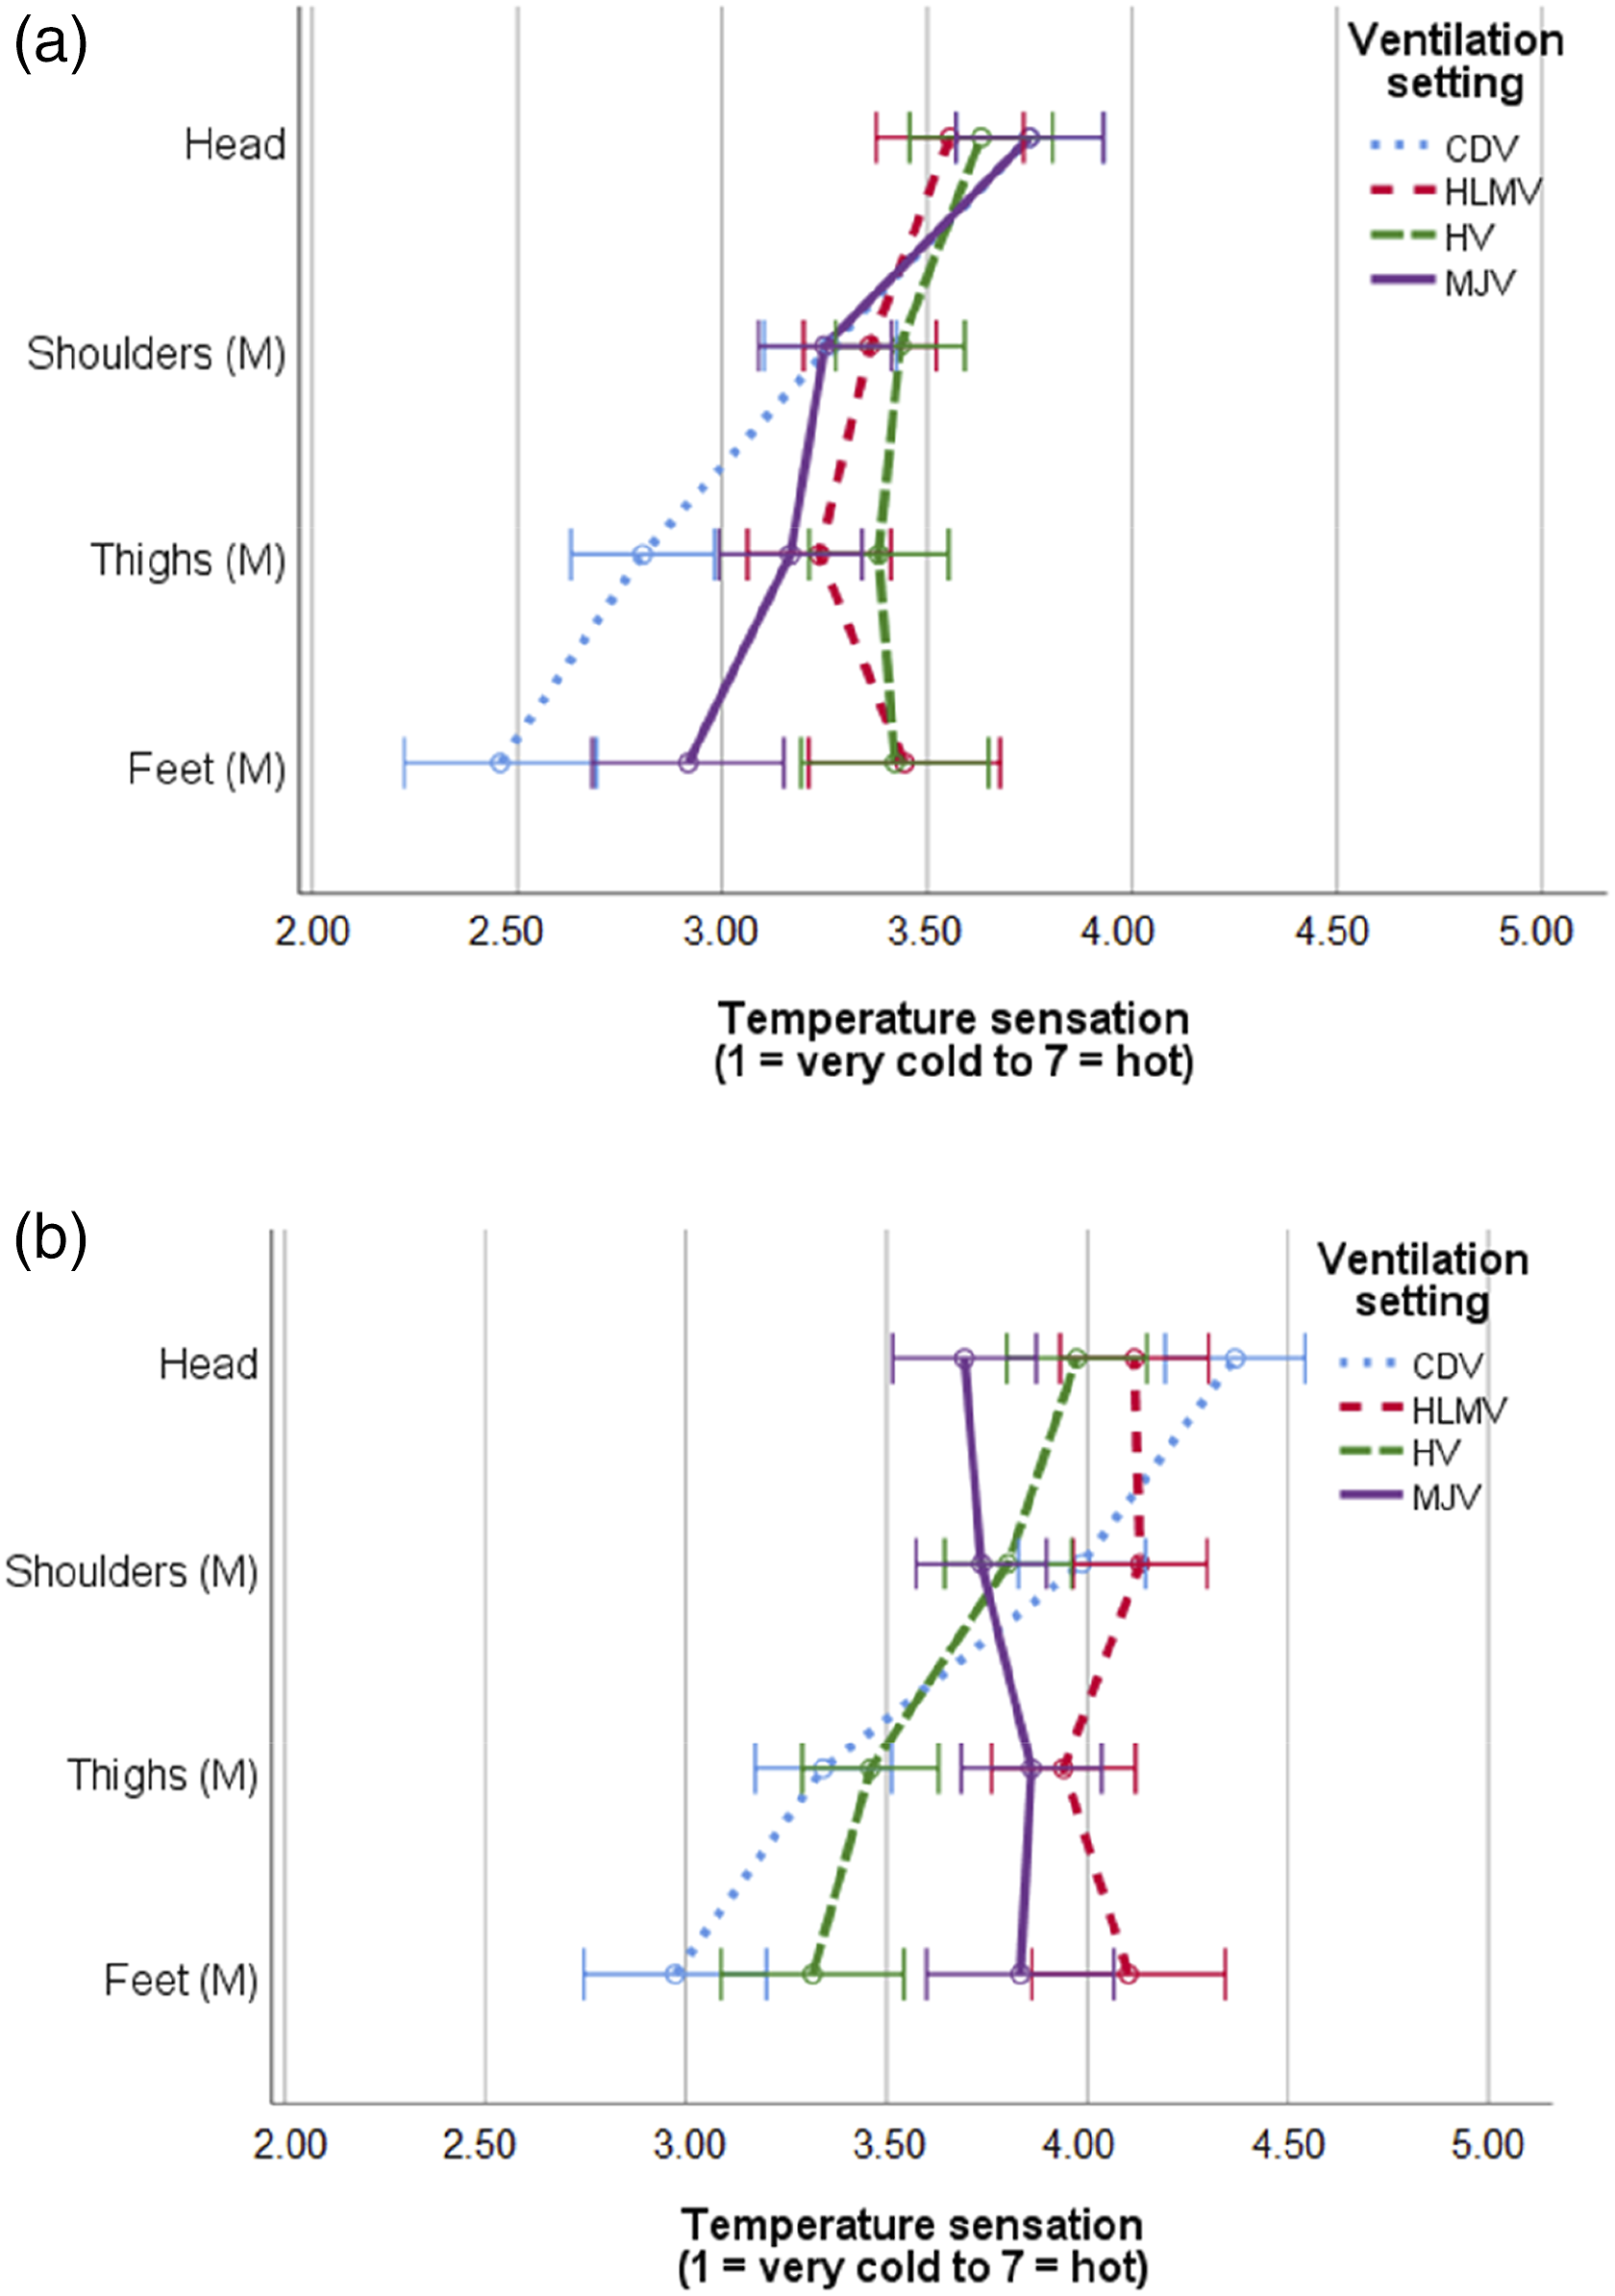
In accordance with the results for temperature sensations, we found significant differences between ventilation settings for temperature comfort evaluations at the different body parts (Wilks’ lambda: F(12; 357) = 2.15, p < 0.05, η
p
2 = 0.06). In the cooler temperature scenarios, comfort restrictions were obvious for the lower body parts in CDV, namely, thighs (F(3; 146) = 3.00, p < 0.05, η
p
2 = 0.06) and feet (F(3; 146) = 6.19, p < 0.01, η
p
2 = 0.12). In the warmer scenarios, these restrictions were only observed for the feet, but compared to the other ventilation settings, slight comfort losses for MJV occurred at the upper body parts (shoulders and head). In summary, temperature comfort evaluations were significantly higher in the warmer temperature scenarios (Wilks’ lambda: F(4; 135) = 6.06, p < 0.01, η
p
2 = 0.15; Figures 9(a) and (b)). Local temperature comfort evaluations per ventilation setting in the cooler (a) and warmer (b) temperature scenarios. Error bars are +/−1 SE.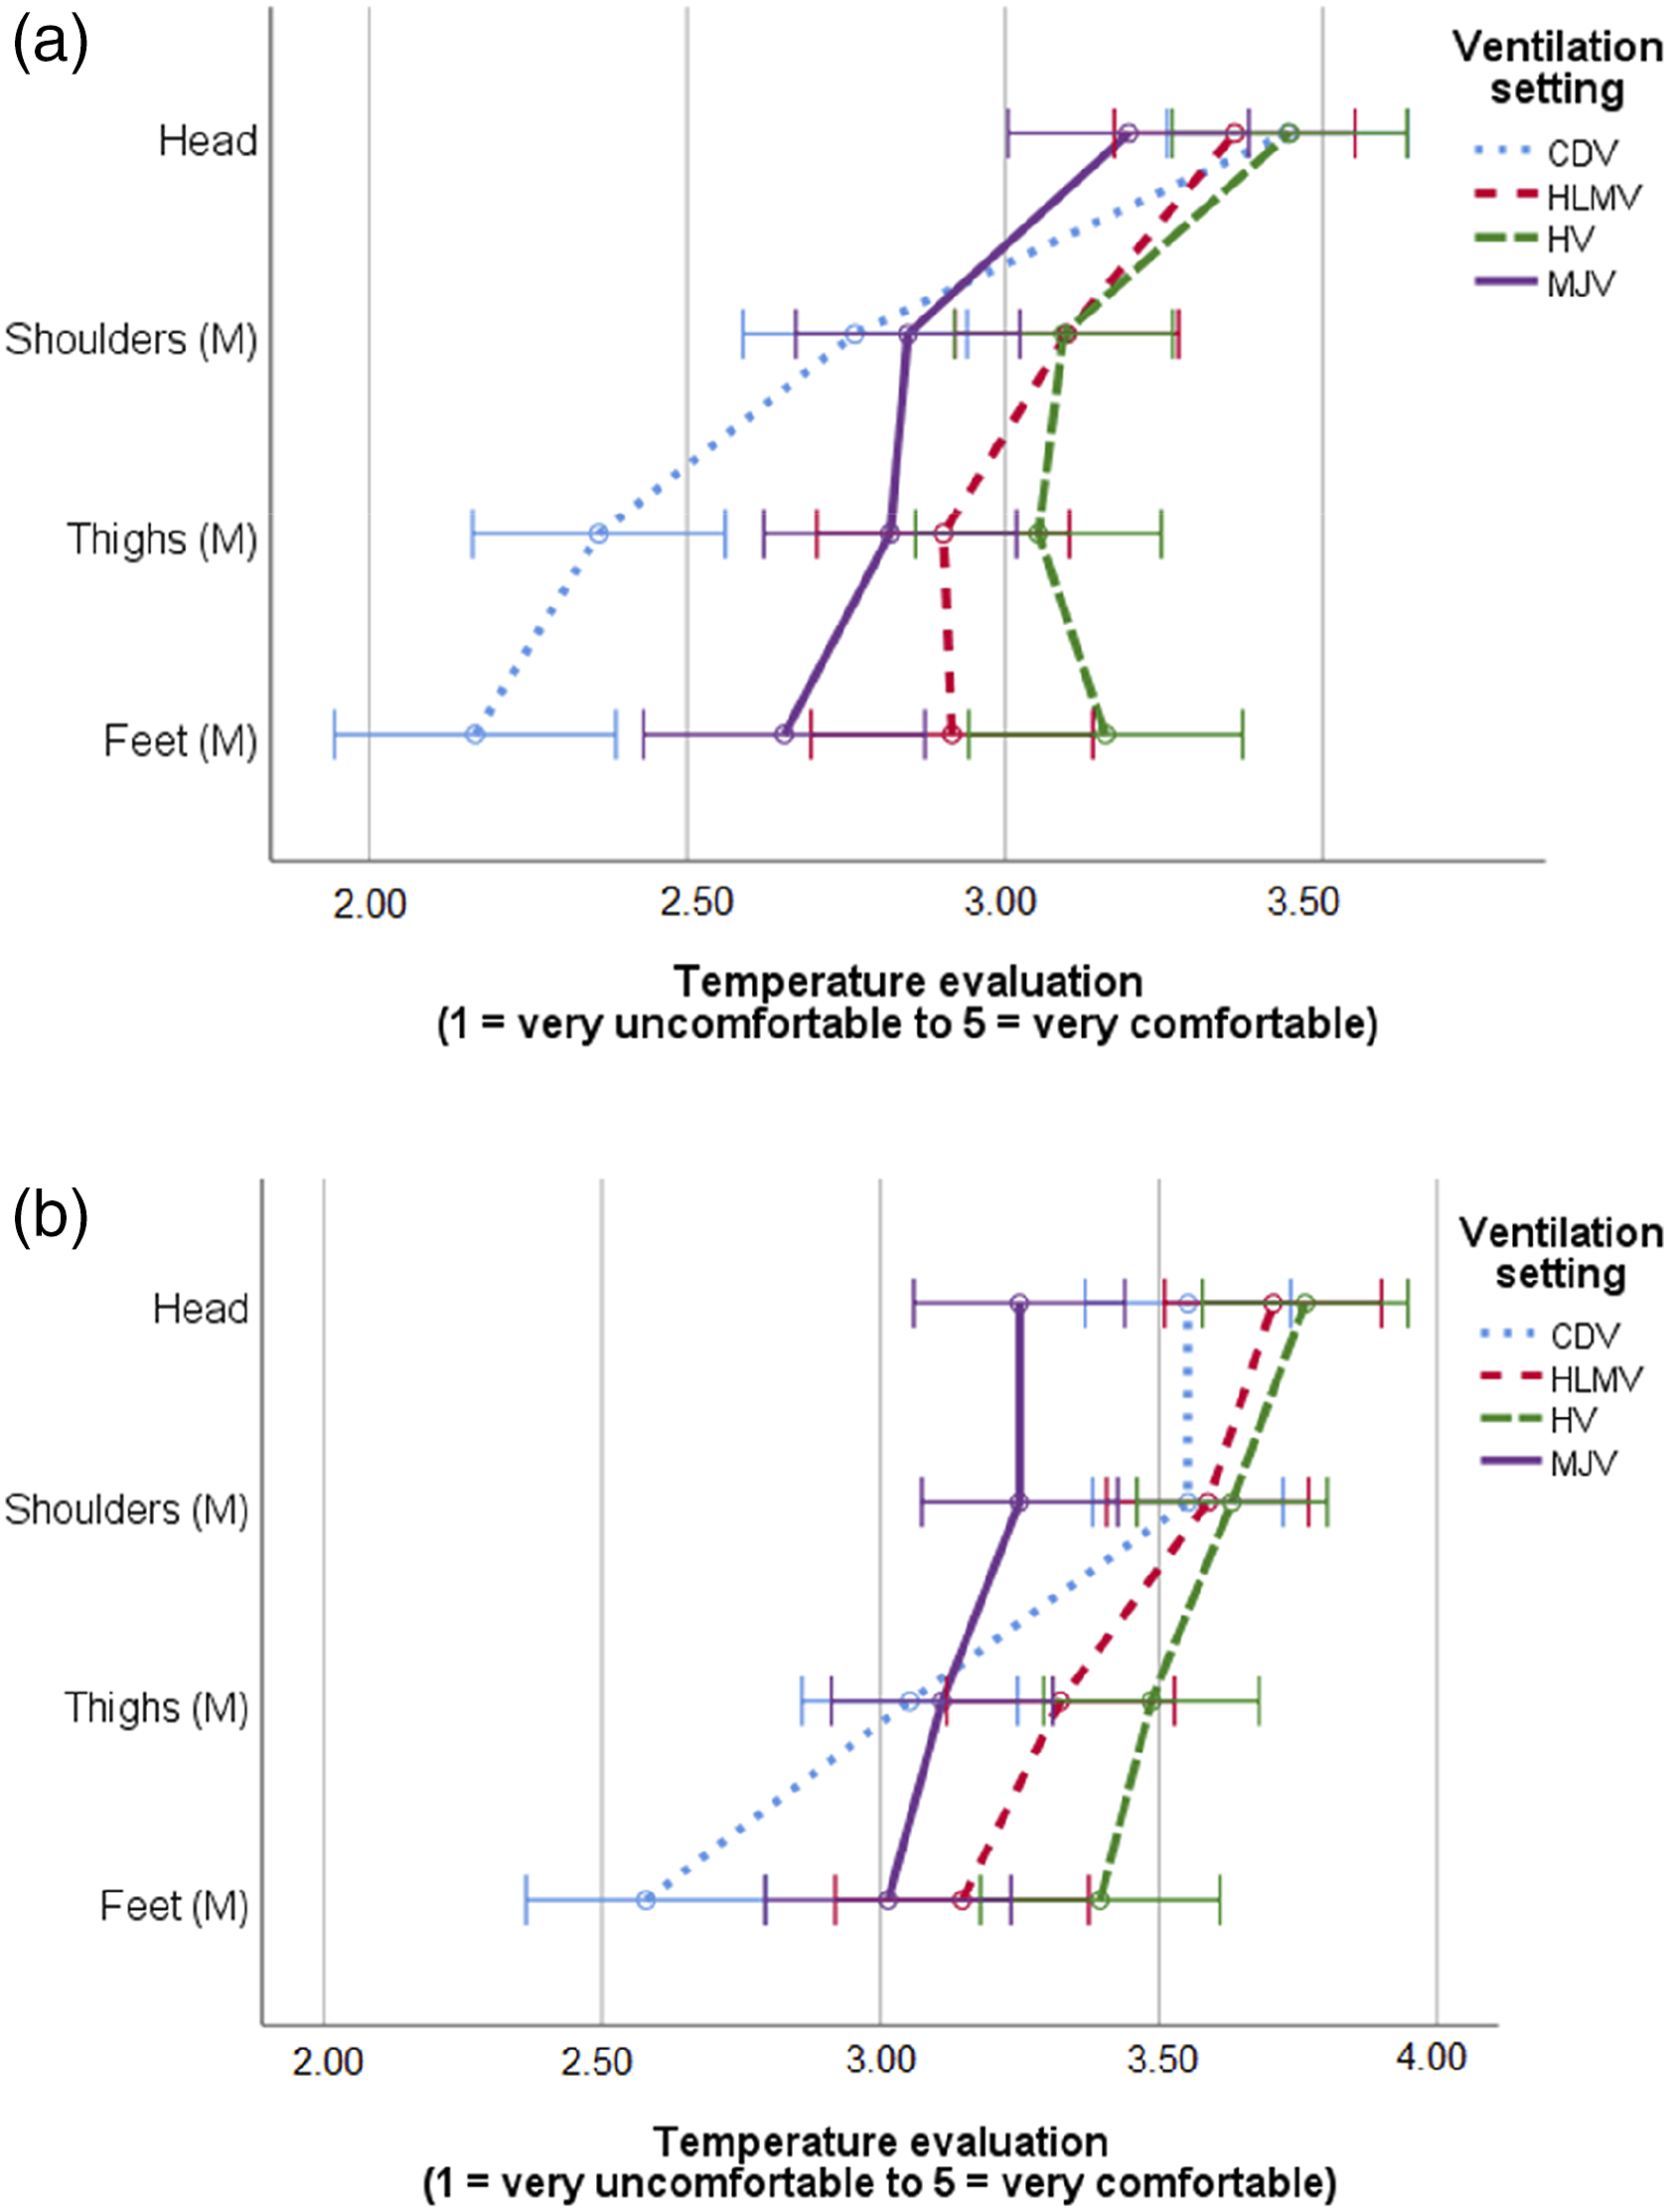
Air draught sensation and comfort evaluation
The amount of air draught was also sensed as being different in the four ventilation settings regarding the body parts assessed (Wilks’ lambda: F(12; 357) = 3.00, p < .01, η
p
2 = 0.08), especially at the head (F(3; 146) = 3.20, p < 0.05, η
p
2 = 0.06) and the feet (F(3; 146) = 2.99, p < 0.05, η
p
2 = 0.06). As illustrated in Figures 10(a) and (b), effects were mainly caused by extreme values for CDV, where a rather strong gradient in air draught sensations became obvious for both temperature scenarios. At the lower body parts, air draught was perceived as significantly higher than in the other ventilation settings; at the head, it was rated as lower. Although the mean air velocities hardly differed between the cooler and warmer temperature scenarios (see Table 2), air draught was perceived as being stronger in the cooler temperature scenarios (Wilks’ lambda: F(4; 135) = 5.86, p < 0.01, η
p
2 = 0.15). Local air draught sensations per ventilation setting in the cooler (a) and warmer (b) temperature scenarios. Error bars are +/−1 SE.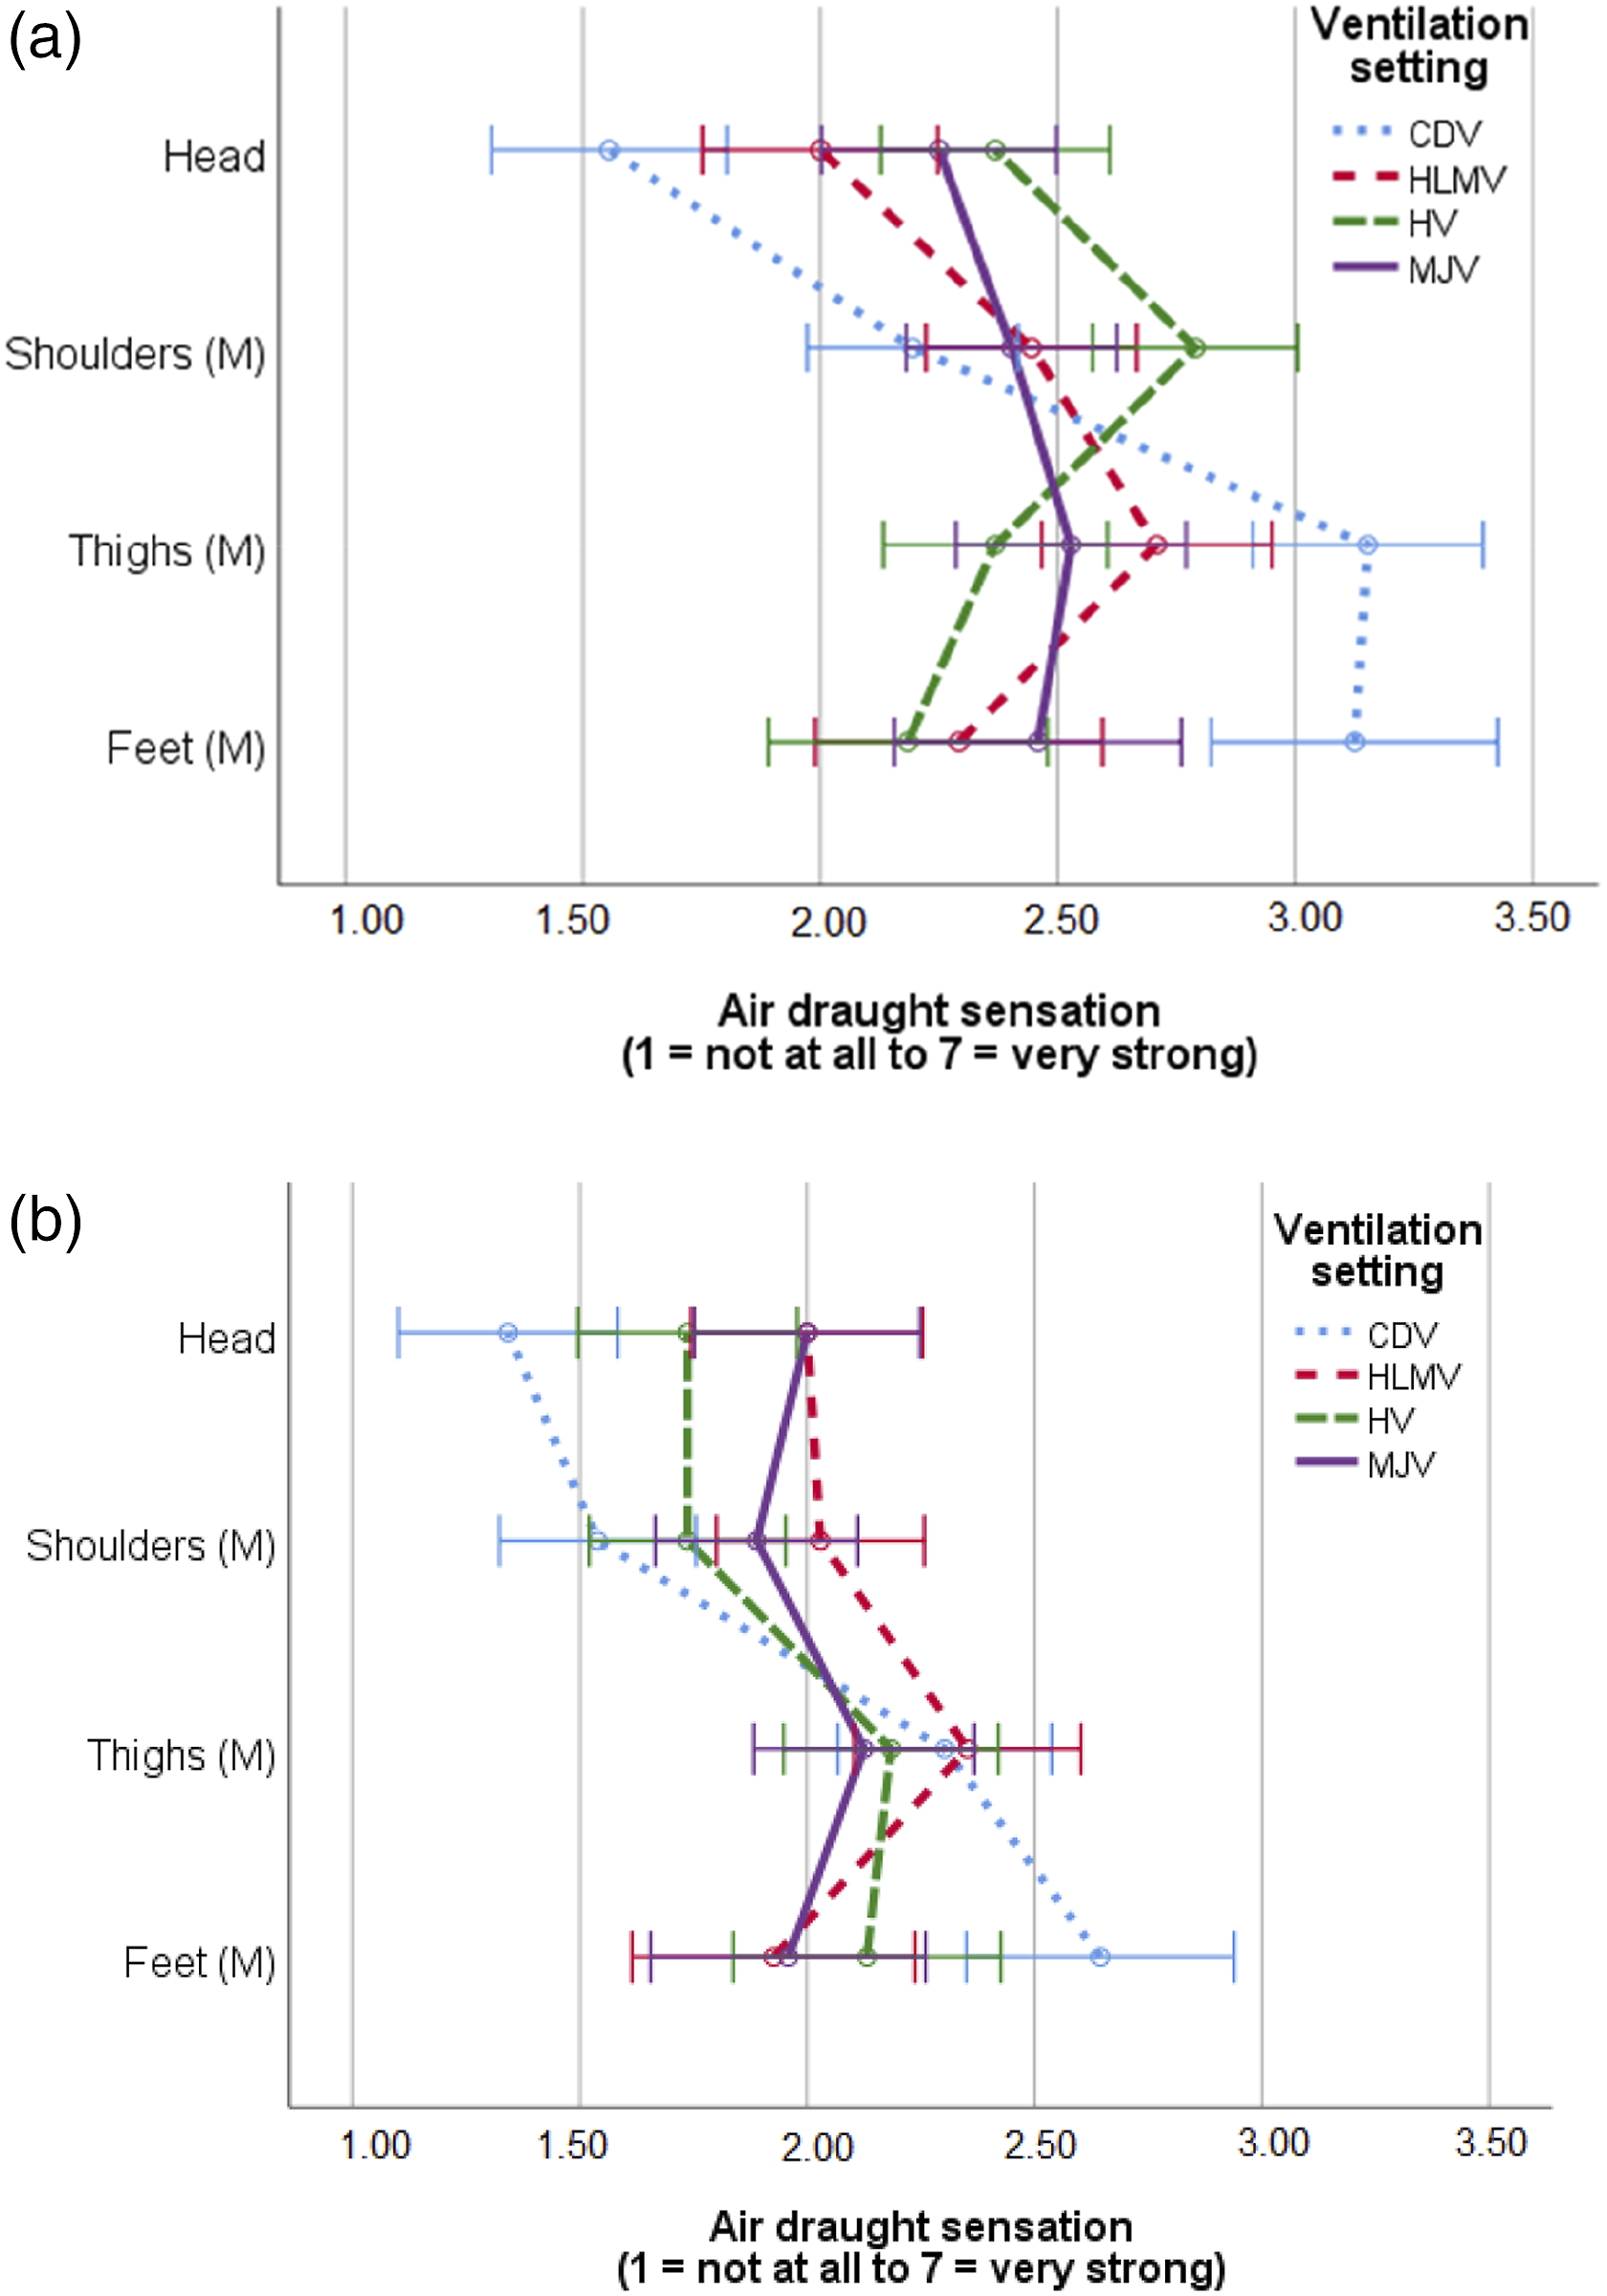
The respective comfort evaluations for air draught at different body parts also tended to differ among the four ventilation settings (Wilks’ lambda: F(12; 357) = 1.68, p < 0.10, η
p
2 = 0.05) but again only for the thighs (F(3; 146) = 2.82, p < 0.05, η
p
2 = 0.06) and feet (F(3; 146) = 4.39, p < 0.01, η
p
2 = 0.09). Figure 11(a) shows that in the cooler temperature scenarios, air draught at the thighs and feet was evaluated as being rather uncomfortable in CDV but rather comfortable in HV. Disadvantages for the lower body parts in CDV were not as crucial in the warmer temperature scenarios (Figure 11(b)). However, some comfort restrictions for MJV were found at the upper body parts (shoulders and head) compared to the other ventilation settings. In summary, air draught related comfort was evaluated as significantly higher in the warmer temperature scenarios (Wilks’ lambda: F(4; 135) = 5.13, p < 0.01, η
p
2 = 0.13). Local air draught comfort evaluations per ventilation setting in the cooler (a) and warmer (b) temperature scenarios. Error bars are +/−1 SE.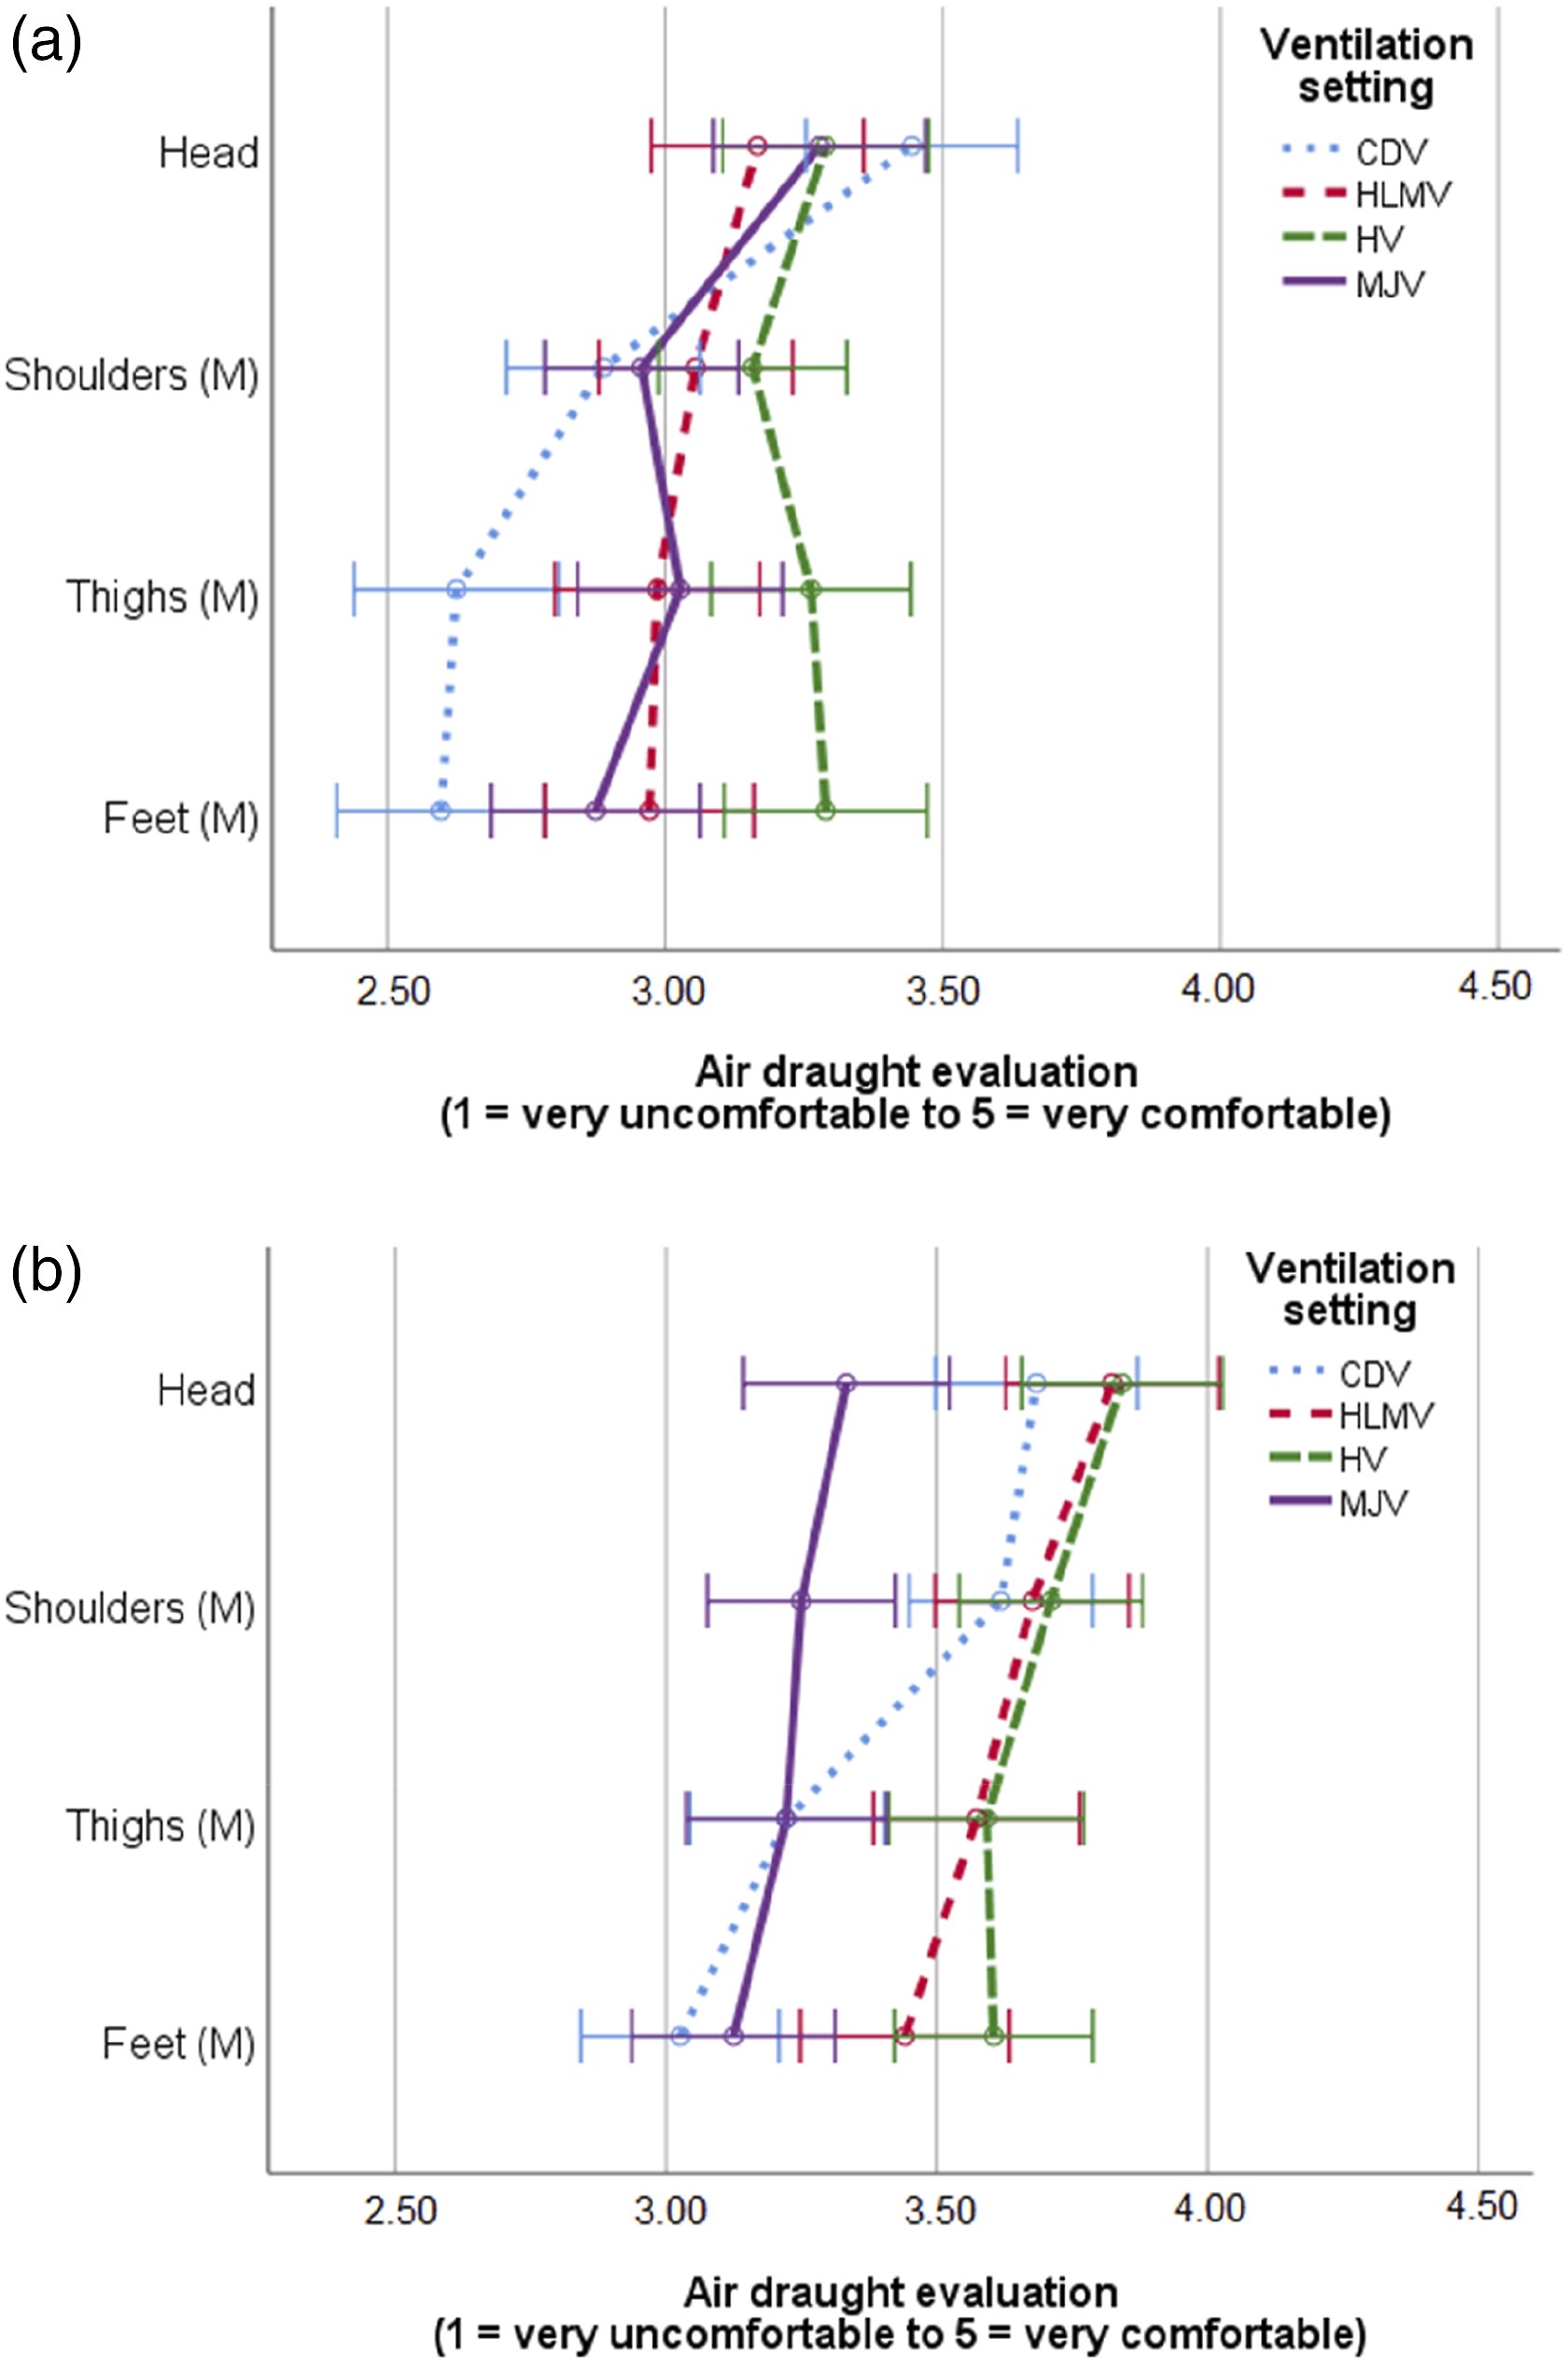
Effects of personal characteristics of passengers
So far, all results were based on the mean values of the eight subgroups of the 4 × 2 experimental design. Nonetheless, the subjects’ climate ratings varied noticeably not only between the climate scenarios but also within (cf. Table 3). It could be proposed that these variations might be explainable to some extent by individual characteristics, like age, BMI, BMR or gender, for example. In fact, supplementary analyses showed no significant differences in the BMI-, BMR- and gender distributions between the eight subgroups. However, the mean age was inadvertently lower for subjects in the CDV condition (mean age for subjects in CDV 28 years, HLMV 37 years, HV 33 years and MJV 36 years). This section examines the extent of systematic co-variations between subjects’ personal characteristics and the climate sensations and comfort evaluations.
Age, BMI and BMR
For age, BMI and BMR, bivariate correlations with the subjects’ climate parameter sensations and comfort evaluations were calculated (N = 146). Only a few significant correlations emerged. The higher the subjects’ BMR, the less strong they sensed the air draught (r = −0.17, p < 0.05). Moreover, temperature tended to be evaluated as being more comfortable by those with higher metabolic rates (r = 0.14, p < 0.10). No significant effects were found regarding the subjects’ age and BMIs, which means that in our sample neither age nor BMI variations can explain the differences between the ventilation systems for the analyzed parameters of subjective comfort.
Gender
A two-way MANOVA including the factors ‘gender’ and ‘ventilation setting’ was calculated to analyze differences between female and male participants for climate parameter ratings. Women and men differed significantly regarding their climate parameter sensations (Wilks’ lambda: F(3; 136) = 2.96, p < 0.05, η
p
2 = 0.06), especially for temperature (F(1; 146) = 3.53, p = 0.05, η
p
2 = 0.03) and air draught (F(1; 146) = 8.35, p < 0.01, η
p
2 = 0.06). Overall, female subjects perceived the temperature as colder and the air draught as being stronger compared to male subjects. In the climate parameter comfort evaluations, no overall gender effect was found (Wilks’ lambda: F(3; 136) = 1.41, n. s.). Nonetheless, women judged the temperature as being significantly less comfortable than men (F(1; 146) = 3.53, p = 0.05, η
p
2 = 0.03). Descriptive values per ventilation setting are illustrated in Figure 12. Because of the small subsample sizes, statistically noticeable gender effects per ventilation setting were found for air draught sensation in CDV (t(34) = −1.77, p < 0.10) and air draught evaluation in MJV (t(35) = 2.29, p < 0.05) only. There were also no significant interaction effects of gender x ventilation setting on the dependent variables. Means for temperature (top) and air draught (bottom) sensations and comfort evaluations based on gender, where f is female and m is male; sensation scales are air temperature: 1 = very cold to 7 = hot, air draught: 1 = not at all to 7 = strong; and evaluation scales: 1 = very uncomfortable to 5 = very comfortable. Error bars are +/−1 SE.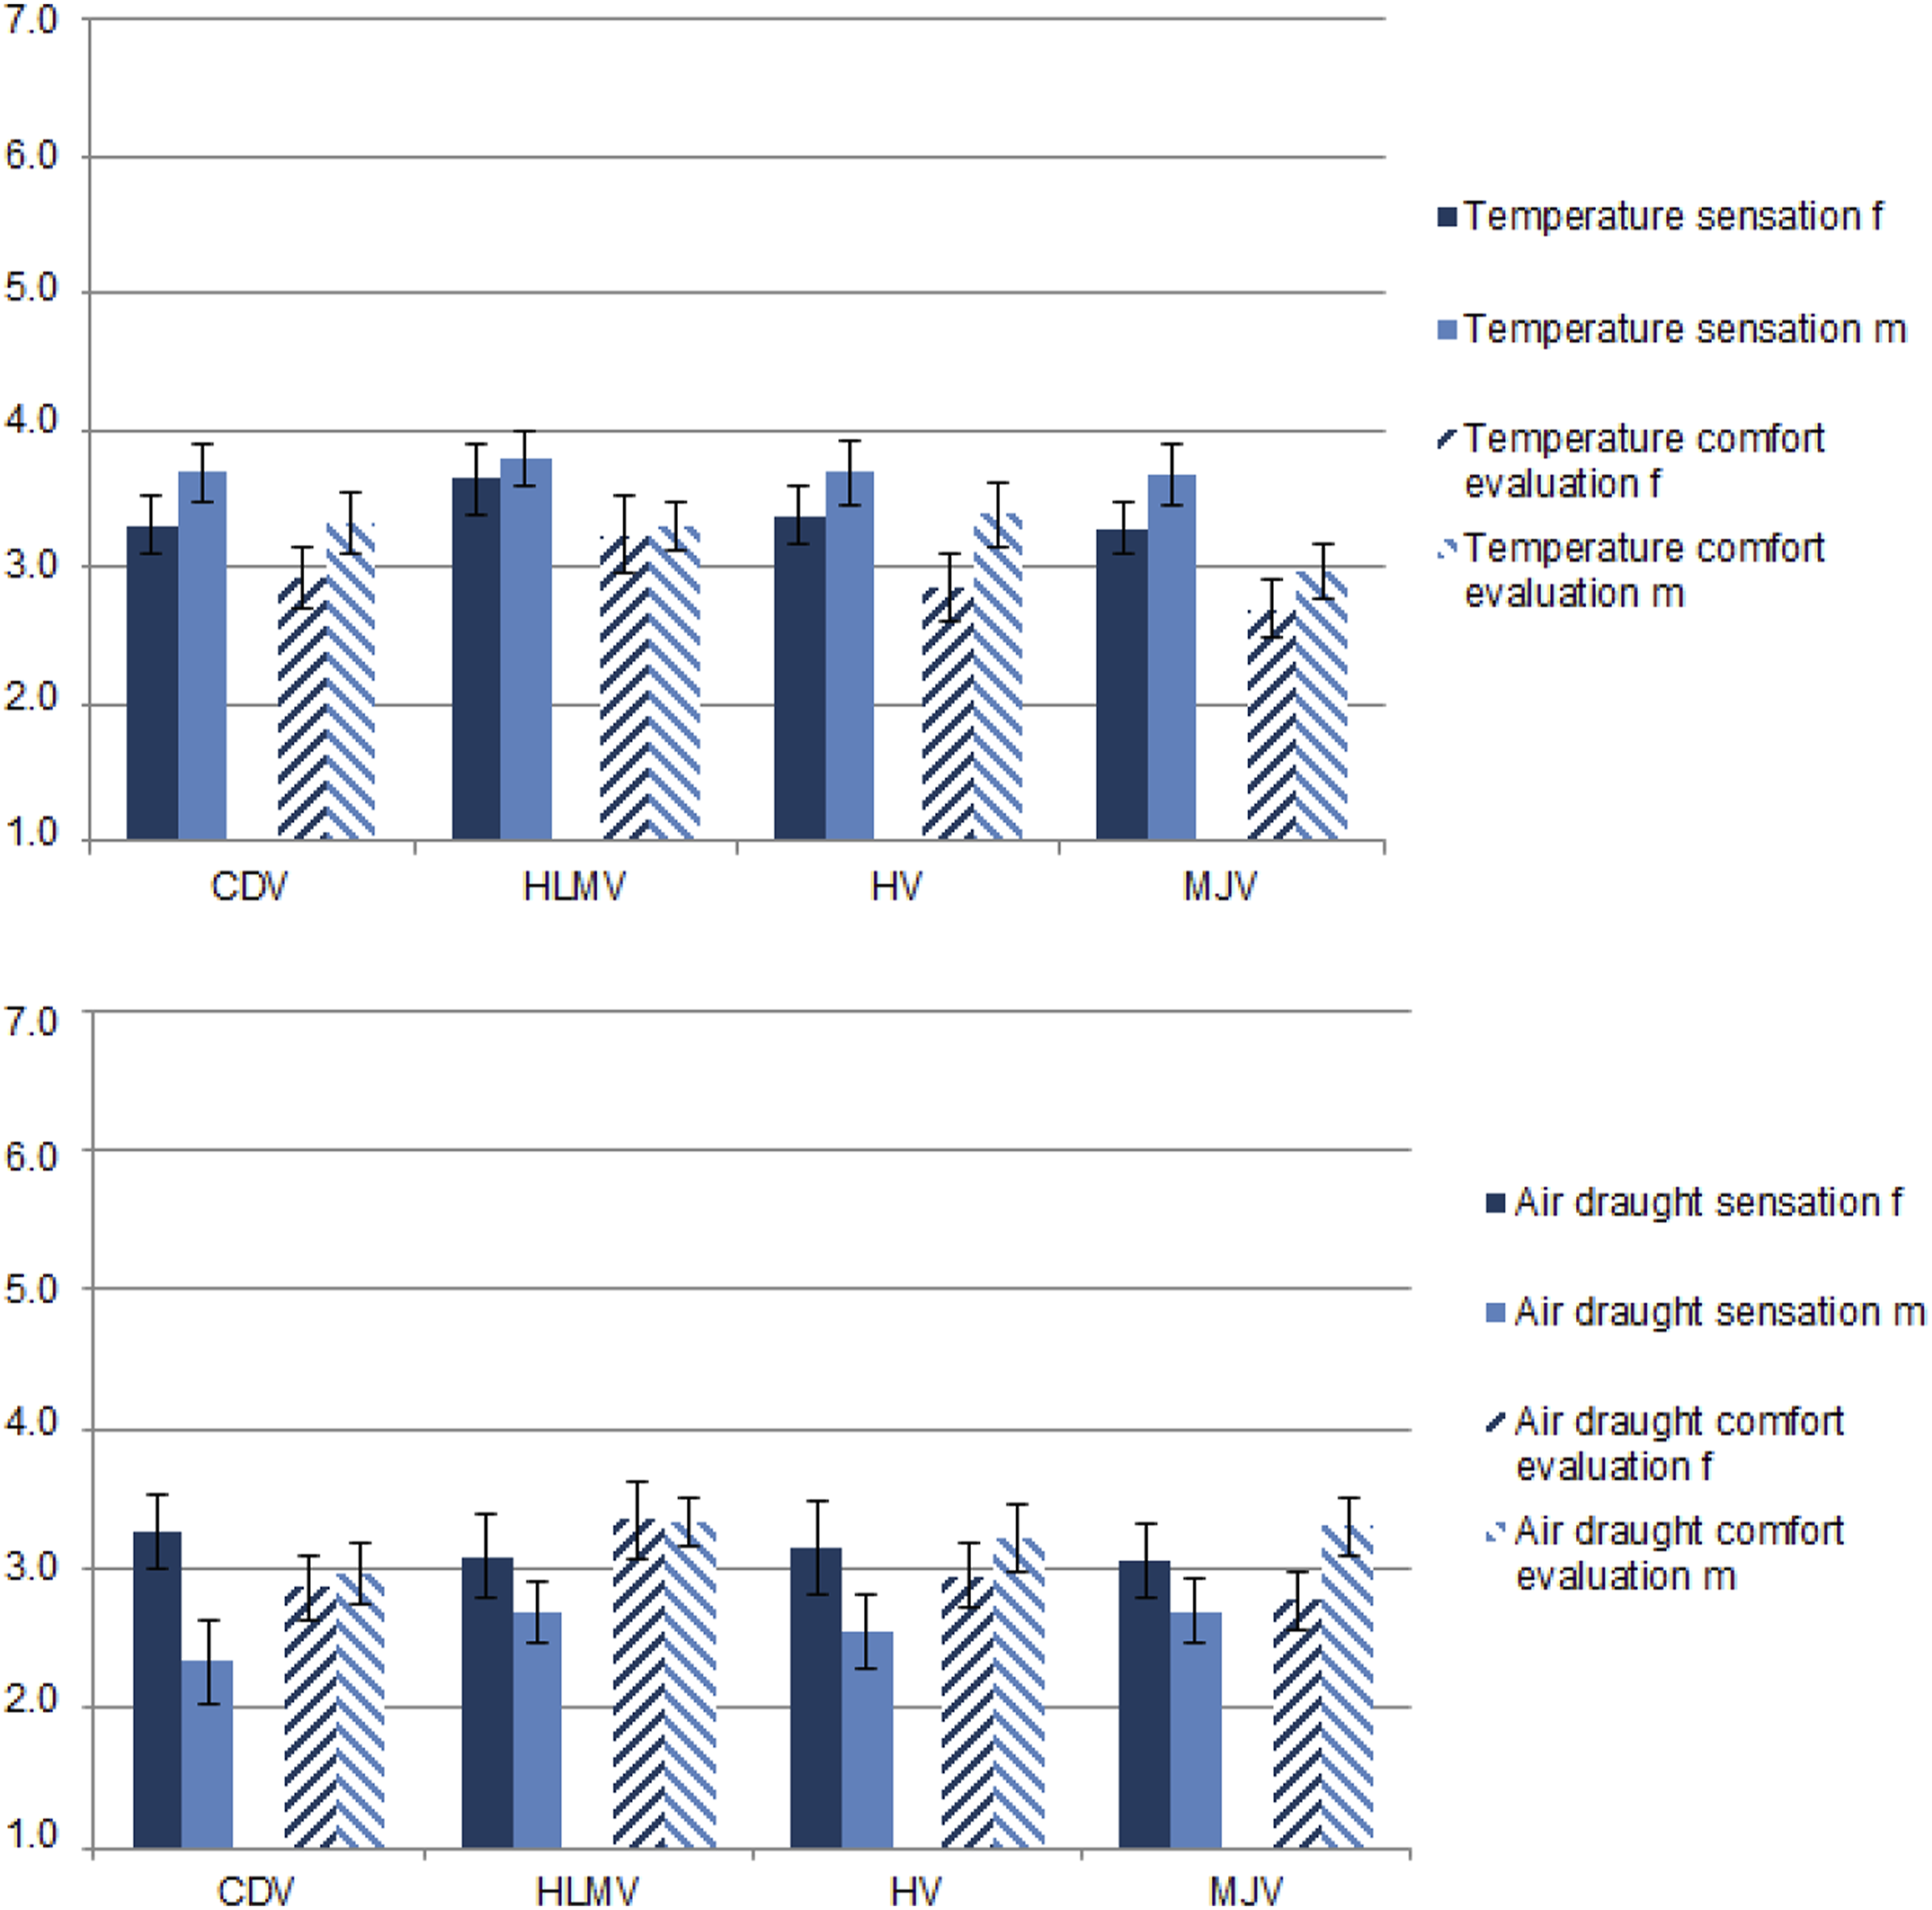
Discussion
In this study, human subject trials were performed to compare three low-momentum ventilation concepts (CDV, HLMV and HV) and MJV with respect to the thermal comfort of railway passengers in two temperature scenarios: cooler (∼22.5°C) vs. warmer (∼25°C) conditions. We intended to align subjective assessments to the recorded objective measurements and results obtained from thermal manikin studies. 7
With two exceptions, we confirmed that the main climate parameters (air temperature, air velocities and relative humidity) were within the quality limits as specified in EN 13129 for all conditions. 11 For CDV, the vertical temperature gradient exceeded even the lower quality limit of EN 13129 in the cooler temperature scenario and should thus be evaluated as providing discomfort for the passengers. This valuation was confirmed by our results from the subjective assessments. In the cooler temperature scenario, thermal comfort was lowest for CDV; air draught and humidity comfort evaluations, in particular, were comparatively low for this ventilation setting. Furthermore, the subjects’ ratings reflected the given vertical temperature gradient accurately (Figures 8(a) and (b)) and indicated comfort losses for the lower body parts (Figures 9(a) and (b)), which presumably contributed to the low thermal comfort rating. These results agree with earlier studies (e.g. Refs. 18, 31) and the findings reported by Schmeling and Volkmann, 7 who compared low-momentum ventilation concepts to MJV in the same laboratory environment with thermal manikins. Although CDV seemed to offer many advantages, especially with respect to the heat removal efficiency, it failed the comfort criterion of vertical temperature stratification.
To achieve higher thermal comfort, the advantages of floor- and ceiling-based low-momentum concepts had been combined in a hybrid (HV) configuration with a 50:50 distribution of the air volume in earlier research. 7 This solution provided noticeable benefits in terms of the vertical stratification on the costs of a lower heat removal efficiency and significant installation problems, especially in double-deck carriages. Therefore, in this study, we used a different HV concept with a 70:30 air distribution through the HLMV system and the CDV system. According to our objective measurements in Table 2, this hybrid solution fully satisfied the stricter quality limits of EN 13129 and retained installation compatibility. In addition, the vertical temperature gradient we identified for the warmer scenario was smaller than 3 K, having no negative consequences for the subjects’ comfort evaluations. On the contrary, our subjects rated HV as yielding the highest thermal comfort overall and regarding the different body parts. Presumably, HV provided more comfortable temperature and air draught conditions compared to CDV, especially at the thighs and feet. Only 30% of the total air volume was supplied from underneath the passenger seats, so no losses of comfort occurred from cool and draughty air at the lower body parts with HV. Splitting the air supply in a ratio of 70:30 thus successfully combined the advantages of HLMV (low-momentum air supply from overhead of the passengers) and CDV (air supply from underneath the passengers’ seats with uprising fresh air) without the respective disadvantages as outlined above.
HLMV, in which fresh air was supplied from overhead only, also provided comfortable conditions, especially in the cooler temperature scenario. The vertical temperature distribution was rather homogeneous in objective and subjective measurements, and good thermal comfort was achieved. However, compared to HV, subjects felt the temperature was slightly too high in the warmer scenario, which corresponded to the measurement data presented in Table 2, and air draught was rated as slightly more uncomfortable in the cooler scenario.
For MJV (the conventional ventilation setting), the objective vertical temperature distribution was equally homogeneous, but some temporary and local exceedances of air velocities were observed, especially in the head and shoulder regions in the warmer temperature conditions. Again, we found corresponding measurement data in our subjective assessments. In the warmer temperature scenario, MJV provided the lowest thermal comfort (Figure 7), and air draught and temperature comfort evaluations were lowest at the head and shoulders compared to the other ventilation settings (Figures 9(b) and 11(b)). Comfort restrictions were not as evident in the cooler temperature scenario.
Summing up the influences of the temperature scenario, we found that thermal comfort and comfort evaluations regarding temperature and air draught were significantly better in the warmer temperature scenarios (25.0°C vs. 22.5°C for the cooler settings) for all low-momentum ventilation settings. This finding confirmed earlier research reporting that maximum thermal comfort for sedentary passengers occurred in warmer temperatures.4,9,14 For instance, women seemed to prefer a ‘cozier’ indoor climate as they systematically perceived the temperature as cooler and less comfortable and the air draught as stronger compared to men’s perceptions (Figure 12), which has been shown earlier. 18 Moreover, they evaluated the air draught as being significantly less comfortable in MJV, which was a further disadvantage of this ventilation setting.
The relations to further individual differences were lower than expected, even though our subjects covered quite a range on these variables. Age, BMI and BMR were unrelated to the comfort ratings in our study. The only significant relationship was that subjects with higher BMR felt the air draught less strongly. According to recent reviews of age, gender or BMI and thermal comfort, the findings are yet controversial. Effects seemed to be more prevalent in field studies compared to laboratory studies.32,33
The human subject trials reported here complement the advantages and disadvantages of the distinct ventilation concepts identified in previous studies with thermal manikins. We found evidence that even slight differences regarding air velocities, mean air temperatures and temperature stratification were sensed by the human subjects and accounted for their evaluations of thermal comfort. However, systematic disparities between groups of individuals with respect to their perceived thermal comfort were also manifested in our data. These differences remain undetected in thermal manikin studies. A better understanding of these effects and considerations during the design stage of railcar ventilation concepts can enhance thermal comfort across a broader range of passengers and, therefore, attract more rail travellers.
Conclusion
With respect to the perceived thermal comfort, HV was the best of the examined ventilation concepts in both the cooler and the warmer air temperature scenarios. According to the ratings of our human subjects, essential factors accounting for poorer thermal comfort were the uneven temperature stratification for CDV and the transient higher air draughts for MJV. However, the heat removal efficiency (HRE) of HV (HRE = 0.54) and HLMV (HRE = 0.48) were below that of CDV (HRE = 0.60), but HV was still 8% better than MJV (HRE = 0.50).
A limitation of our study was that the data were gathered during spring and autumn in a moderate climate zone. Being accustomed to generally more extreme outside temperatures during winter and summer may affect the individual perception of indoor climate parameters. Future studies should examine whether HV can cover such differences, for example, by adapting the supply air temperature or the amount of air volume displaced through the two outlet systems.
Contrasting MJV to the low-momentum ventilation settings, our results showed that thermal comfort in the low-momentum ventilation settings was better (HLMV and HV) or the same (CDV) as in MJV, while enabling comparable (HLMV) or even better heat removal efficiency (HV and CDV). In conclusion, we see great potential in this technical approach for improving thermal conditions in railway passenger cars.
Footnotes
Acknowledgements
We thank all colleagues at the German Aerospace Center (DLR) who assisted in the experiments and data processing.
Authors’ contribution
All authors contributed equally in the preparation of this manuscript.
Declaration of conflicting interests
The authors declared no potential conflicts of interest with respect to the research, authorship and/or publication of this article.
Funding
The author(s) disclosed receipt of the following financial support for the research, authorship, and/or publication of this article: The study was financed by the German Aerospace Center (DLR).