
Abstract
Indoor heat and air pollution pose concurrent threats to human health and wellbeing, and their effects are more pronounced for vulnerable individuals. This study investigates exposures to summertime indoor overheating and airborne particulate matter (PM2.5) experienced by low-income seniors and explores the potential of natural ventilation on maintaining good indoor thermal conditions and air quality (IAQ). Environmental and behavioural monitoring and a series of interviews were conducted during summer 2017 in 24 senior apartments on three public housing sites in NJ, USA (1930s’ low-rise, 1960s’ high-rise and LEED-certified 2010s’ mid-rise). All sites had high exposures to overheating and PM2.5 concentrations during heat waves and on regular summer days, but with substantial between-site and between-apartment variability. Overheating was higher in the 30s’ low-rise site, while pollutant levels were higher in the 60s’ high-rise. Mixed linear models indicated a thermal and air quality trade-off with window opening (WO), especially in some ‘smoking’ units from the older sites, but also improved both thermal and PM2.5 concentration conditions in 20% of the apartments. Findings suggest that with warmer future summers, greater focus is needed on the interdependencies among (1) thermal and IAQ outcomes and (2) technological and behavioural dimensions of efforts to improve comfort for vulnerable occupants.
Keywords
Introduction
Extreme heat events are among the deadliest environmental hazards, whose frequency and intensity are projected to increase in the near future.1,2 Similarly, polluted air is one of the top threats to human health and welfare,3,4 with a documented relationship to increased temperatures. 5
Existing research has shown that ground-level ozone (O3), particulate matter (PM) and nitrogen dioxide (NO2) increase during periods of excessively hot weather known as heat waves (HWs).5,6,7,8,9,10 During the extreme European HW of 2003, Tressol et al. 11 correlated high O3 with higher temperature and humidity levels, while Mues et al. 12 showed correlations among PM10 concentrations and high daily maximum temperatures all over Europe. Furthermore, several studies have linked heat-related mortality to elevated pollutant levels.9,13,14
The concurrent impacts of heat and air pollution on health and wellbeing are even more evident in densely populated urban areas due to urban heat island effects and multiple sources of pollutants.1,15,16,17 In a cross-country study, Sera et al. 18 found that heat-related mortality can be higher in cities with elevated levels of air pollution and limited green spaces and also in places with lower income levels and less access to health services. Neighbourhoods with racial-ethnic minorities and socially isolated groups like low-income older adults are at higher heat-health risk.5,19,20,21,22 They are also more likely to reside close to pollution sources, like factories and highways.23,24,25
Factors affecting indoor heat and pollutant levels
Considering that people,26,27 especially seniors, 28 spend about 90% of their time indoors, understanding and reducing indoor exposures to heat and air pollution is vital. Indoor and outdoor environmental conditions are closely linked,29,30,31 but the strength of this relationship, and consequently much of individual exposures depends heavily on building characteristics and occupant activities, as discussed below. These factors are, in turn, subject to social, economic and demographic considerations in residential environments. 32
Fanger 33 showed that subjective perceptions of satisfaction with the thermal environment, broadly describing thermal comfort, 34 can be predicted by objective air temperature measurements, mean radiant temperature, air velocity, air humidity values, clothing level and physical activity level. Outdoor conditions can affect indoor air temperature and humidity. Building systems can affect mean radiant temperature and air velocity indoors, and occupants can determine and control their clothing and physical activity levels. Critics note that this model, while still useful, fails to account adequately for contextual factors such as climate and access to natural ventilation. 35 Recent work on thermal comfort highlights important interpersonal variability in perceptions, contexts and adaptive behaviours.36,37
Building characteristics such as dwelling size, heating type, ventilation and air-conditioning (HVAC) systems, air tightness and insulation, floor level, orientation and shading could affect the indoor environmental quality (IEQ).30,38,39,40,41 Indoor environmental quality, inclusive of thermal comfort, indoor air quality (IAQ), lighting and acoustics, is also affected by occupant behaviours such as time spent at home (occupancy), opening windows, operating fans and air-conditioning (A/C) units.42,43,44
Cleaning practices, smoking, cooking with gas, lighting candles/incense and having pets have been further linked to indoor pollutant levels.41,45,46,47,48,49 However, these features may differ for low-income residents, who often live in less well-constructed multi-family buildings and with higher occupant density.45,46 Likewise, occupant activities such as window opening (WO), depending on the availability of resources, are likely to correlate with income, and depend on personal factors, including age and health.30,50,51
Natural ventilation as a modifier of indoor environmental conditions
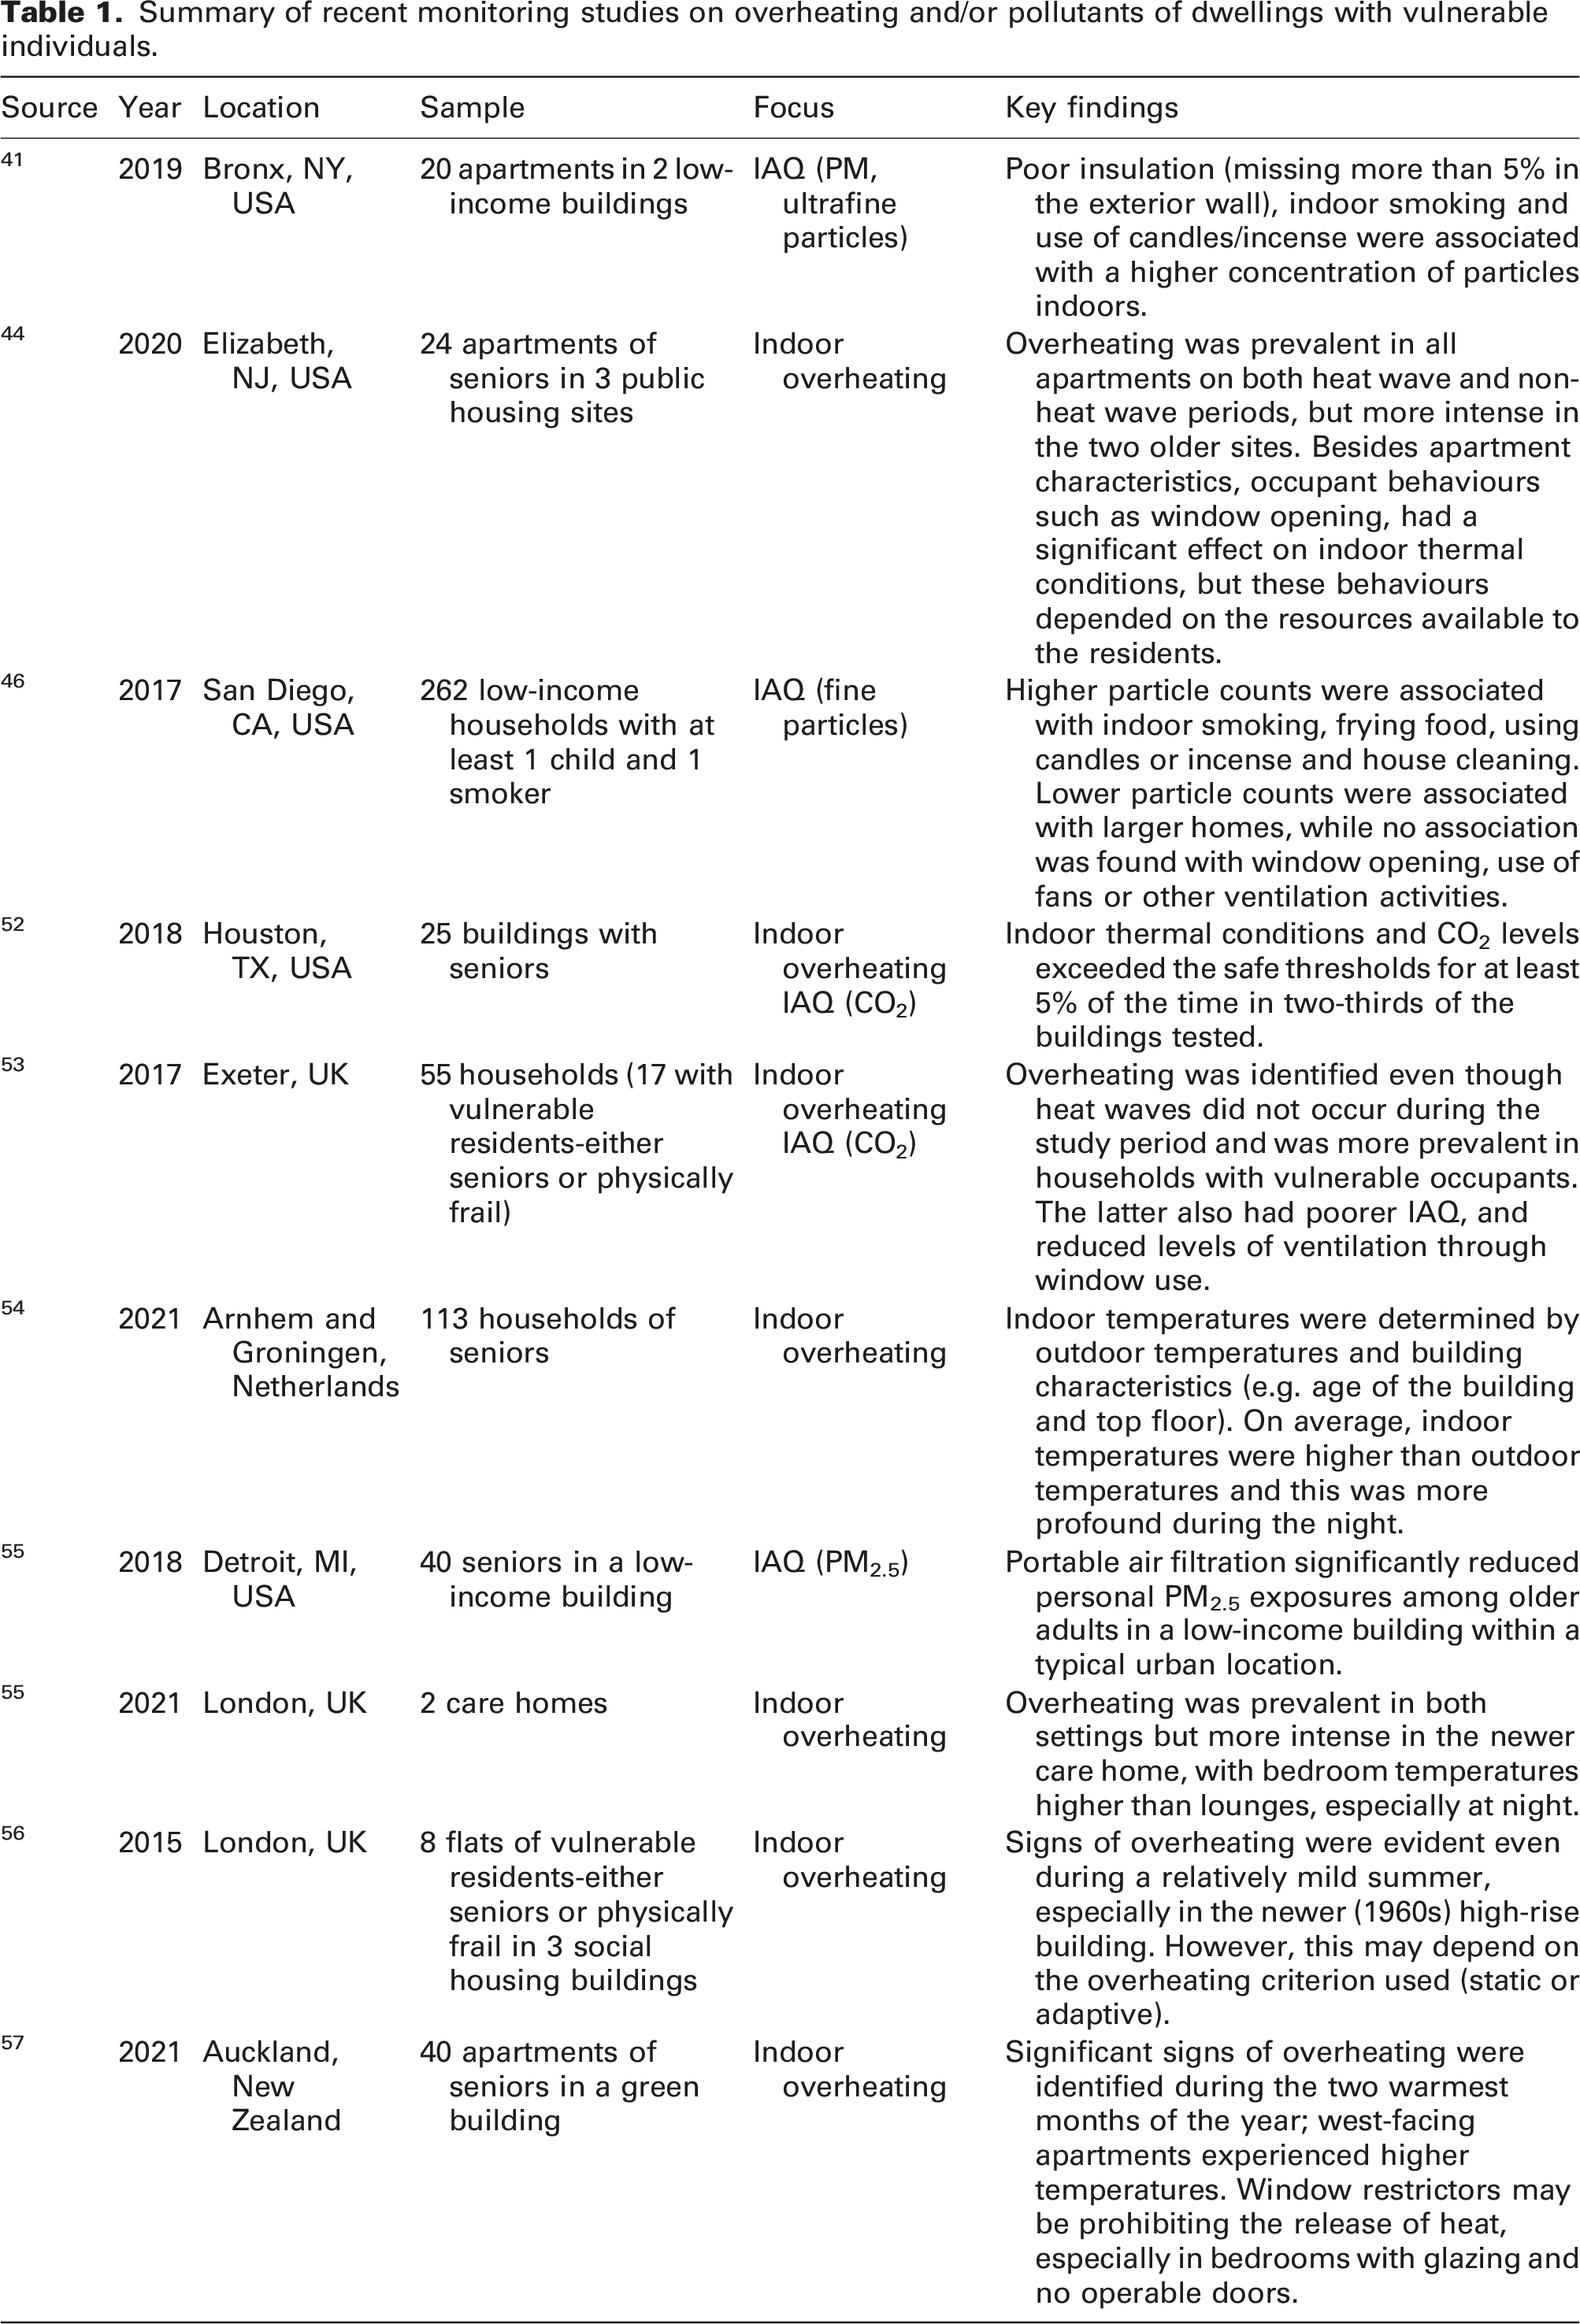
Summary of recent monitoring studies on overheating and/or pollutants of dwellings with vulnerable individuals.
There is also a wealth of literature on building adaptation strategies to improve IEQ. For overheating reduction, these range from a focus on mechanical ventilation and the use of A/C to passive measures that include natural ventilation and the operation of windows.60,61 Along with other passive strategies, natural ventilation has been shown to have a positive impact on reduced summer energy use, thermal comfort and overheating reduction.55,62,63,64,65,66 Jeong et al. 60 and Park and Kim 67 have further noted that window operation may be among the most preferred ways for residents to control thermal conditions even in mechanically ventilated buildings. Lastly, it may be one of the few available options for households with income constraints.44,68
While the operation of windows for natural ventilation can be a potentially effective indoor strategy to mitigate overheating, WO is also an important determinant of IAQ 56 and relationships between WO and IAQ are often conflicting. In some instances, WO has been shown to improve thermal comfort and may increase indoor PM2.5 concentrations coming from outdoor sources. 69 Inversely, opening windows to reduce pollutant concentrations from indoor sources may lead to increased heat gain or loss from outdoors.
Besides personal and contextual factors, residential activities, such as WO, may be driven by a range of IEQ stimuli that happen at the same time. Yet, most observational and field studies of IEQ focus on single and not multi-domain influences on WO. 70 In addition, the effect of natural ventilation on indoor environmental conditions is explored mainly through modelling data. As a result, there is limited empirical documentation of WO patterns and their effect on IAQ, especially for specific population segments, which may vary substantially from the patterns assumed in modelling studies.
Study objectives
As summarized above, due to the complex and synergistic effects of heat and air pollution, it is important that thermal comfort decision-making for residential environments also considers IAQ. Monitoring studies of indoor thermal and air quality conditions and resident activities in socially vulnerable settings can further our understanding of the actual interactions between occupants and buildings. Consequently, they can inform realistic strategies to improve indoor living conditions for these populations.
As part of a study that aimed to evaluate the impacts of heat waves on the health and wellbeing of low-income seniors in the US, in the present paper, we investigated exposures to summertime indoor overheating and pollutants (PM2.5) experienced by elderly individuals residing in different public housing sites. We further explored the potential of no-cost adaptation strategies, such as occupant-controlled natural ventilation, in mitigating excess indoor heat while maintaining good IAQ. Our selection of PM2.5 as the pollutant of interest is due to its multiple adverse health effects, as well as its documented connection to elevated temperatures.5,71 In addition, PM2.5 and ozone are the dominant air pollutants of concern in the USA. 71 Overheating risks and their multi-level influences on the thermal performance of these dwellings have been investigated in an earlier publication. 44
Our overarching research objective was to improve our understanding of the relationship between indoor environmental conditions and natural ventilation. To this end, we sought to: • document and evaluate indoor thermal and PM2.5 levels experienced by low-income seniors, • observe variations in overheating and airborne pollutants across and within sites and identify sources of variability, • examine the effect of WO behaviours on these variations and identify thermal and air quality trade-offs, and • suggest potentially effective ventilation strategies to reduce overheating and PM2.5 exposures for different types of public housing.
Methods
The study employed a mixed-method research design, drawing on environmental and behavioural monitoring of 24 apartments occupied by older adults within three public housing sites in Elizabeth, NJ, USA, and on a series of interviews with residents, conducted during the summer 2017 (May until October), as further explained in the following two sections and shown in Figure 1. Data analysis explored variations in indoor thermal conditions and PM2.5 concentrations across the study units and assessed exceedances of thresholds according to known standards and guidelines presented in the last Methods section and potential sources of variability. Mixed linear models were then utilized to examine the effect of WO behaviours on IEQ and to identify thermal and air quality synergies and trade-offs. Lastly, WO patterns of apartments were analysed to understand ways for improving indoor environmental conditions. Study timeline and data collection across summer 2017.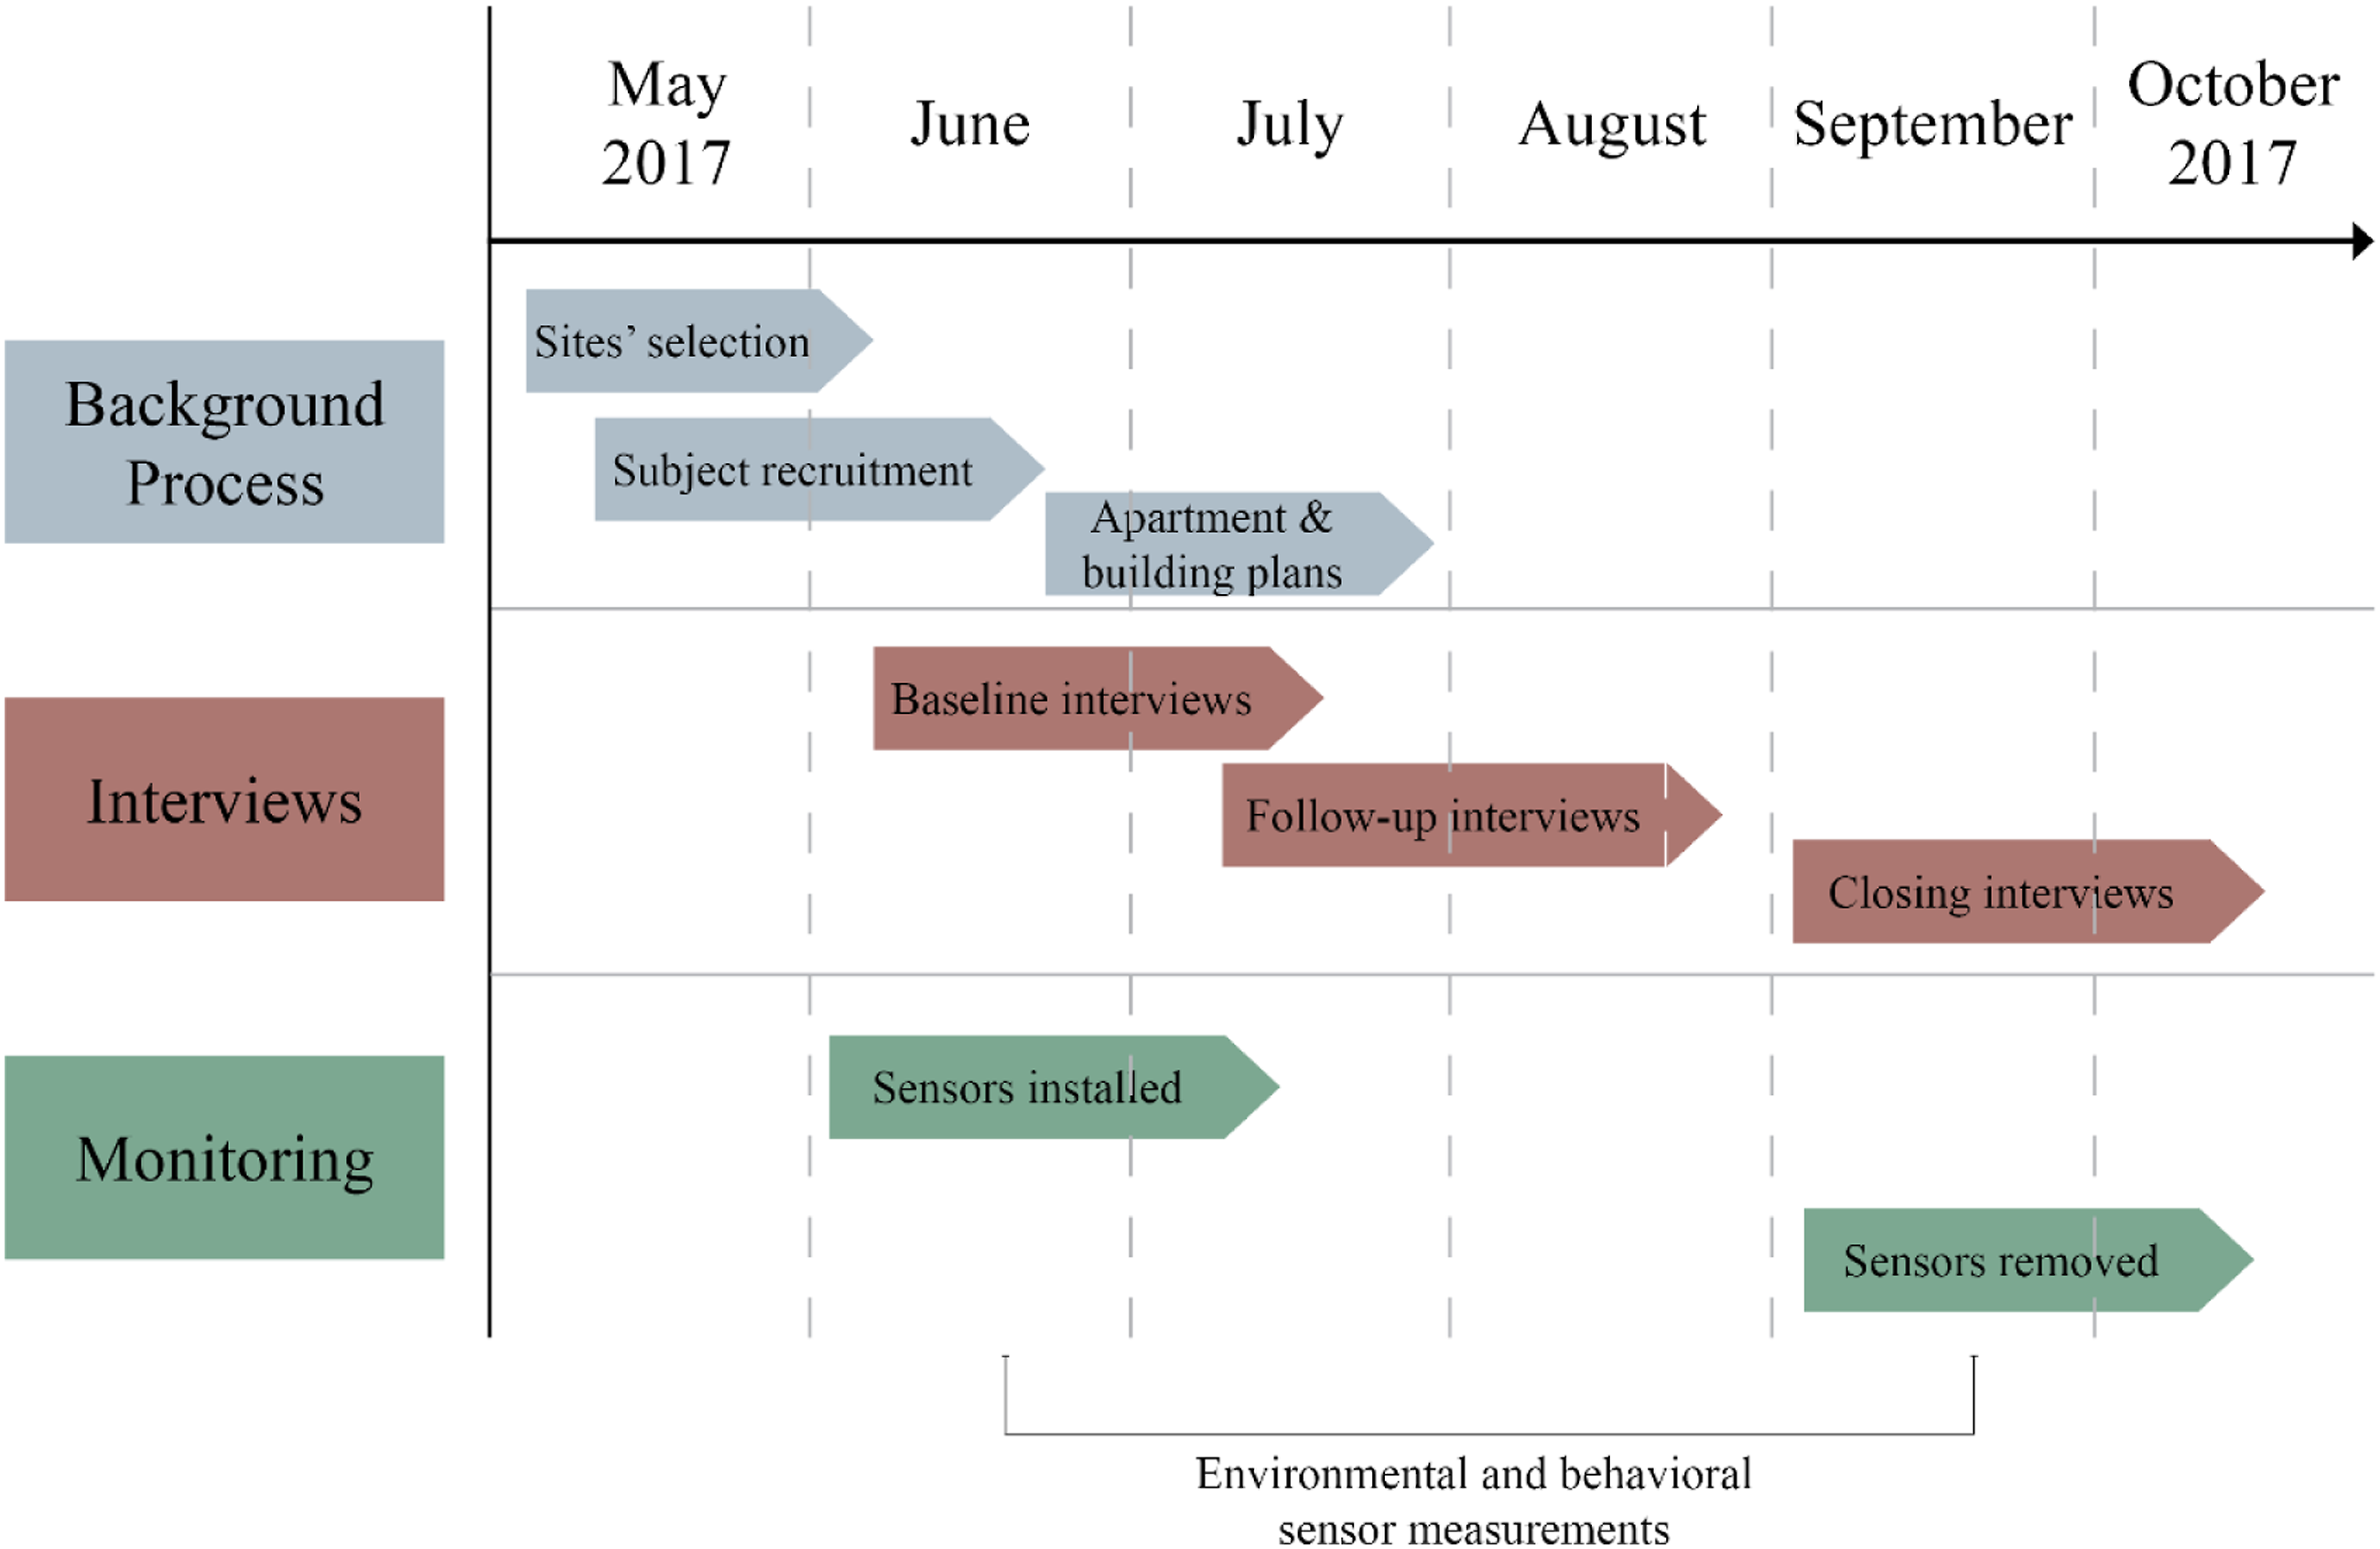
Case study overview
The data used in this paper were collected from three sites operated by a public housing authority in Elizabeth, NJ. NJ’s climate is characterized by moderately cold and snowy winters and warm, humid summers, with average minimum temperatures in January between −9°C to −1°C and average maximum temperatures in July between 26°C to 32°C. 72 Elizabeth is a highly urbanized city of 129,000 with an industrial character. As such, it is subject to urban heat island effects during extreme heat periods, which are expected to increase in the future, as NJ is warming faster than the global average and the rest of the Northeast USA (average annual temperature increase of 1.9°C compared to 0.8°C and 1.1°C, respectively, for the past century). 73 Elizabeth also has some of the highest air pollution levels in NJ, specifically the highest annual average (8.94 µg/m3) concentrations of ambient PM2.5. 74 These environmental challenges are more likely to impact socially vulnerable populations, such as seniors in public housing, who may reside in less well-constructed environments or a lack of modern temperature control amenities. 38
After discussions and agreement with the housing authority, we first selected three different sites (A, B and C) with varied characteristics in buildings and surroundings in order to cover a range of US public housing types; these are summarized below and are shown in Figure 2. Locations of the study sites in Elizabeth, NJ.
75
• Site A (1930s' low-rise): Built in 1938, it is comprised of 15 3-storey masonry brick buildings with 423 apartments (1 and 2-bedroom) for families and seniors. The old flat roofs were replaced by asphalt tiled peak roofs in 2002. None of the buildings has central A/C and in the summer, residents mostly rely on the use of window A/C units. In addition, all apartments are cross-ventilated (with windows on two or three sides). Windows are single hung with double pane glass insulation. The average window dimensions are 0.6 m × 1.2 m with 35% openable area. Within the site, there is a community centre and in between the buildings, there exist community gardens and shaded yards with trees and benches. • Site B (1960s' high-rise): Built in 1967, it has an 11-storey building of concrete block walls with 121 apartments (1-bedroom) for seniors. The old roofing was replaced by new PVC roofing in 2006. Same as with site A, the apartments do not have central A/C, and the residents operate window A/C units in the summer months. Windows are single hung with double pane glass insulation. The average window dimensions are 0.6 m × 1.2 m with 38% openable area. Within the site, there are back and front shaded yards with tall trees and benches, as well as a community garden. • Site C (2010s’ LEED-certified mid-rise): Built in 2011, it has a 4-storey green building (LEED-certified) of wood, steel and concrete with 31 apartments (1-bedroom) for seniors. The building has central A/C and its cost is included in the rent, but there are no outdoor amenities available. Windows are awing with single pane glass insulation. Average window dimensions are 0.7 m × 1.4 m with 40% openable area.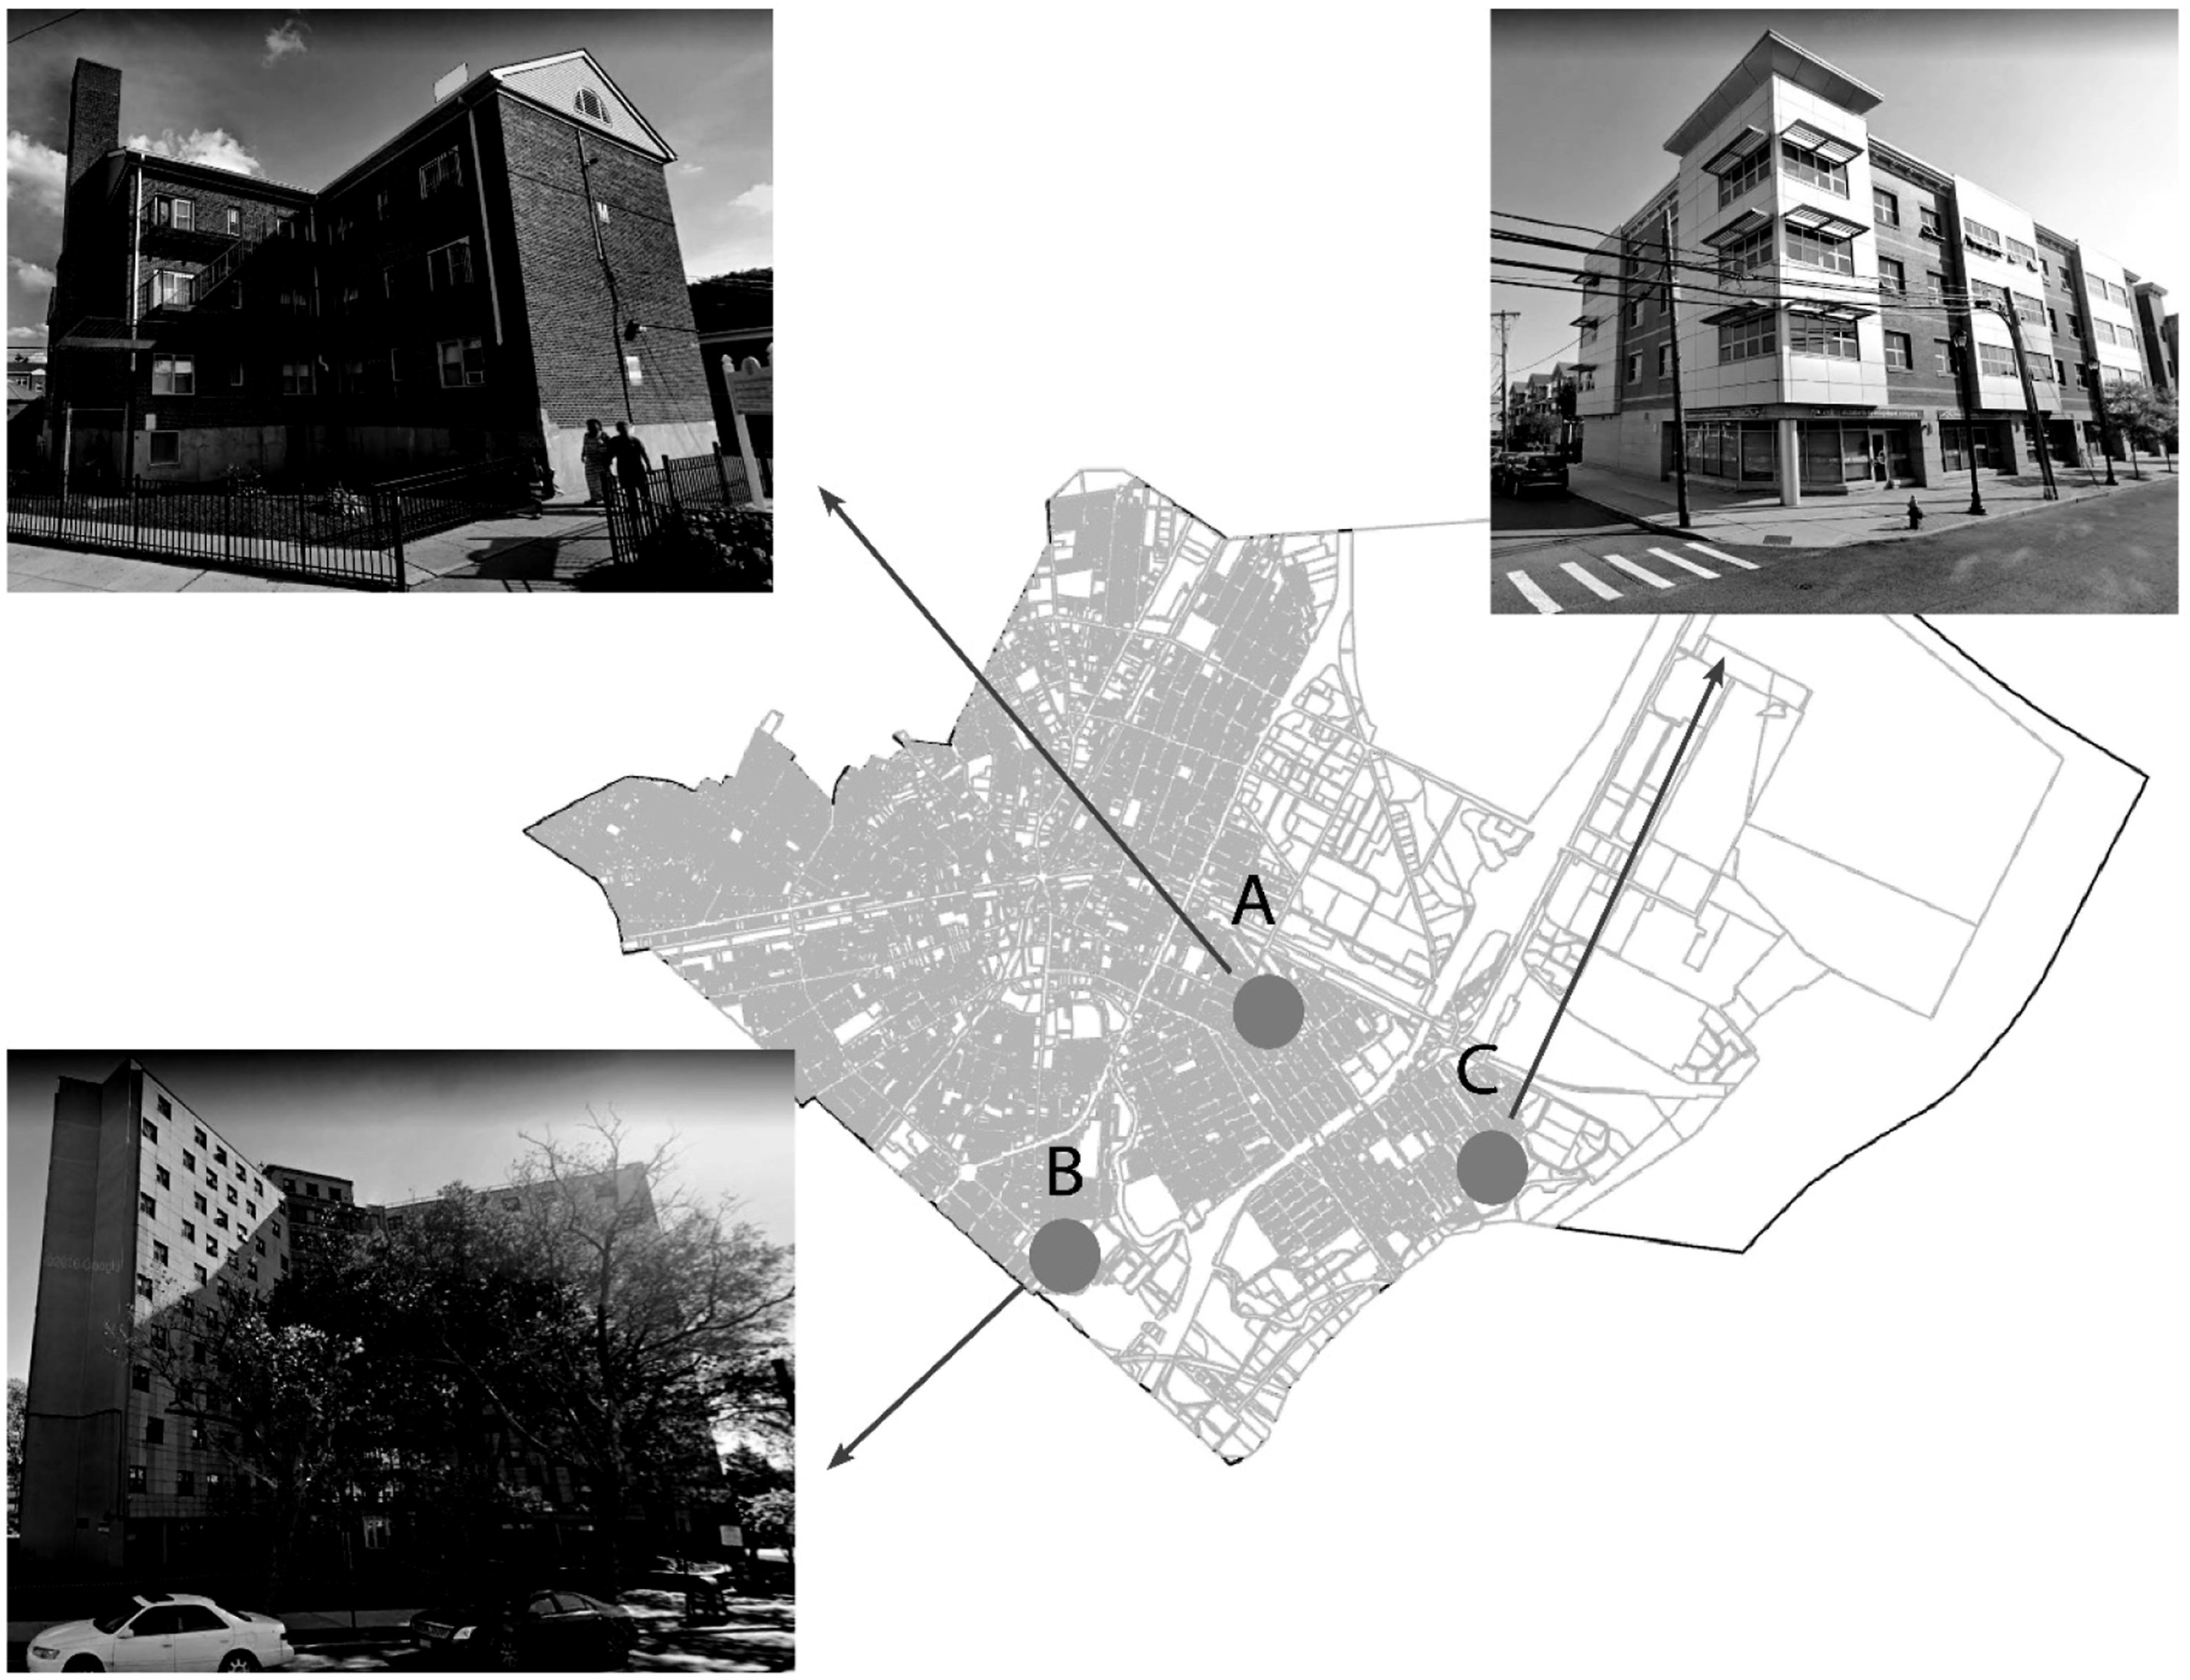
We then organized one lunch information session for each study site based on Rutgers University’s Institutional Review Board protocol with both English and Spanish-speaking team members, which introduced the project to the residents, and resulted in the recruitment of 24 seniors (>55 years); 11 from site A, 9 from site B and 4 from site C. We distributed an agreement form to subjects, along with a $50 gift card. Each was given a unique identifier for anonymity and agreed to participate in three rounds of interviews and have sensors installed in their apartment for summer 2017.
The three rounds of interviews were: baseline, follow-up and closing, further described below. All data collected from the interviews were stored online (through the unique IDs). • Baseline: Baseline interviews lasted for 50 min and were conducted in-person, once for each subject during May-June 2017 (resulted in a total of 24 questionnaires). Sensors were installed inside subjects’ apartments during these interviews. The baseline included questions related to demographics, health, community/social networks support, apartment characteristics, overall thermal comfort and behaviours. • Follow-up: These were 5-min phone or in-person contacts and were conducted during or after each heat wave period, for the five heat waves of summer 2017 (resulted in a total of 96 questionnaires). They included questions related to health and support, as well as thermal comfort and behaviours during the heat waves. • Closing: Closing interviews lasted for 10-min and were conducted in-person, once at the end of the data collection period (resulted in a total of 24 questionnaires). Sensors were removed from apartments during these interviews and subjects received a $50 gift card. They included questions related to their outdoor activities, comparison of summer 2017 thermal conditions with previous summers and to apartment, building and site improvement recommendations.
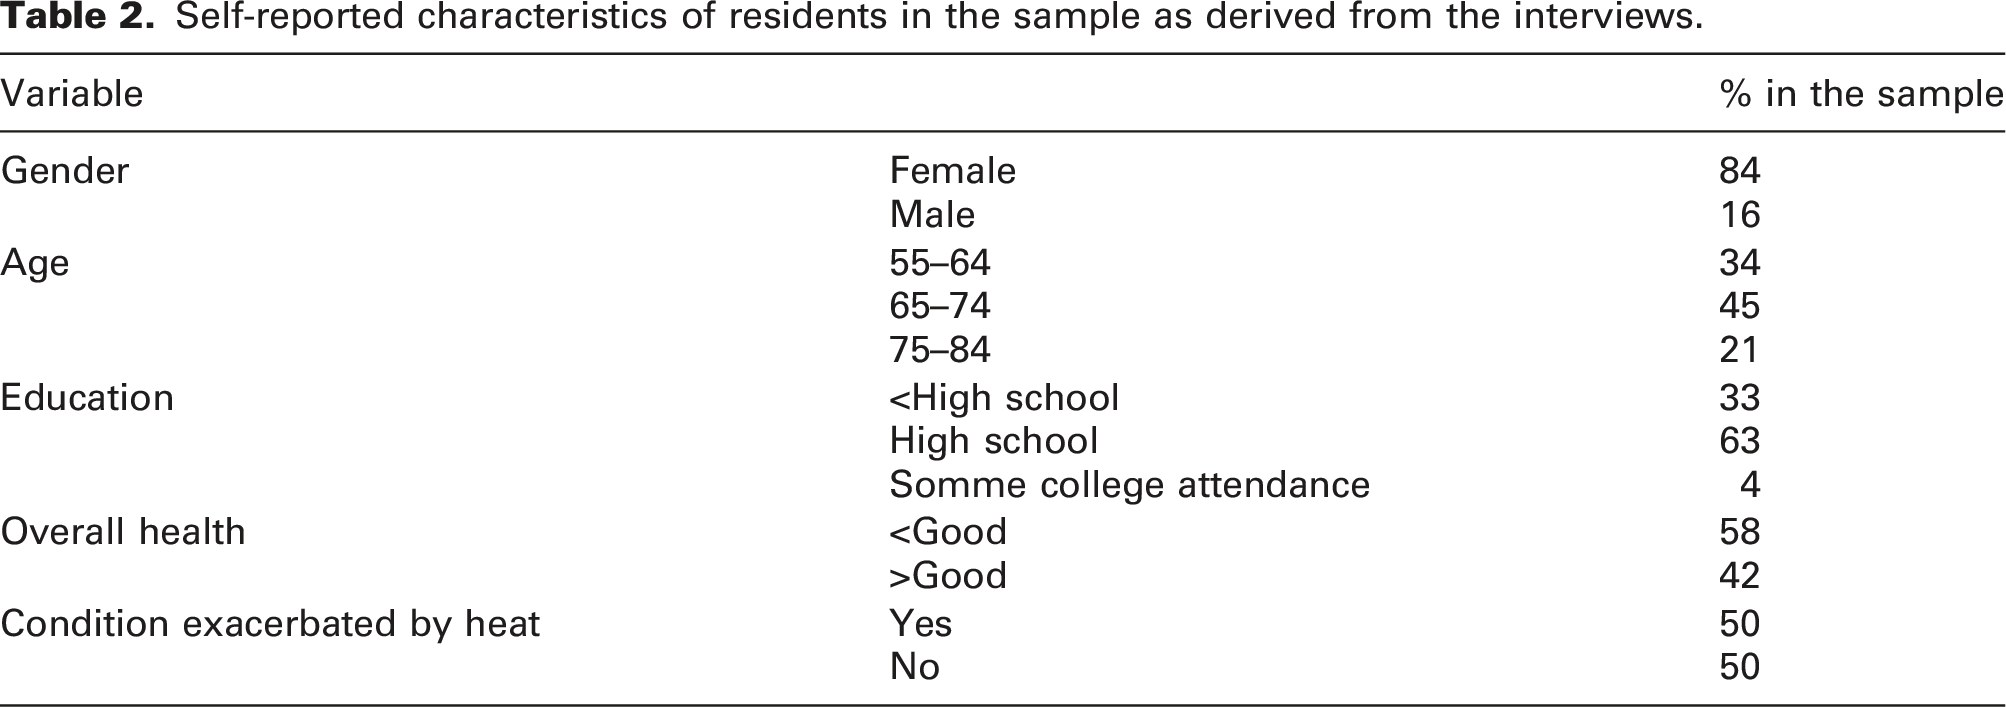
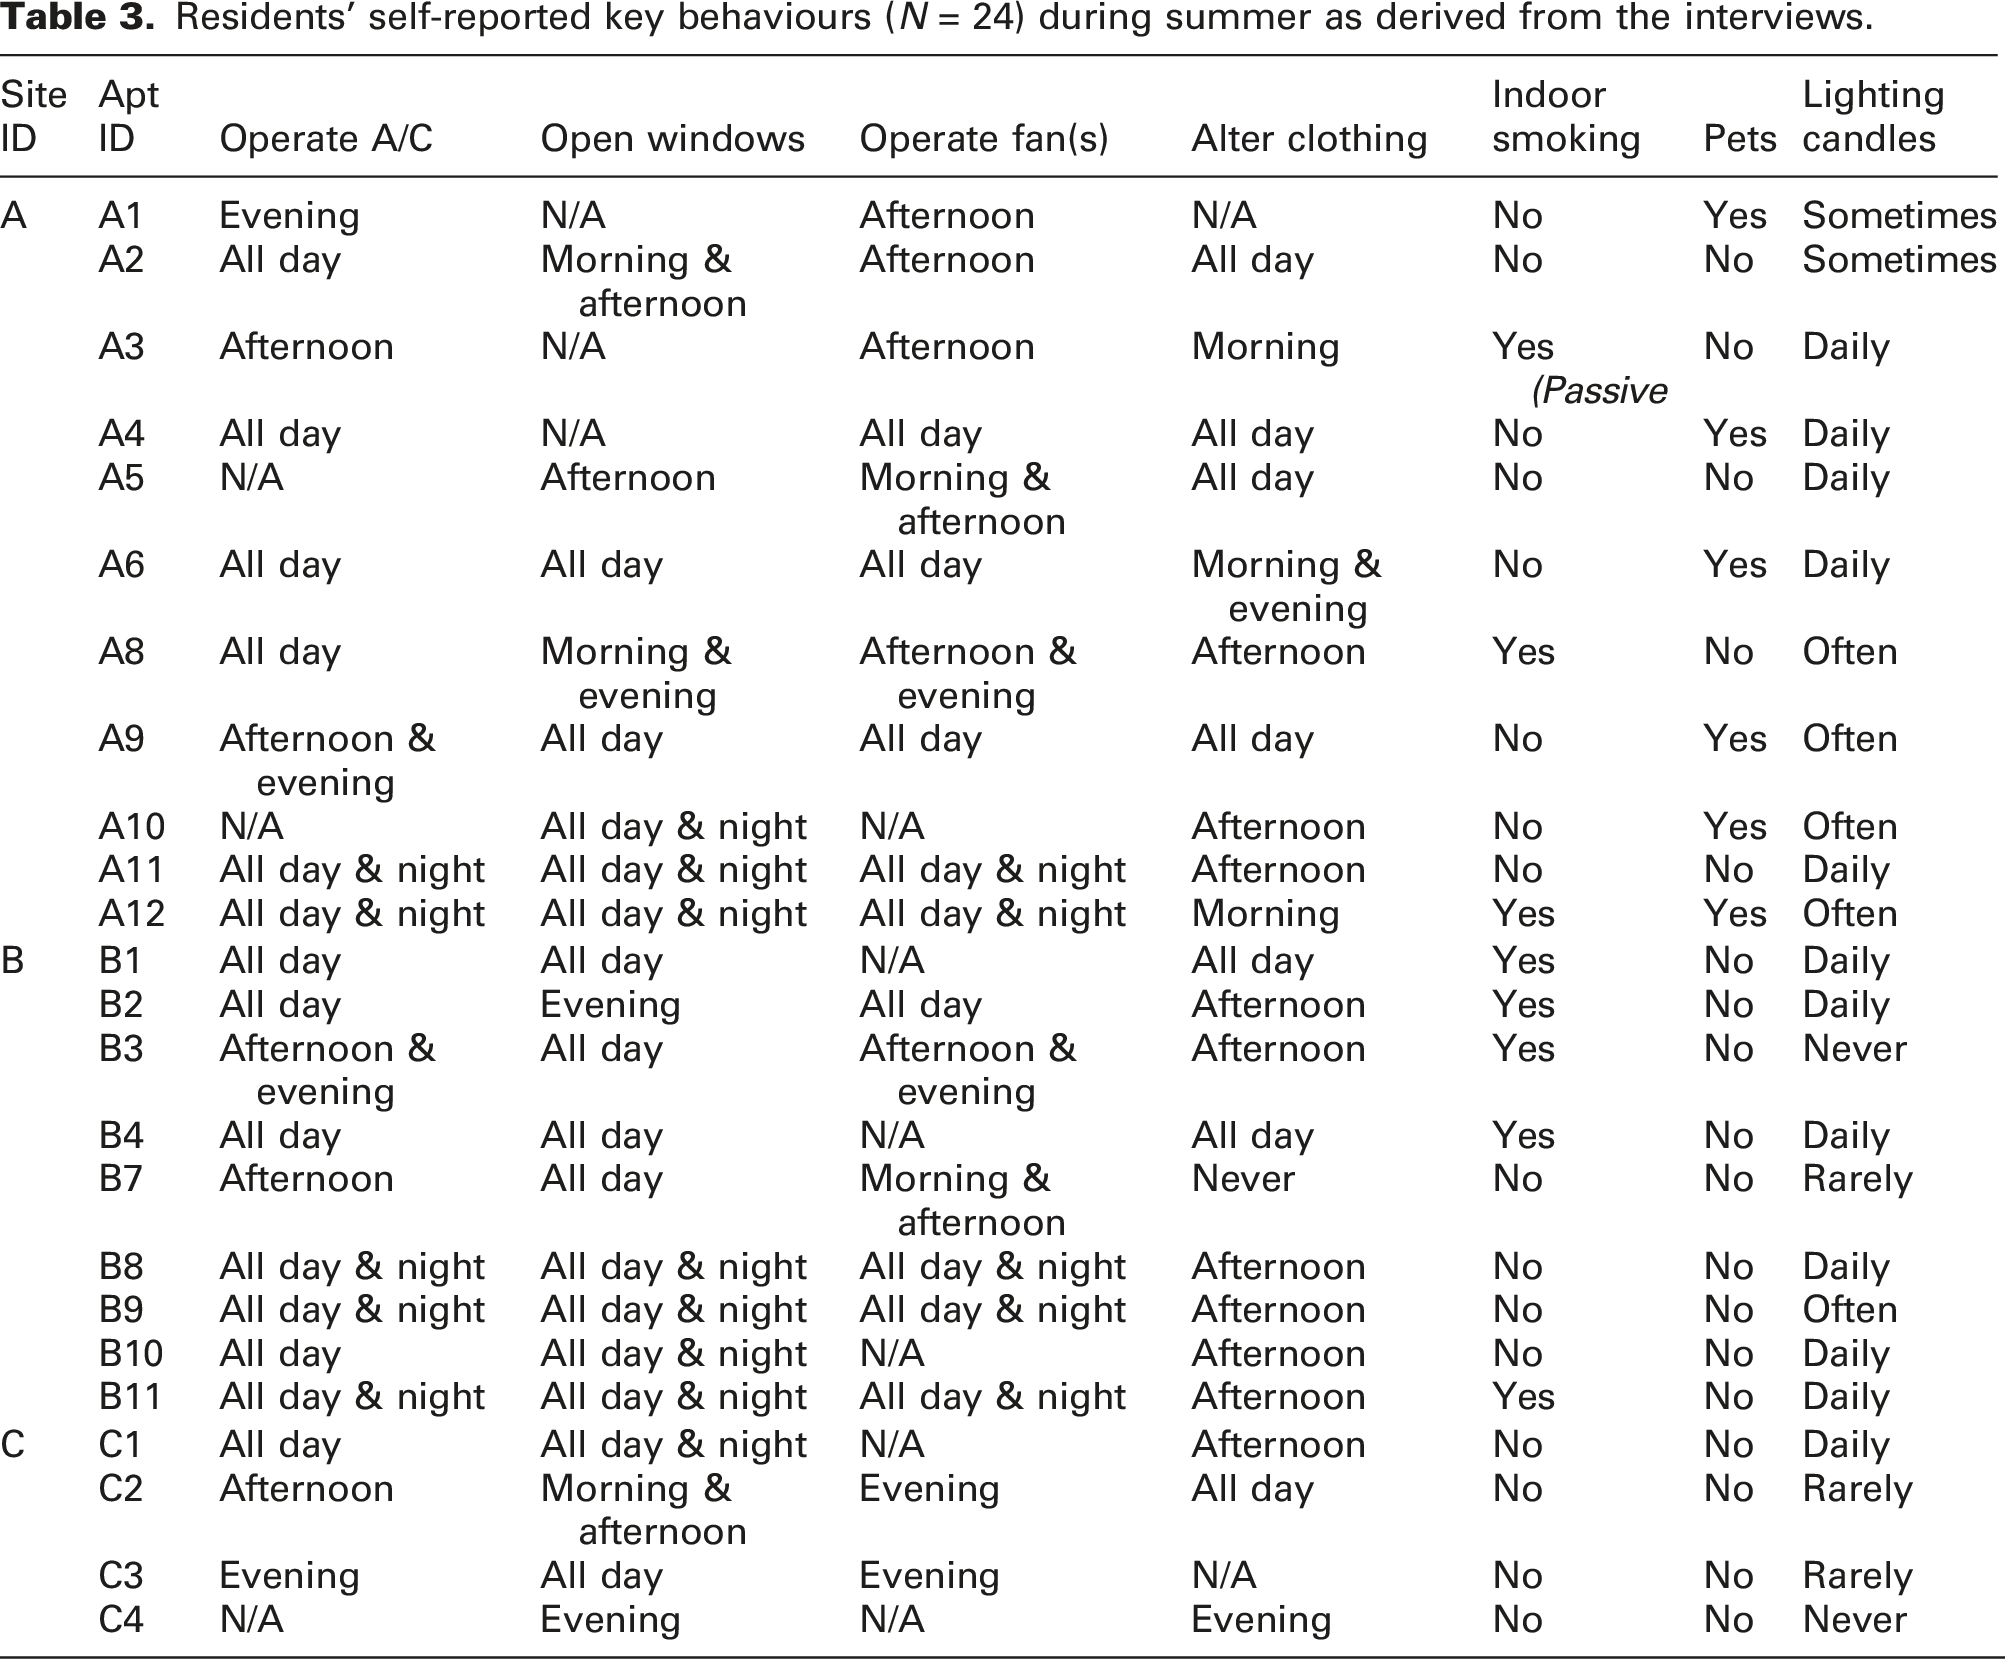
Self-reported characteristics of residents in the sample as derived from the interviews.
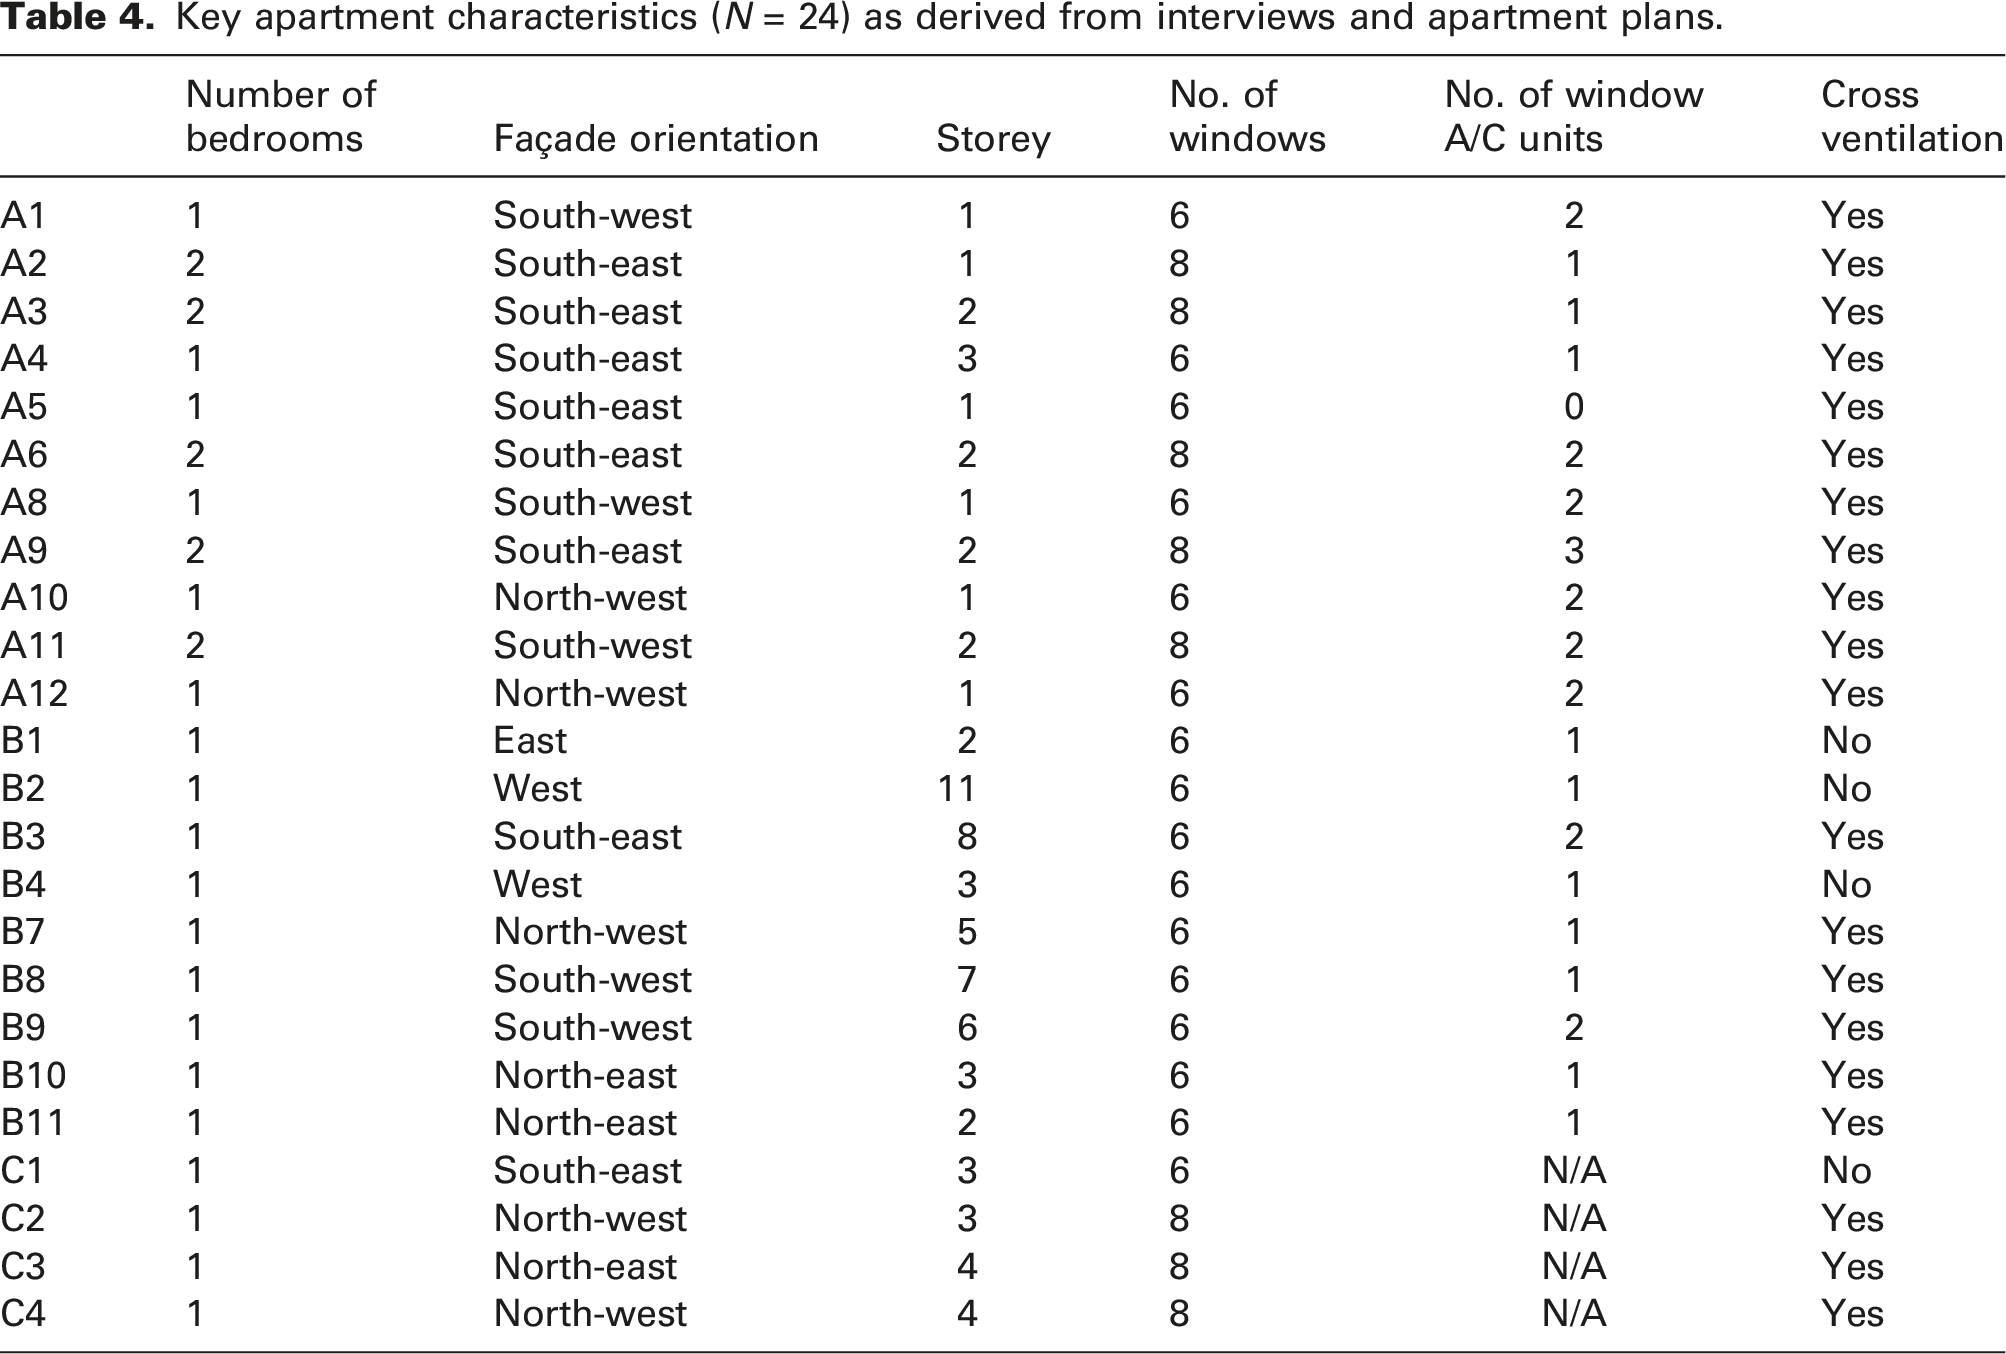
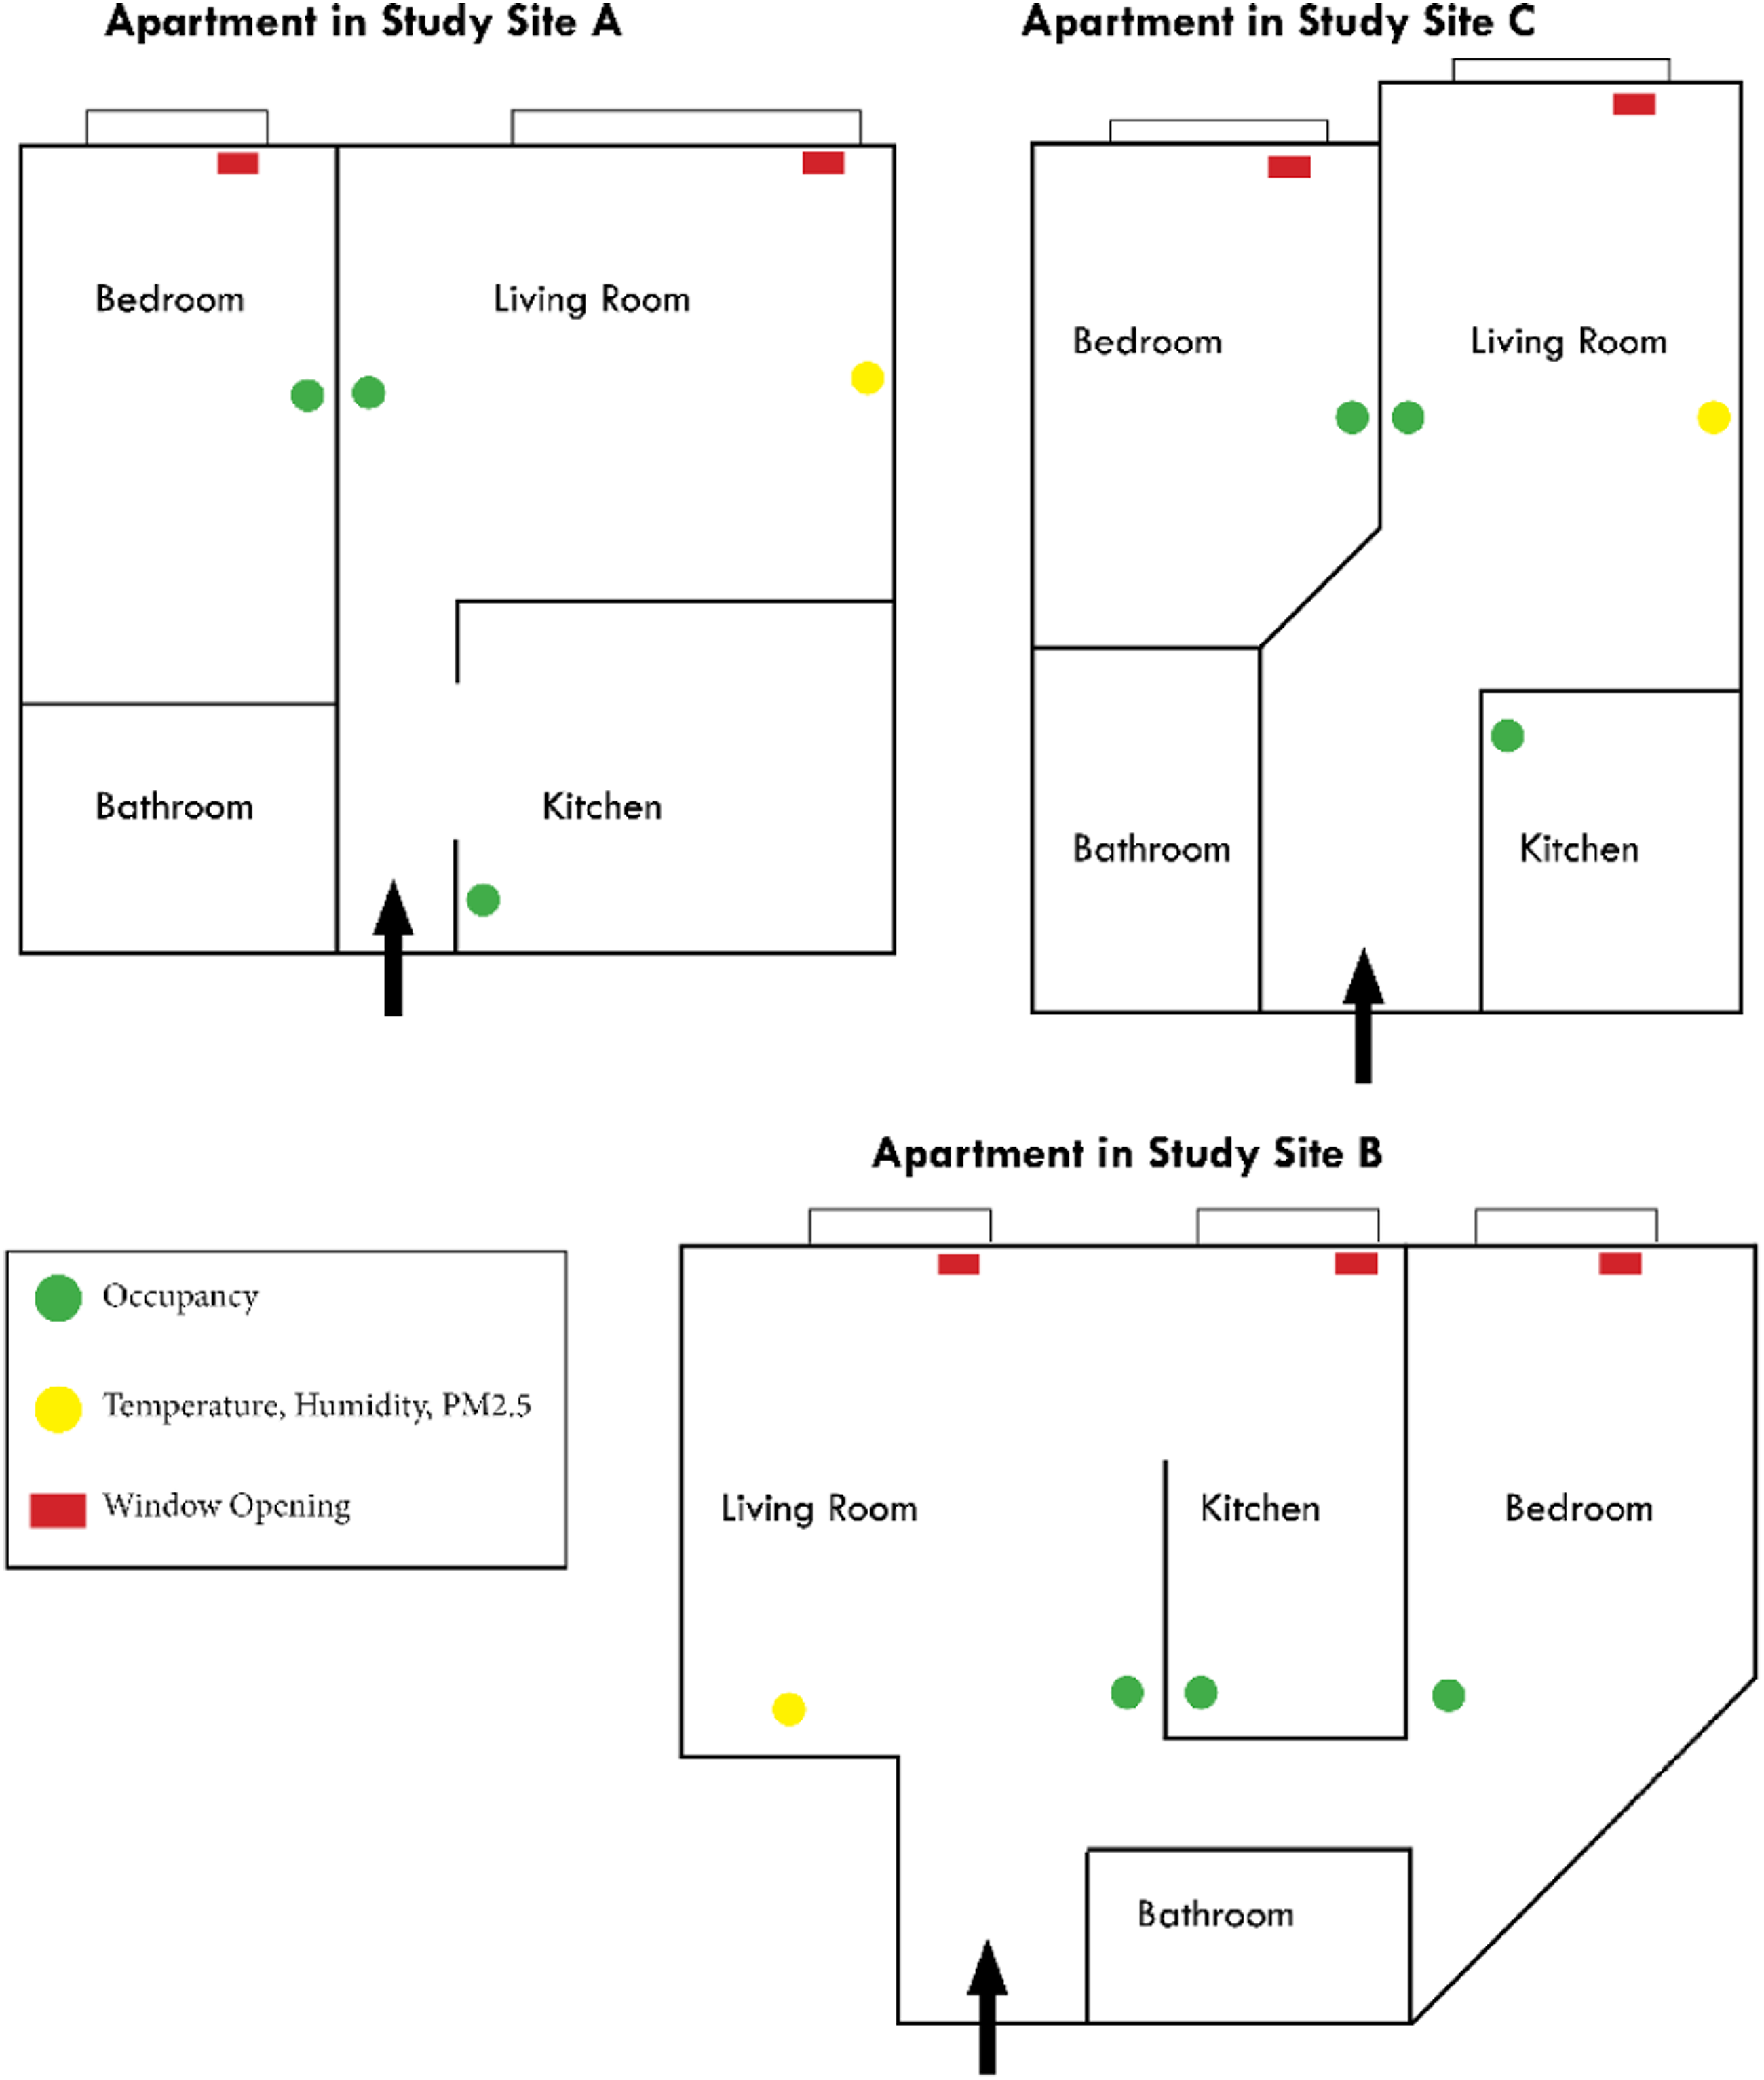
Additionally, we obtained apartment and building plans from the housing authority (Figure 3). Key characteristics of participants' behaviours and their apartments are summarized in Tables 3 and 4. Typical apartment layouts for 1-bedroom units from each study site (A, B and C). Residents’ self-reported key behaviours (N = 24) during summer as derived from the interviews. Key apartment characteristics (N = 24) as derived from interviews and apartment plans.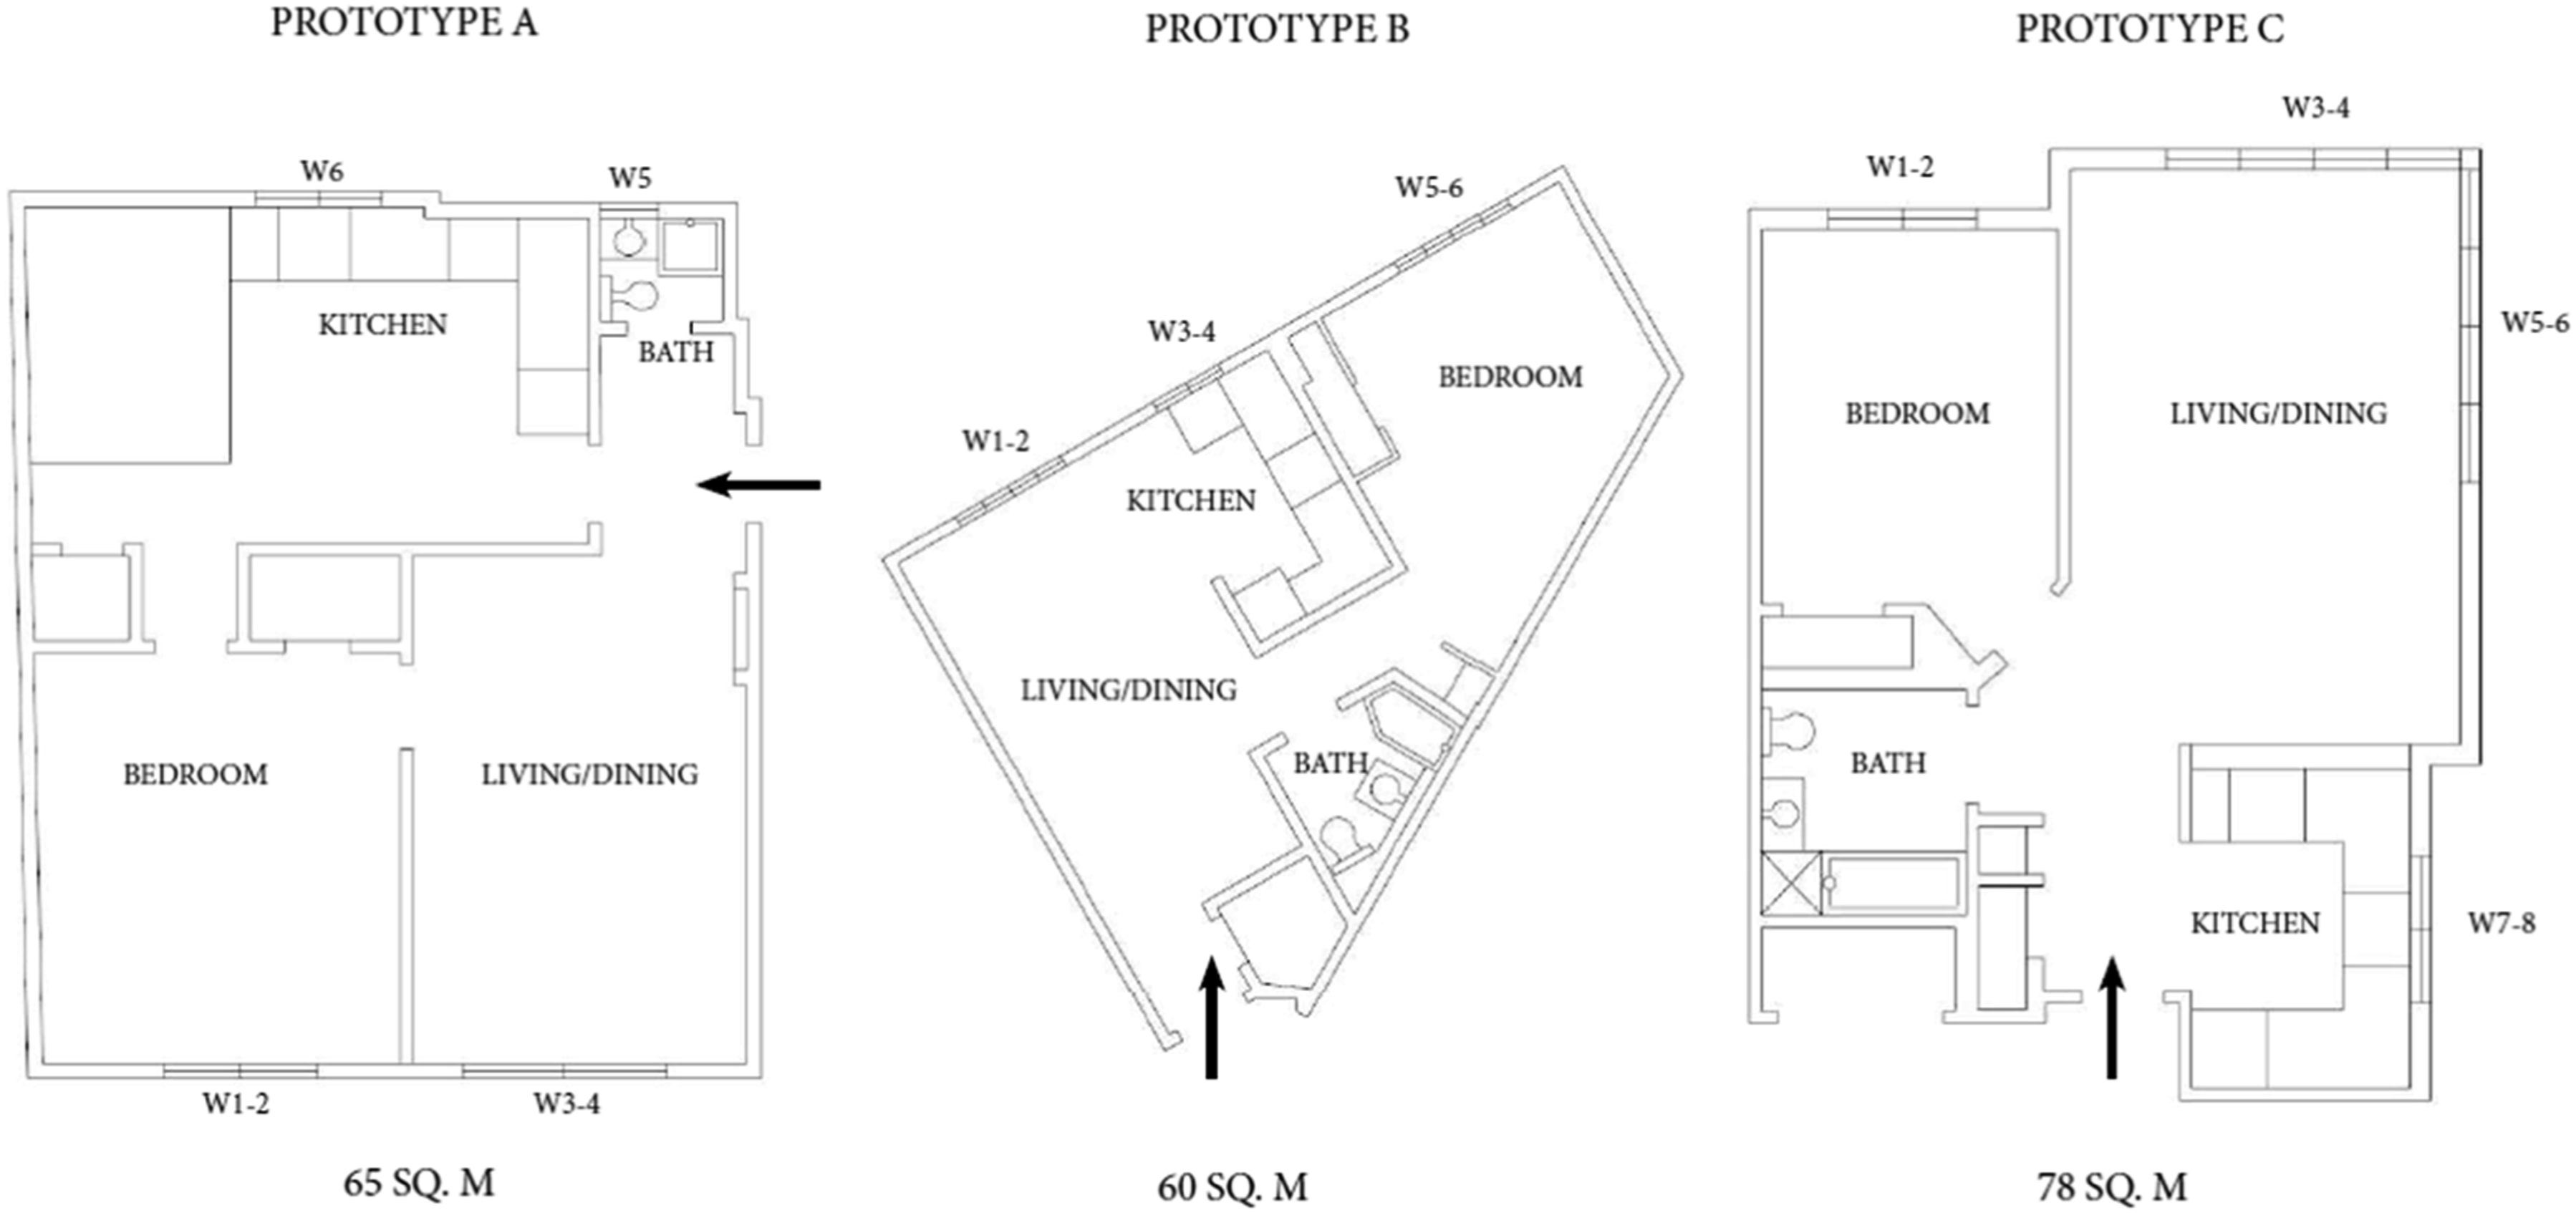
Environmental and behavioural monitoring
Consumer-grade sensors were calibrated against professional-grade instruments and installed in each of the 24 sample apartments, as well as in an empty (control) apartment and in an outdoor location within site A. The devices monitored environmental conditions (air temperature, relative humidity and PM2.5 concentration) through AirVisual
76
indoors and outdoors; occupant behaviours (occupancy and window operation) were monitored through Monnit.
77
For the calibration, AirVisual was compared to an IAQ Meter (IAQ, TSI Inc
78
) for 2.5 h in a 0.6 m wide x 1.2 m deep x 1.2 m high Aerosol Exposure Chamber at Rutgers University (temperature:
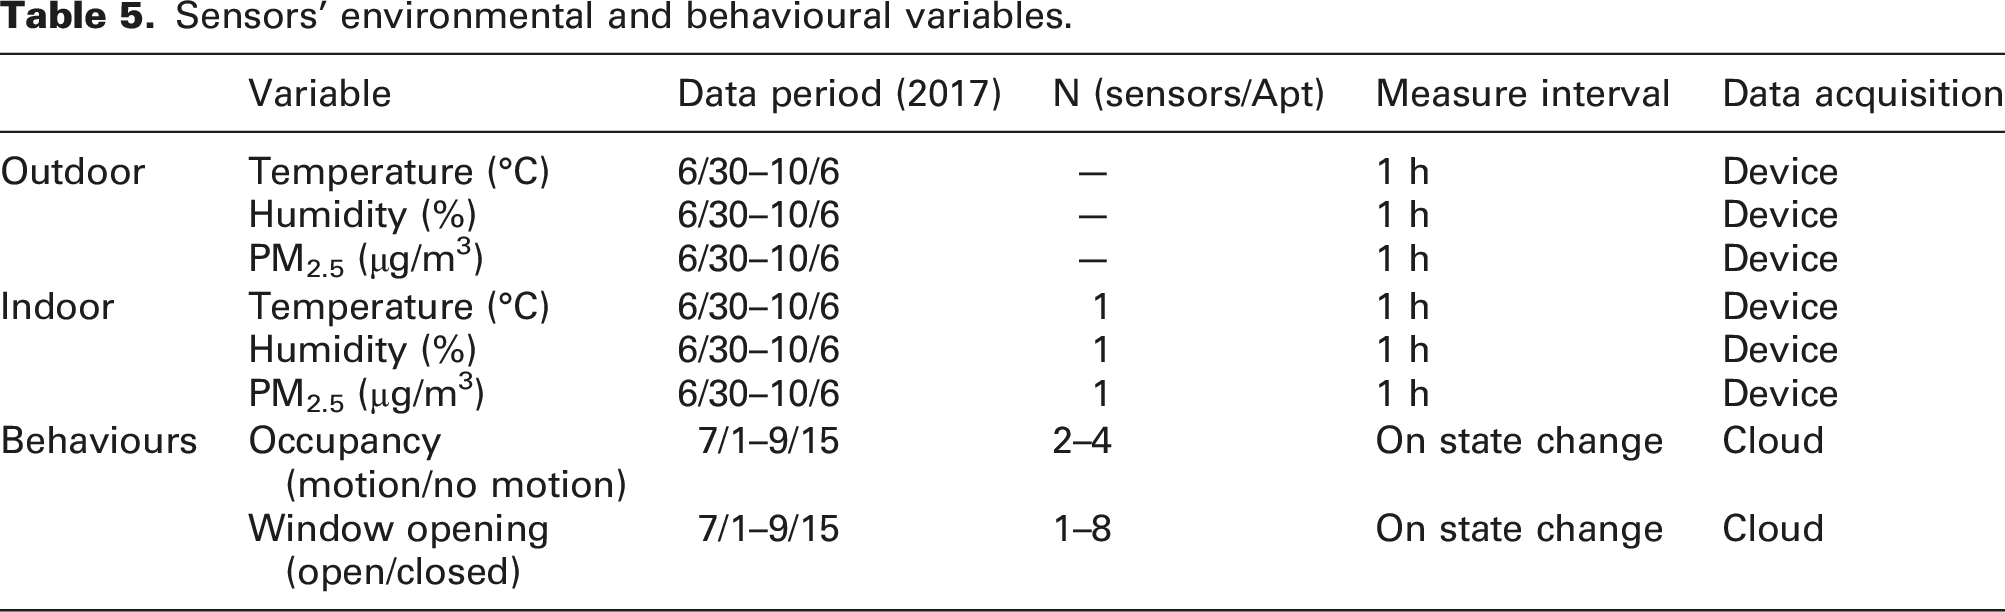
Environmental and occupancy sensors were located at a 0.4–0.8 m height and at least 0.5 m from the wall in each apartment. Temperature, humidity and PM2.5 were measured in the living rooms, while occupancy and window operation were measured in both living rooms (and kitchens) and bedrooms. The sensor network is shown in Figure 4 and sensor locations in typical sample apartments in Figure 5. Table 5 summarizes the sensors’ environmental and behavioural variables. Outdoors, the environmental sensors were placed within a Stevenson protective box 1.5 m above the ground. The sensor network. Sensor locations in typical sample apartments. Sensors’ environmental and behavioural variables.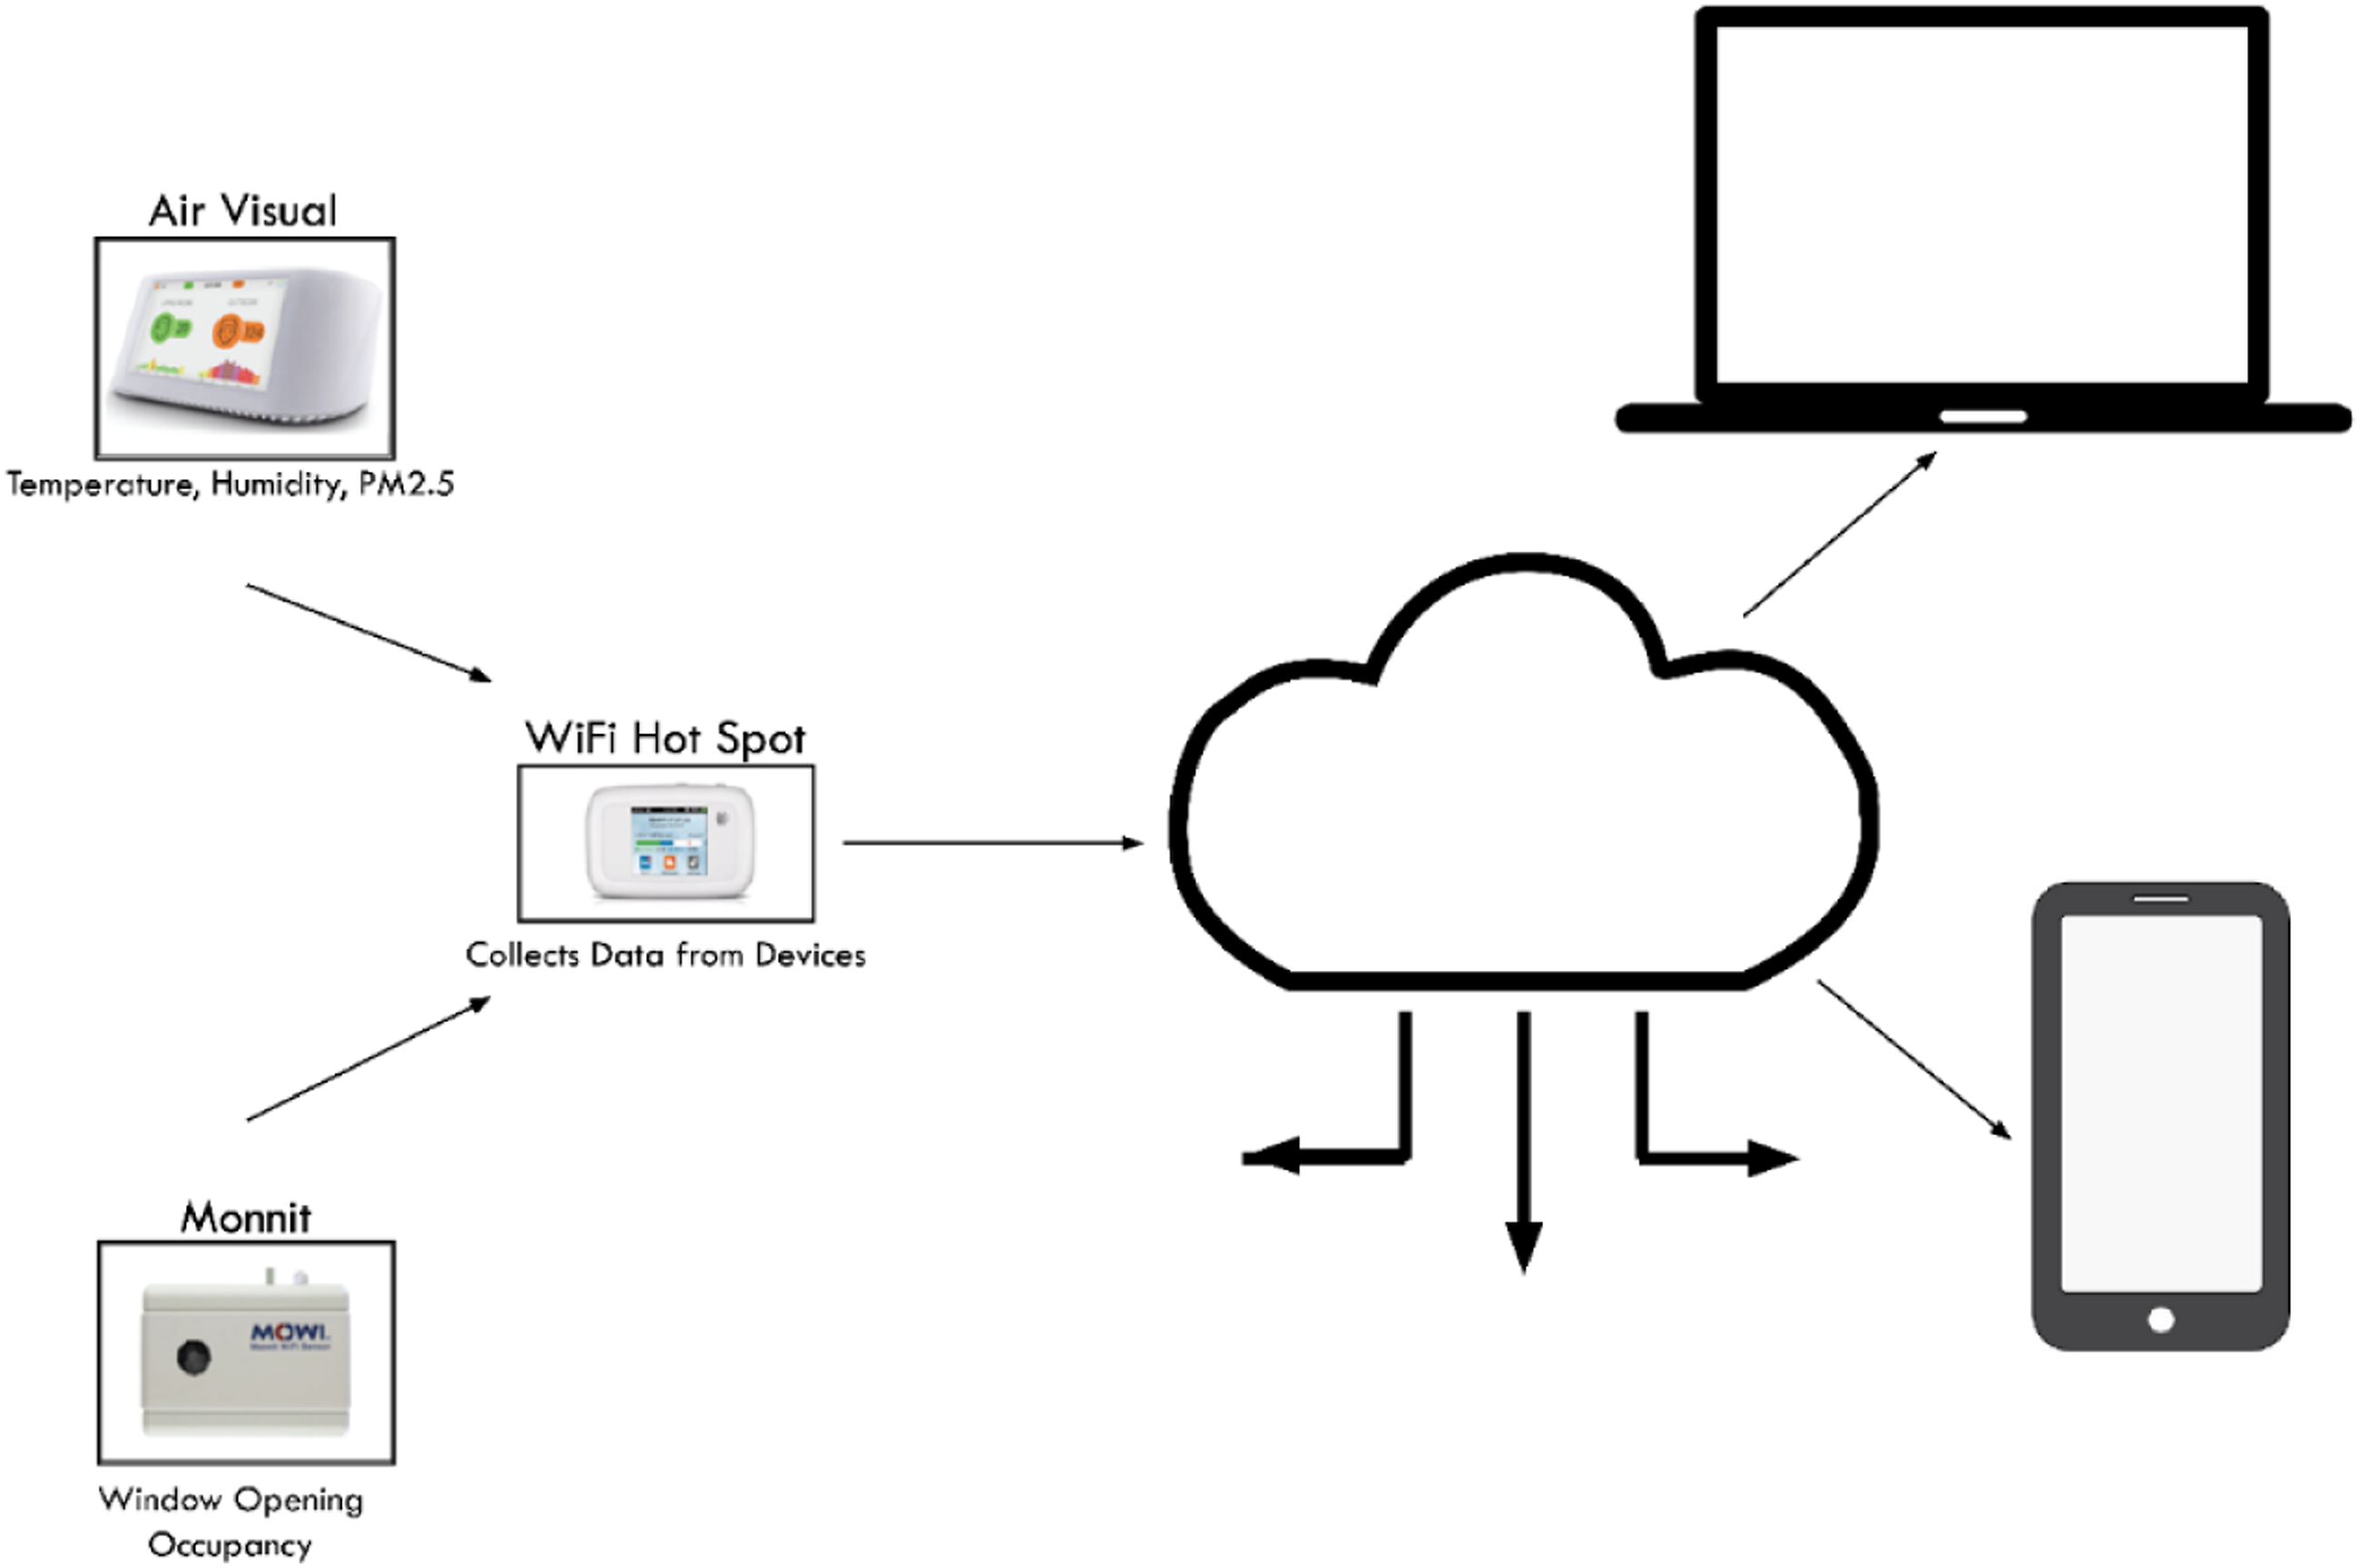
Because this paper focuses on window operation, we measured indoor air temperature and humidity, which are the variables in the standard thermal comfort model that are directly driven by outdoor conditions. The remaining variables from the standard model (mean radiant temperature, air velocity, clothing level and physical activity level) were assumed to vary by occupant and apartment.
Excel was used to identify and remove extreme values. Environmental measurements, although reported in hourly intervals, did not have aligned time stamps and behavioural measurements were reported in inconsistent time intervals, while several instruments measured the same variable. Therefore, MATLAB was used to synchronize the time stamps of environmental variables, produce consistent time stamps and retime behavioural variables in hourly intervals, generate new behavioural variables (e.g. total occupancy and % WO), merge environmental and behavioural variables in 24 separate apartments datasets and concatenate all apartment datasets in a final one. After data collection, synchronization, retiming and merging, the final sensor dataset covered 2.5 months of measurements (July to mid-September 2017) at hourly intervals.
Criteria for assessing indoor overheating and pollutants
In measuring the risk of summer overheating indoors, besides air temperature, relative humidity has been identified as an important variable that can affect human thermal comfort.
80
The discomfort index based on both temperature and humidity has been used by Baniassadi et al.
52
to assess the exceedance of suggested thresholds in senior housing in Houston, Texas. Several other works43,44,81,82, as well as heat advisory systems of cities
83
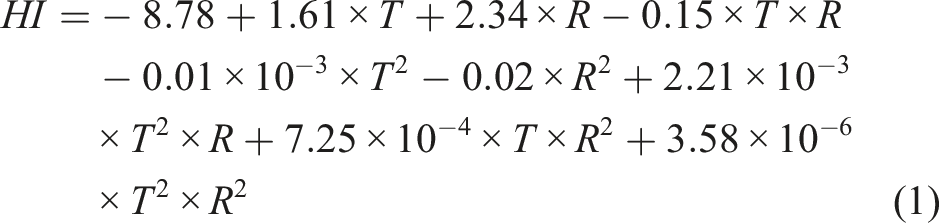
, have further utilized the heat index (HI), which is also based on combining temperature and humidity. In line with these works, our analysis of indoor thermal conditions was based on indoor HI as the outcome variable of interest, which was calculated by combining measurements of indoor air temperature and relative humidity based on the HI formula found in Rothfusz and presented below.
84
As guidance for assessing indoor overheating, several studies have utilized static approaches that rely on fixed temperature thresholds, which include among others, a recommendation by WHO for a maximum temperature of 24°C inside homes, 85 as well as the widely used Chartered Institute of Building Services Engineers (CIBSE) Technical Memorandum (TM59) suggestion of 26°C maximum for bedrooms. 86 A recent paper by Calleja-Agius et al. 87 suggests that daily mortality rates may increase considerably above 27°C.
Many studies have preferred adaptive over static approaches, such as the British Standard (BS) European Norm (EN) 15251:2007 88 that has been recently incorporated into the CIBSE TM59 UK guidelines 86 for dwellings. However, using a static threshold may be preferred in residential environments, as the adaptive thresholds were initially developed based on measurements in office buildings.56,89 In addition, using a static criterion may be more suitable for vulnerable occupants, such as older adults and/or those living in housing with fewer individually operable controls, since they may be limited in their ability to modify their environment. 56 Therefore, in this work, we selected an indoor HI of 27°C as an overheating threshold, which corresponds to air temperatures of 26°C, 27°C and 28°C at relative humidity levels of 60%, 40% and 30%, respectively.
In the case of IAQ, our focus was on PM2.5, which is one of the criteria for air pollutants, as per the US EPA. 90 Currently, there are no specified thresholds for indoor PM2.5 concentrations. Therefore, in our analysis, we relied on Ambient Air Quality Standards 71 for PM2.5 levels, which specify that the annual mean of 12 µg/m3 and daily mean of 35 µg/m3 shall not be exceeded.
Results
Assessment of indoor HI and PM2.5 levels
According to the definition of the National Atmospheric Administration (NOAA), as found in Robinson, 91 a heatwave (HW) for NJ is specified as a period of abnormally and uncomfortably hot and usually humid weather where maximum daytime temperatures exceed 32°C for two or three continuous days. Yet, since ‘a combination of weather elements related to the human sensation of heat must be used to assess a heat wave’, 91 using the HI over temperature may be preferable to better represent the human experience of thermal (dis)comfort.
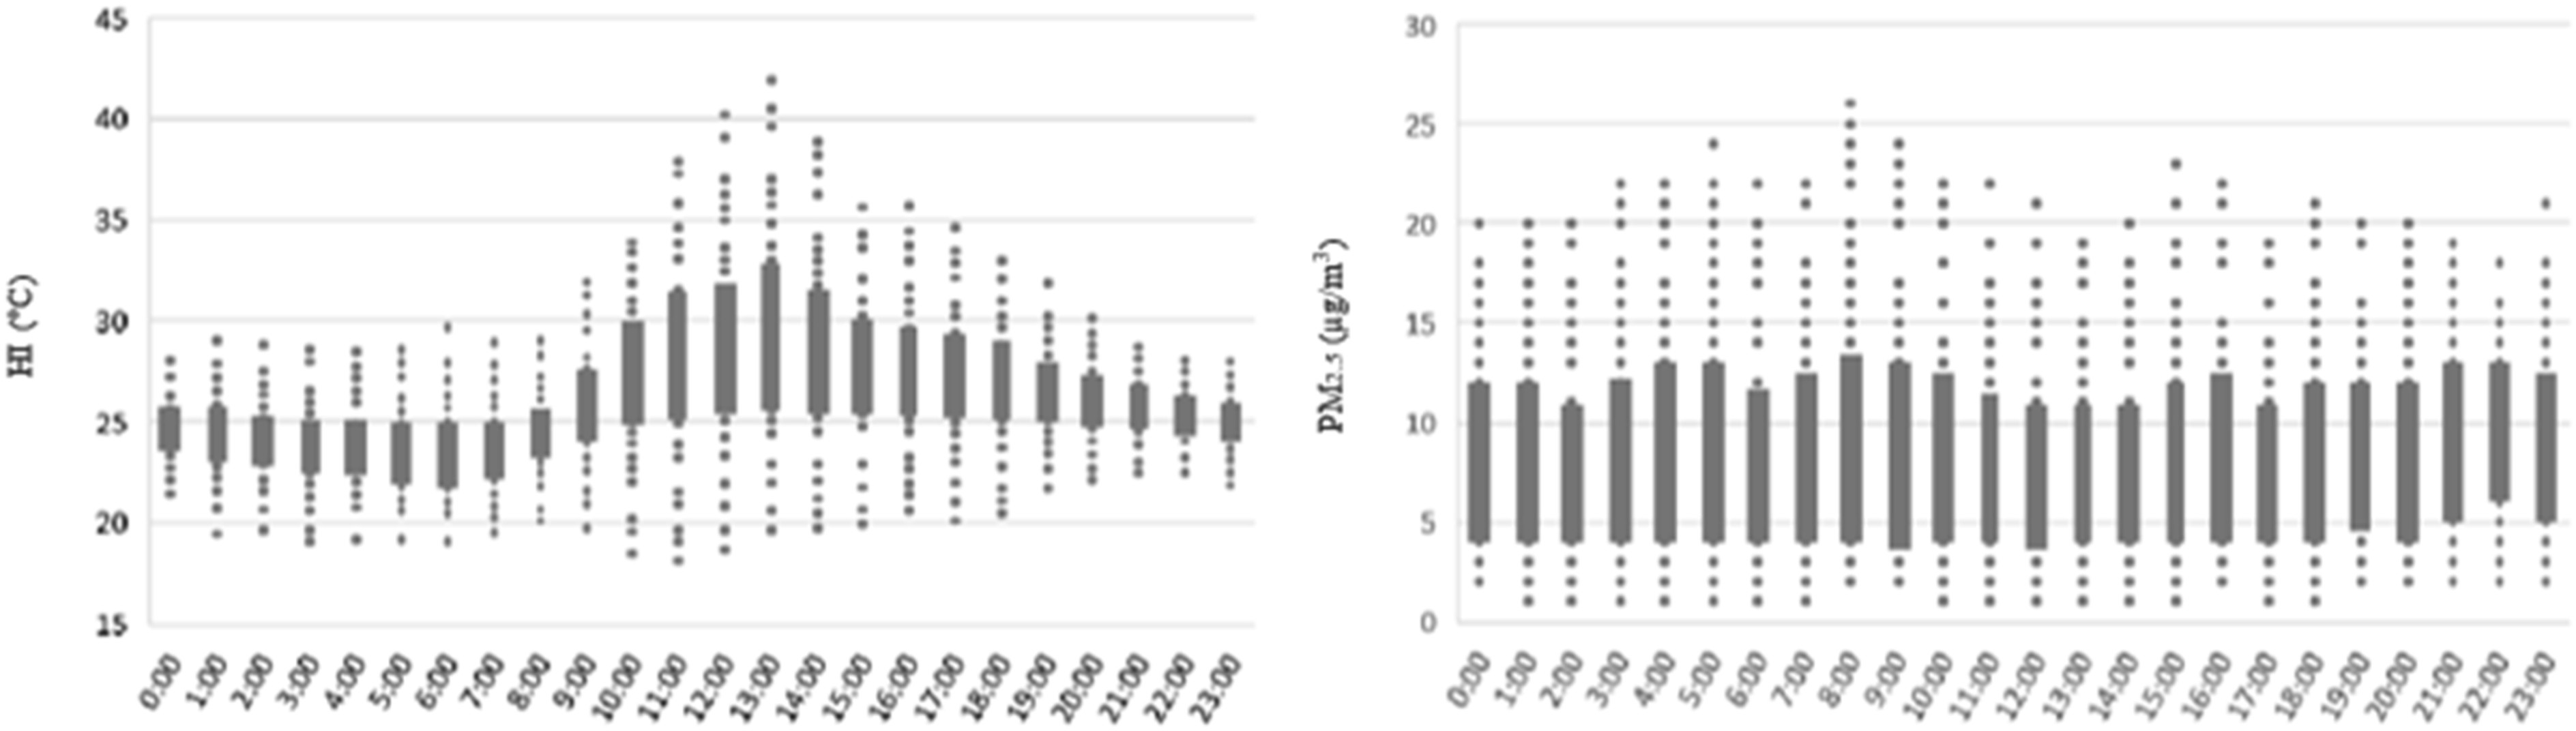
During summer 2017, we identified five HW periods where maximum outdoor daytime HI measurements exceeded 32°C for two or three consecutive days, shown in Figure 6. The highest temperature peak occurred on July 20. The same Figure 6 also summarizes the entire hourly indoor HI range for the living rooms of all study apartments; indoor HI levels were excessively high both on HW periods and on regular summer days. In addition, the minimum and average indoor HI values (22 and 27°C) of all apartments were higher than the corresponding outdoor HI (17 and 26°C), as shown in Table 6. Range of hourly outdoor and indoor HI measurements during summer 2017 with HW periods highlighted. Summary of HI and PM2.5 measurements
1
during summer 2017.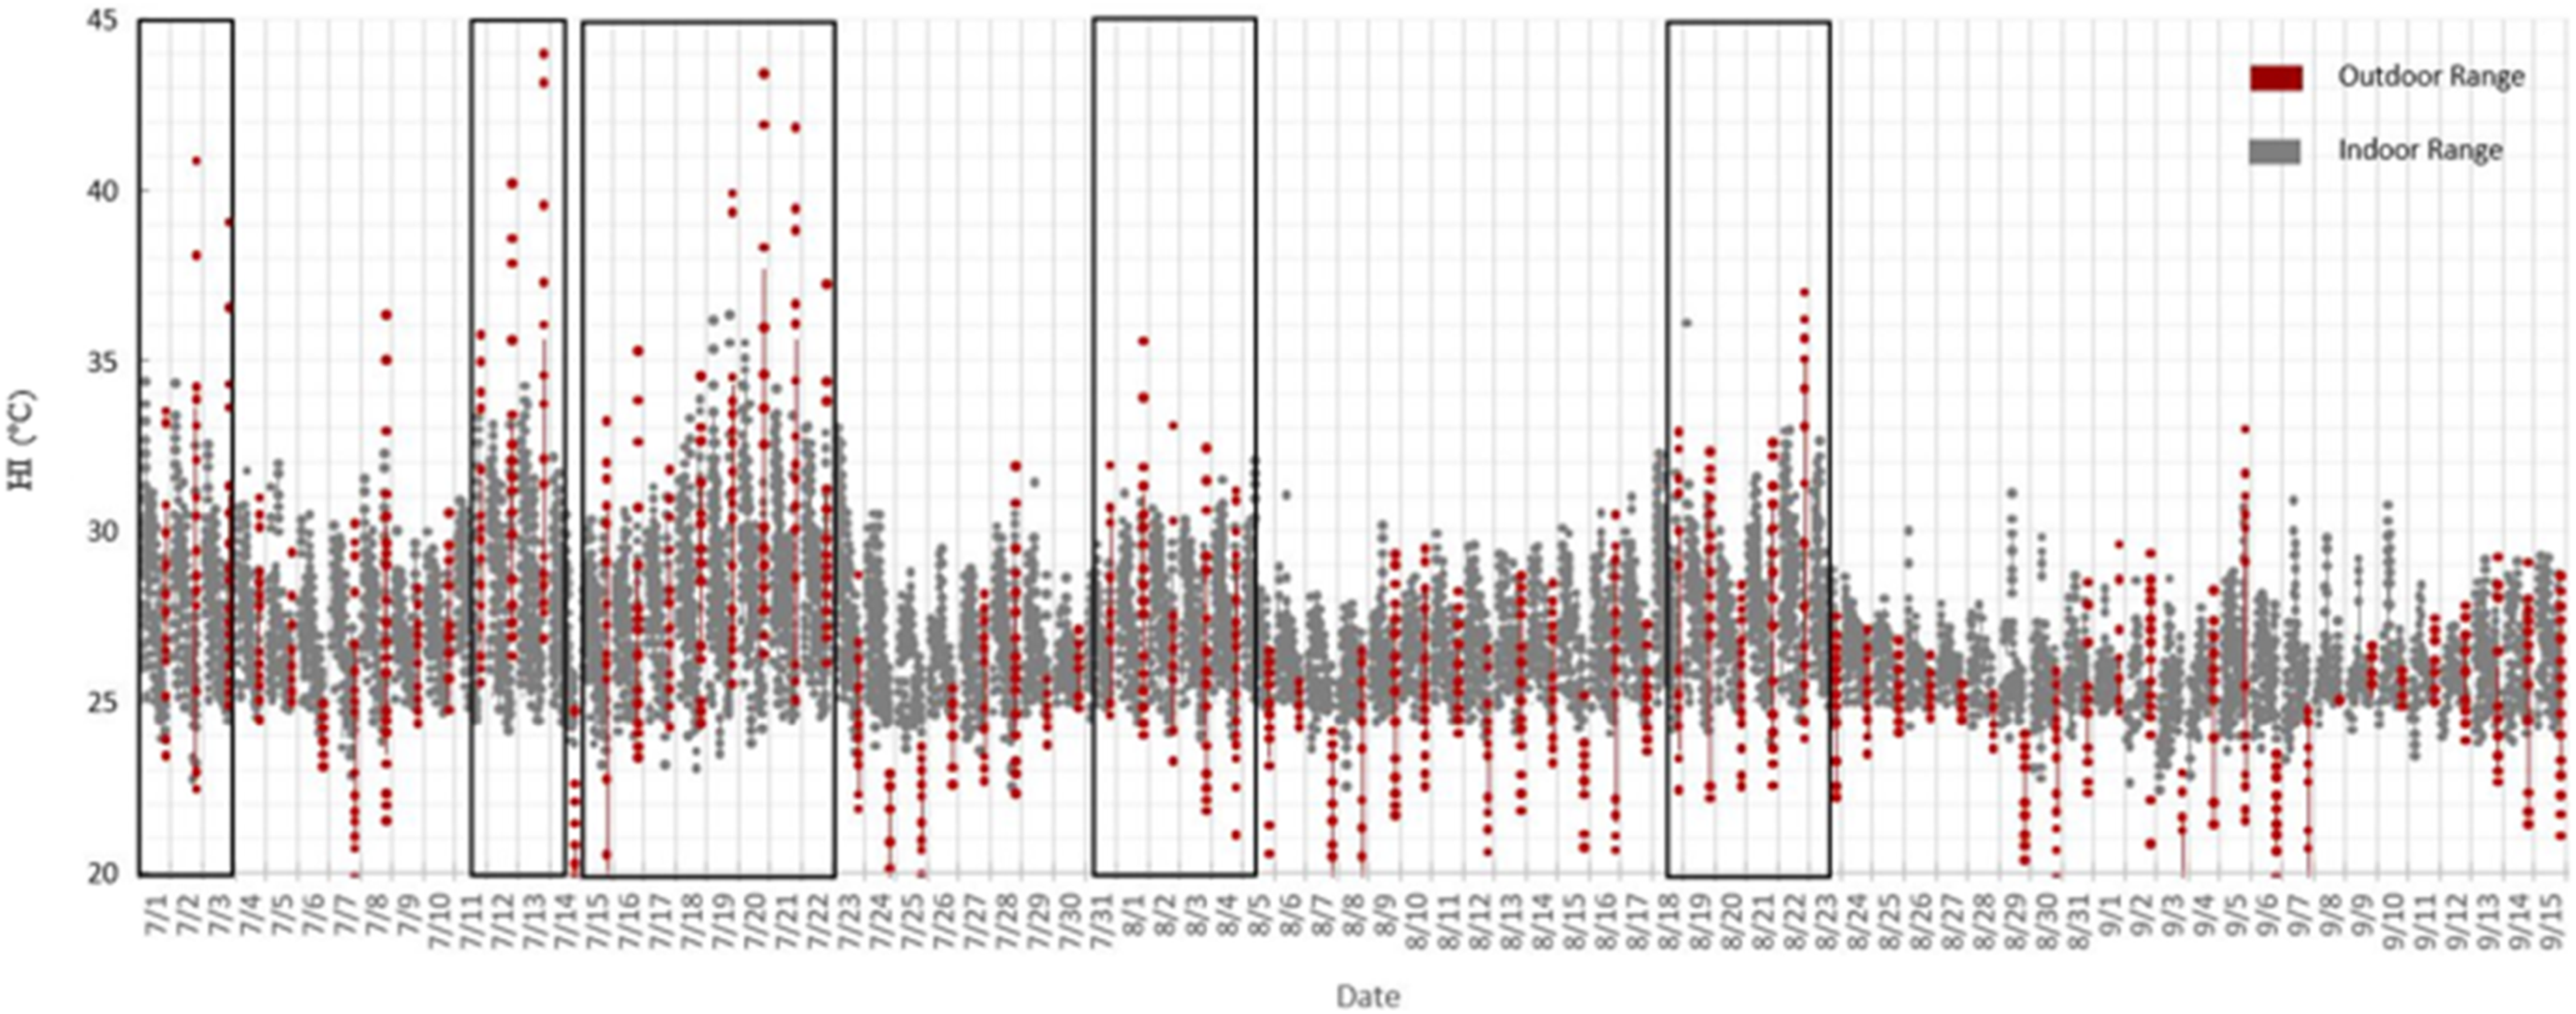
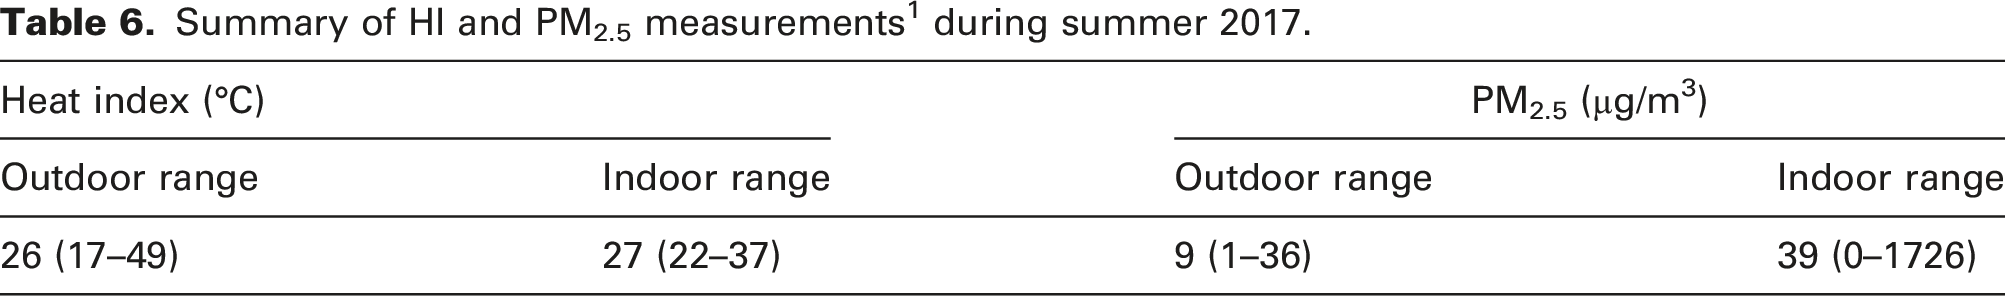
Figure 7 shows the outdoor and indoor PM2.5 levels that were also elevated in Elizabeth during the monitoring period in several instances. This coincided with four out of the five HW periods. Concurrently, the average and maximum indoor PM2.5 (39 and 1726 µg/m3) of all apartments were considerably higher than the corresponding outdoor PM2.5 (9 and 36 µg/m3), as shown in Table 6, which indicates the existence of strong indoor pollutant sources. Hourly variations of outdoor HI and PM2.5 measurements are presented in Figure 8. Range of hourly outdoor and indoor PM2.5 measurements during summer 2017 with HW periods highlighted. Hourly variations of outdoor HI and PM2.5 during summer 2017.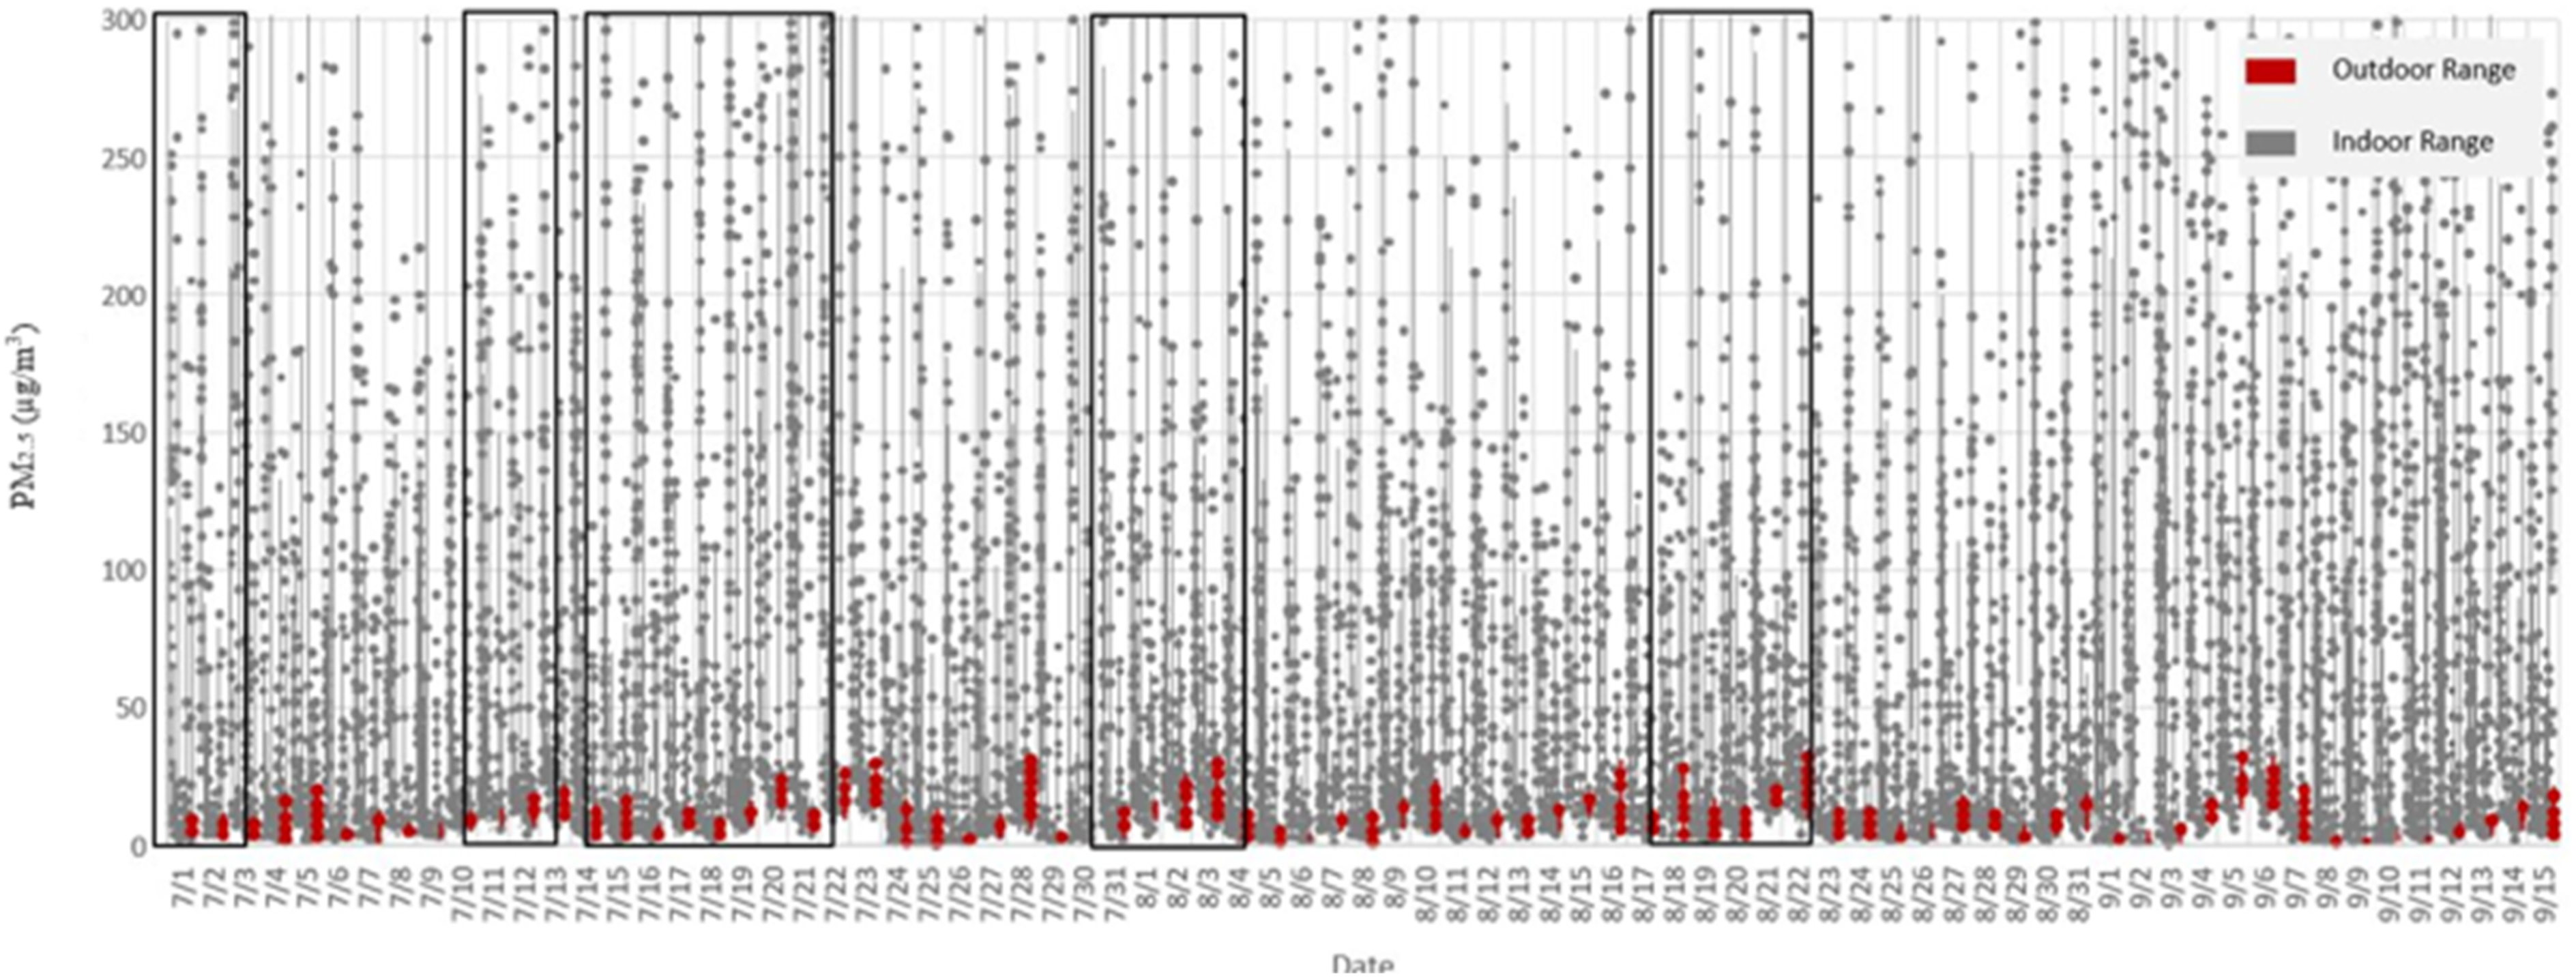
Variations by site
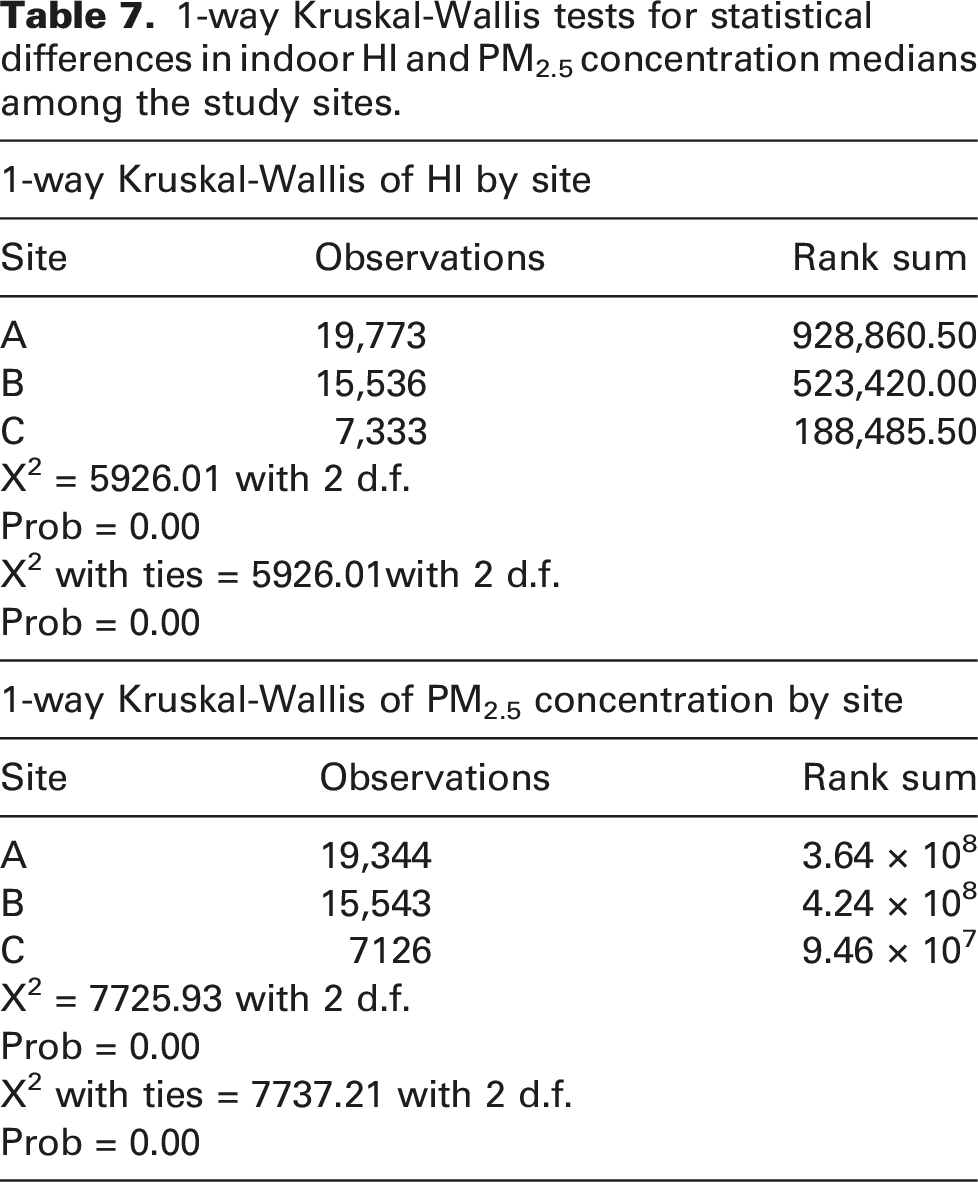
Sensor measurements were grouped by study site to determine potential differences in their performance and understand thermal and air quality variations. Figure 9 presents in parallel, daily averages of indoor HI and PM2.5 concentrations in dwellings of each site with a zone of ‘acceptable’ daily conditions highlighted, which was constructed based on the HI and PM2.5 concentration thresholds discussed previously (HI < 27°C and PM2.5 < 35 µg/m3). Based on Figure 9, the living rooms of apartments located on sites A (30s’ low-rise) and B (60s’ high-rise) experienced much higher HI and PM2.5 levels compared to the LEED-certified and newer site C. Specifically, site B had the worst ranges, with only 16% of measurements within the acceptable zone, followed by A that had slightly better performance, but only due to lower PM2.5 concentrations (26% of measurements within the zone). Lastly, while apartments in site C experienced overall better thermal and air quality levels, more than 50% of daily averages were with HI above 27°C and PM2.5 concentration above 35 µg/m3 (44% of measurements within the zone), although all residents in the sample reported operating their A/C. Daily averages of indoor HI and PM2.5 concentration measured at the site during summer 2017. The shaded area indicates the ‘acceptable’ zone constructed based on thresholds for HI and PM2.5 concentration.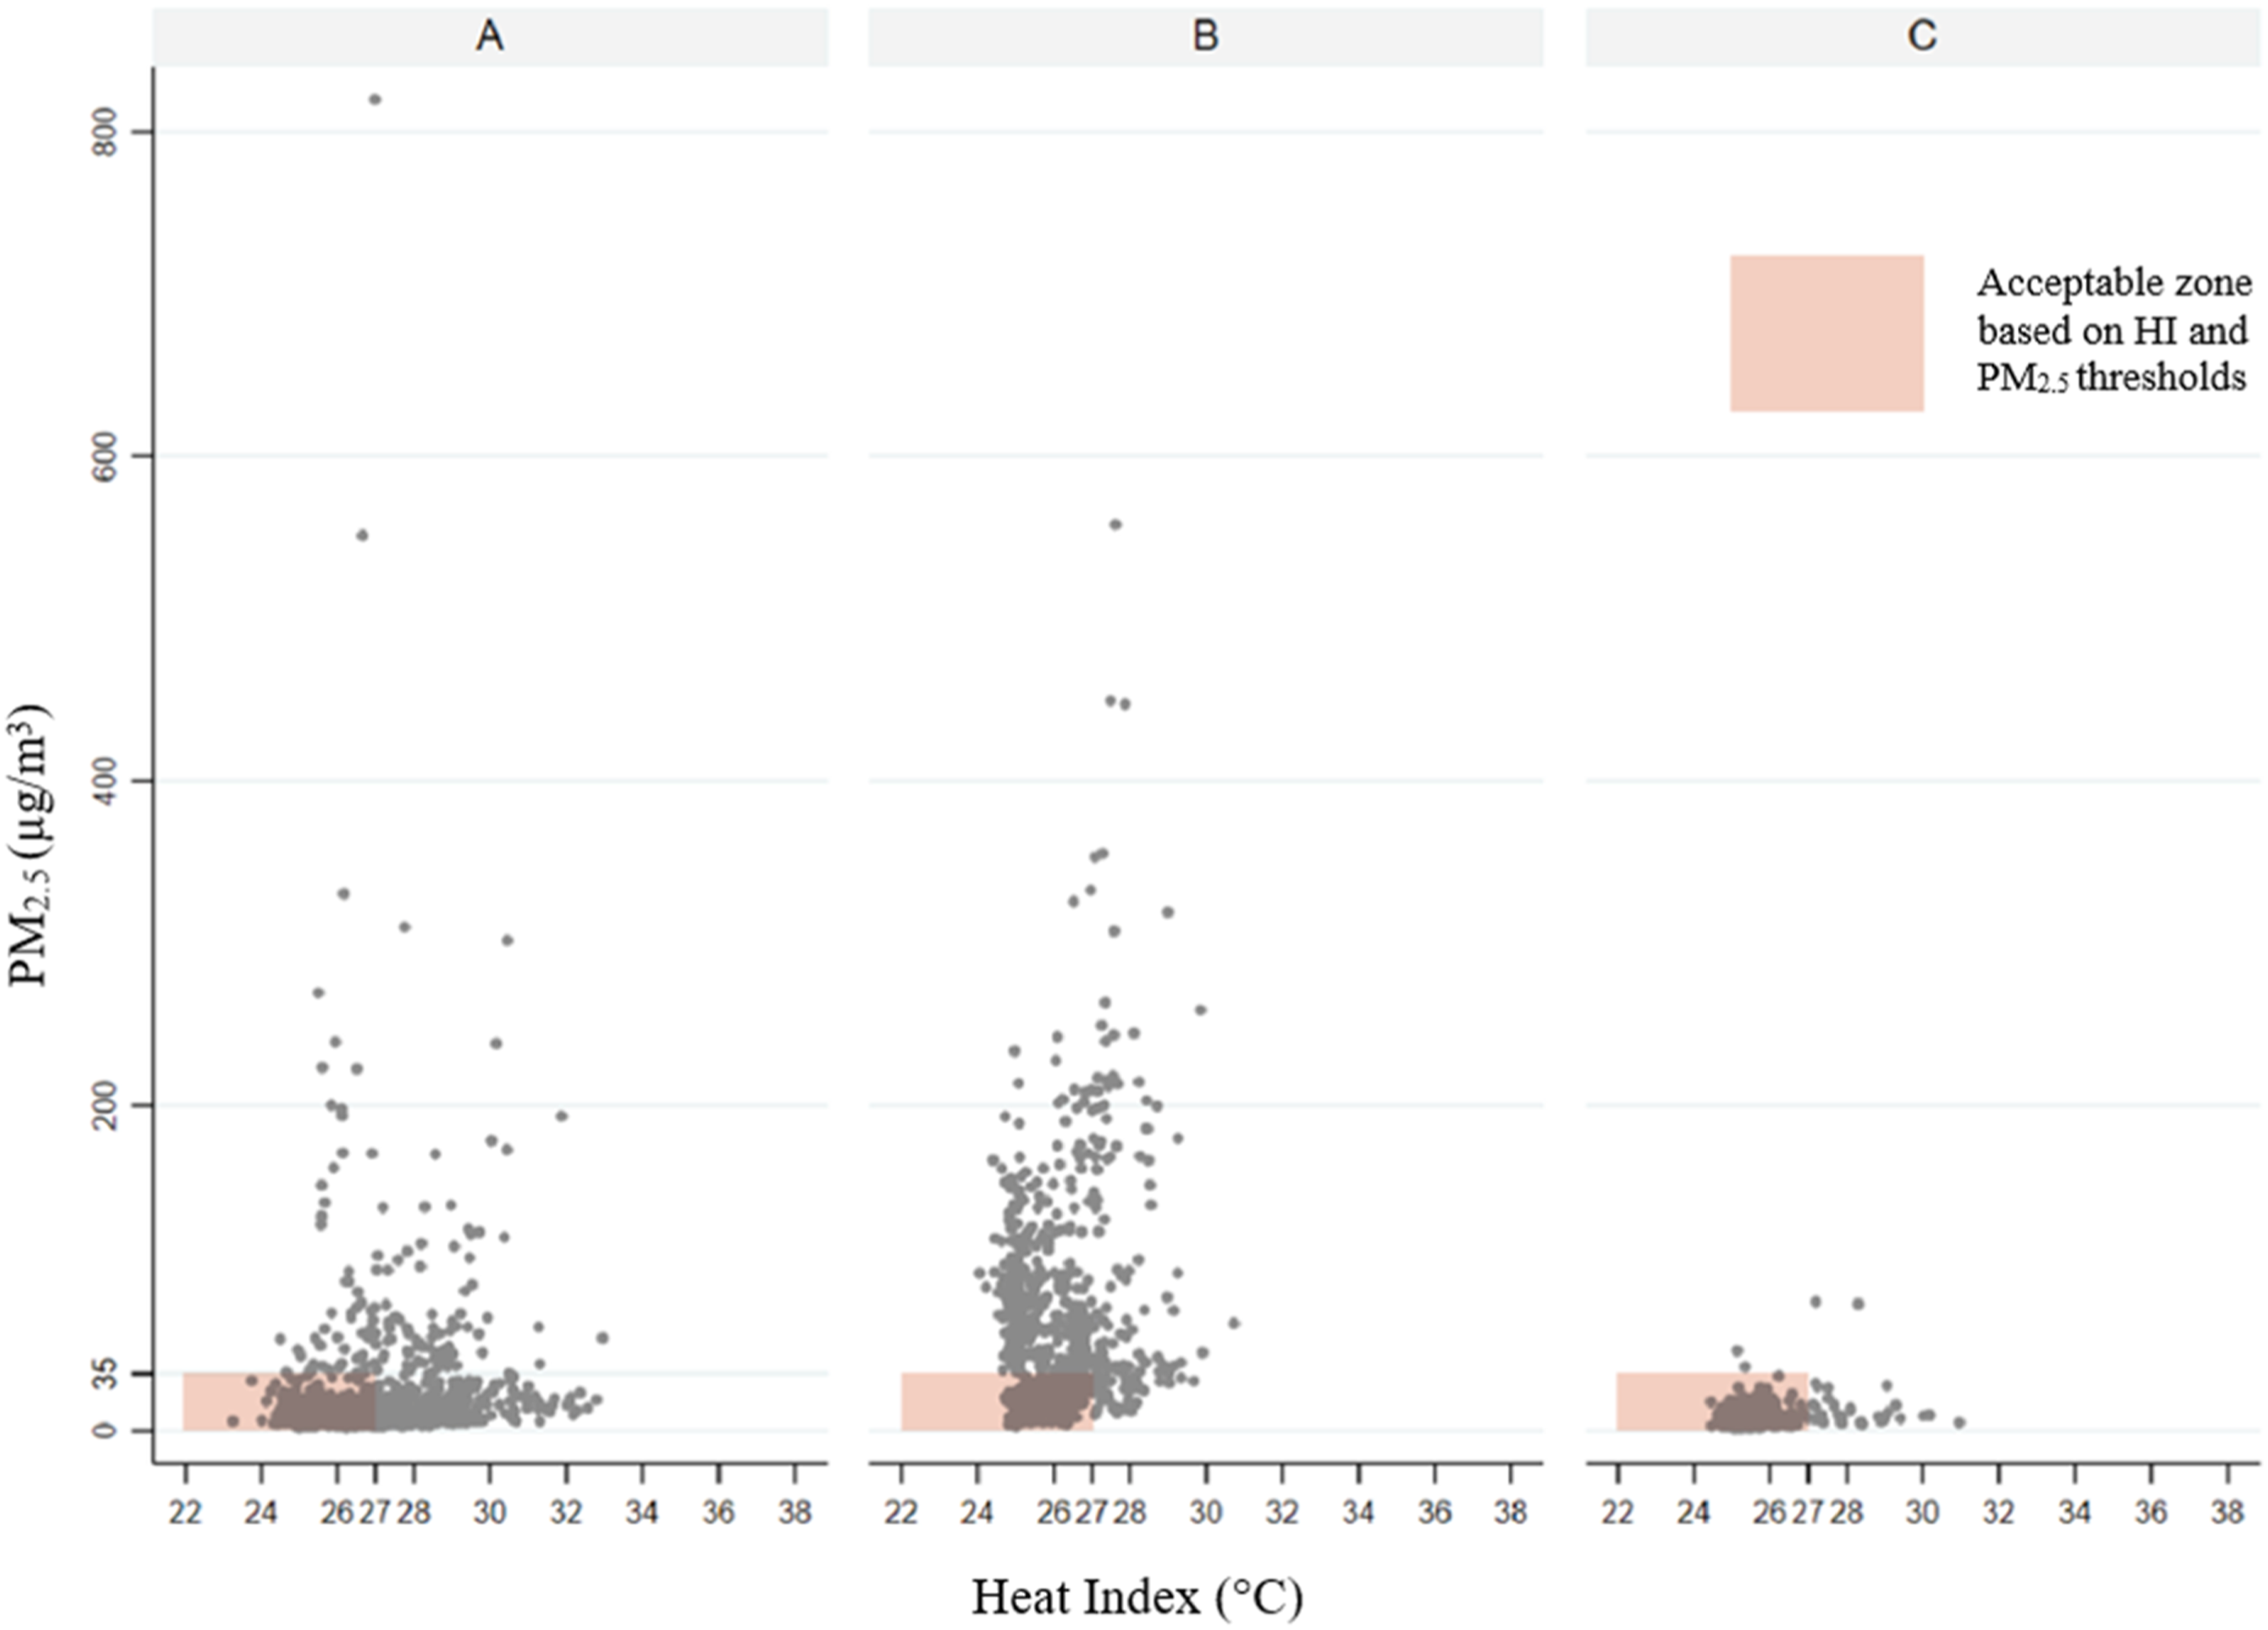
1-way Kruskal-Wallis tests for statistical differences in indoor HI and PM2.5 concentration medians among the study sites.
Variations by apartment
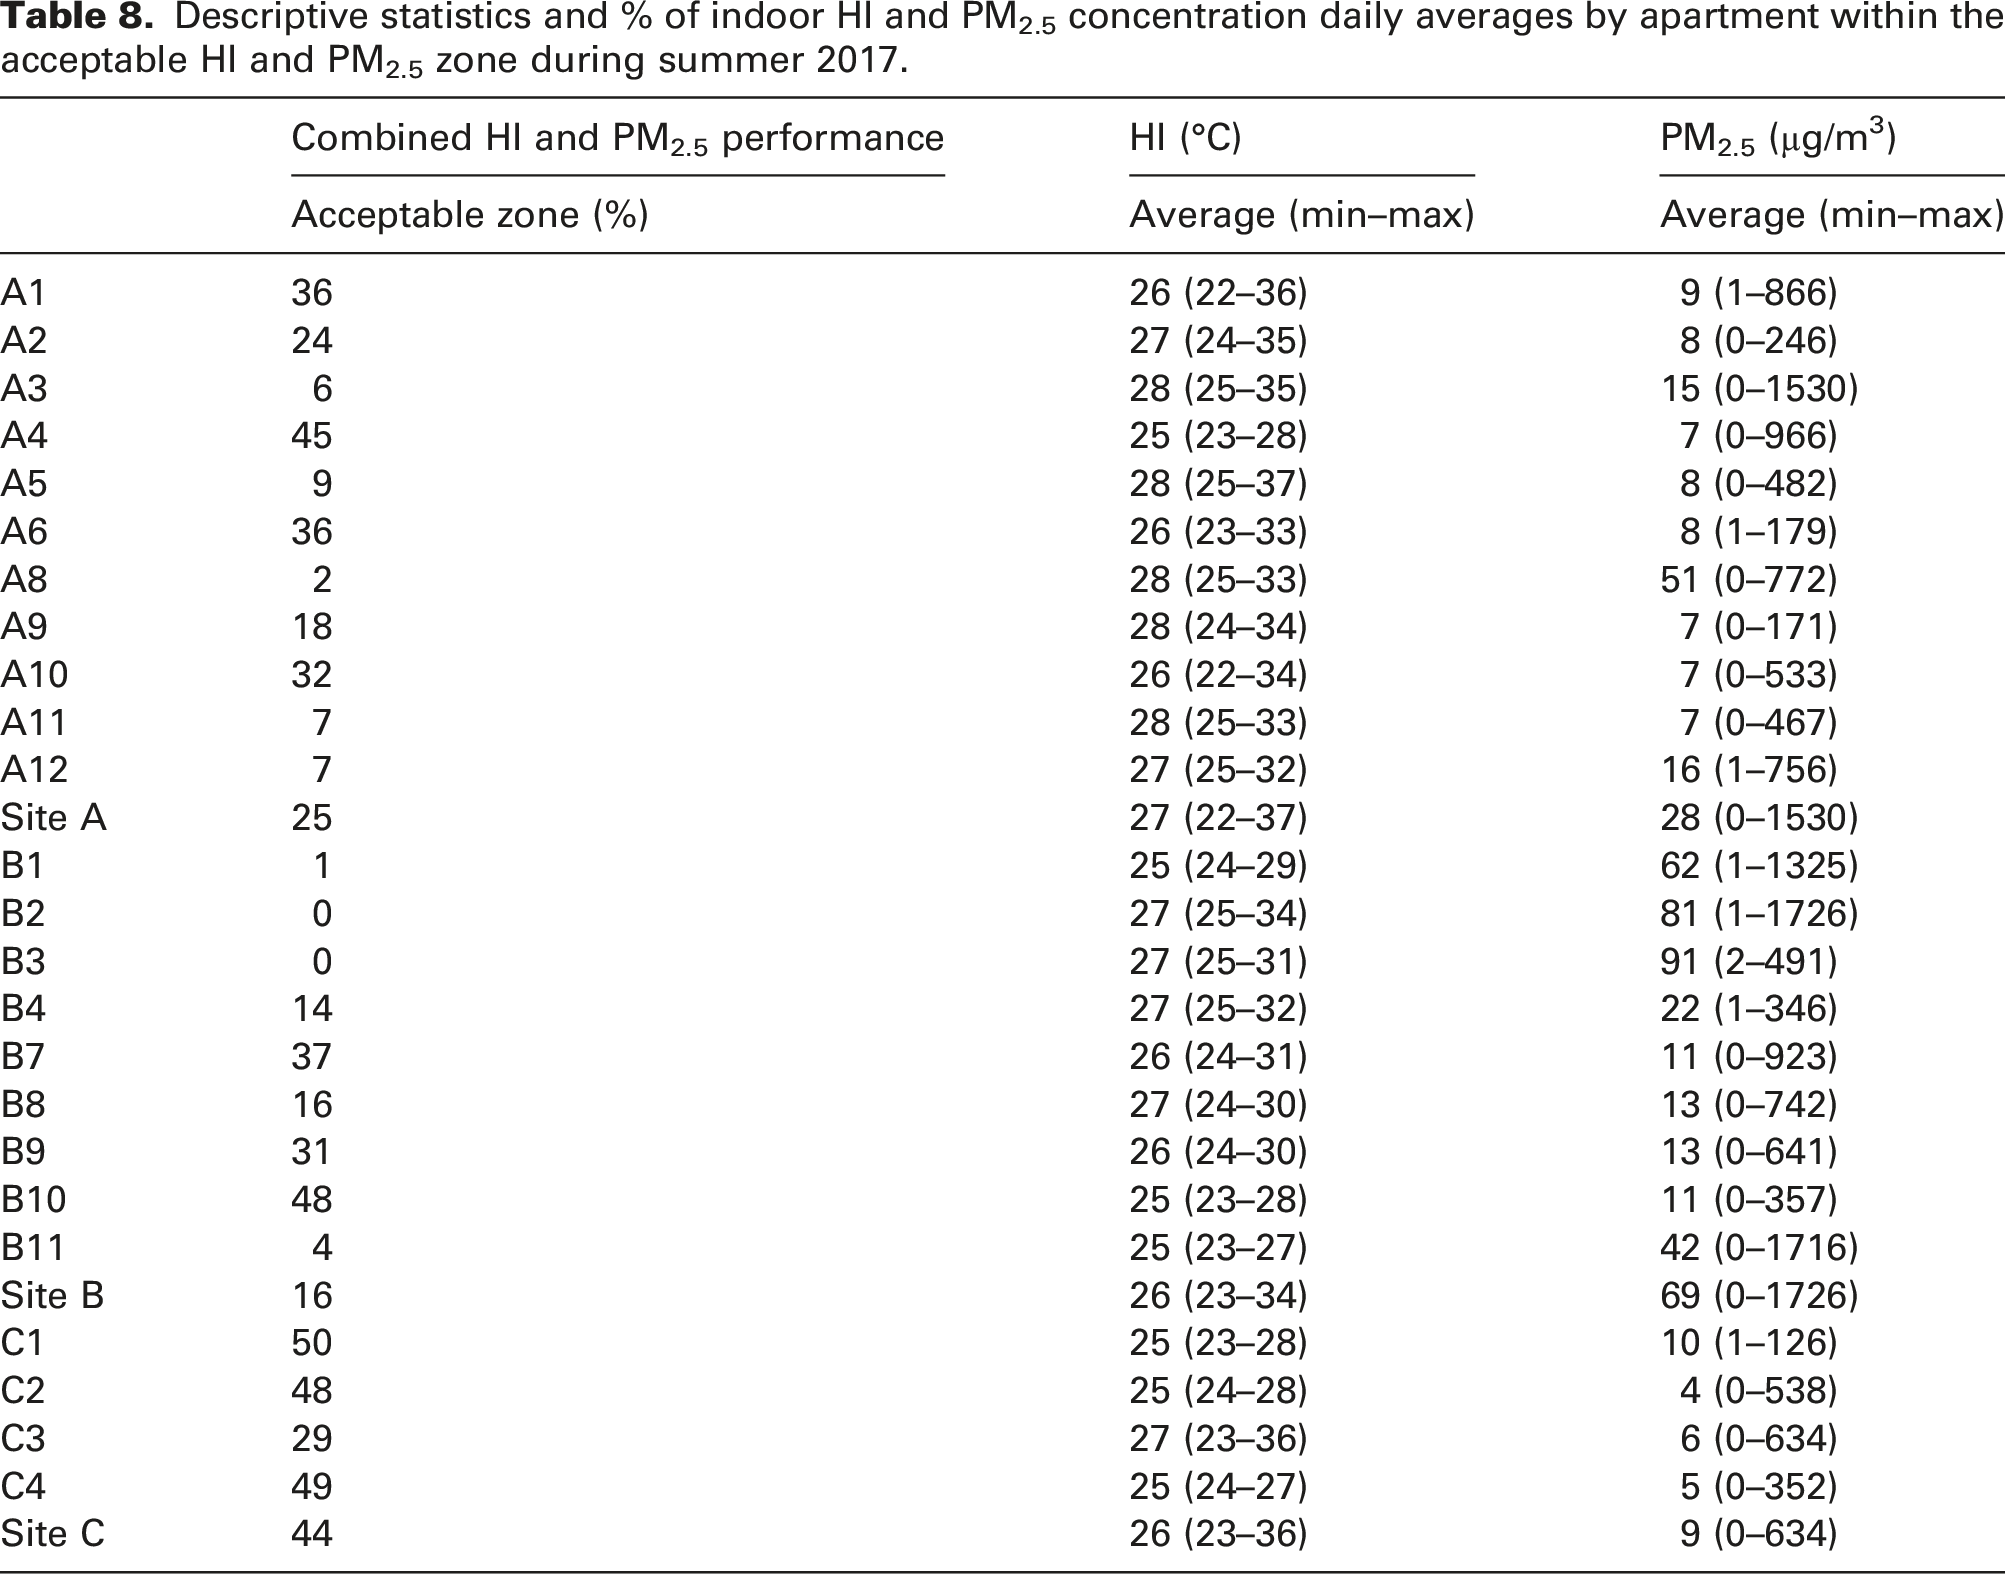
Figure 10 zooms into each study apartment and presents in parallel the range of daily average indoor HI and PM2.5 concentration with the ‘acceptable’ zone highlighted, while Table 8 summarizes descriptive statistics for each dwelling. When thermal and air quality conditions are considered simultaneously, it can be observed that, only five apartments A4, B10, C1, C2 and C4 had less than 60% of daily averages outside the acceptable zone. Range of daily averages of indoor HI and PM2.5 concentrations in apartments during summer 2017. The shaded area indicates the ‘acceptable’ zone, constructed based on thresholds for HI and PM2.5 concentration. Descriptive statistics and % of indoor HI and PM2.5 concentration daily averages by apartment within the acceptable HI and PM2.5 zone during summer 2017.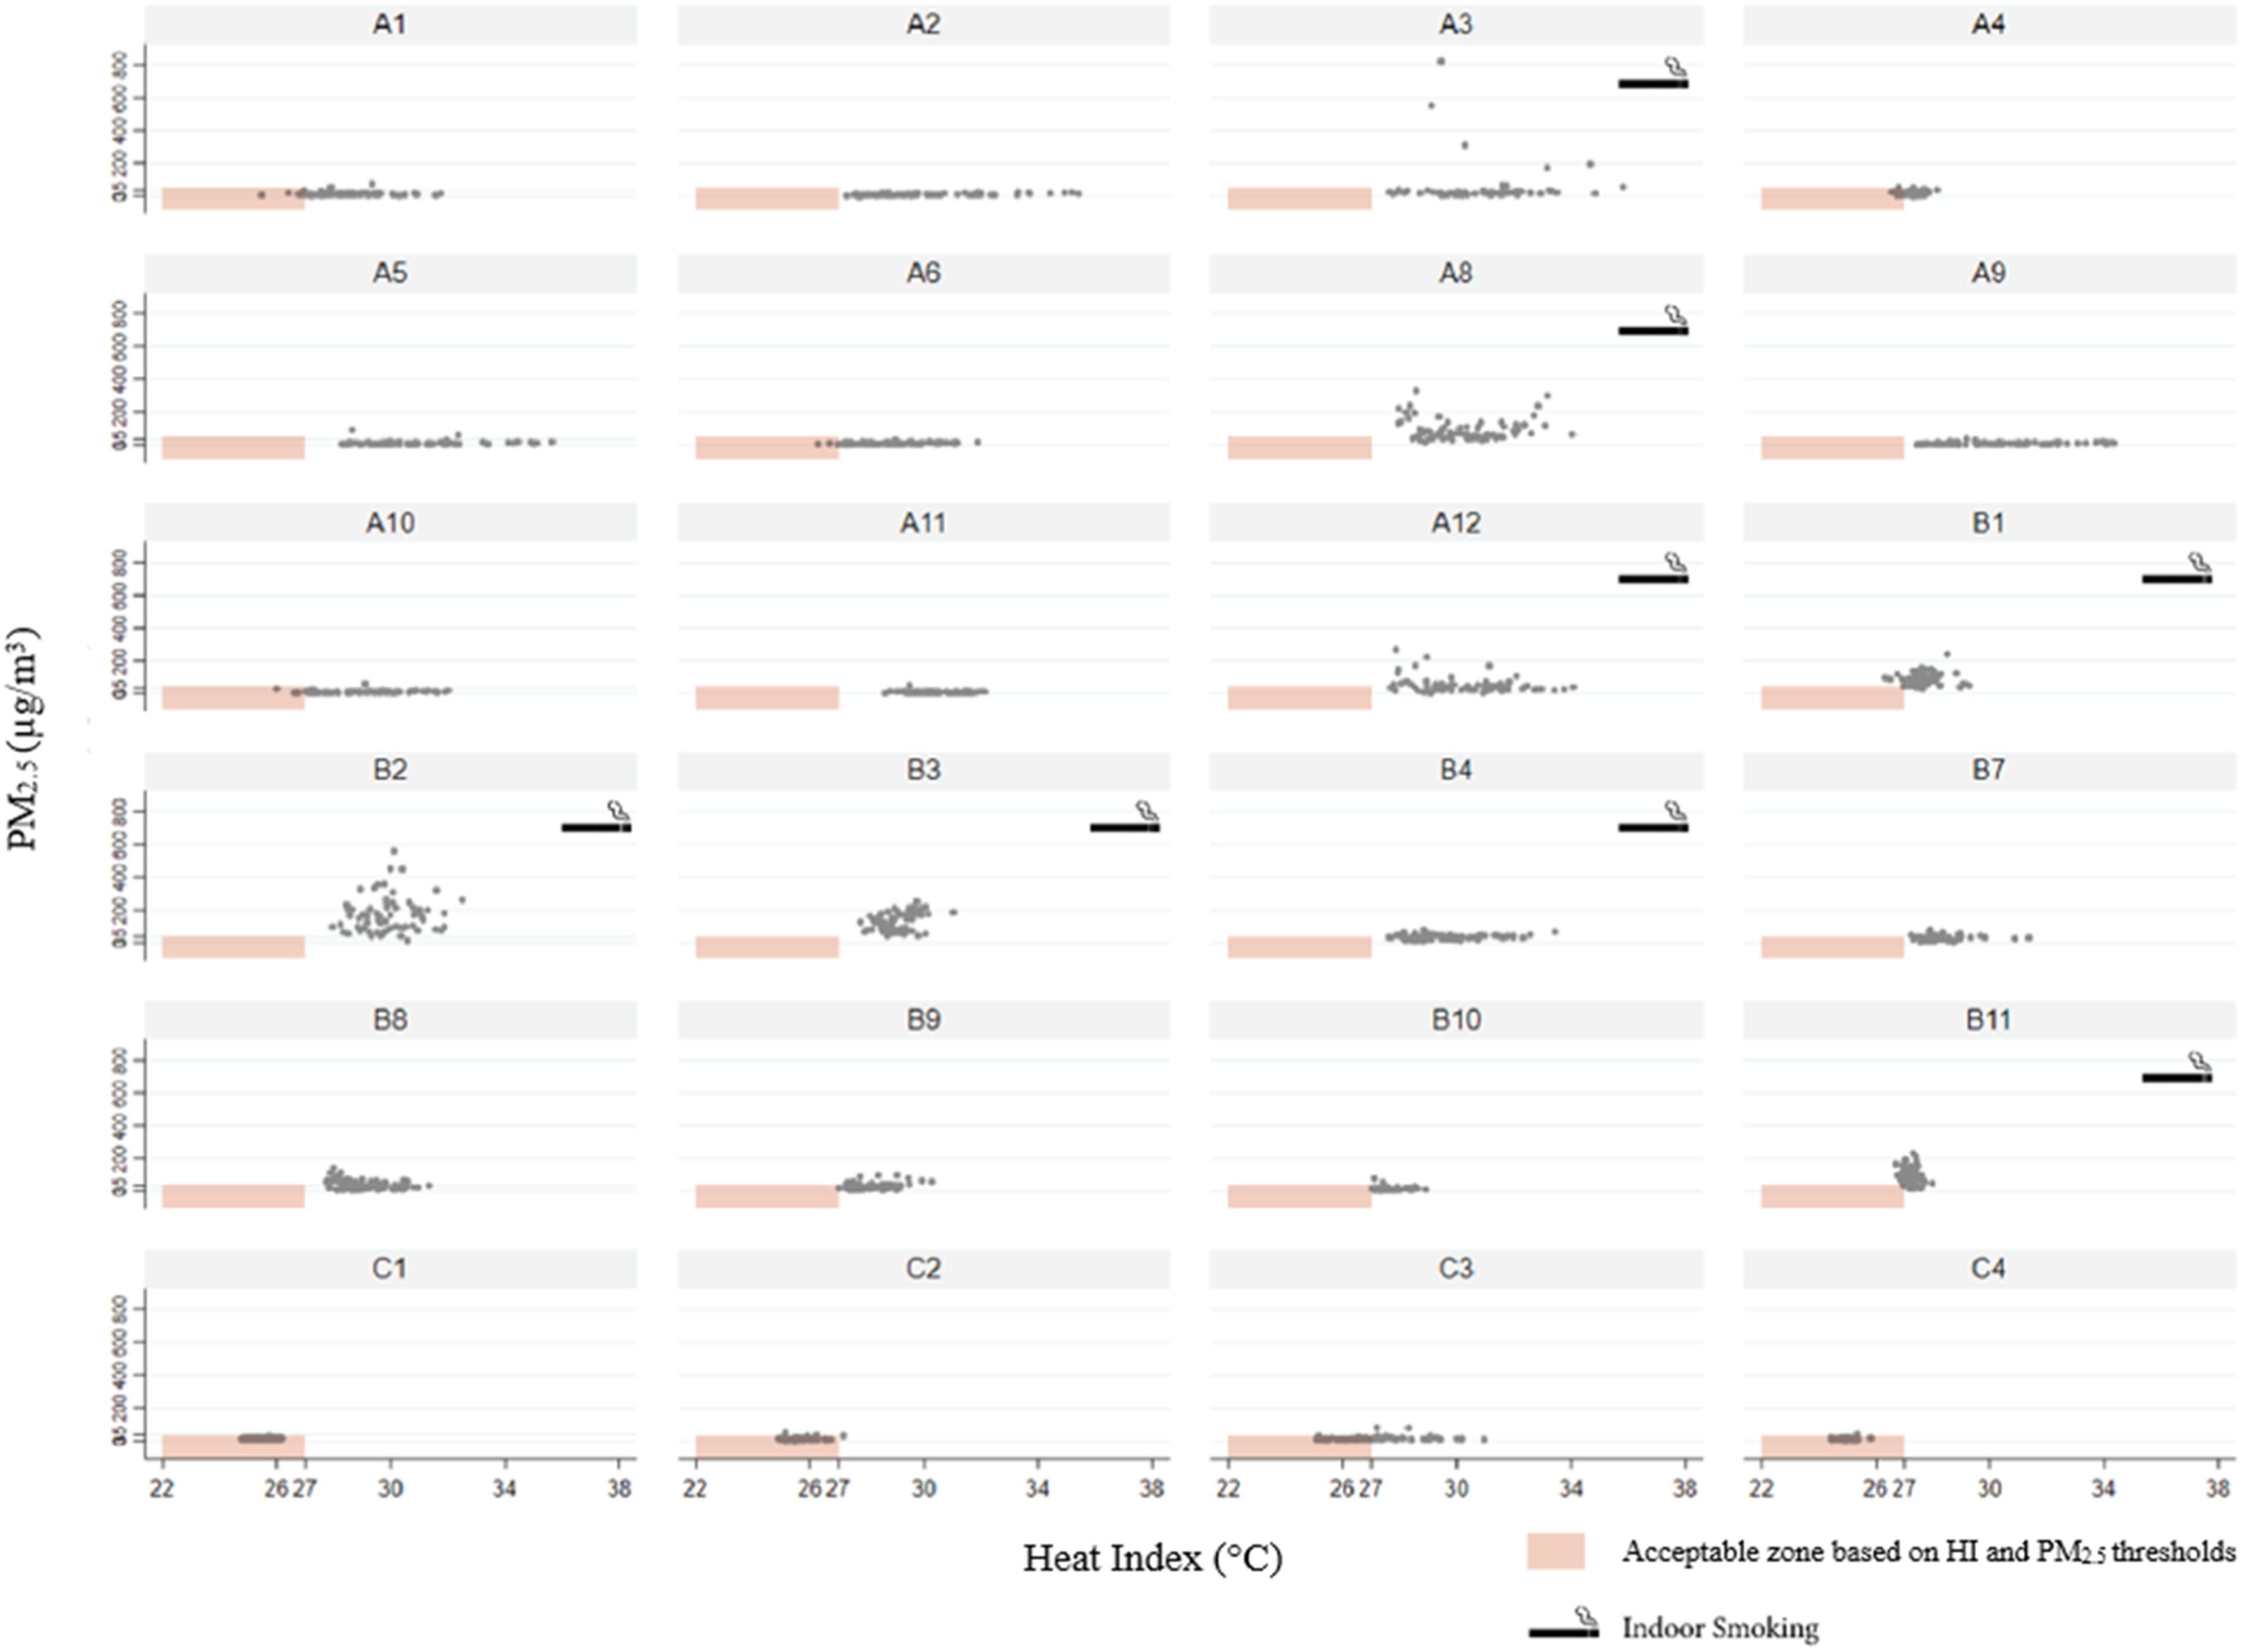
In terms of HI and in line with Figure 9, living rooms of apartments within the LEED-certified building with central A/C experienced much better thermal conditions, and the majority of daily HI means were below the threshold of 27°C. The only exception is apartment C3, that had a higher HI average (27°C) and range (23–36°C). Although apartment characteristics are similar to those of unit C4, the C3 resident reported more frequent WO in the interviews (see Tables 3 and 4).
In contrast, in the oldest site A, which relies mostly on natural ventilation, almost all dwellings regularly exceeded the HI threshold of 27°C. A5, which is the only apartment in the sample without an A/C unit (see Table 4), had an average HI of 28°C and, along with apartment A3, experienced the warmest conditions of all 24 dwellings in the sample. A4, which is similar to A3 in orientation and number of A/C units presents an exception to these findings, with the percentage of daily means within the acceptable zone being close to those of other apartments in building C.
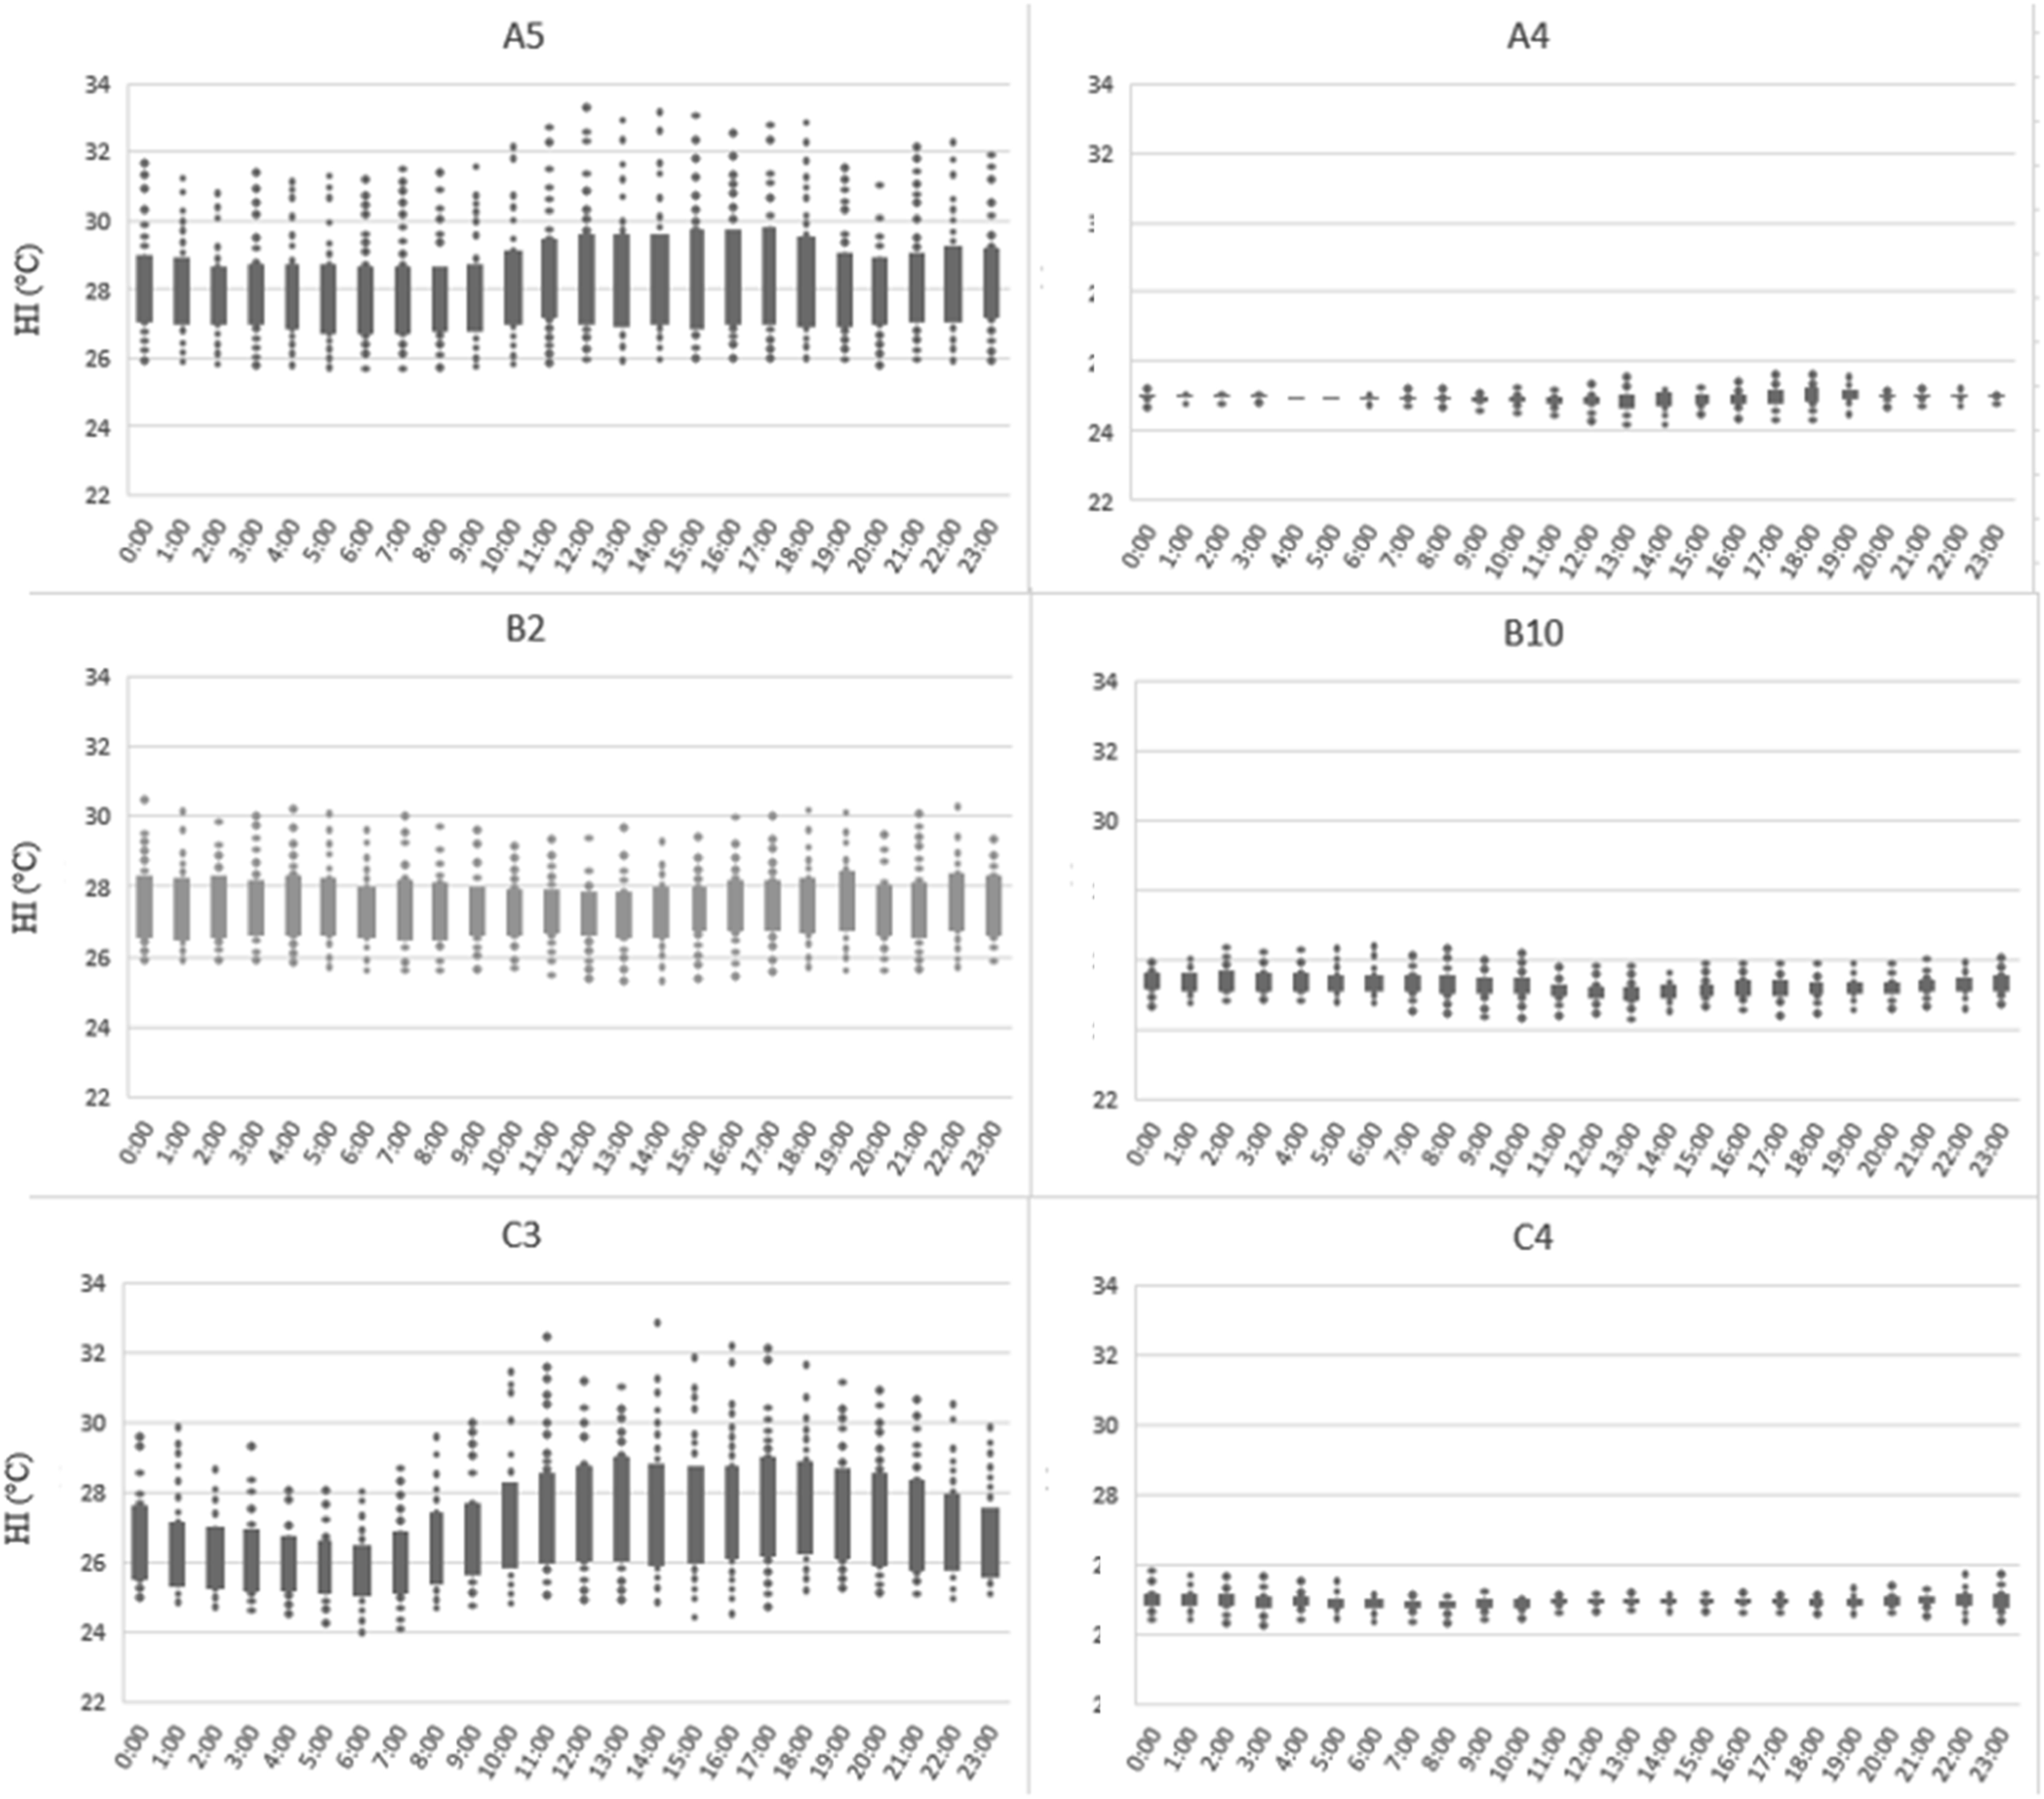
Lastly, apartments within the high-rise building of site B had an overall lower HI average and range compared to A, although the threshold of 27°C was often exceeded. Apartment B2, located on the 11th floor and has a west orientation, performed the worst, with a HI median of 27°C and a range of 25–34°C. On the other end, apartment B10, which has a north-east orientation and is located on the third floor, had the best HI average and range among all Bs (comparable with apartments in C and A4). Although both apartments have one A/C and occupants reported using it all day long during summer 2017, the resident of B10 reported opening windows more than the resident of B2 (see Tables 3 and 4). Daily averages and hourly variations of HI for apartments with the highest and lowest ranges from each site are shown in Figures 11 and 12. Daily average indoor HI of selected apartments during summer 2017; worst and best cases from each site. Hourly HI variations during summer 2017; apartments with highest and lowest ranges from each site.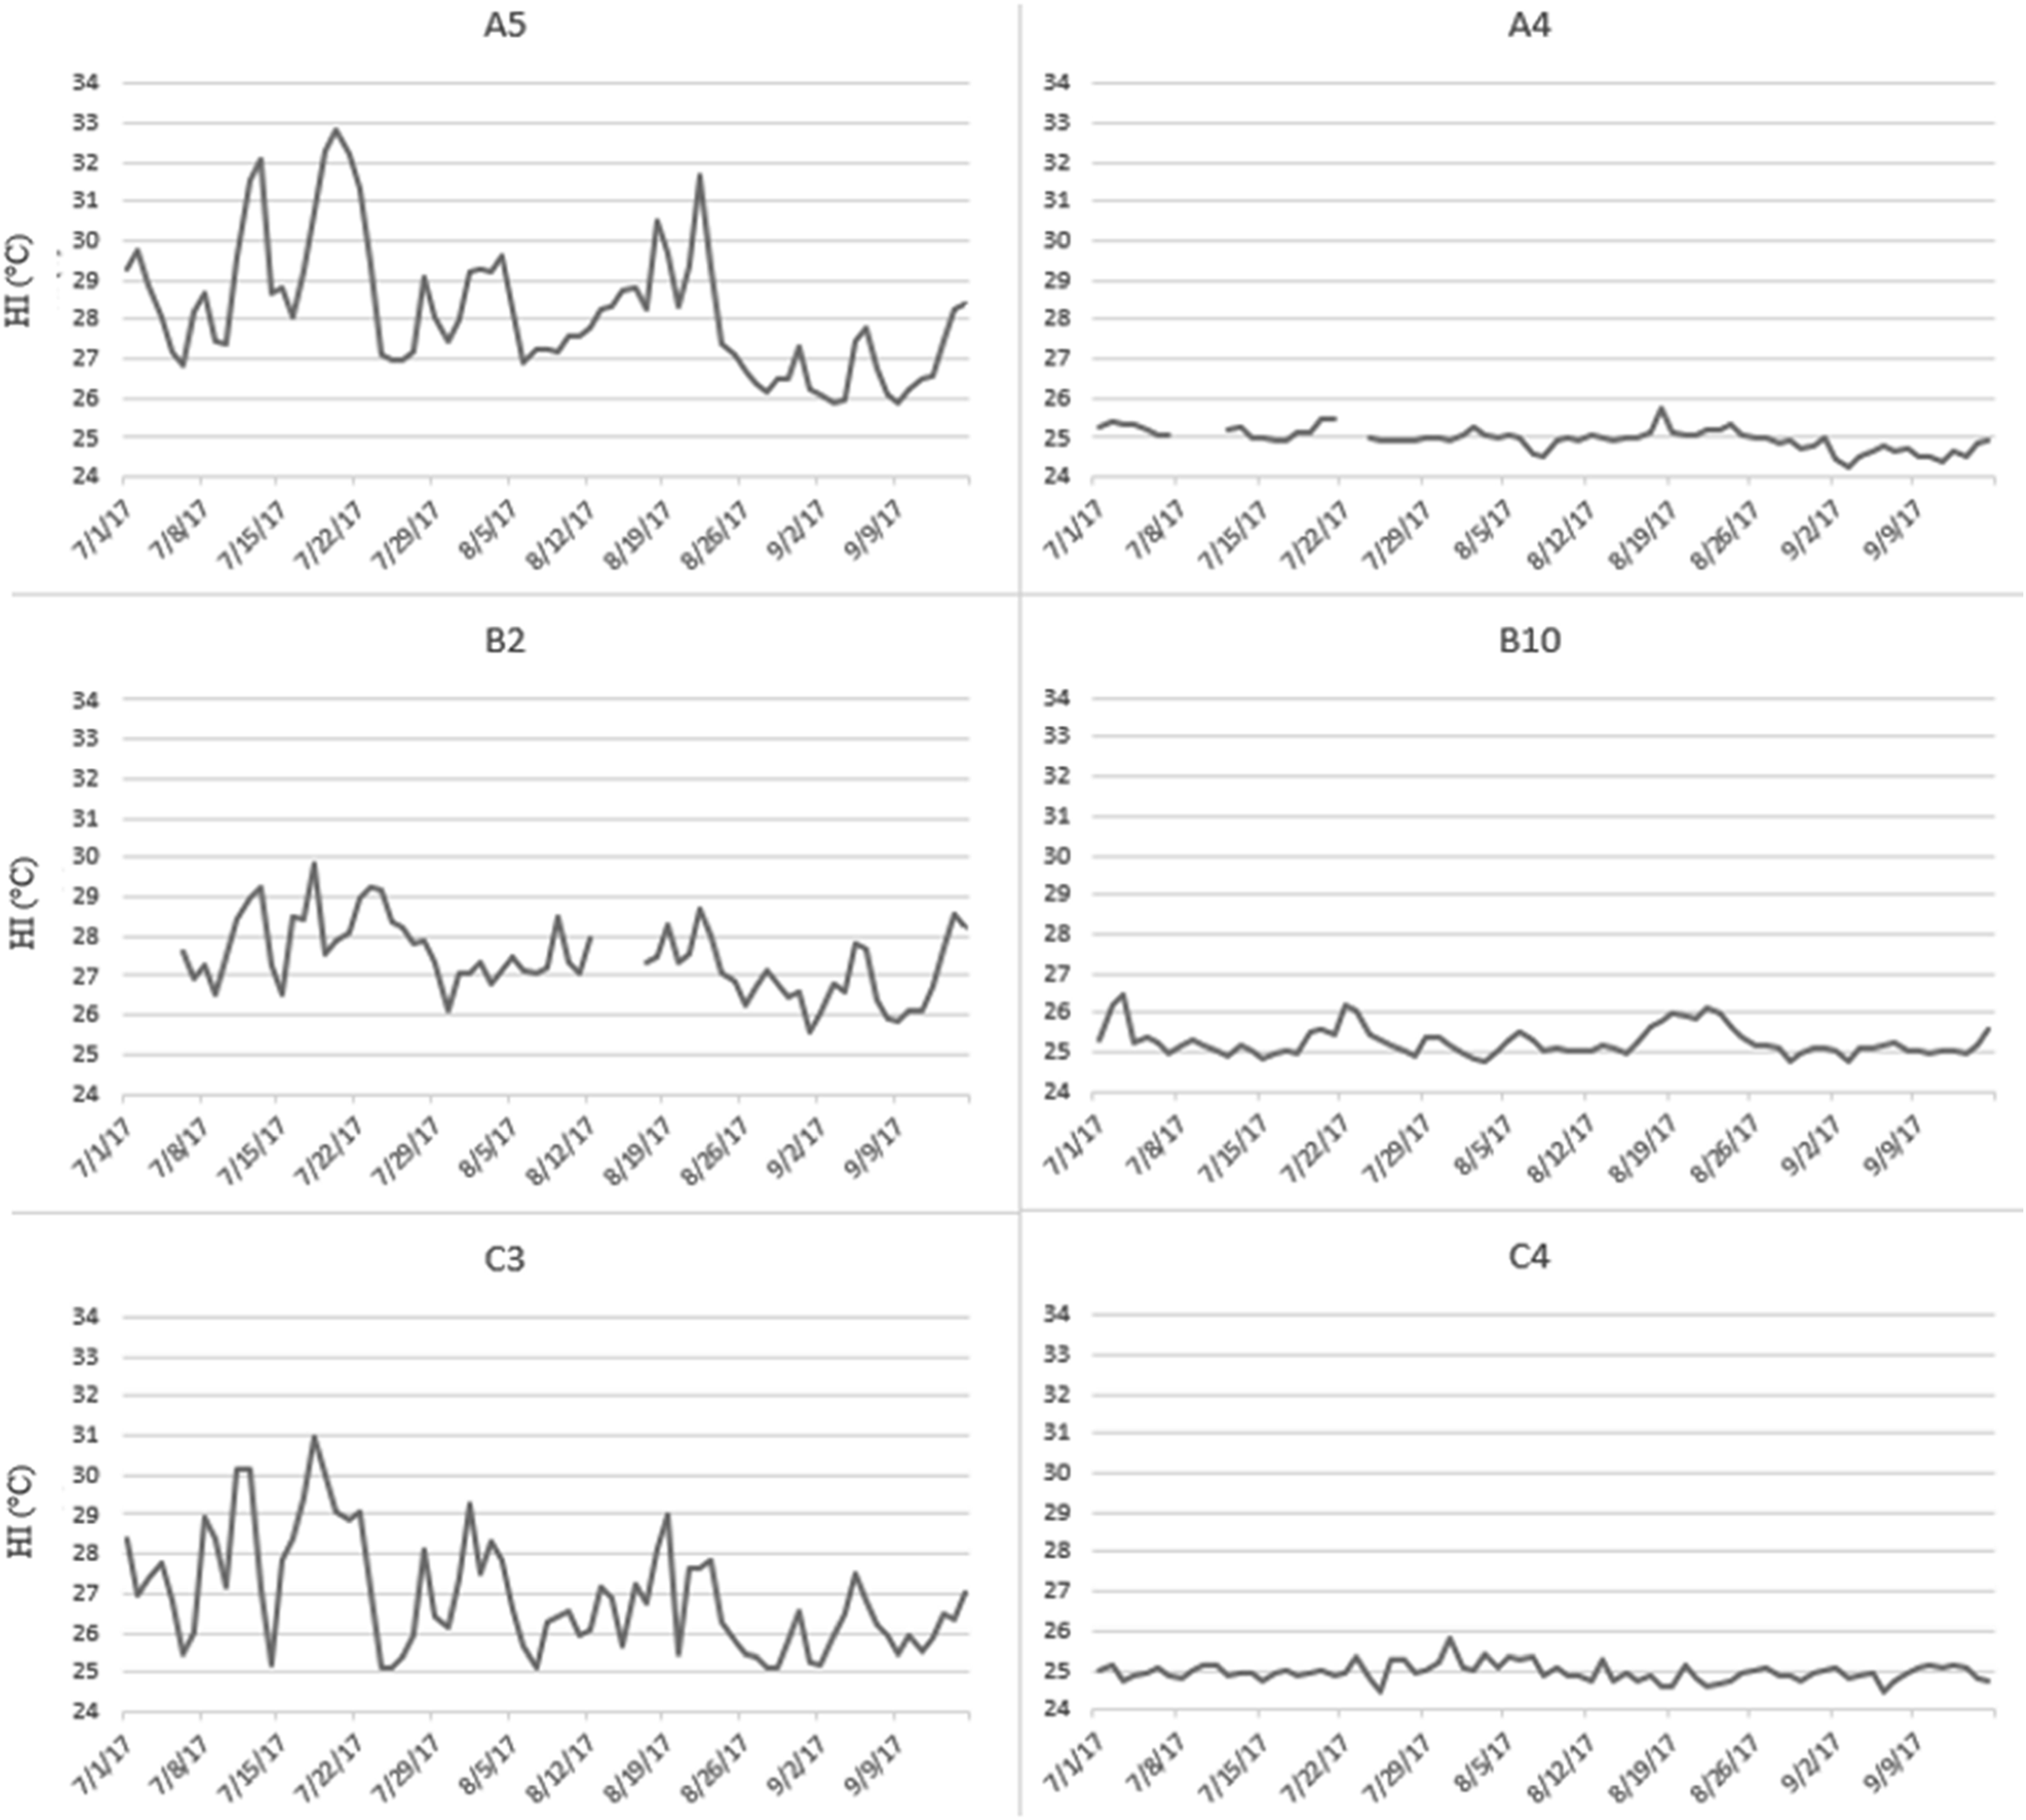
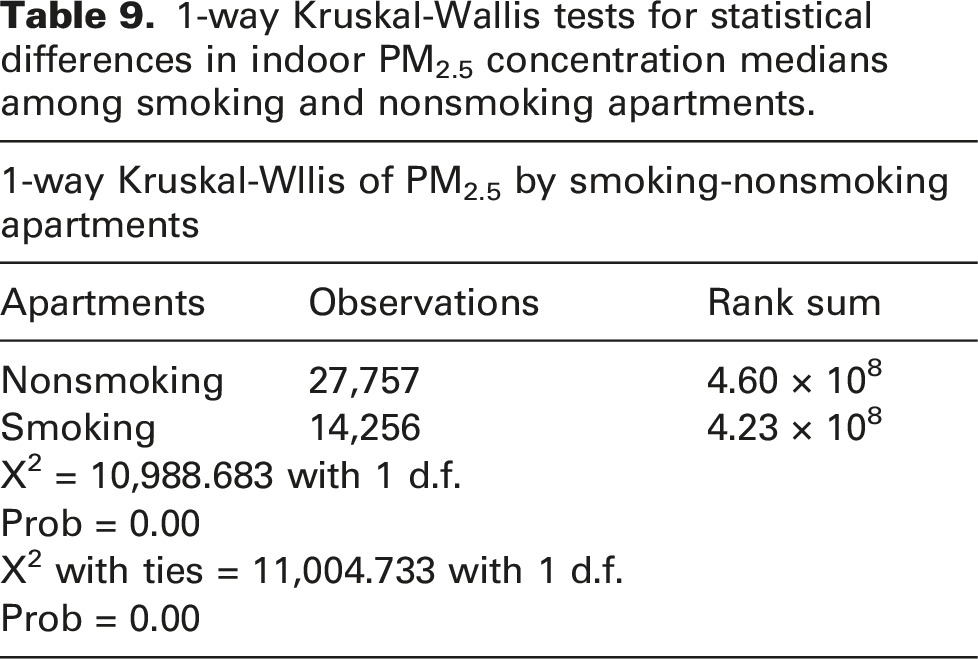
1-way Kruskal-Wallis tests for statistical differences in indoor PM2.5 concentration medians among smoking and nonsmoking apartments.
Interestingly, the average daily PM2.5 in apartments B8 and B9, where no indoor smoking was reported or identified in the interviews, exceeded the 35 µg/m3 threshold in several instances, and none of the units was close to ‘smoking’ apartments in the building. Conversely, A12, although a ‘smoking’ unit, recorded much lower PM2.5 levels compared to other ‘smoking’ apartments, which was also the case with apartment A3. However, as reported in the interviews, only passive smoking occurred within the A3 unit and only occasionally. Hourly variations of PM2.5 for selected apartments are shown in Figure 13. Hourly variations in PM2.5 concentrations of selected apartments during summer 2017.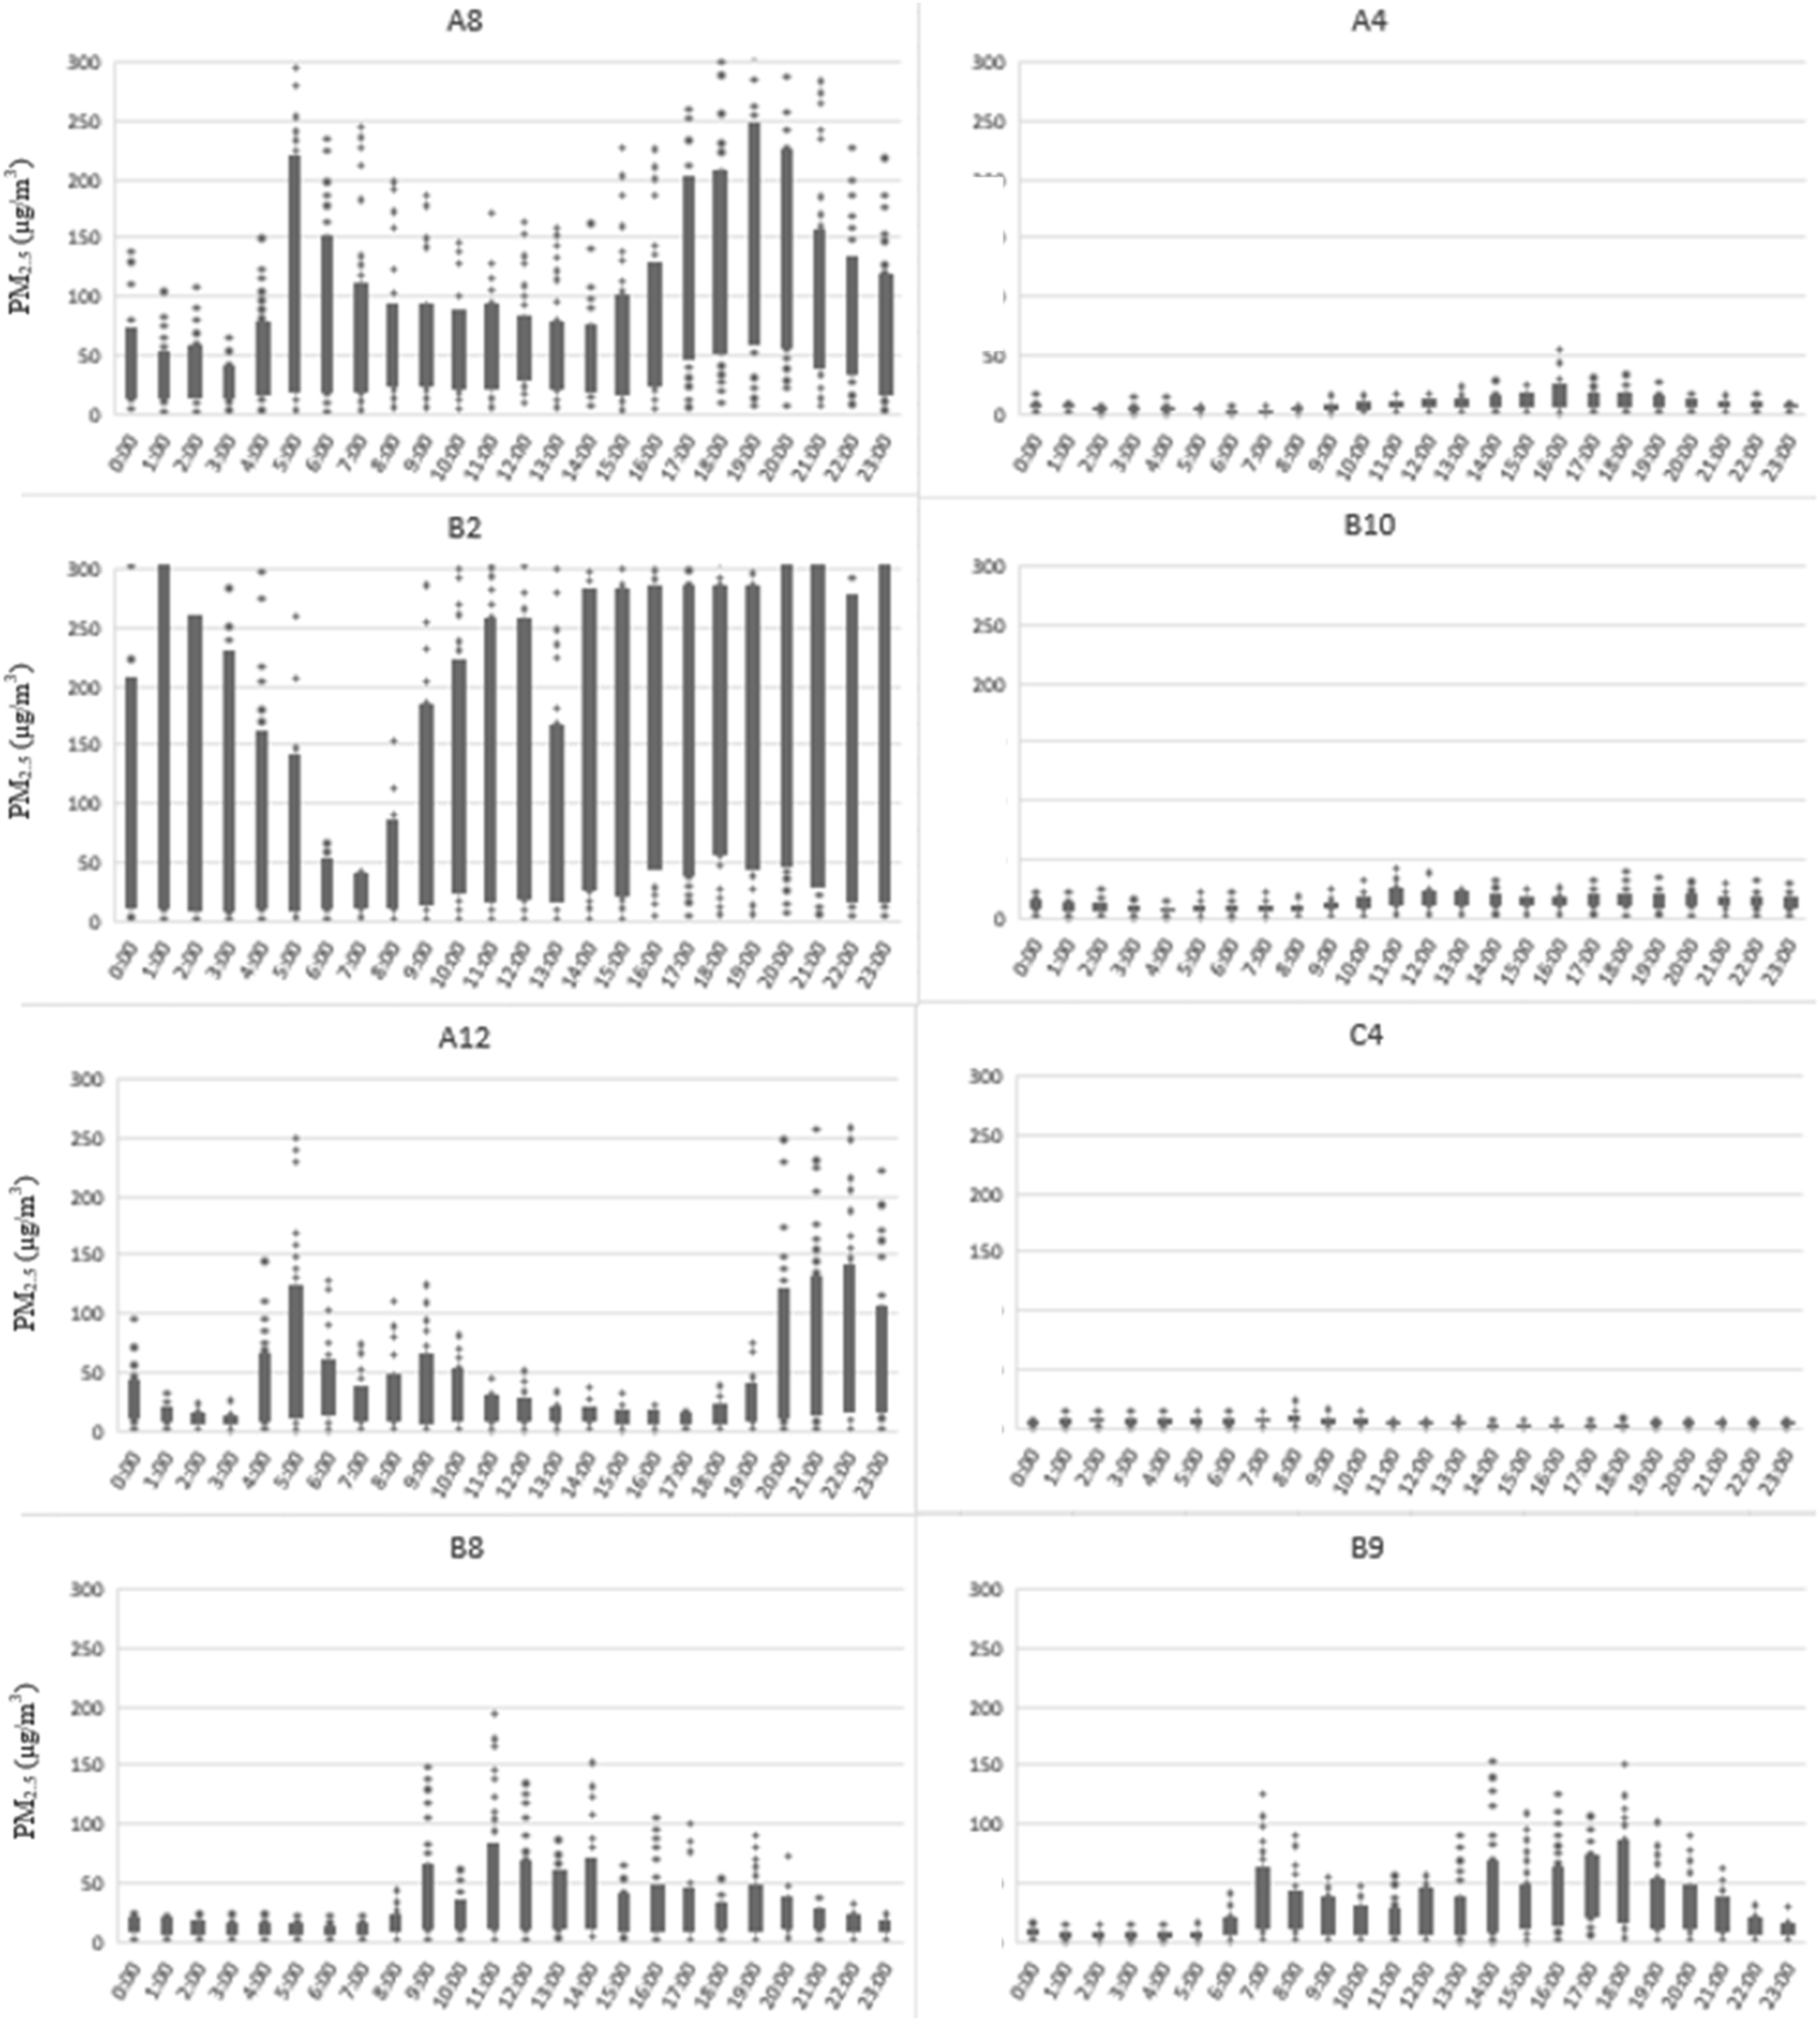
Window opening patterns
As shown in the previous section, the elderly occupants of the sample apartments in Elizabeth, NJ, were exposed to varying amounts of indoor overheating and PM2.5 pollutants during summer 2017. Overall, residents of the newer LEED-certified building on site C experienced better thermal conditions than those residing on the older sites and especially compared to the residents on the oldest site A. This was expected given that dwellings on site A are mostly naturally ventilated with poor wall insulation, as documented in the interviews. Likewise, site C had lower PM2.5 levels compared to the 60s’ high-rise on site B, which had the most apartments in the samples where indoor smoking occurred.
Thermal and IAQ variations were also observed between apartments located on the same sites. For instance, A4 and B10 had among the lowest HI and PM2.5 concentration in the sample, C3 had surprisingly high HI, ‘non-smoking’ apartments B8 and B9 had elevated PM2.5 concentrations and A12 had somewhat low PM2.5 concentrations for a ‘smoking’ apartment. Besides building and site-specific features, these variations may relate to additional apartment characteristics, such as size, orientation, floor number and the number of windows (see Tables 3 and 4). Yet, differences in exposure to high indoor HI and PM2.5 concentrations may also relate to occupant behaviours, such as the operation of A/C and windows, cooking, activities indoors, as well as occupancy rates that can substantially influence IEQ.
The following analysis explores occupant-controlled passive ventilation and examines the effect of the WO on indoor thermal and air quality performance. Figure 14 presents WO patterns for each study site. Residents with central A/C on site C relied much less on WO than those on sites A and B; the latter had relatively more WO in the kitchen likely an indicator of ventilation associated with cooking, as some residents mentioned in the interviews. In contrast, dwellings on site A which had the highest HI in the sample opened their windows more and living room and kitchen windows were on average open for 50–60% of the time, which may suggest some form of daytime cooling. Lastly, a reverse pattern was observed on site B; on average, kitchen and living room windows were open almost as much as on site C; however, a much higher percentage of WO in the bedrooms (close to 50%) may be an indicator of nighttime cooling, which was also reported in the interviews by some residents. Percentage of window opening on site based on sensor measurements during summer 2017.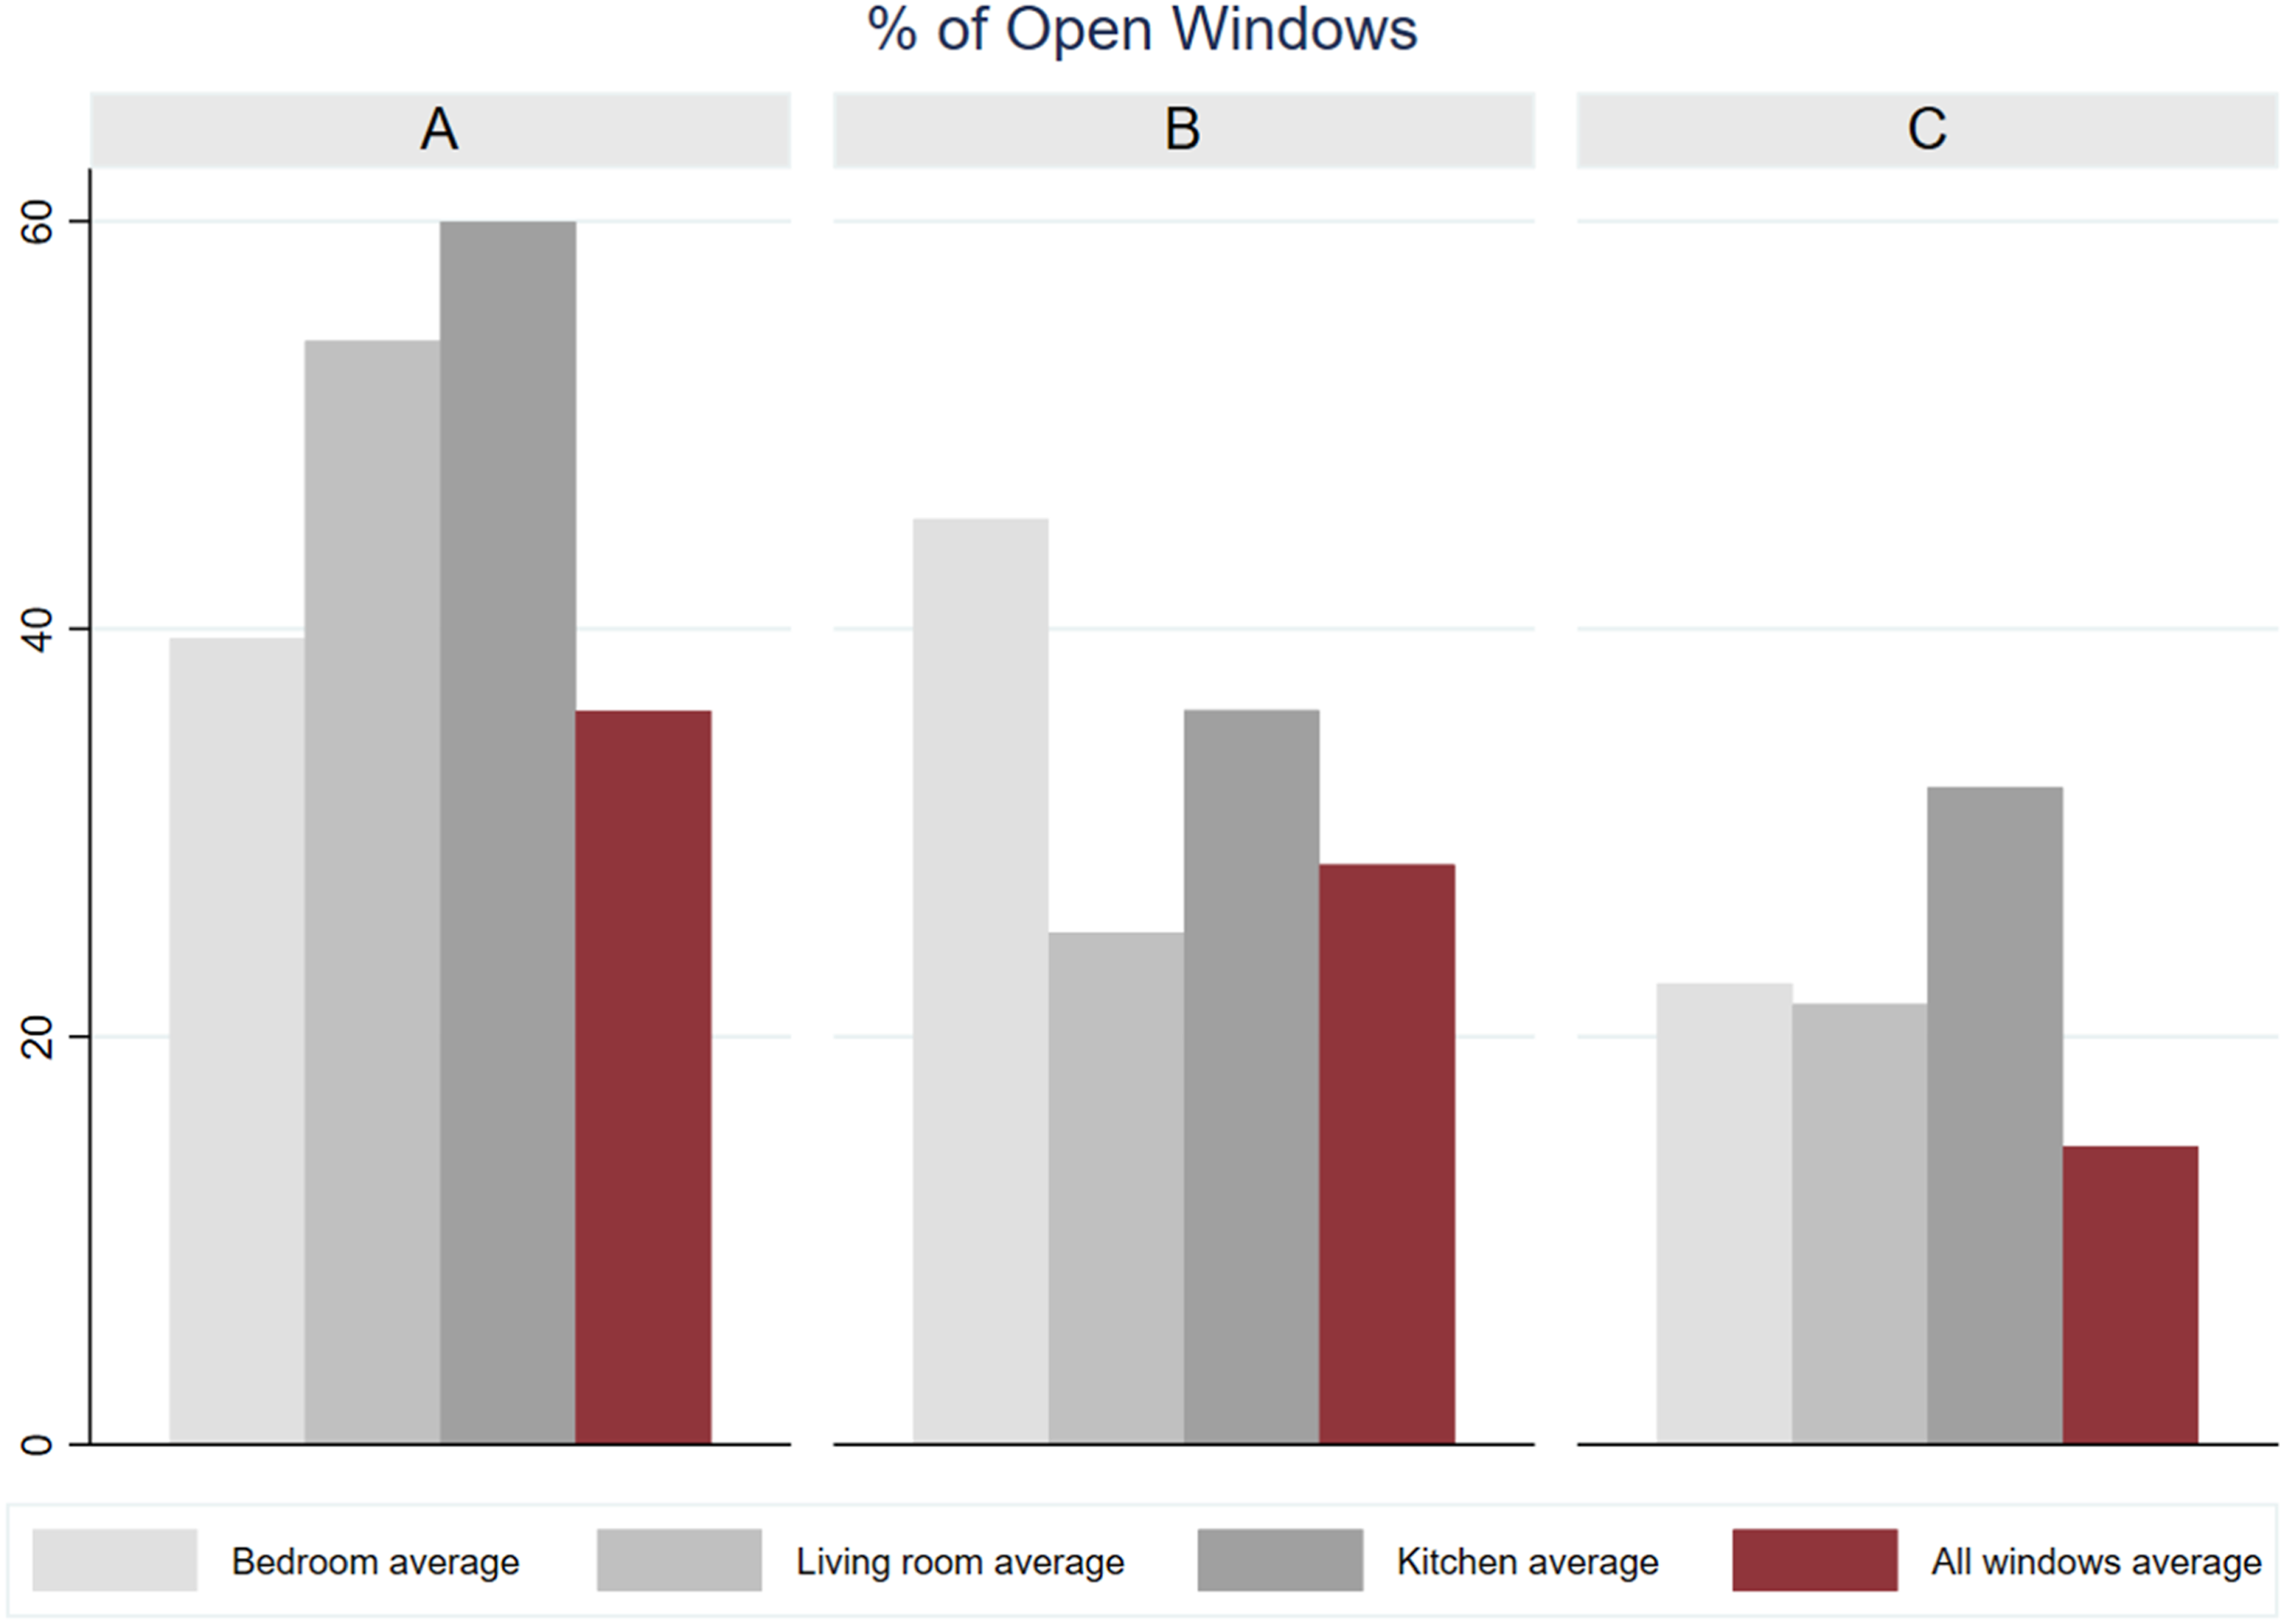
Figure 15 zooms into the WO patterns of each apartment. In line with Figure 14, it can be observed that, on average, residents of dwellings on site C did not operate their windows very much, except for C3, where bedroom, kitchen and living room windows were open almost 60% of the time. Apartment C3 had the highest HI of all the samples apartments in this building. Percentage of window opening by apartment in apartments based on sensor measurements during summer 2017.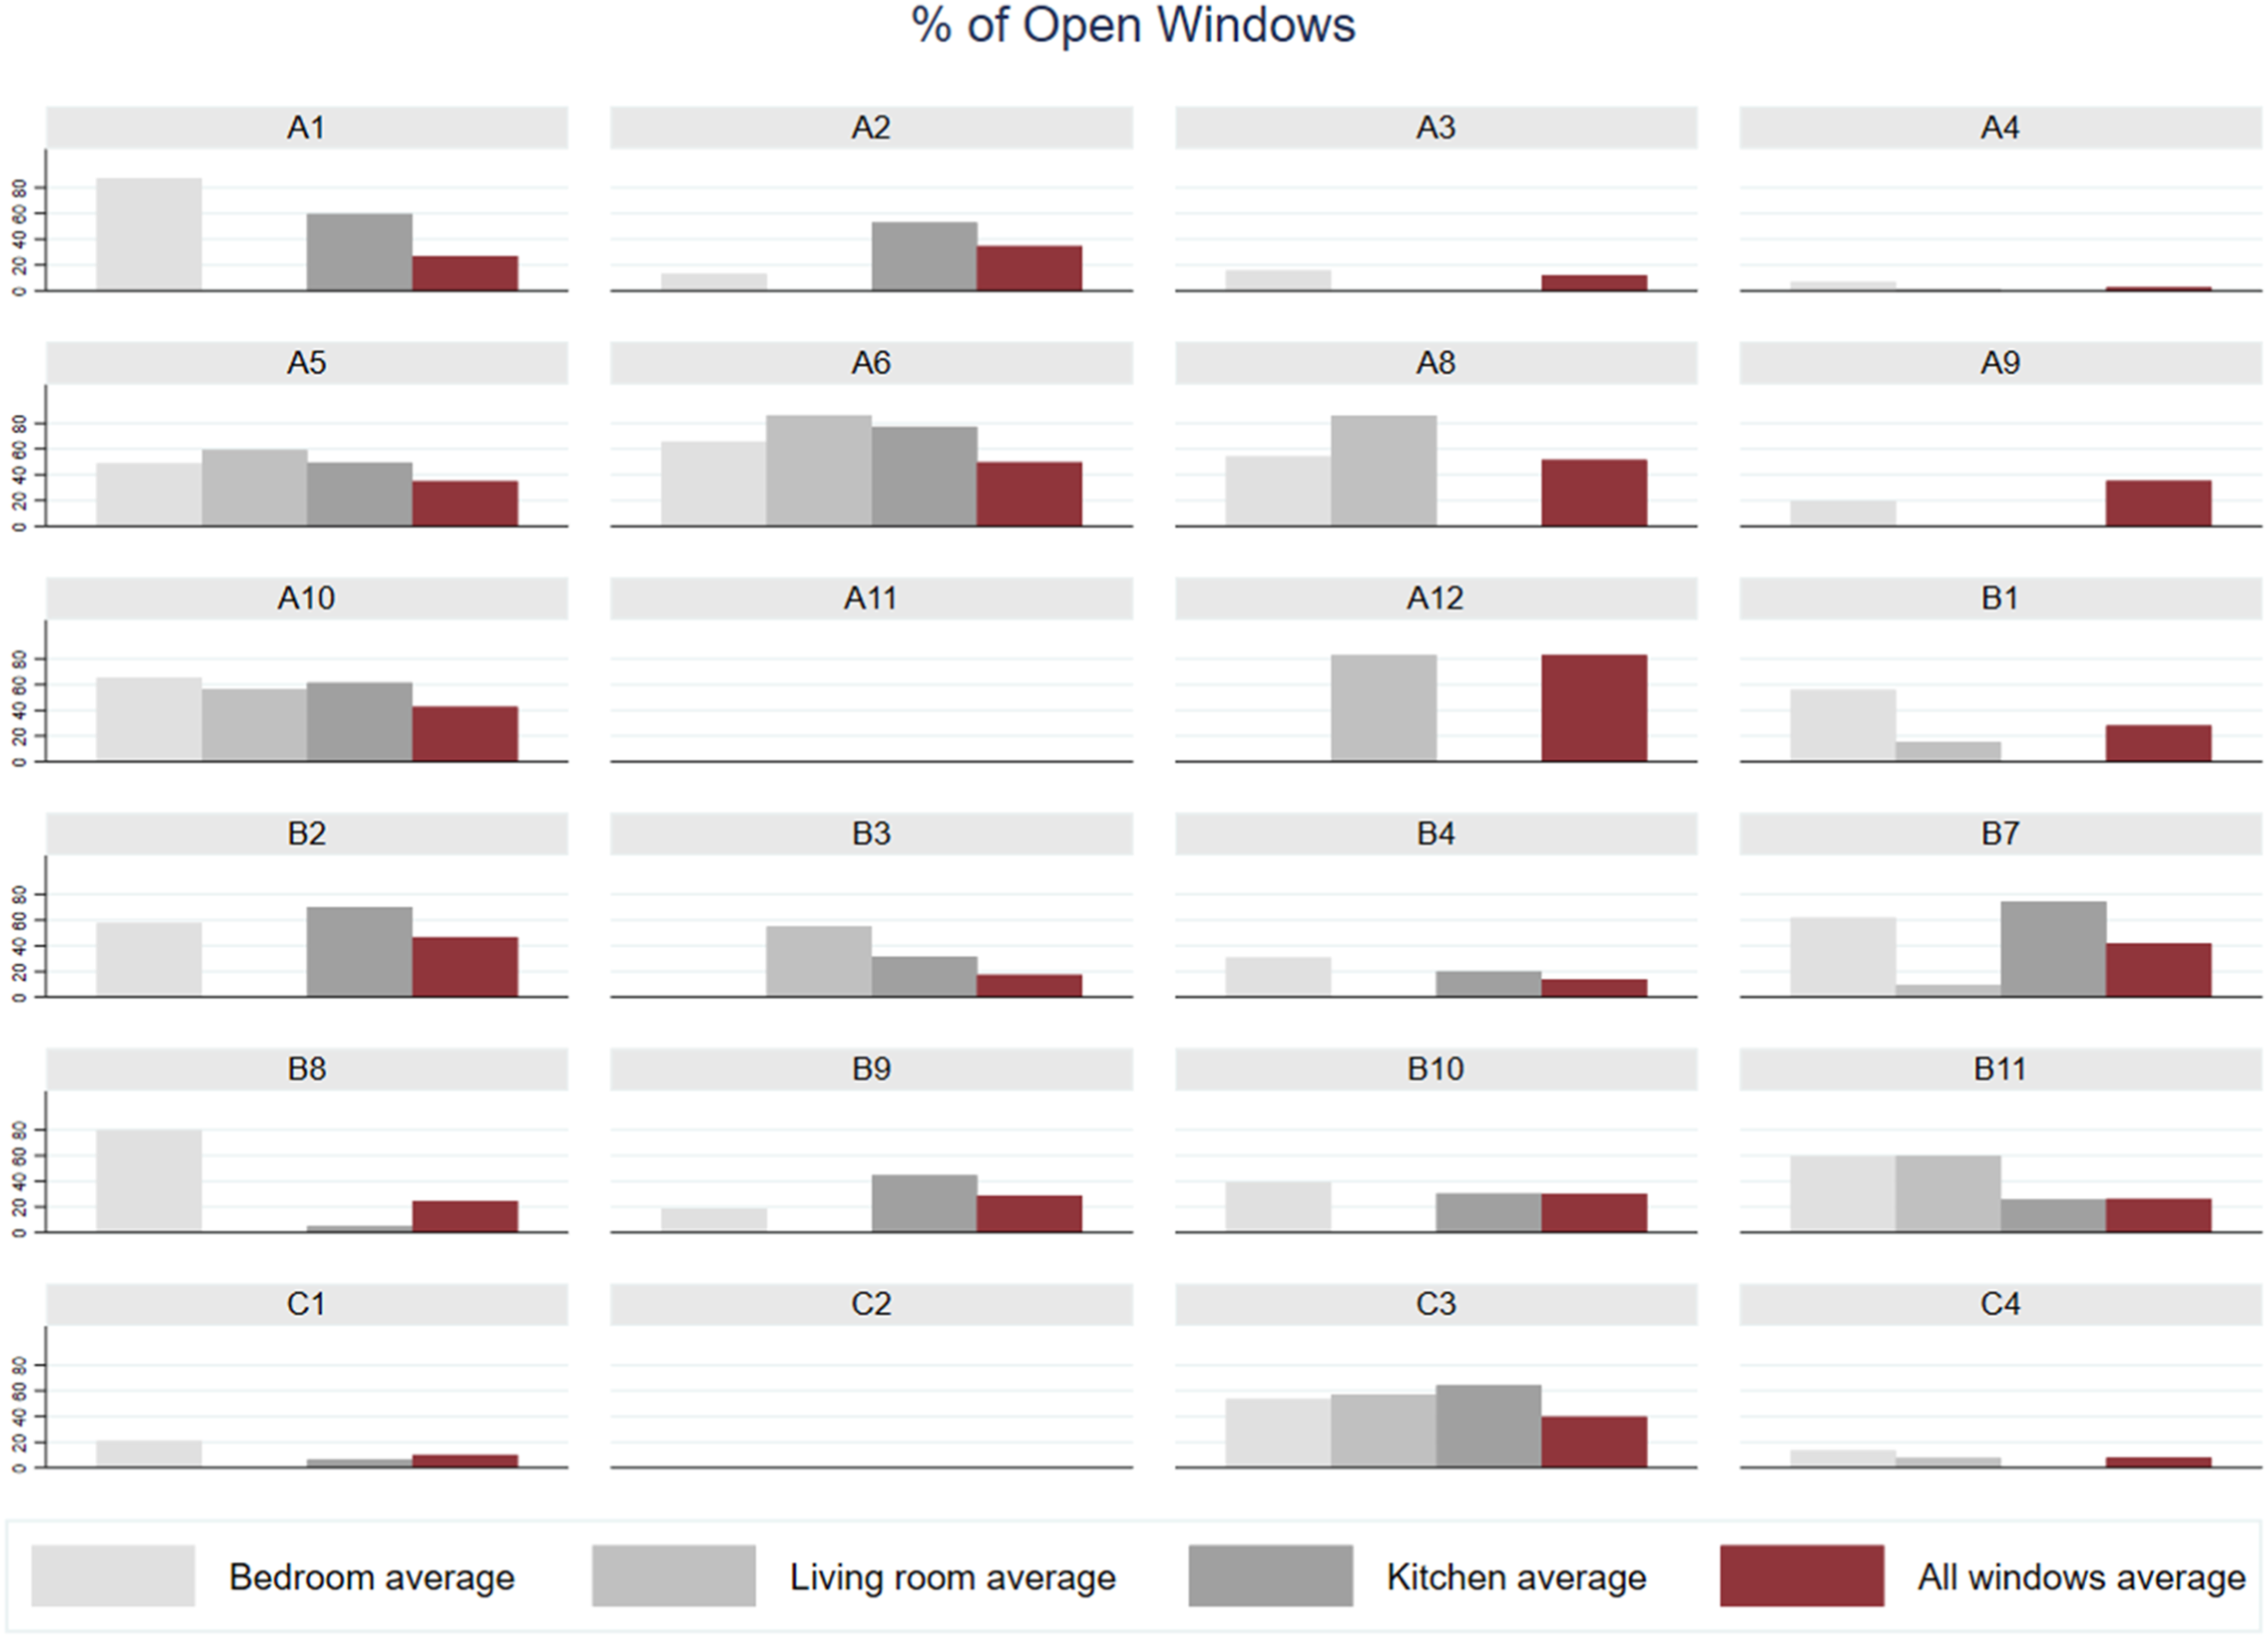
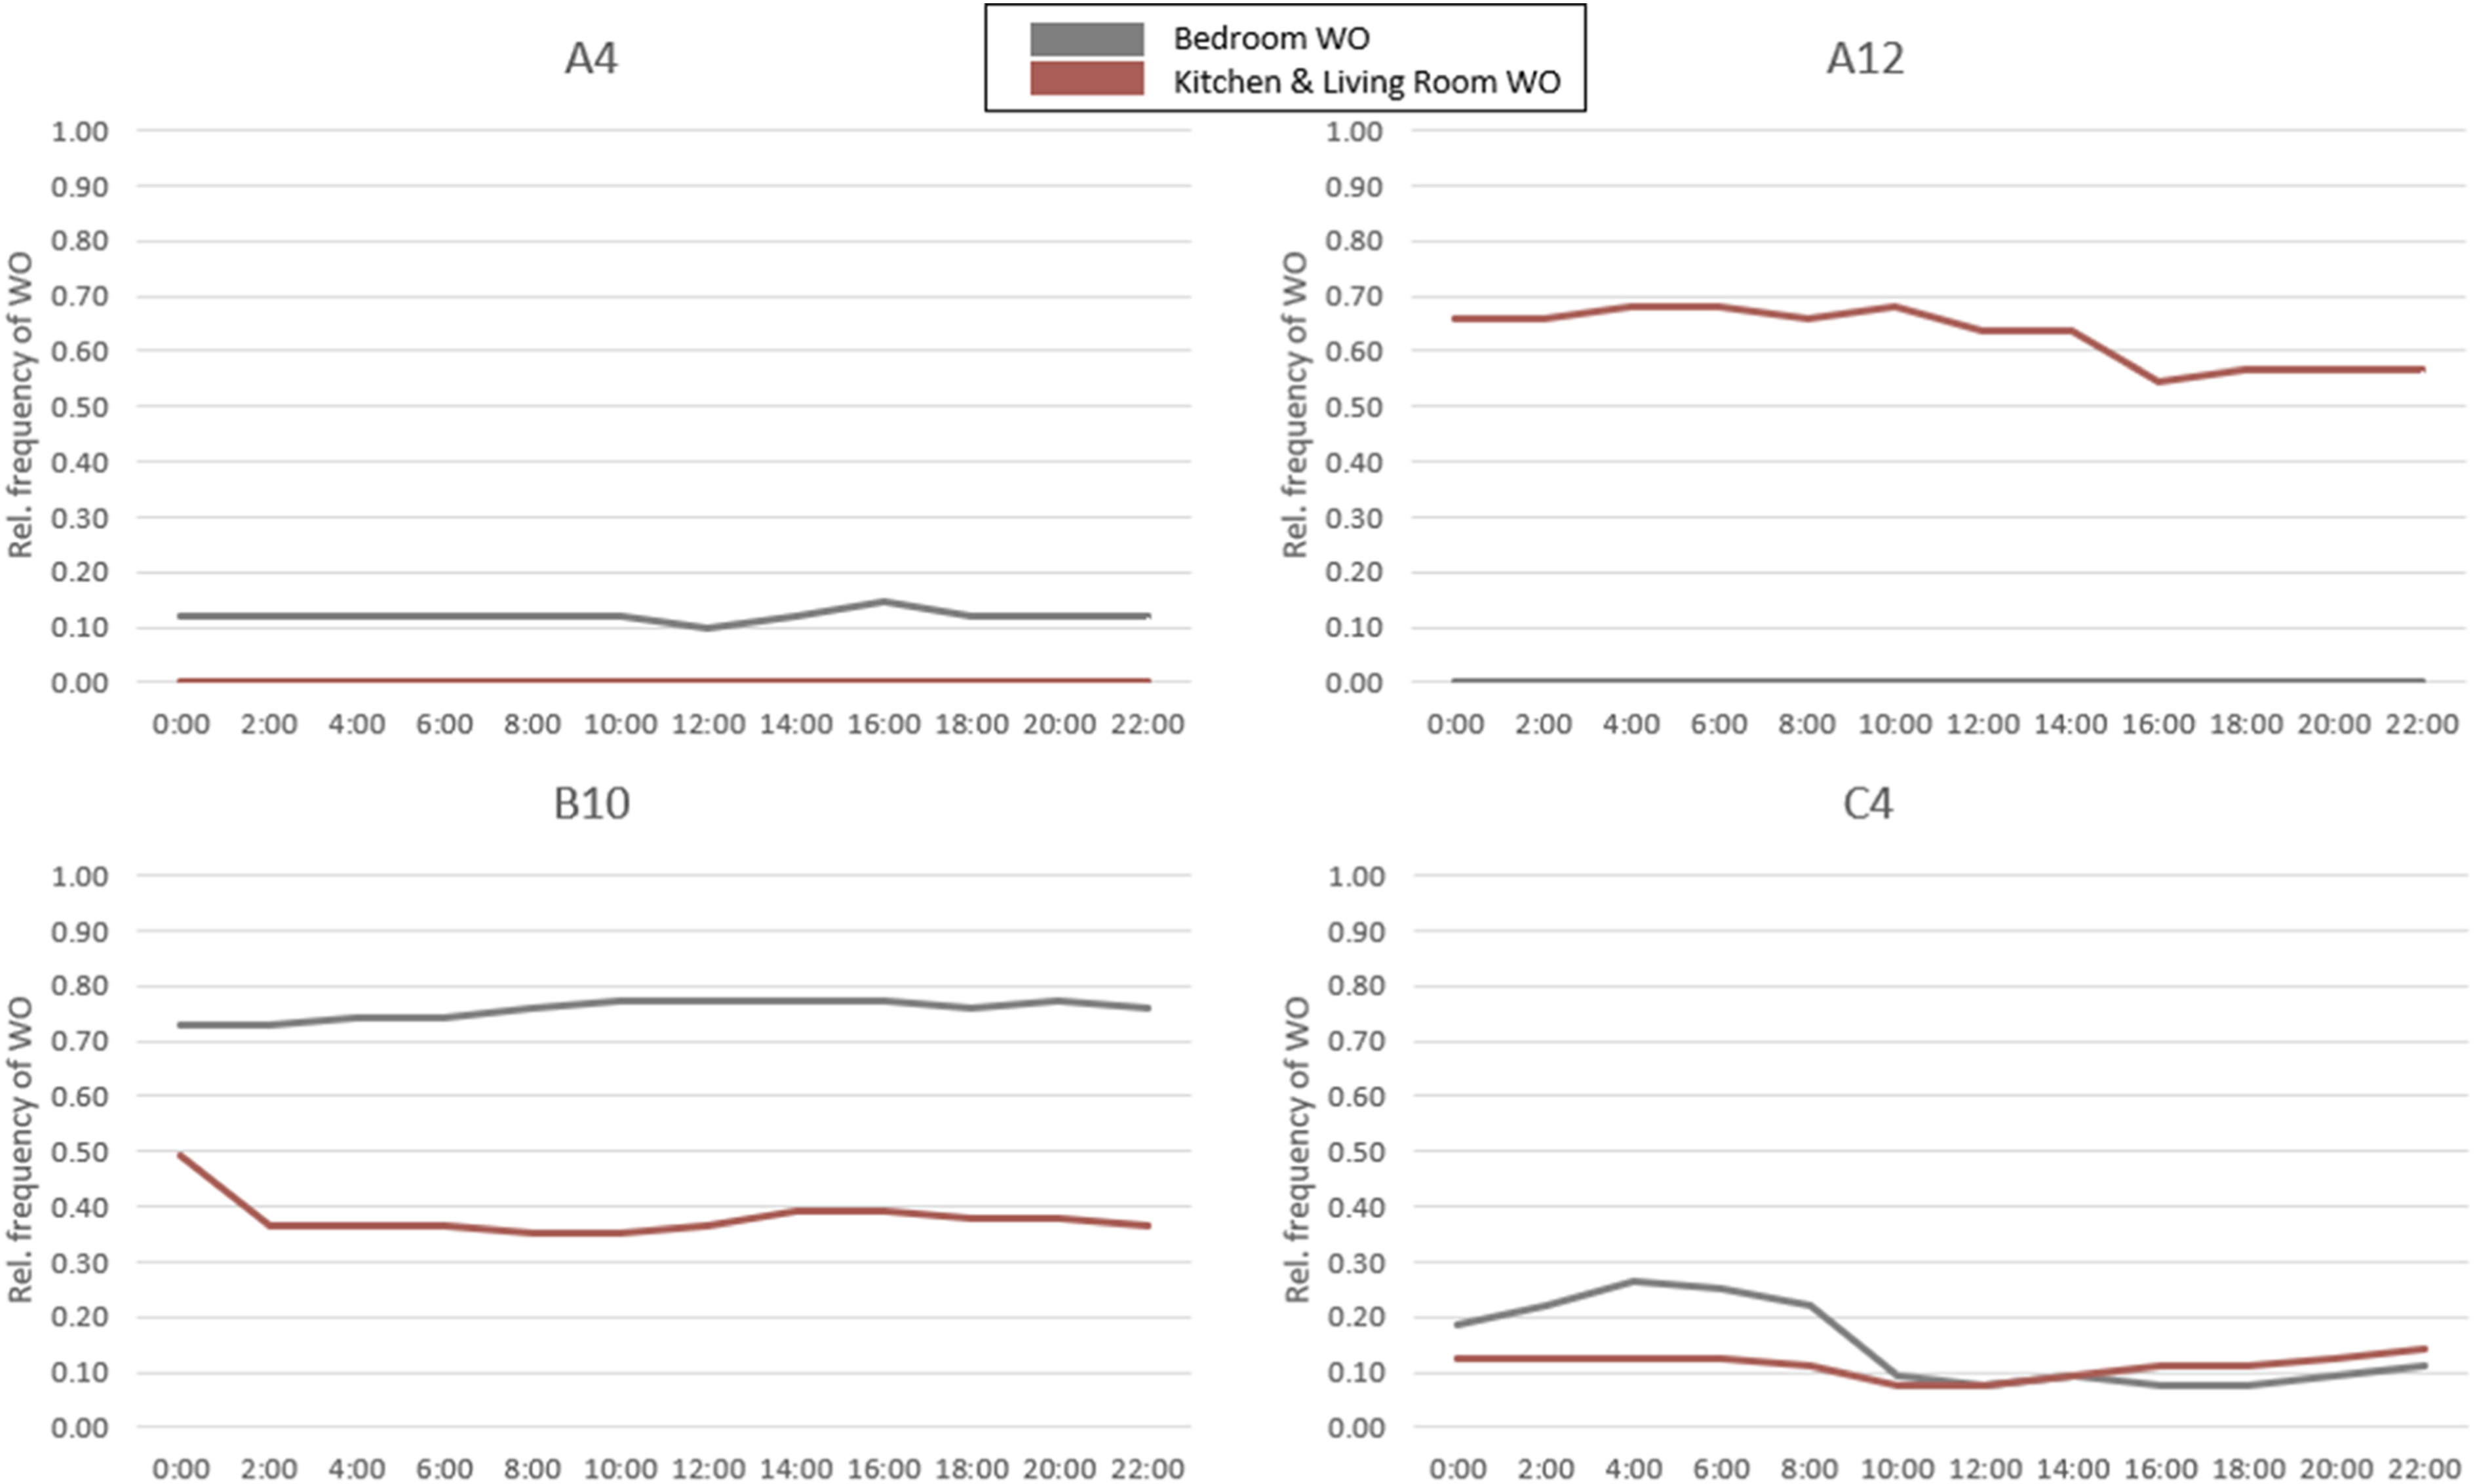
Figure 15 further shows that within the warmest site A, WO patterns were highly varied. The resident of A4, which had the best thermal conditions on the site, kept the windows mostly closed, while in A12, where PM2.5 levels were relatively low for a smoking apartment, the living room window was kept open for almost 80% of the time. On the contrary, living room windows were closed in the ‘non-smoking’ apartments B8 and B9 that recorded surprisingly high PM2.5 concentration. Hourly WO patterns of selected apartments are presented in Figures 16 and 17. Hourly WO patterns of selected apartments from each site during summer 2017. Hourly WO patterns of selected apartments from each site during summer 2017.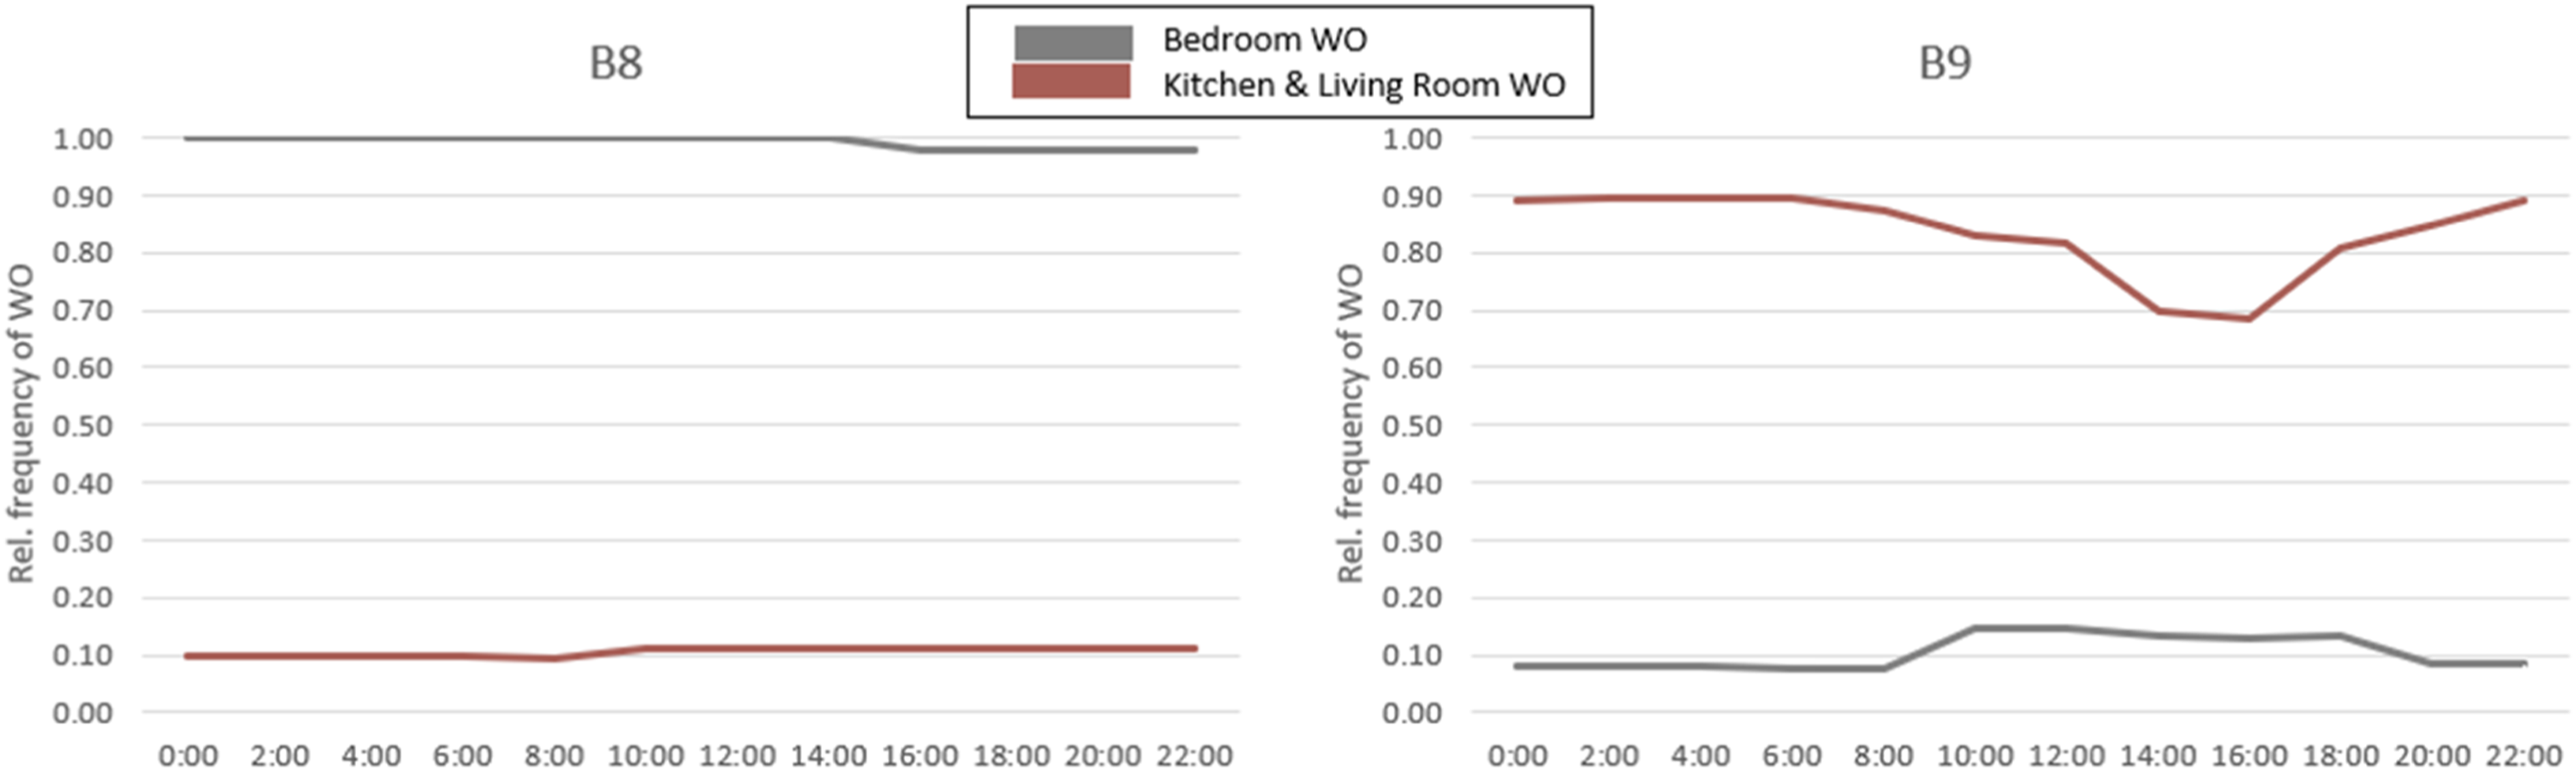
Effect of Window Opening on Indoor Heat Index and PM2.5 concentration
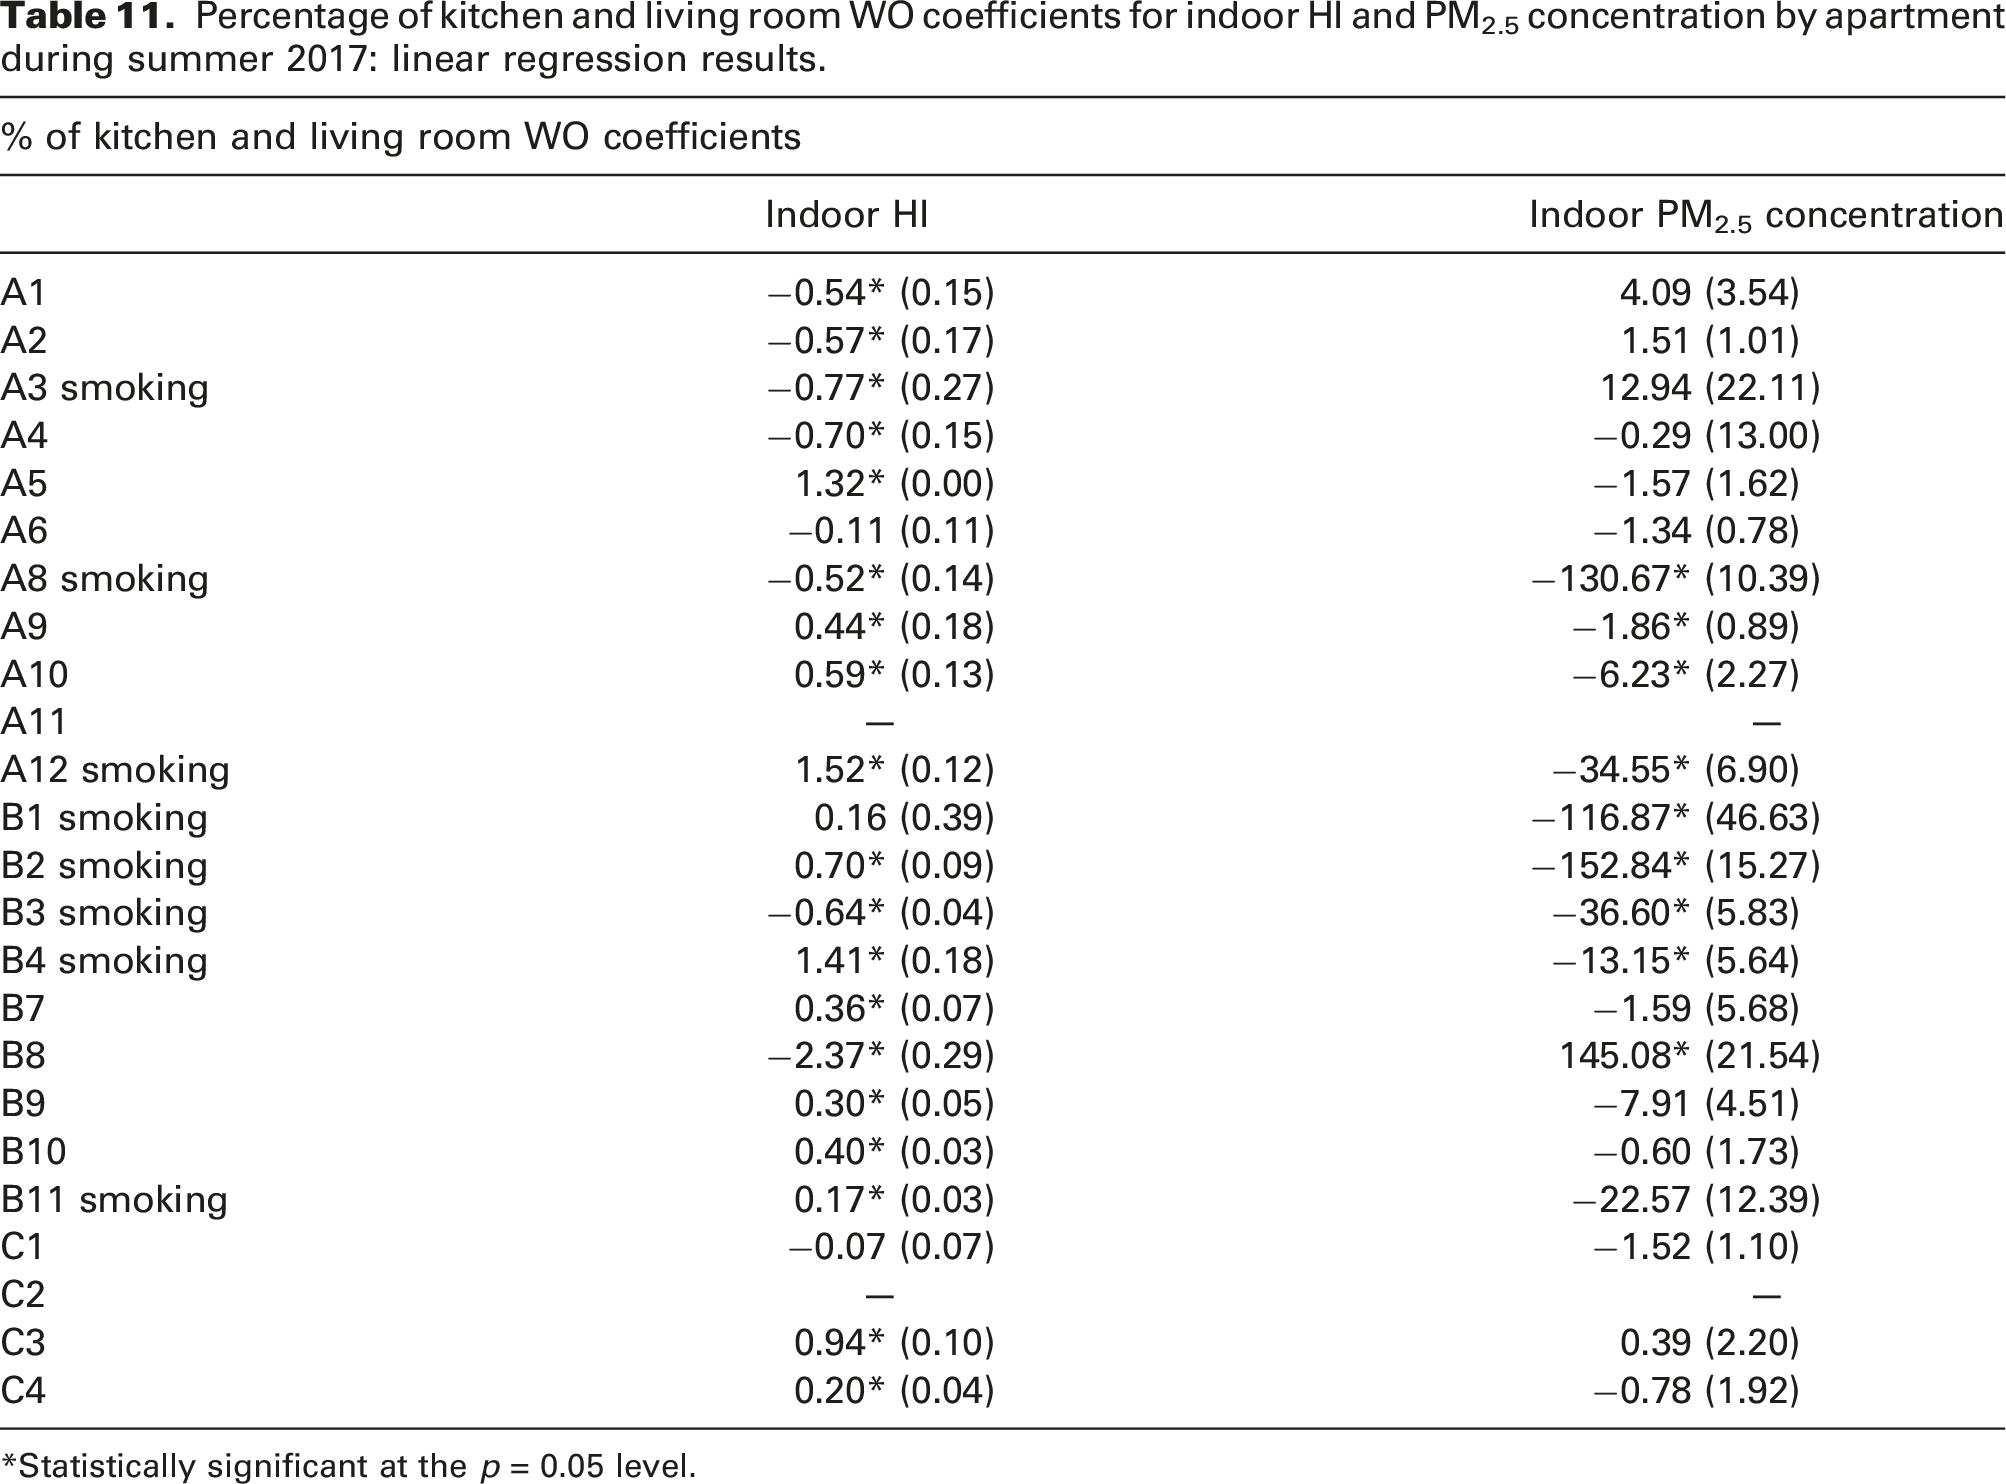
3-level mixed models (linear regression with random effects) for indoor HI and PM2.5 concentration during summer 2017.
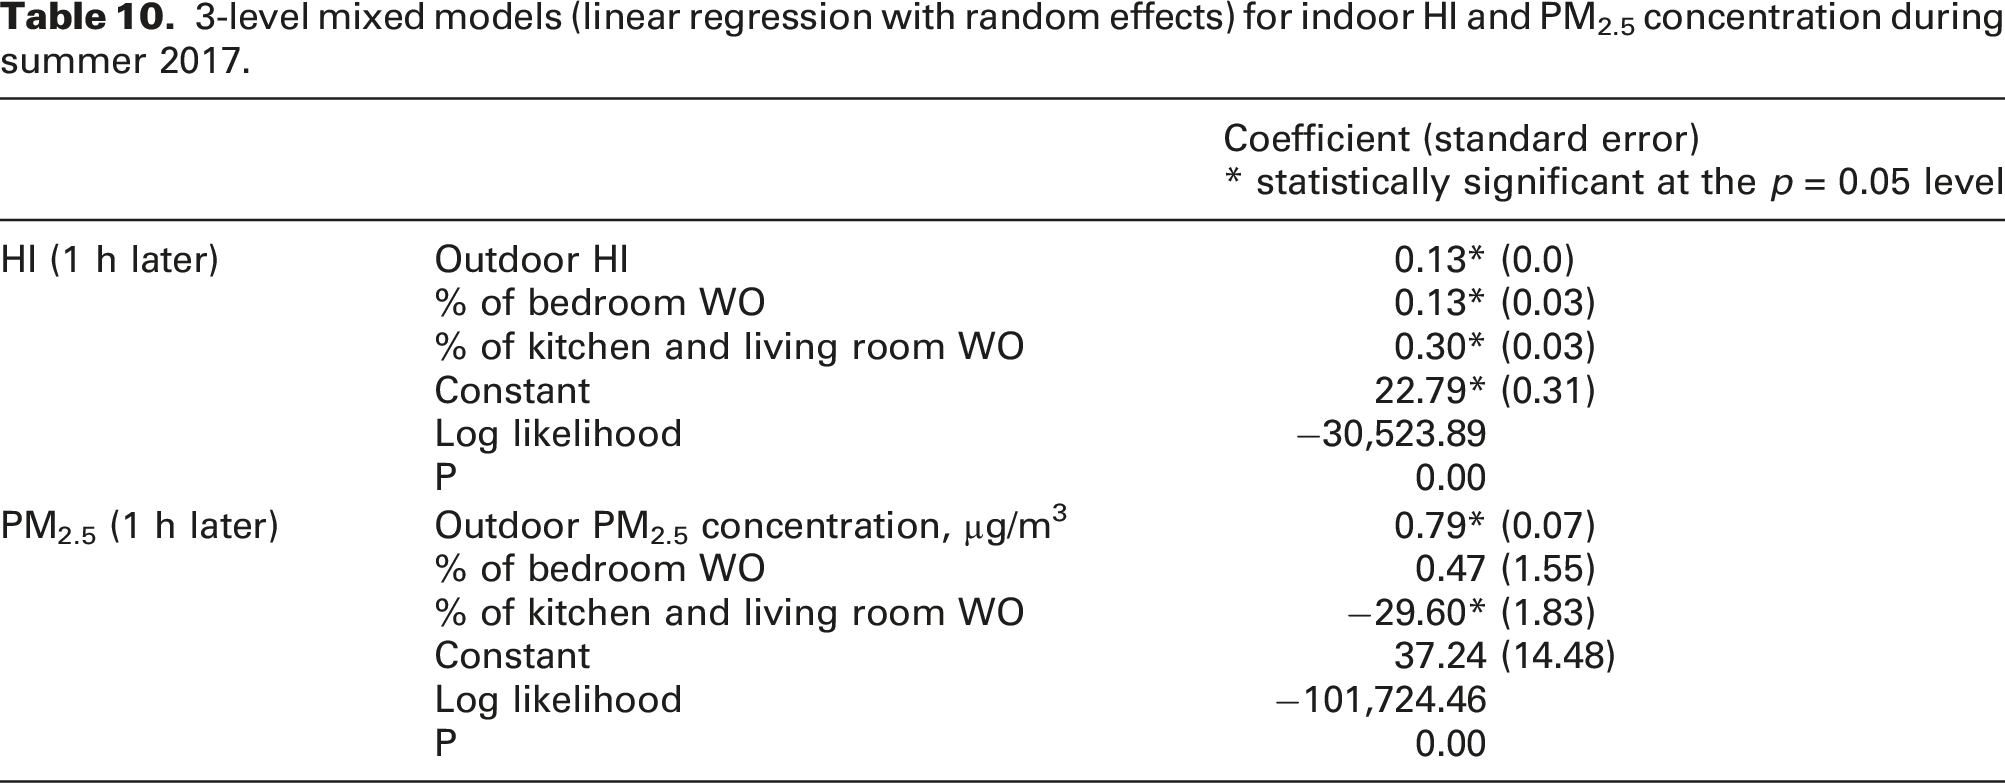
To better understand where these trade-offs occurred, indoor HI and PM2.5 concentration of each apartment were regressed against the corresponding kitchen and living room WO, as well as the outdoor HI and PM2.5 concentration, respectively. The coefficients presented in Figure 18 and in Table 11 confirm that opening the windows translated into a higher indoor HI and a lower PM2.5 concentration for 64% and 77% of the sample, respectively, for both ‘smoking’ and ‘non-smoking’ units. The effect of WO was more pronounced in the case of PM2.5 concentration, with the highest magnitudes in some ‘smoking’ units (A12, B1, B2 and B4). Kitchen and living room WO coefficients for indoor HI and PM2.5 concentration by apartment during summer 2017: linear regression results. Opening the windows translated into a higher indoor HI and a lower PM2.5 concentration for most of the sample (bottom right quadrant). The effect of WO was more pronounced in the case of PM2.5 concentration, with the highest magnitudes in some ‘smoking’ units. Percentage of kitchen and living room WO coefficients for indoor HI and PM2.5 concentration by apartment during summer 2017: linear regression results. *Statistically significant at the p = 0.05 level.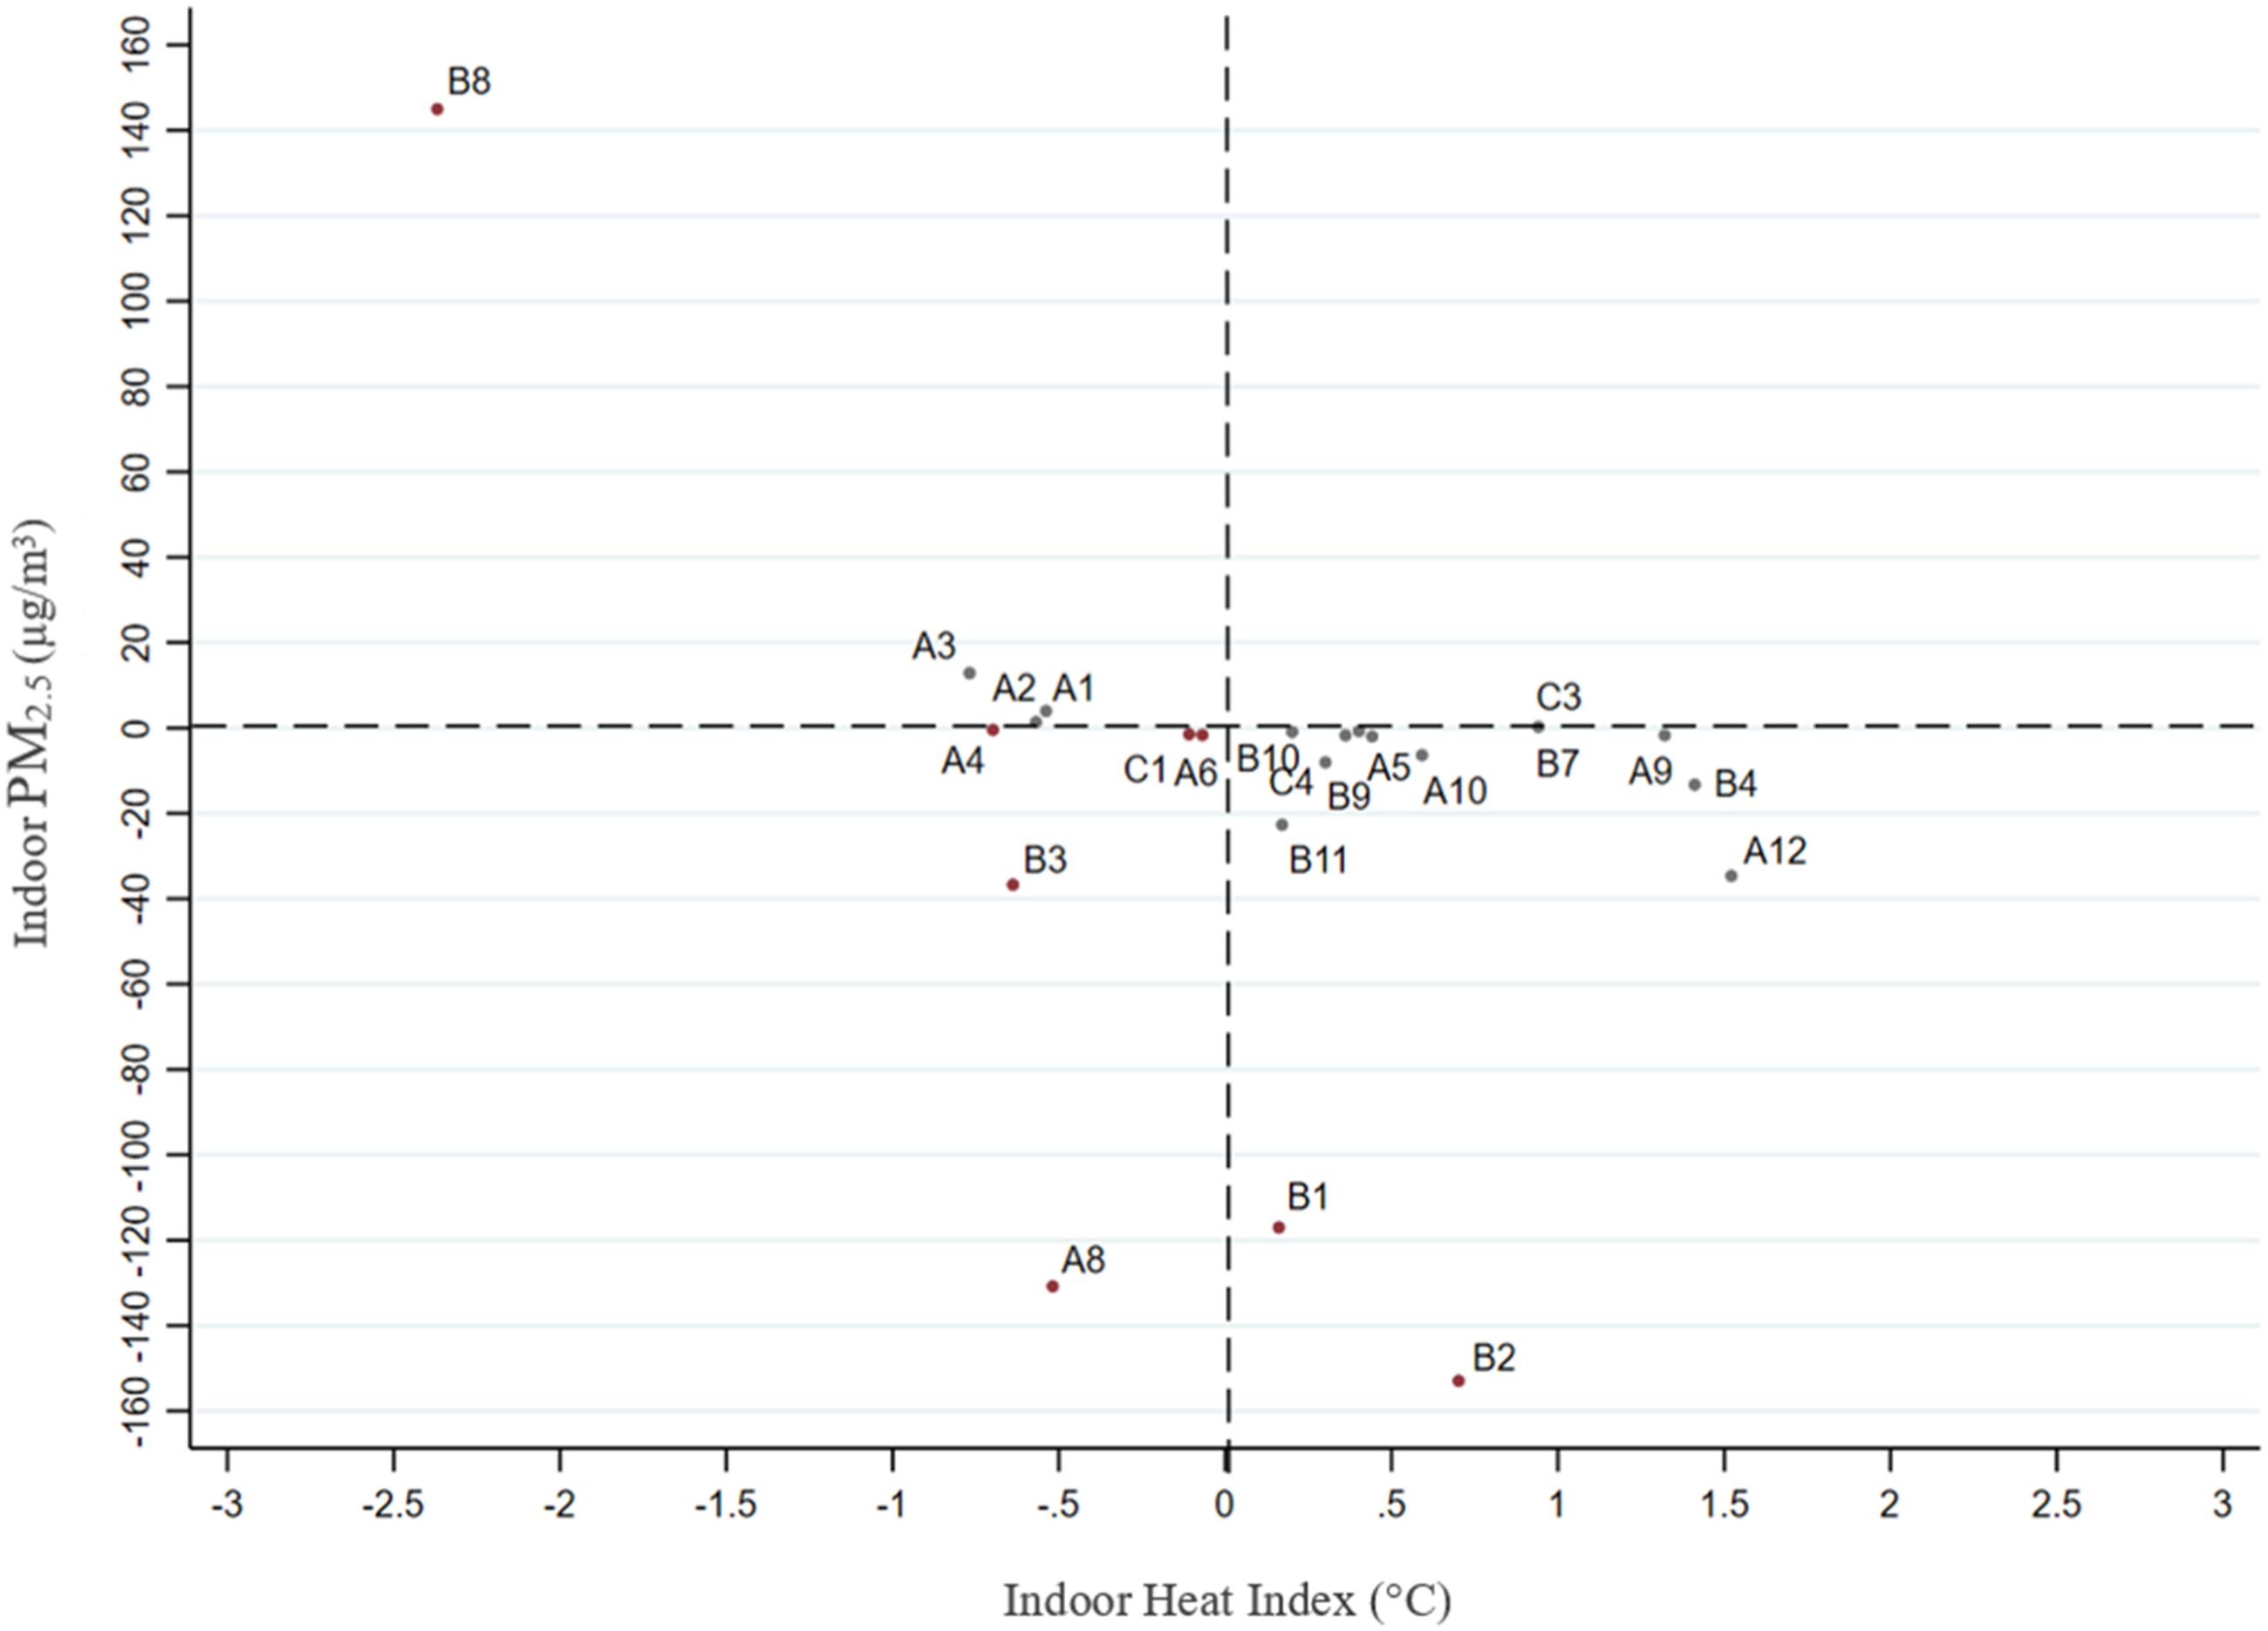
A reverse trade-off was observed for three apartments (A2, A3 and B8), where WO was associated with a lower HI and a higher PM2.5 concentration. Regarding the irregular pattern of apartment B8, while the high HI coefficient may indicate a good WO strategy (mostly relying on bedroom ventilation as shown in Figure 15), we speculate that the high PM2.5 concentration coefficient may indicate the existence of outdoor pollutant sources. Yet, in some cases, WO translated into both lower indoor HI and PM2.5 levels. Specifically, five apartments (A4, A6, A8, B3 and C1) had negative WO coefficients for HI and PM2.5 concentration, with two ‘smoking’ units among them (A8 and B3).
When combined with the results of Figures 7 and 17, these findings suggest that empirically more than one WO strategy can nudge HI and PM2.5 values to fall within acceptable ranges while avoiding indoor overheating and air pollution. However, this may also depend on the time of day and room. On the older sites A and B, either a conservative approach through low WO activity throughout the day (see unit A4) or a medium WO strategy (see unit B10) with more bedroom ventilation and WO in the kitchen results in within-range values, while in the newer site C, a low WO strategy (see unit C4) seems to work best.
Discussion
Continuous monitoring of indoor temperature, humidity and PM2.5 concentration reveals the prevalence of overheating and pollutants inside the public housing residences for seniors in Elizabeth, both during HW periods and on regular days of summer 2017. The daily average indoor HI and PM2.5 levels were above the thresholds of 27°C and 35 µg/m3, respectively, and far exceeded the outdoor levels, indicating poor insulation levels and the existence of indoor pollutant sources.
Significant differences were also observed between these three study sites. When indoor HI and PM2.5 levels are examined in parallel, apartments in the 1960s’ high-rise building of site B performed the worst, followed by apartments in the 1930s low-rise buildings of site A. With regard to the first, this is primarily due to high indoor PM2.5 levels, which are associated with high levels of indoor smoking within the units, the negative effects of which have been consistently reported in the literature.38,47 Additional activities such as cooking or lighting candles/incense combined with poor ventilation may play a part in the presence of PM.41,92 With regard to the latter, this is due to high indoor HI levels, which is an intuitive finding, especially when considering the poor building envelopes and the absence of central A/C in these buildings.
Opening windows in common spaces (kitchen-living room) are associated with a reduction of indoor PM2.5 concentration and an increase in indoor HI, so natural ventilation patterns in the two older sites might further contribute to the high HI levels. On average, residents of site B open the bedroom windows more frequently than the kitchen and living room windows, likely for some nighttime cooling. However, this does not help with reducing PM2.5 exposure from indoor sources, such as smoking. The reverse was observed on site A; residents keep the kitchen and living room windows open for almost 60% of the time, probably for daytime cooling, which might increase the amount of heat coming from outdoors.
Yet, even in the newer LEED-certified building on site C where smoking was absent and residents reported operating the A/C, less than 50% of indoor HI and PM2.5 measurements lie within the acceptable zone, which indicates insufficient protection of seniors from overheating and air pollutants. This finding aligns with the results of a monitoring study by Gupta et al., 93 who found severe summertime overheating in a modern 2013-built care home in London, UK, and with the results of Ade and Rehm, 57 who found significant signs of overheating in a green-rated building for retirees in Auckland, NZ during the two warmest months of the year.
Substantial variations in indoor thermal and air quality conditions are further revealed by comparing apartments within each site, some of which are counterintuitive. Instances include two units from sites A and B that achieve low indoor HI and PM2.5 levels similar to units from site C; one unit from site C that has unexpectedly high HI, as well as two ‘non-smoking’ units from site B that have high PM2.5 concentrations and one ‘smoking’ unit from site A that has low PM2.5 concentrations. Analysis suggests that these findings could be attributed, at least in part, to natural ventilation and associated window operation patterns in each apartment. Specifically, it is found that higher WO is associated with higher indoor HI and lower PM2.5 concentrations in more than half of the samples, while the highest influence is on PM2.5 concentrations in some ‘smoking’ units.
An important finding of this work is that in about 20% of the samples, including two ‘smoking’ units, WO seems to benefit both thermal and air quality conditions. Indeed, in the case of IAQ, a wealth of literature has demonstrated the benefits of natural ventilation through WO for reducing indoor exposure to PM2.5 concentrations, assuming good outdoor air quality, even in households with smokers.47,94,95 Yet, even in the case of HI, modelling studies have shown that combining nighttime WO with additional passive cooling strategies can improve thermal comfort in dwellings.55,64
Natural ventilation through an occupant-controlled WO in residential environments does not necessarily need to result in a thermal and air quality trade-off during the summer. Overall, natural ventilation has a significant impact on the indoor thermal conditions and IAQ, but the WO time of day and the selection of particular windows to be opened are key considerations, as highlighted in Table 10 and Figures 15 and 17.
Therefore, for a newer building with the absence of significant indoor pollutant sources, low daytime WO in the common spaces (kitchen and living room), complemented by low bedroom WO for night ventilation, can work well when combined with the operation of A/C. For older buildings with a poorer building fabric and without central A/C, an effective WO strategy may depend on additional considerations, such as the existence of cross ventilation and the number of windows, the floor number and the façade(s) orientation; either low bedroom ventilation in the nighttime or a medium WO strategy with night ventilation in the bedroom and day ventilation in common spaces (with avoidance during the hottest hours – noon) can be effective. However, when indoor sources such as smoking cannot be avoided either in new or older buildings, a very active daytime WO strategy in common spaces appears to be necessary for reducing PM2.5 concentrations (with avoidance during the hottest hours – noon).
Limitations
Our time-series monitoring data and the selection of three study sites with different indoor and outdoor characteristics were aimed to represent a range of public housing projects in the northeast US and their indoor environmental conditions. However, the relatively small number of sample apartments does not allow us to examine more closely the additional sources of IEQ variations related to building characteristics. For instance, floor number, as well as the location, size and insulation of windows, can modify thermal and air quality conditions.30,38,40 Likewise, WO may highly affect natural ventilation, but this can be easier to examine in modelling rather than monitoring studies. Future work on multi-domain IEQ approaches should aim at a larger sample to capture these variations and offer more concrete recommendations for effective natural ventilation based on apartment-specific characteristics.
Additional uncertainty in the study relates to our selection of criteria for assessing indoor overheating and pollution. For both the HI and PM2.5 concentration, we rely on thresholds with relatively conservative standards. A suggestion for future research is to assess the sensitivity of recommendations to selected thresholds for older adults. Lastly, future studies of thermal comfort and IAQ should examine additional indoor exposures to pollutants that can benefit from natural ventilation, such as mould and volatile organic compounds.
Conclusion
In this work, we examined the indoor thermal conditions, IAQ, and natural ventilation through a WO in 24 apartments of older adults located on three public housing sites in Elizabeth, NJ. Continuous monitoring during summer 2017 indicated that a large portion of the sample experienced HI and PM2.5 levels that exceeded selected thresholds, with substantial between-site and between-apartment variability. We showed a clear distinction in exposures between the older buildings without central A/C and the more modern LEED-certified building, as well as between ‘smoking’ and ‘non-smoking’ units, but the overheating and pollutant risks were not limited to older properties where smoking occurred. This finding highlights the vulnerability of low-income older adults to more than one indoor environmental concern and suggests that future research should focus on an integrated study of IEQ that considers occupant activities indoors, alongside building characteristics.
An exploration of natural ventilation patterns inside each apartment further revealed that WO had a significant effect on both HI and PM2.5 concentration, which resulted in a thermal and air quality trade-off in the majority of the sample. Yet, the WO pattern of some apartments was associated with both lower HI and PM2.5 concentration. Based on this finding, which relies on real observations of WO patterns, occupant-controlled WO emerges as a potentially effective strategy to mitigate indoor heat while maintaining good IAQ inside senior residences.
As the impacts of climate change accelerate, natural ventilation should be part of a spectrum of passive adaptations for buildings that can assist building code professionals, public health officials and social housing practitioners interested in protecting vulnerable seniors. Undoubtedly building homes with sufficient ventilation should be a requirement since operating certain windows at specific times during the day can work well as a means to cool off and reduce indoor air pollution during the summer, assuming good outdoor air quality. It is also very suitable in an affordable residential housing context, in the absence of safety concerns. Yet, due to limitations in the effectiveness of WO during extreme heat conditions and when there are significant indoor pollutant sources, such as smoking, it is best if coupled with interventions, such as resident education about the importance of IAQ and the promotion of smoke-free households, as well as effective ways to open windows, or the use of air cleaners and high-efficiency filters.
Footnotes
Acknowledgements
We thank the residents of the public housing properties who graciously allowed us into their homes and the public housing authority management for generously welcoming us on site. We also thank Deborah Plotnik, Stephania Gonzalemena, Brian Morgan and Sanjeevi Thirumurugesan for collecting data, installing sensors and helping recruit study participants.
Authors contribution
Ioanna Tsoulou: conceptualization, methodology, data curation, formal analysis, original draft, review and editing. Ruikang He: data curation, original draft and review. Jennifer Senick: resources, supervision, data curation, project administration, original draft, review and editing. Gediminas Mainelis: resources, data curation, project administration, methodology, formal analysis, validation, original draft, review and editing. Clinton J. Andrews: conceptualization, methodology, resources, data curation, supervision, project administration, original draft, review and editing.
Declaration of conflicting interests
The authors declare no potential conflicts of interest with respect to the research, authorship and/or publication of this article.
Funding
The author(s) disclosed receipt of the following financial support for the research, authorship, and/or publication of this article: This study was supported by the National Science Foundation (NSF), award AGS-1645786.