
Abstract
Airborne transmission has been confirmed as one of three principal ways of SARS-CoV-2 transmission. To reduce the transmission of SARS-CoV-2 indoors, understanding the distribution of respiratory droplets (or aerosols) present in human breath seems therefore important. To study whether the CO2 concentration can be used as a proxy for the number of exhaled particles present in an occupied space, the distribution of particles with different diameters (0.3, 0.5, 1.0, 2.5, 5.0 and 10 μm) and CO2 concentrations were monitored in a classroom setting with six healthy subjects. Additionally, numbers of particles with the same sizes were measured in the breath of the same six healthy subjects separately. Results showed that (1) on the contrary to CO2, the main source of indoor particles came from outdoor air, and not from occupants; (2) the impacts of ventilation regimes on indoor particle numbers were different to the impacts on CO2 concentrations; and (3) almost no significant relationship between the number of indoor particles and CO2 concentration was observed. Based on these results, this study could therefore not conclude that the CO2 concentration in a classroom can be used as a proxy for the number of exhaled particles by the occupants.
Introduction
Airborne transmission of SARS-CoV-2 is one of the three transmission routes, deemed to be responsible for the global pandemic of coronavirus disease 2019 (COVID-19).1,2 A broad range of exhaled particles can be transmitted by exhaling, sneezing, coughing, talking and singing through (1) direct transmission of larger droplets that directly fall on the mouth, eyes or nose of other people; (2) fomites (or indirect) transmission, droplets that fall on surfaces which are touched by other people; and (3) airborne transmission of aerosols, at close-range or long-range which are inhaled by other people.3–5 To cope with the direct and indirect transmission, keeping social distance, washing hands and wearing masks were implemented. To reduce airborne transmission, sufficient ventilation measures have been recommended by many researchers and international organizations.4,6–8 However, since the behaviour and distribution of exhaled particles are difficult to measure and predict, it is still unknown how much should be ventilated in order to reduce the risk of airborne transmission.
Determining how much ventilation is required and how it is ventilated, is particularly important for school classrooms because of the high density of school children and consequently a higher risk of airborne transmission. 9 Since classrooms are usually crowded and poorly ventilated, 10 they were seen as high-risk environments for children during the COVID-19 pandemic. To ensure the children’s health, most schools were closed during the lockdown. 11 Unfortunately, this measure caused severe health effects among school children, including both physical symptoms and mental disorders. 12 To avoid these effects, schools need to be reopened, and to keep a healthy environment, improving the ventilation was one of the major measures taken by school managers.11 However, the amount of ventilation is still difficult to determine because current guidelines are set up to prevent high CO2 concentrations, not airborne transmission. 13
The virus SARS-CoV-2 has a size of around 120 nm (0.12 μm) in diameter. During breathing, talking, sneezing, etc., the virus is aerosolized and encapsulated in water-based particles with a size ranging from <1 μm to >100 μm.14–16 The behaviour and pathway of these pathogen-loaded particles depend on their size and weight. To reduce airborne transmission with ventilation, it is important to know how these particles with different sizes behave and distribute, and which sizes of particles are most important. Many studies have been conducted to establish relationships between the SARS-CoV-2 and particles of different sizes. Results of these studies varied a lot due to different sampling methods and instruments. Liu et al. 17 found that the SARS-CoV-2 virus was mainly associated with particles of a diameter between 0.25 and 1.0 μm. Nor et al. 18 observed a relationship between PM2.5 (particles with a diameter less than 2.5 μm) generated by people and the presence of SARS-CoV-2, and thus suggested that PM2.5 could be a transport agent of SARS-CoV-2. Chia et al. 19 detected the virus in particles with a diameter between 1 and 4 μm. It seems that all particles with a diameter less than 5.0 could be a potential carrier of SARS-CoV-2, similar as the conclusion drawn by Fennelly, 20 that although the size range of infectious particles produced by people is quite wide, the pathogens were mainly found in small particles (diameter <5 μm).
To better understand the behaviour of exhaled particles and to predict the infection risk of pathogens, CO2 has been proposed as a surrogate of these particles, because both of them are ingredients of human breath and CO2 is relatively easy to measure. 21 In several previous studies, CO2 concentration has been used to predict the risk of airborne transmission.21–23 Most of these studies were based on theoretical deductions. For example, Hartmann and Kriegel 21 derived an equation to establish a relationship between CO2 and aerosol concentrations and thus calculated the aerosol concentration using the measured CO2 concentration. However, this relationship was established under several assumptions, for example, CO2 and aerosol concentrations were steady and well-mixed, which in practice is hardly achieved. 24 To avoid such assumptions, Rudnick and Milton 23 came up with a non-steady-state CO2-based risk equation, which resulted in a relationship between the CO2 concentration and the infection risk. They used the CO2 concentration, as a marker of exhaled breath, to calculate the rebreathe rate (the percentage of inhaled air that was exhaled by other people previously in the same space) which could be applied to indicate the risk of infection. Besides the theoretical calculation, computational fluid dynamics (CFD) modelling is another commonly used method to study the distribution of particles. 25 He et al. 26 predicted the transmission behaviour of particles with diameters of 0.8 μm, 5 μm and 16 μm as well as a tracer gas (as a surrogate for fine particles with diameters less than 1 μm) under different ventilation regimes using CFD simulations. They found a similar concentration distribution for tracer gas and particles with diameters of 0.8 μm and 5 μm. However, according to Wang et al., 27 uncertainties about the boundary conditions and transient models exist when applying CFD simulations and these uncertainties might cause errors. Thus, to get more precise results, a full-scale experiment is recommended. Bivolarova et al. 28 conducted a series of measurements in a test chamber with mixing ventilation to investigate the possibility of using tracer gas to simulate the behaviour of particles and concluded that behaviours of the tracer gas and fine particles were similar. However, in this study, only one unheated manikin was used instead of real people, as the source of particles and tracer gas. The complexity of the human body shape and the emission rate and concentration of the gas and particles generated by human breathing might lead to certain errors. Apart from that, most previous full-scale experiments were conducted under mechanical ventilation in the setting of a hospital room/office room/cabin,28–30 while natural ventilation (which is commonly used in school classrooms 6 ) in a classroom setting with real persons sitting inside has rarely been considered. As discussed in the recently issued ASHRAE Position Document on Indoor Carbon Dioxide, 31 using CO2 as the indicator of airborne infection risk transmission relies on many assumptions and might not be highly accurate. Therefore, to verify whether CO2 concentration can be used as a proxy for particle numbers (especially the smaller ones) in classrooms, a full-scale experiment under different ventilation regimes with real occupants is still required.
Considering all the above-mentioned research gaps, this study aimed to verify whether the CO2 concentration can be used as a proxy for the number of exhaled aerosols in a classroom setting. To answer this question, in this study, (1) the numbers of particles with different sizes both in different people’s breathing zone and in outdoor air were measured; (2) the distributions of particles with different sizes and CO2 concentration in a classroom setting under different ventilation regimes, were determined; and (3) possible relationships between CO2 concentration and the number of monitored particles with different sizes were tested.
Methods
Study design
Study design.
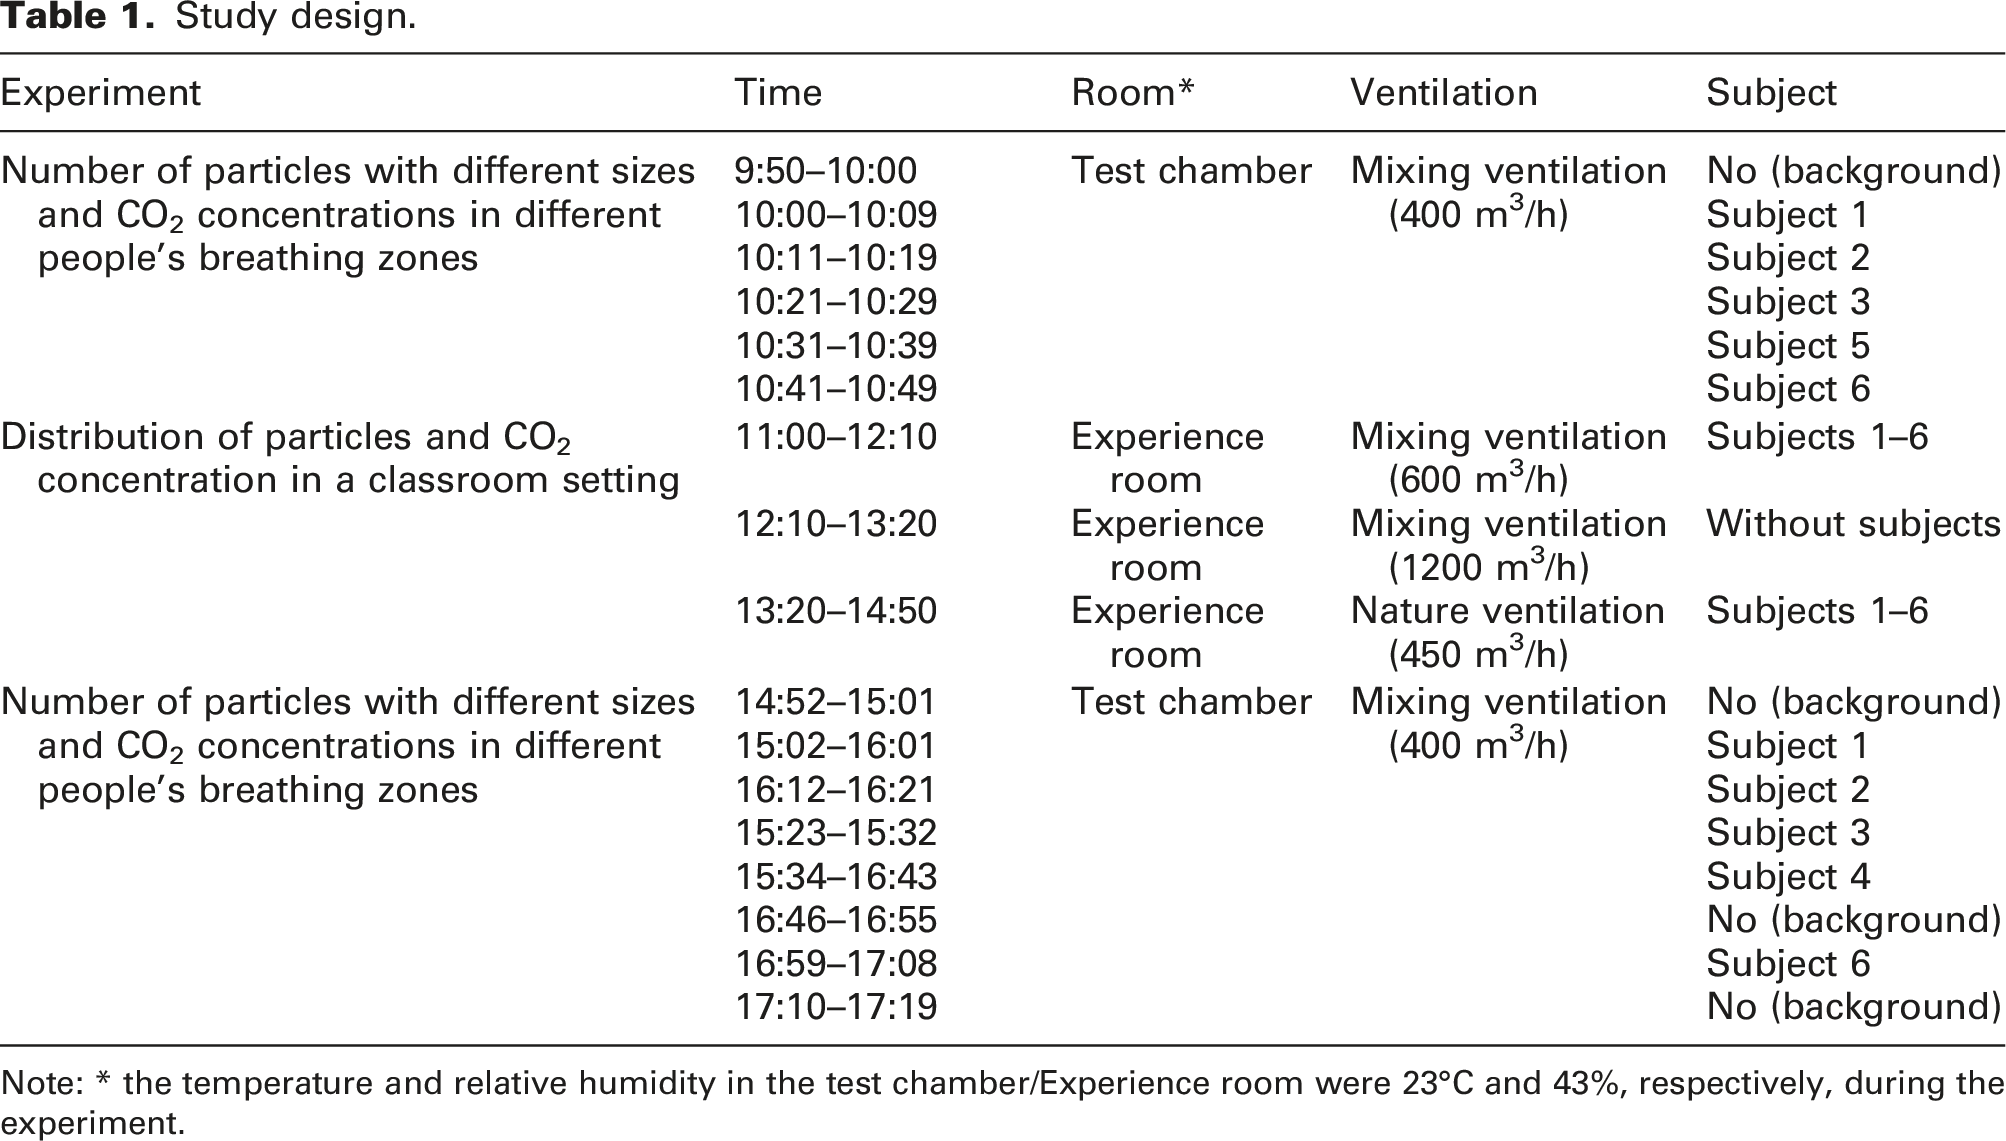
Note: * the temperature and relative humidity in the test chamber/Experience room were 23°C and 43%, respectively, during the experiment.
Particles and CO2 measured in different people’s breathing zone
The first experiment was performed in one of the test chambers of the SenseLab (width 2.4 m, length 3.9 m, height 2.1 m). Six subjects participated in this experiment, one after another. All subjects were employees of the Delft University of Technology and in good health. They were instructed to breathe normally towards a box (see Figure 1) where a particle counter (TROTEC PC220, proven to be a reliable instrument to investigate the concentration of aerosol particles
34
) was placed at 20 cm distance from the edge. This spot was selected to make sure the device was located directly in the exhaled air stream. Experimental set-up in the test chamber of the SenseLab.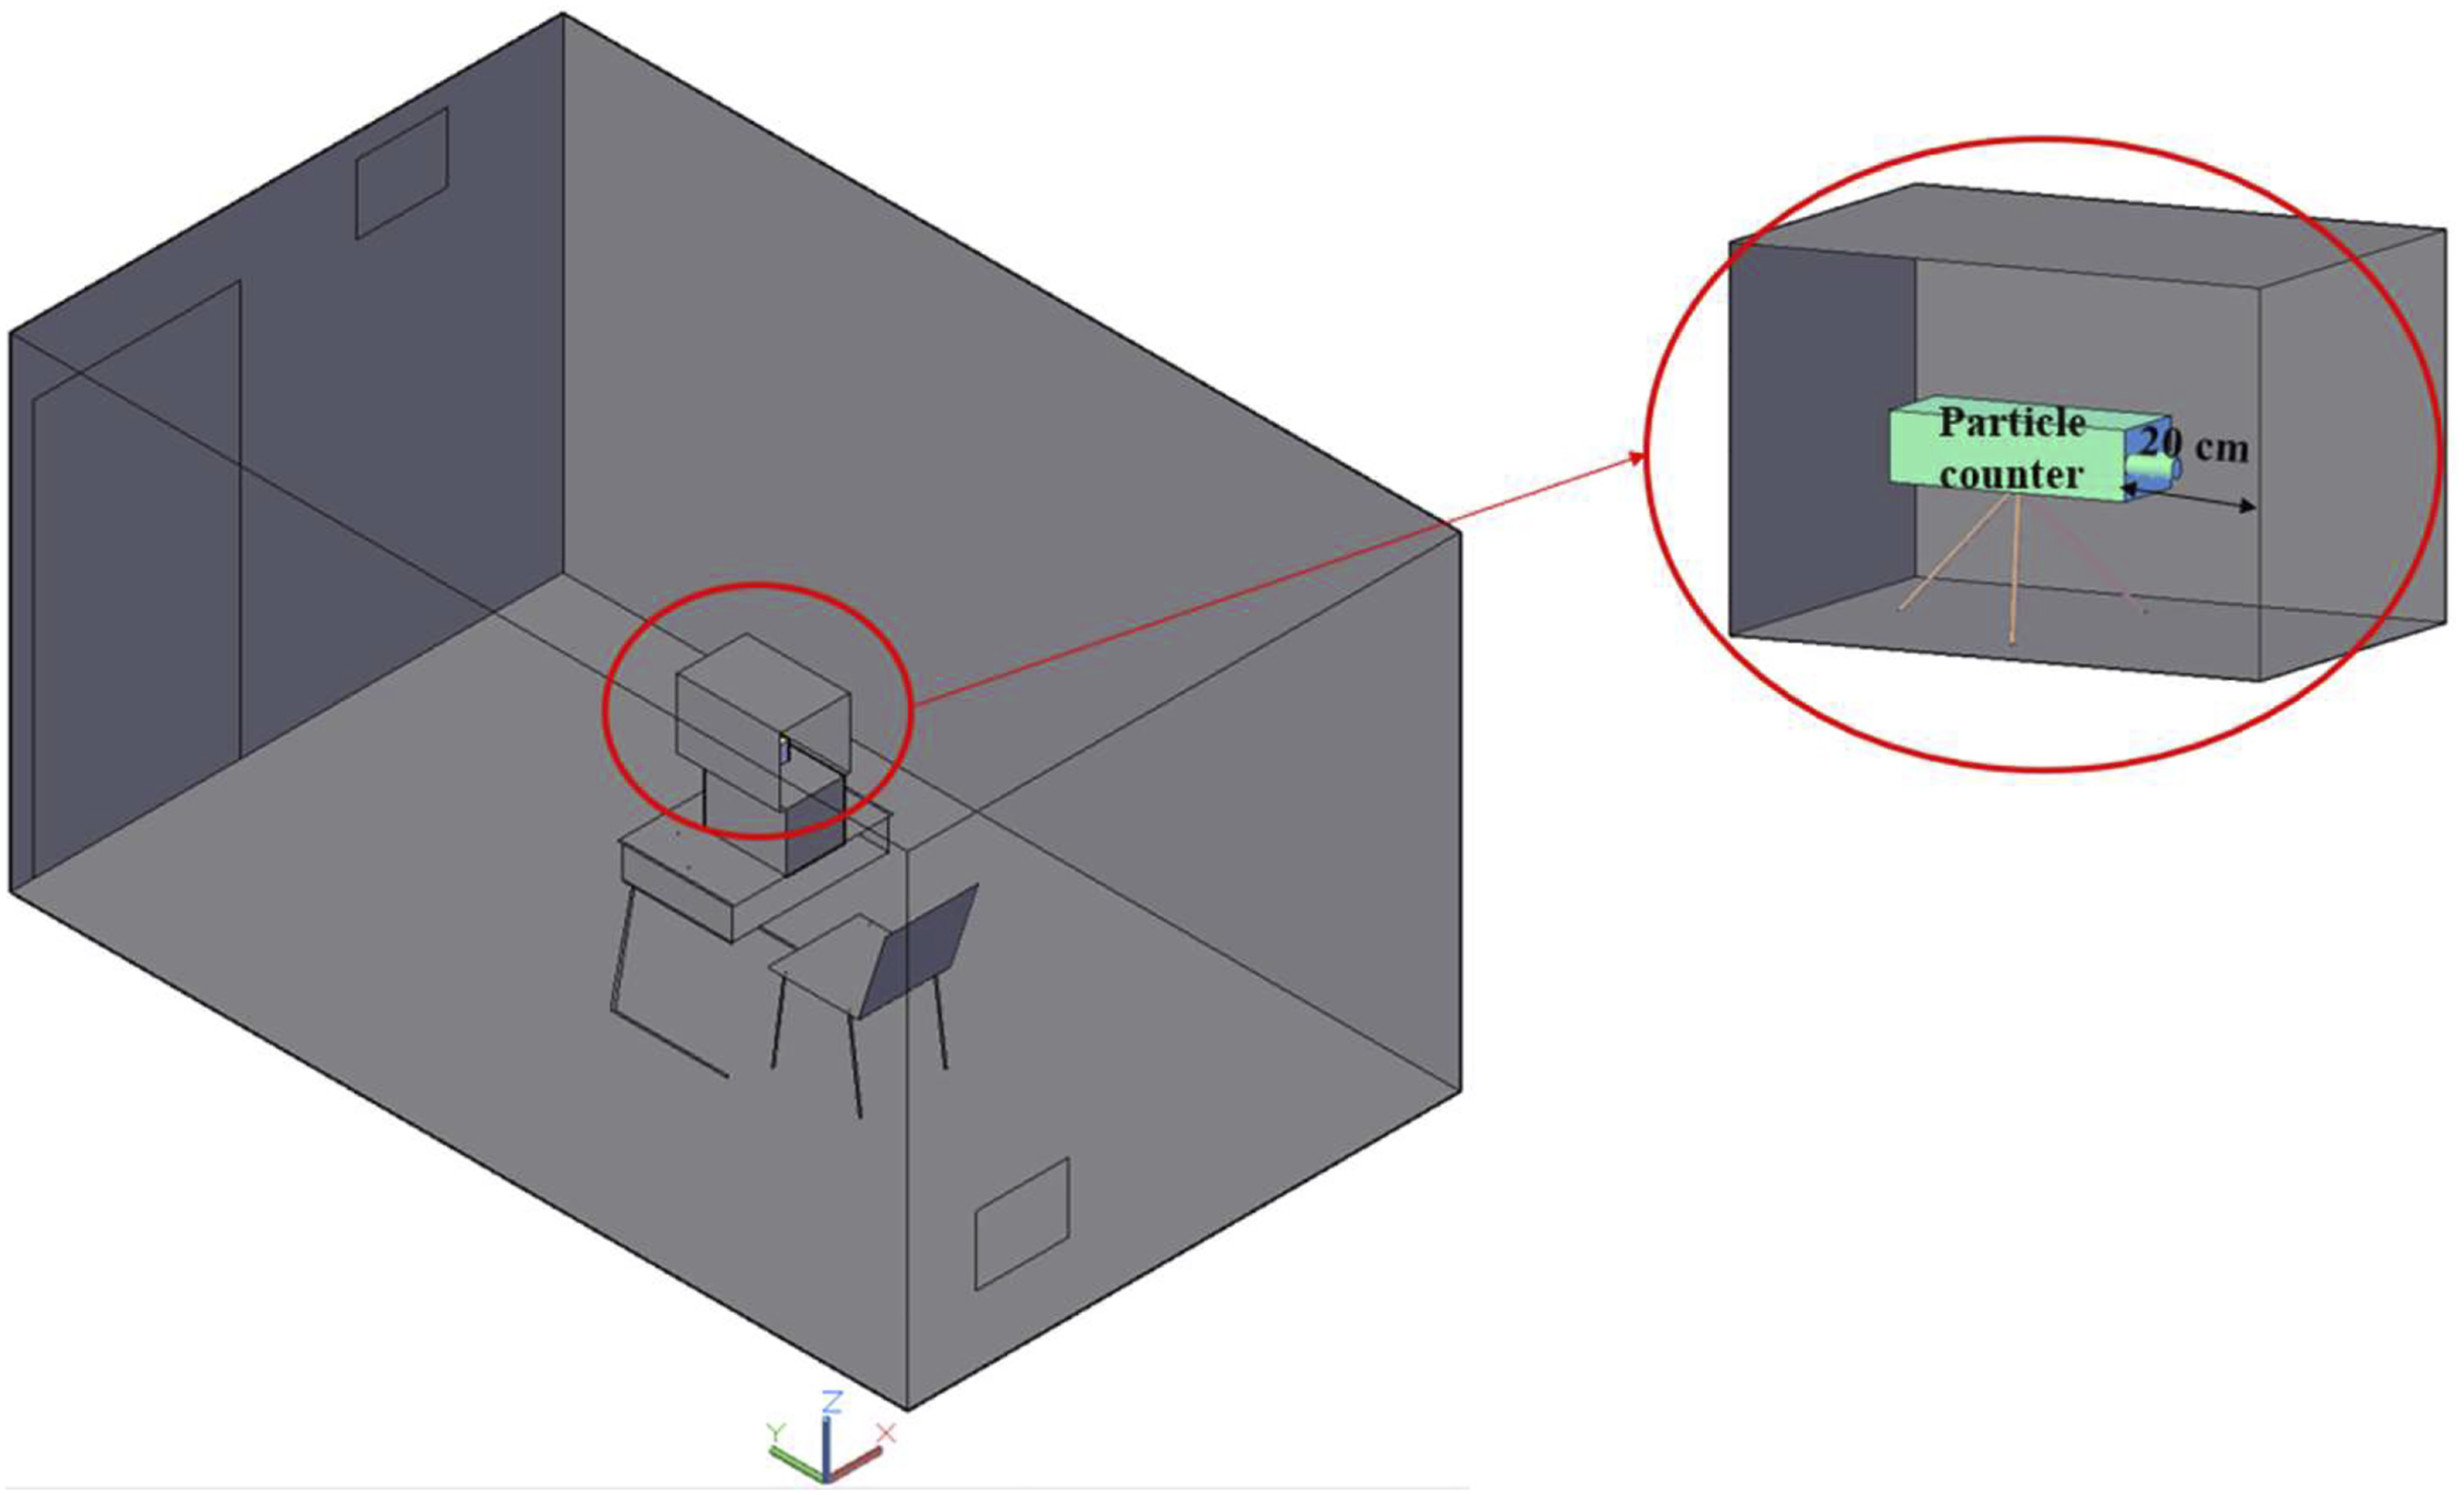
Only breathing was taken into consideration in this study because breathing occurs much more frequently than coughing or sneezing. The door was closed and only one subject was inside the chamber during the measurement. The measuring period was set at 10 minutes for each subject, and both devices measured and recorded the data once per minute. The particle counter has six size channels (10 to 5.0 μm, 5.0 to 2.5 μm, 2.5 to 1.0 μm, 1.0 to 0.5 μm, 0.5 to 0.3 μm and below 0.3 μm) with a counting efficiency of 50% for the 0.3 μm channel and 100% for particles in all the other channels. The measurement ranges for the six channels (from largest to the smallest sizes) are 0–340, 1–966, 0–2724, 0–41,600, 0–175,000 and 0–500,000, respectively. The working principle of the particle counter is light scattering which measures both liquid and solid particles. 35 This device was manually calibrated before the experiments.
This experiment was conducted twice, in the morning and in the afternoon, for each subject, with the exception of subject 4 who did not participate in the morning, and subject 5 who did not participate in the afternoon. Apart from the indoor measurements, the number of particles was measured outdoors (without subjects) with the same device and the same time interval and duration.
Particles and CO2 distribution in a classroom setting
The second experiment was performed with six subjects sitting in the Experience room of the SenseLab (width 4.2 m, length 6.5 m, height 2.6 m) with 1.5 m between each other, shown by the six chairs in Figure 2. The Experience room, located on the ground floor, has two openable windows (0.6 × 1.0 m; facing north) and one interior door (1.0 × 2.7 m; connected to the entrance hall of the SenseLab). The layout of it was similar to a classroom. Six measurement points were selected in the room (numbers ‘1’–‘6’ in Figure 2) with a distance of 20–30 cm from the mouth of each subject. The measurements were conducted at each point for 10 minutes, with a time interval of 1 minute. The particle counter used was the same as in the first experiment, next to which, a CO2 logger (HOBO® MX1102) was placed to monitor the CO2 concentration, temperature (T) and relative humidity (RH). The HOBO had an accuracy of ±50 ppm in the range of 0–5000 ppm for CO2 concentration, an accuracy of ±0.2°C in the range of 0–50°C for T, and an accuracy of ±2% in the range of 1–70% for RH. Because only one set of devices was available, the measurements at the different points were conducted after each other. Because natural ventilation and mixing ventilation are the most commonly used ventilation regimes in Dutch school classrooms,
36
to keep a healthy experimental environment during the COVID-19 pandemic, and to meet the ventilation rate required by ASHRAE,
37
‘600 m3/h mixing ventilation (with 100% outdoor air)’ and ‘natural ventilation with both windows and door open (with a ventilation rate of approximately 450 m3/h)’ were selected as the ventilation regimes when subjects were sitting inside the Experience room. Additionally, between these two tested conditions, to clean the Experience room from particles and CO2 generated by the subjects, 1200 m3/h mixing ventilation was applied when no subjects were inside the room (see Table 1). Experimental set-up in the Experience room of the SenseLab. Notes: 1.1–6 represent six measurement points; 2. During the experiment, subjects 1–6 were sitting on the six chairs next to the points 1–6, correspondingly.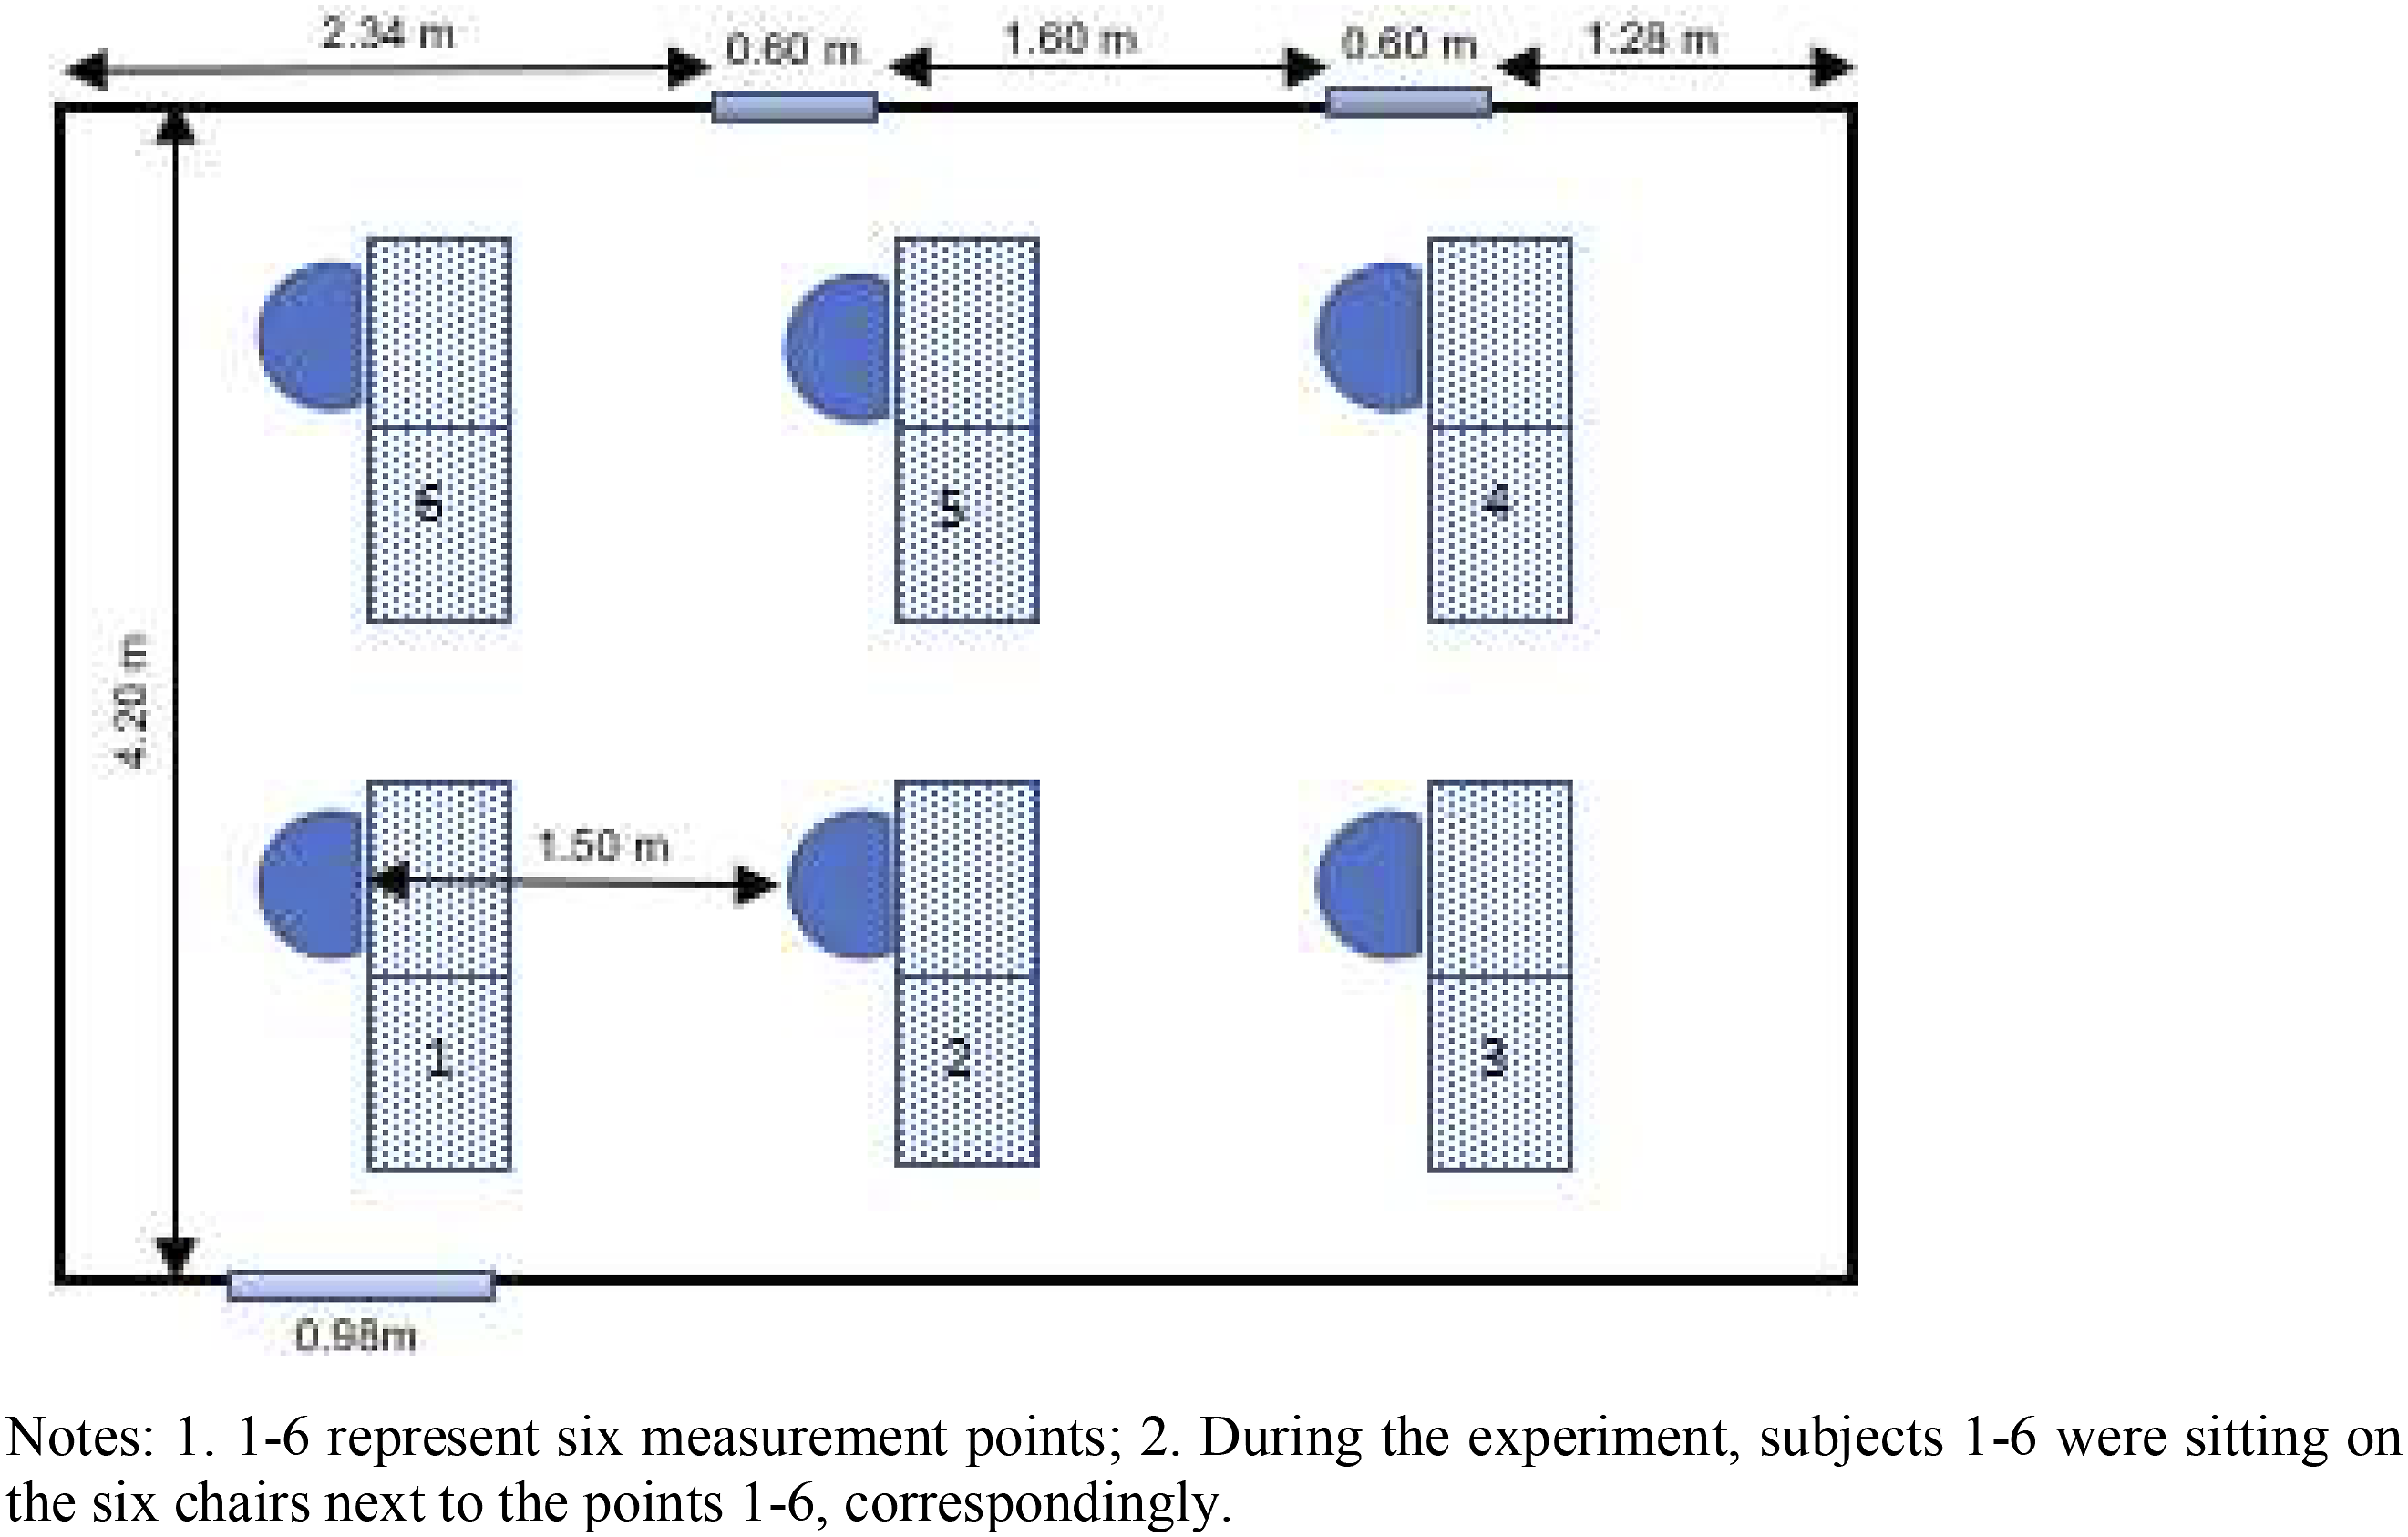
Data analysis
All collected data were imported and analysed in four steps using SPSS version 26.0 (SPSS Inc. Chicago, IL, USA). For the data collected from people’s breathing zones in the test chamber, a four-step statistical analysis was performed. First, the basic information (e.g. the mean and standard deviation of these parameters) was analysed with descriptive analysis, and normal distributions of all the parameters (particle numbers at different frictions) were checked using both Kolmogorov–Smirnov test and Shapiro–Wilk test. 38 Second, the difference in the number of particles measured in the breathing zone between two time periods was compared for each subject with paired samples t-tests.39,40 Then, the differences between different subjects were compared with one-way ANOVA. 40 Finally, to compare the difference between the tests with and without subjects, all results measured in the subjects’ breathing zones were compared with the results measured in the situation without subject, using paired samples t-tests. 40
For the experiment conducted in the Experience room, similarly, at the beginning, the basic information (e.g. the mean and standard deviation of the measured number of particles and CO2 concentration) was analysed, and normal distributions of all the parameters (particle numbers, CO2 concentrations, T and RH) were checked using both Kolmogorov–Smirnov test and Shapiro–Wilk test under different experimental conditions. 38 Then, the differences in the number of particles between the six locations were compared using independent one-way ANOVA. After that, differences in the number of particles between every two of the three conditions were compared with paired samples t-tests. Finally, the relationships between all measured parameters (number of particles, CO2 concentration, T and RH) were tested using Pearson correlations. 39
Ethical aspects
The subjects were asked to give informed consent to participate in the experiment. They were able to leave the test chamber/Experience room at any time in the case they were not feeling comfortable.
Results
Particles measured in different people’s breathing zone
Figure 3 shows the average particle numbers measured in the subjects’ breathing zones for 10 minutes. Results are shown in six fractions: 10 to 5 μm, 5 to 2.5 μm, 2.5 to 1.0 μm, 1.0 to 0.5 μm, 0.5 to 0.3 μm and below 0.3 μm. Similar size distributions of particles were found in all subjects’ breathing zones. The majority was always the particles with diameter less than 0.3 μm, namely, PM0.3, and the numbers of particles decreased with an increase in their sizes. Average numbers of particles measured per fraction in different settings: (a) morning indoors; (b) afternoon indoors; (c) morning indoors versus outdoors; (d) afternoon indoors versus outdoors.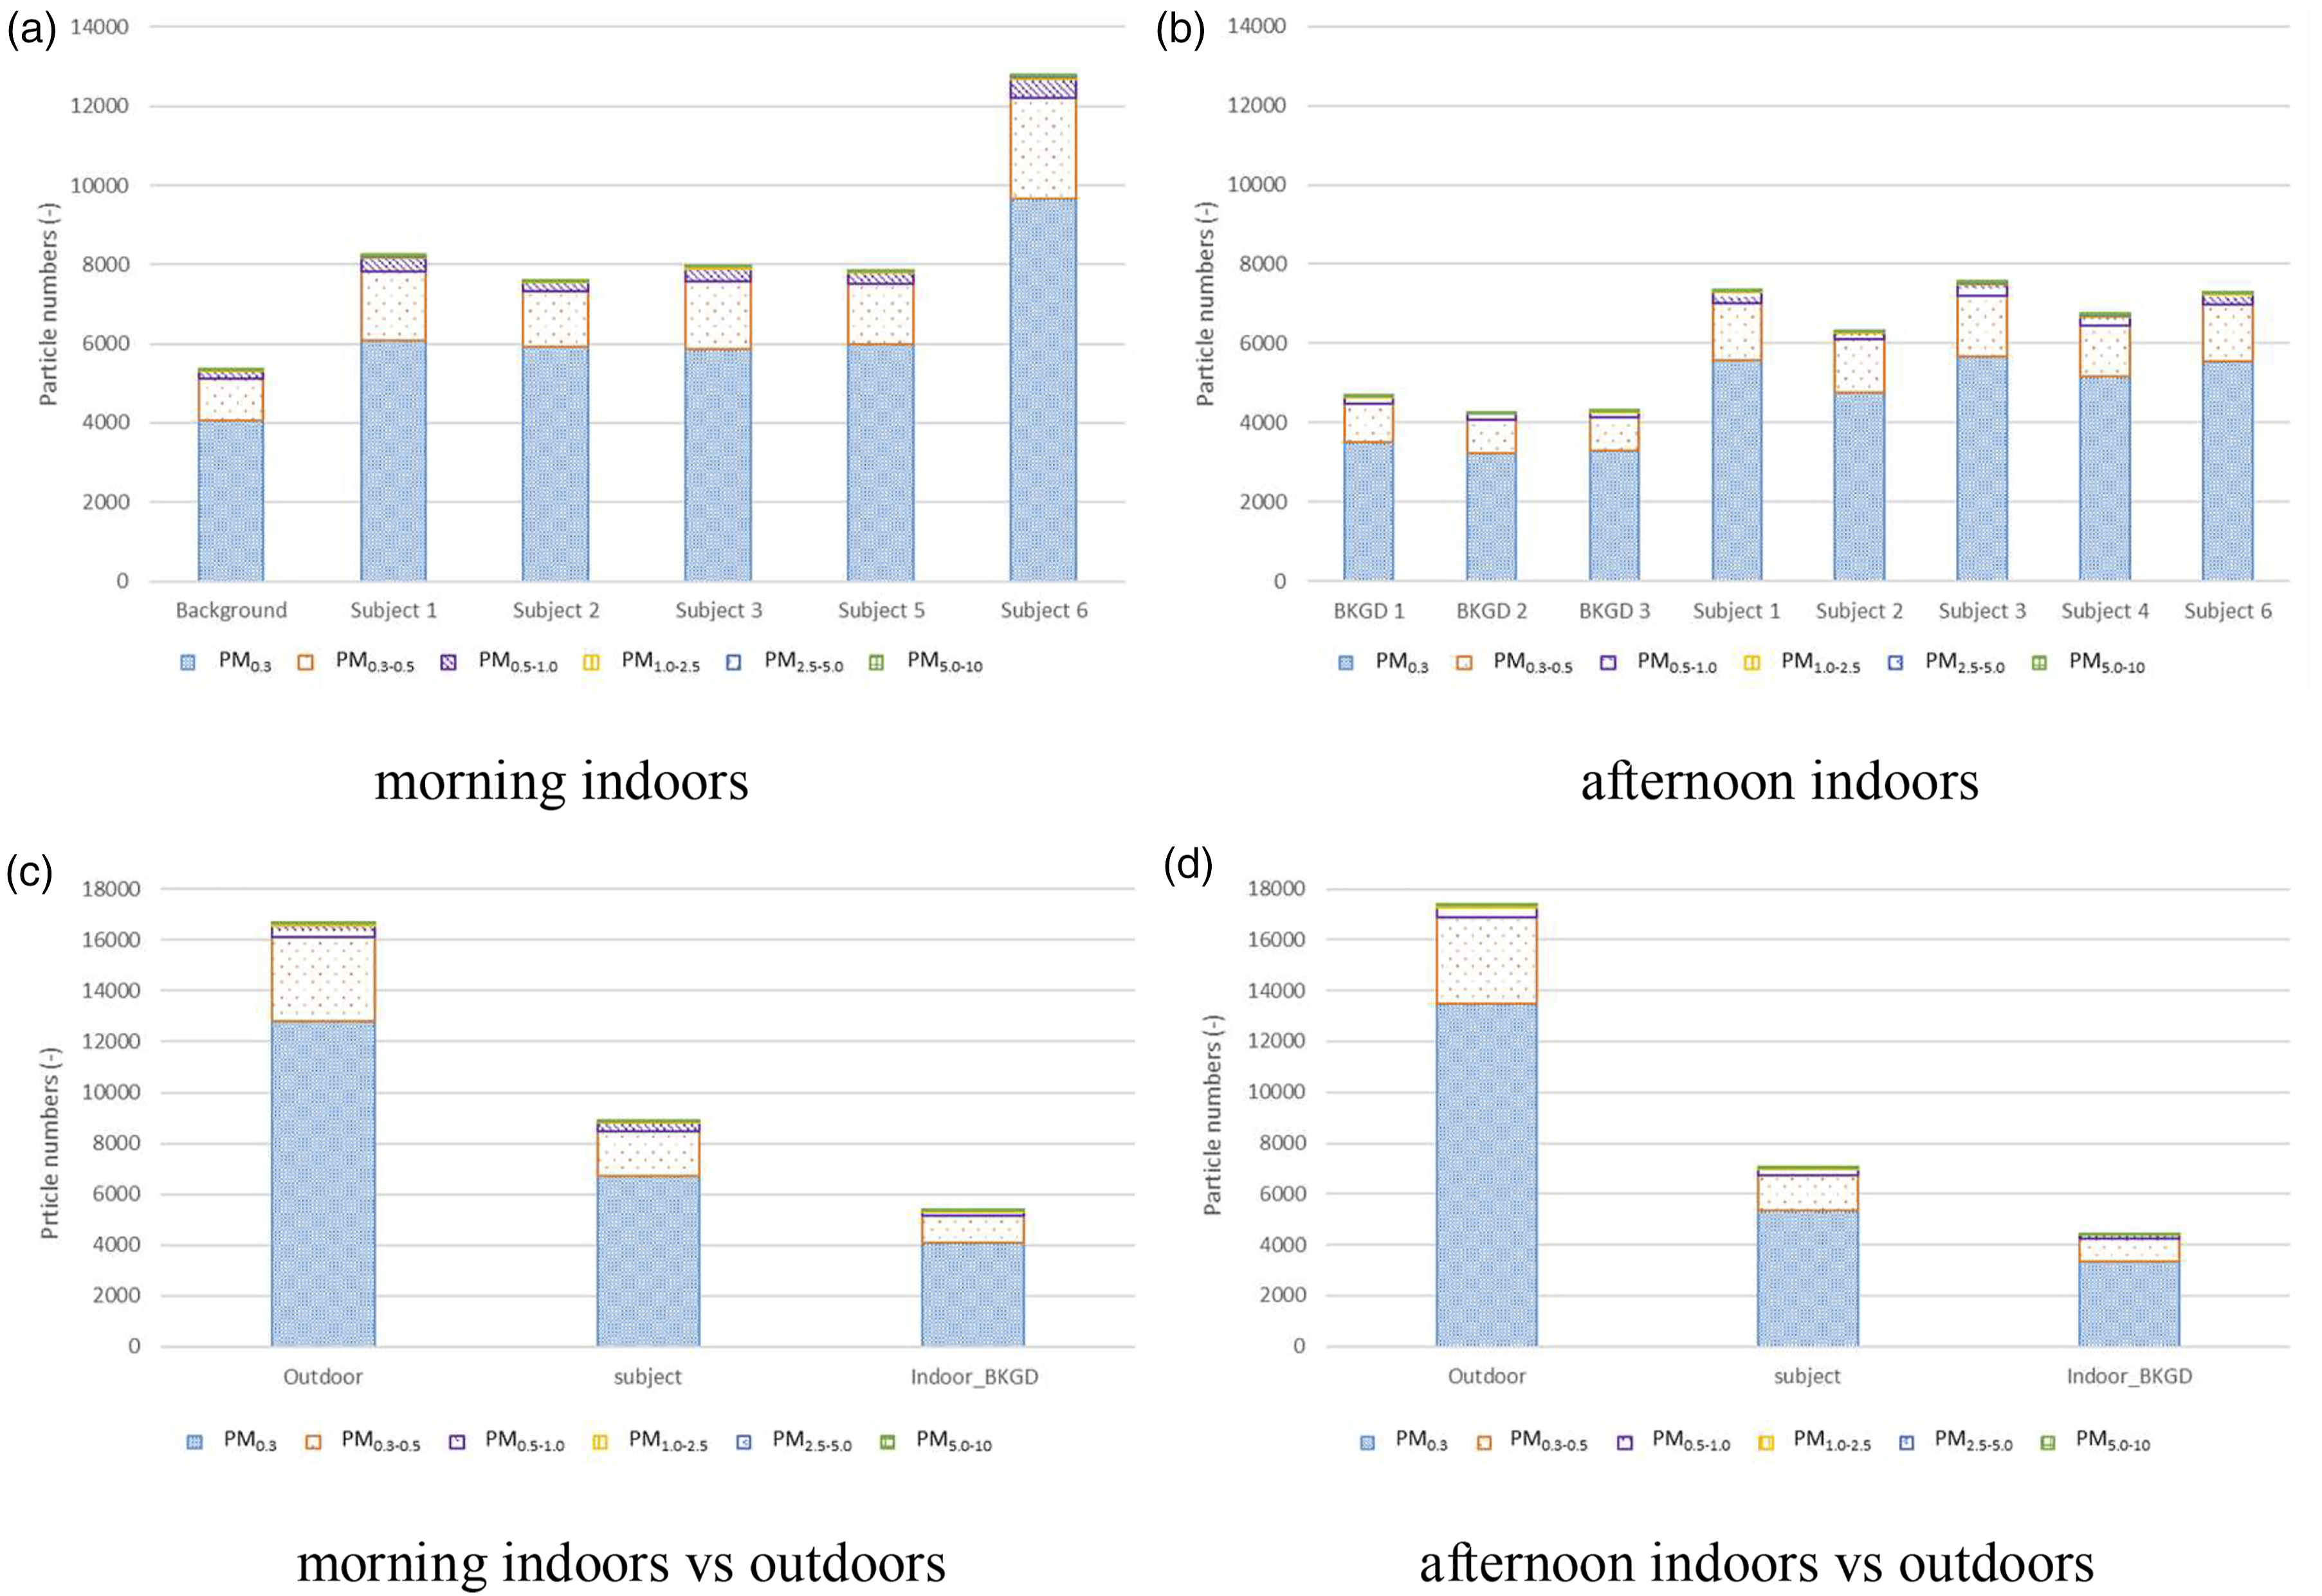
Generally speaking, the numbers of particles measured in the subjects’ breathing zones were much higher than in the indoor background (see Figure 3(a) and (b)), and the average numbers of particles outdoors were much higher than indoors, with or without subjects (see Figure 3(c) and (d)).
Differences in particles in a person’s breathing zone between morning and afternoon
Differences of the number of particles per subject and per fraction between morning and afternoon.
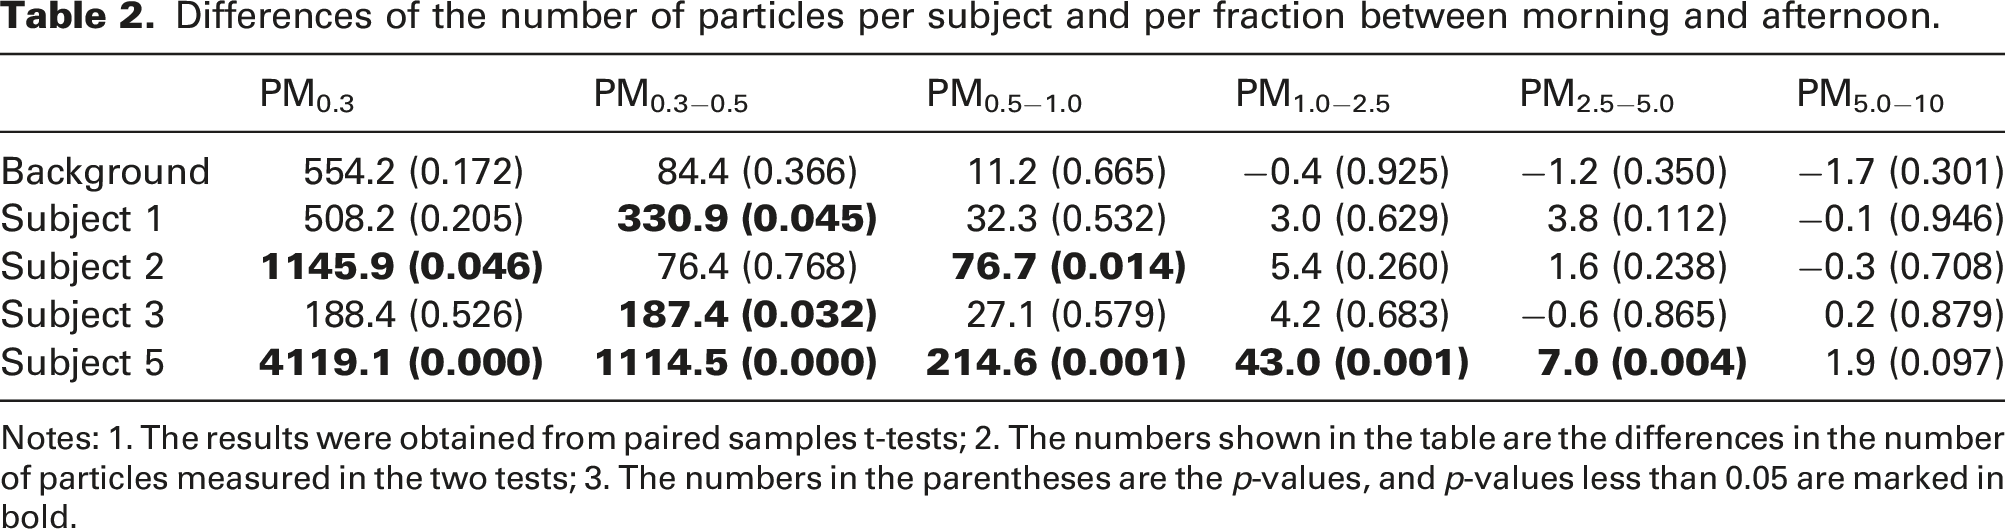
Notes: 1. The results were obtained from paired samples t-tests; 2. The numbers shown in the table are the differences in the number of particles measured in the two tests; 3. The numbers in the parentheses are the p-values, and p-values less than 0.05 are marked in bold.
Differences in the number of particles between different subject
Average number of particles measured in subjects’ breathing zone in the morning and in the afternoon.
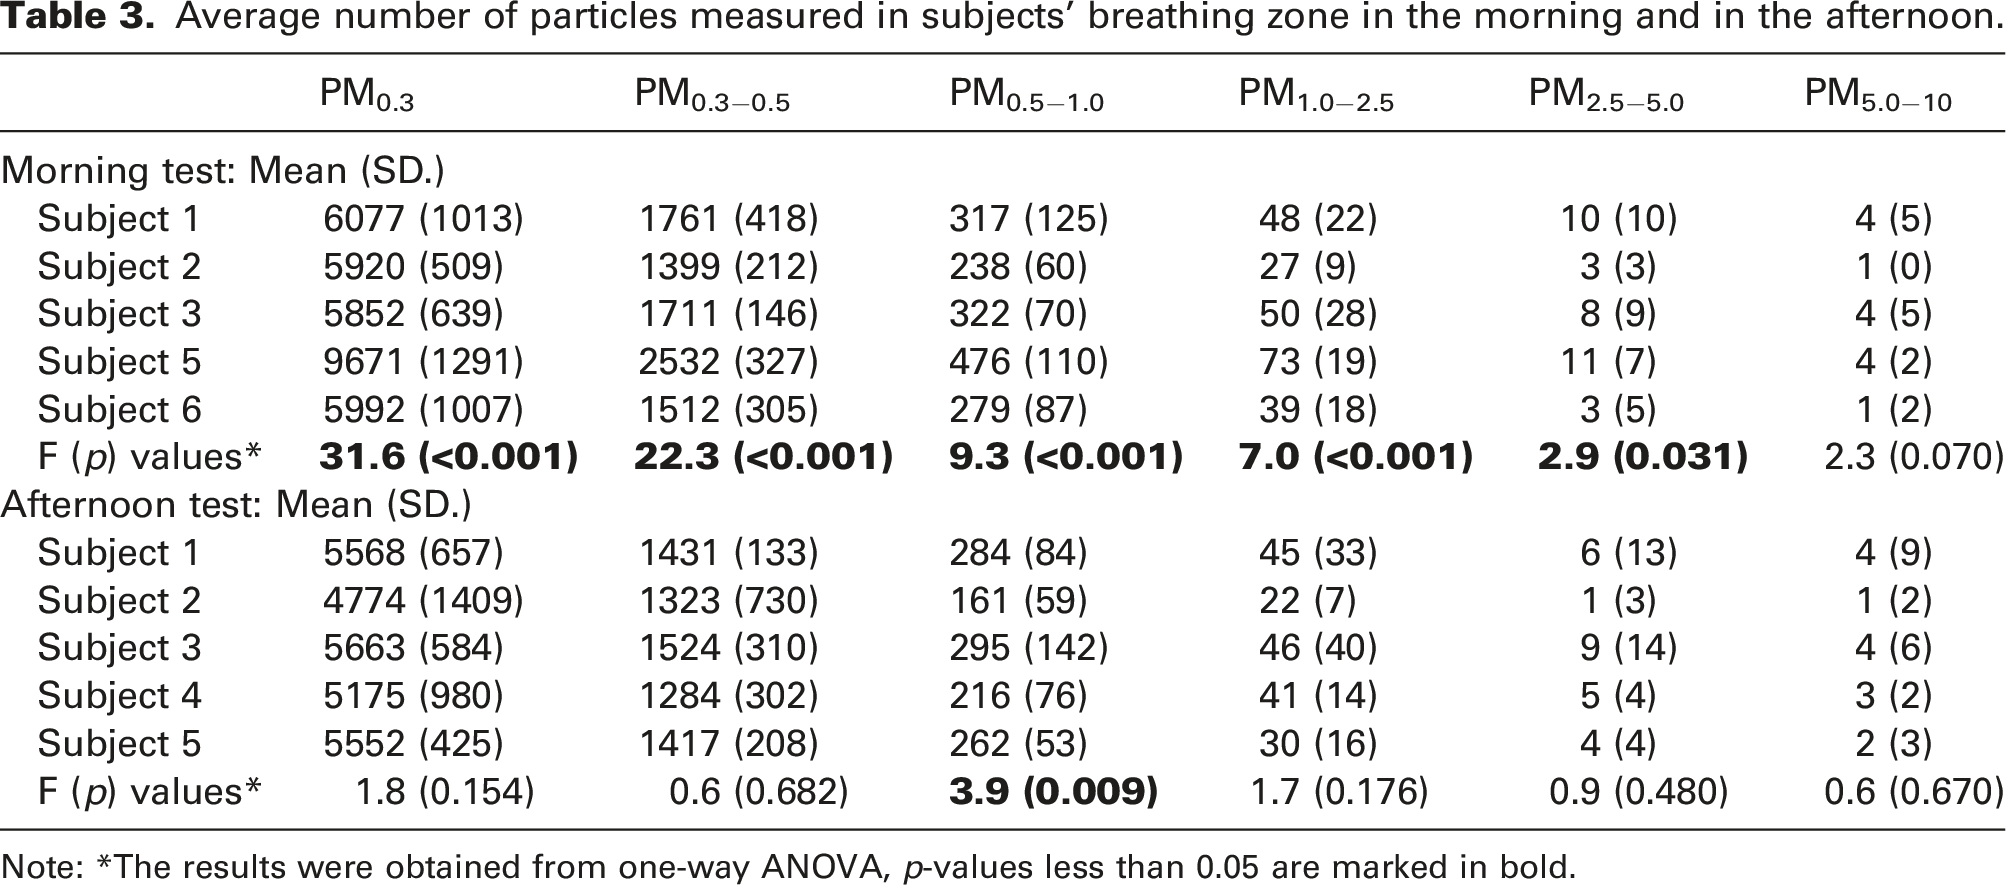
Note: *The results were obtained from one-way ANOVA, p-values less than 0.05 are marked in bold.
Differences in the number of particles between situations with and without subjects
Differences of the number of particles between the situations with and without subjects.
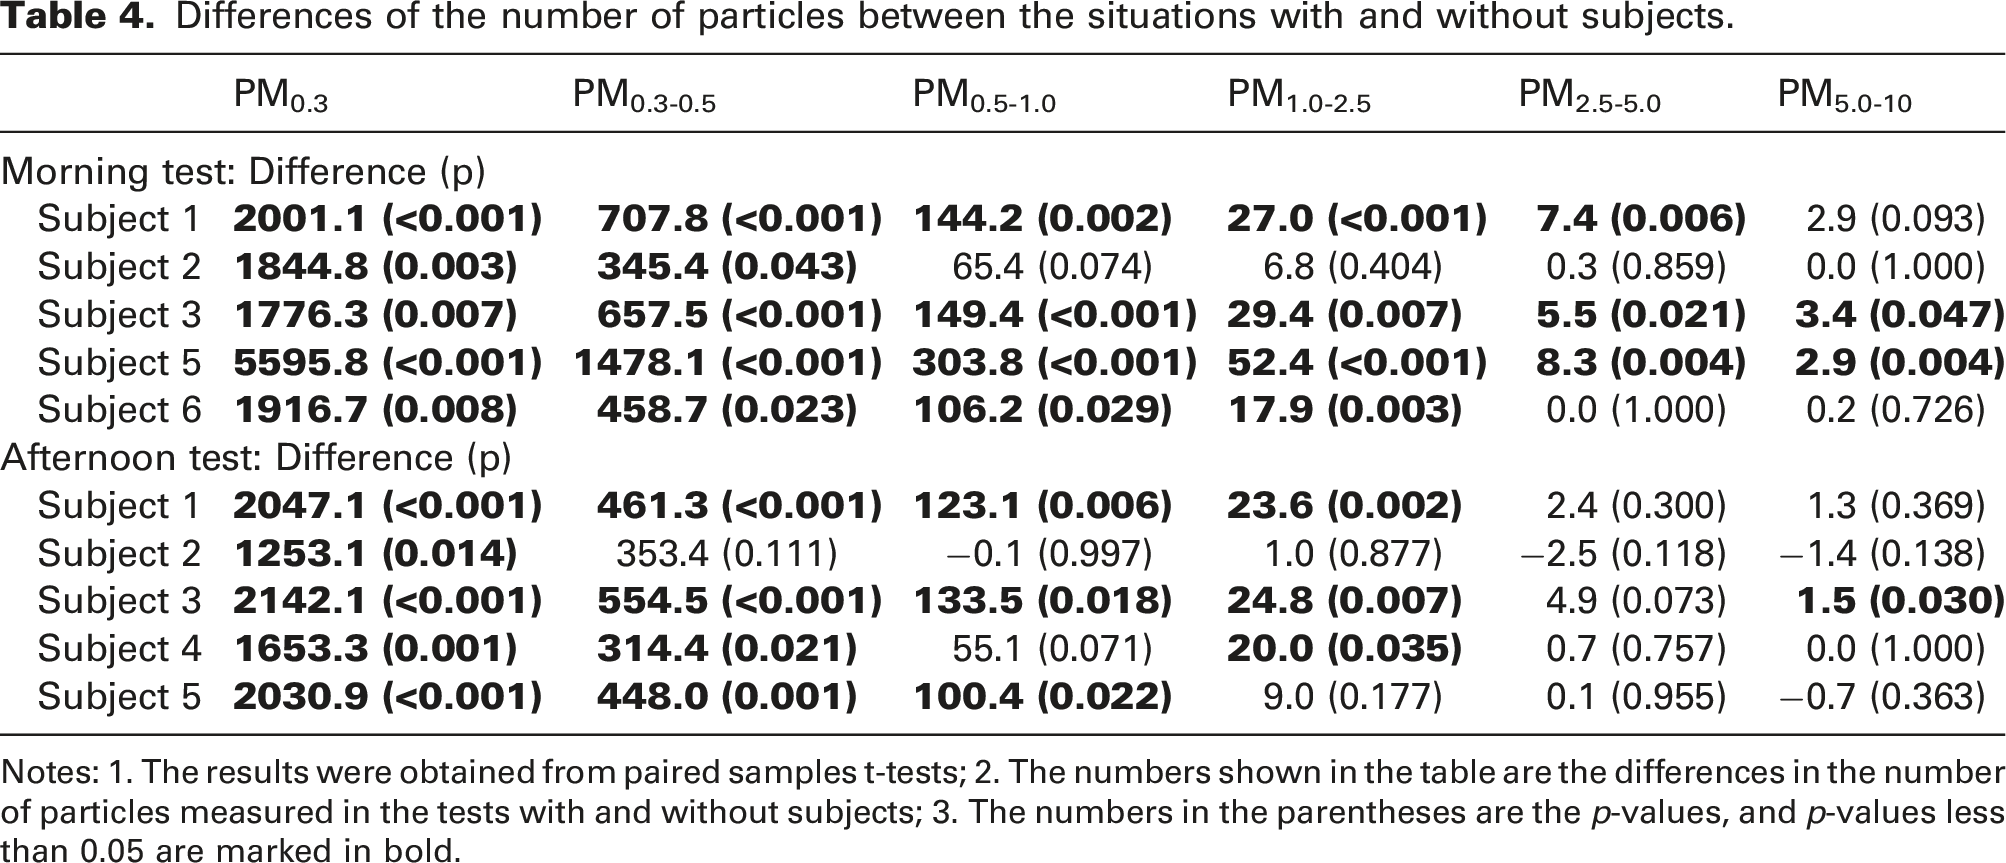
Notes: 1. The results were obtained from paired samples t-tests; 2. The numbers shown in the table are the differences in the number of particles measured in the tests with and without subjects; 3. The numbers in the parentheses are the p-values, and p-values less than 0.05 are marked in bold.
Number of particles and CO2 concentration in a classroom setting
Figure 4 illustrates the distribution of particles and CO2 concentrations in the Experience room for different ventilation regimes. Different colours represent different ventilation regimes, and the diameter of bubbles represents the number of particles or the CO2 concentration (ppm), in logarithmic scales, measured at each point. The average (and standard deviation) number of particles or the average (and standard deviation) CO2 concentration was noted next to each bubble. As shown in these figures, the numbers of particles under the condition ‘1200 m3/h mixing ventilation without subjects’ were similar as the result measured in the test chamber without subjects. However, when there were subjects present, the number of particles measured in the Experience room was larger than the number of particles measured in the box in the test chamber. Moreover, the differences were much more obvious for the smaller particles (PM0.3 and PM0.3-0.5). For example, the number of PM0.3 was around 3600 in the Experience room, while it was around 2000 in the box in the test chamber. Particles and CO2 distributions in a classroom setting under different conditions: (a) PM0.3; (b) PM0.3-0.5; (c) PM0.5-1.0; (d) PM1.0-2.5; (e) PM2.5-5.0; (f) PM5.0-10; (g) CO2. Notes: 1. Red bubbles show the results of ‘natural ventilation with subjects’; green bubbles show the results of ‘600 m3/h mixing ventilation with subjects’; grey bubbles show the results of ‘1200 m3/h mixing ventilation without subjects’. 2. The diameter of bubbles represents the number of particles/CO2 concentration at logarithmic scales, and in Figures (e) and (f), these numbers were further enlarged five times to make these bubbles visible.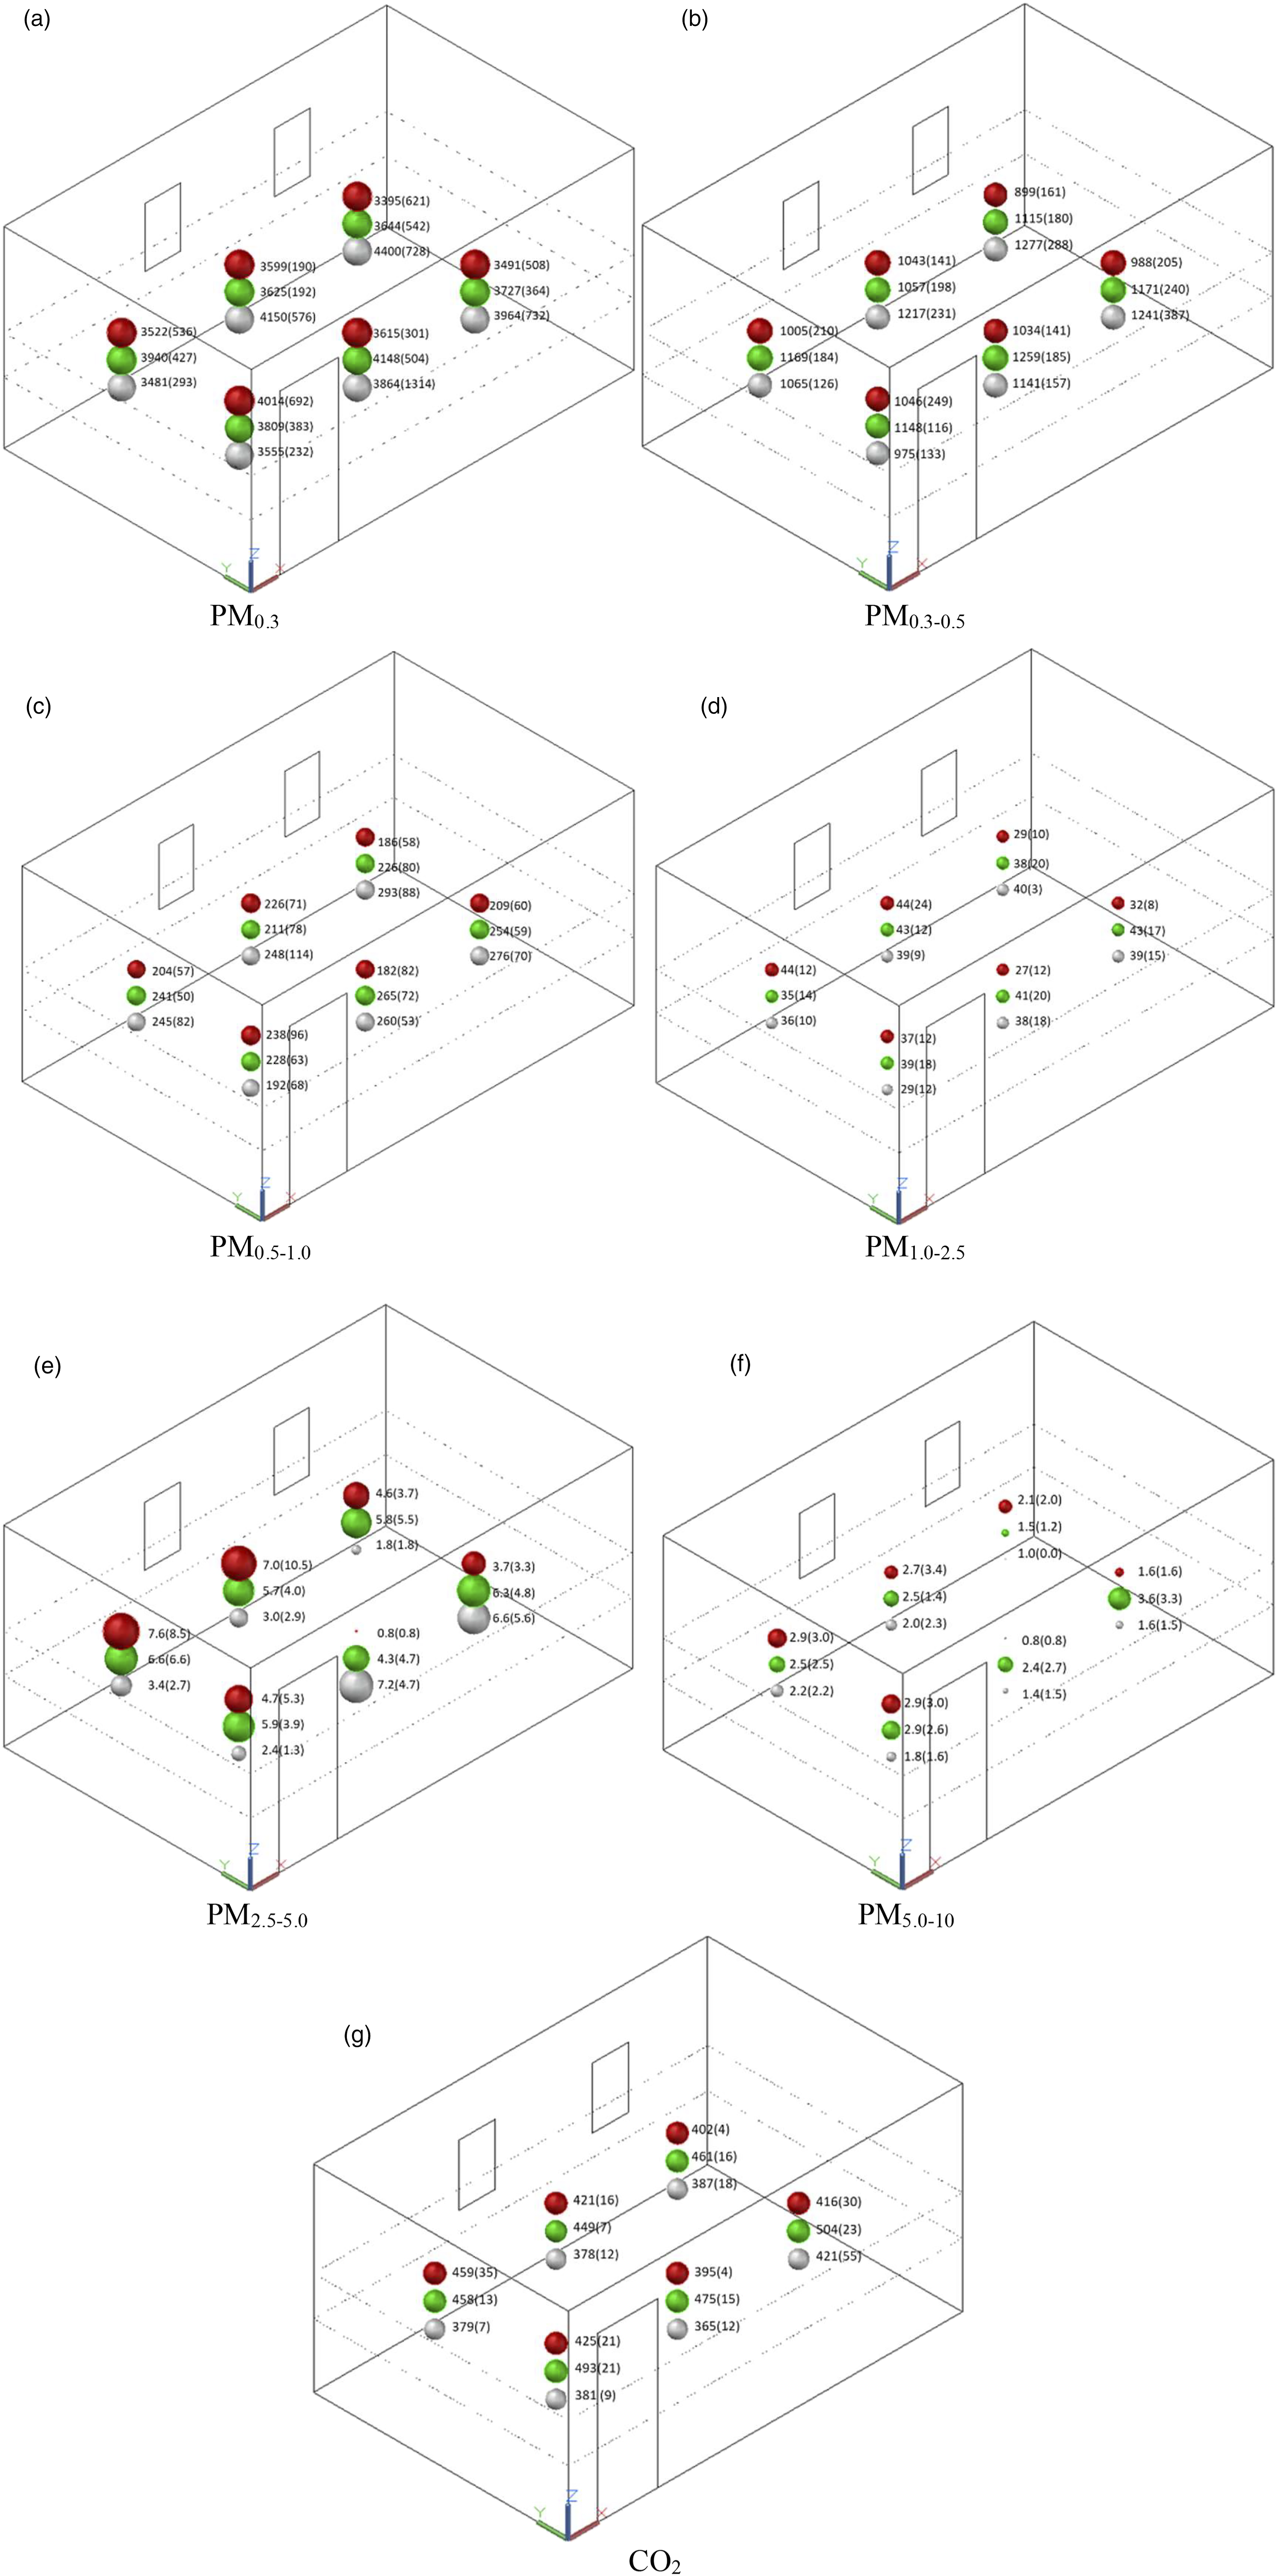
Results obtained from one-way ANOVA to show the difference of the number of particles between six locations for different ventilation regimes.
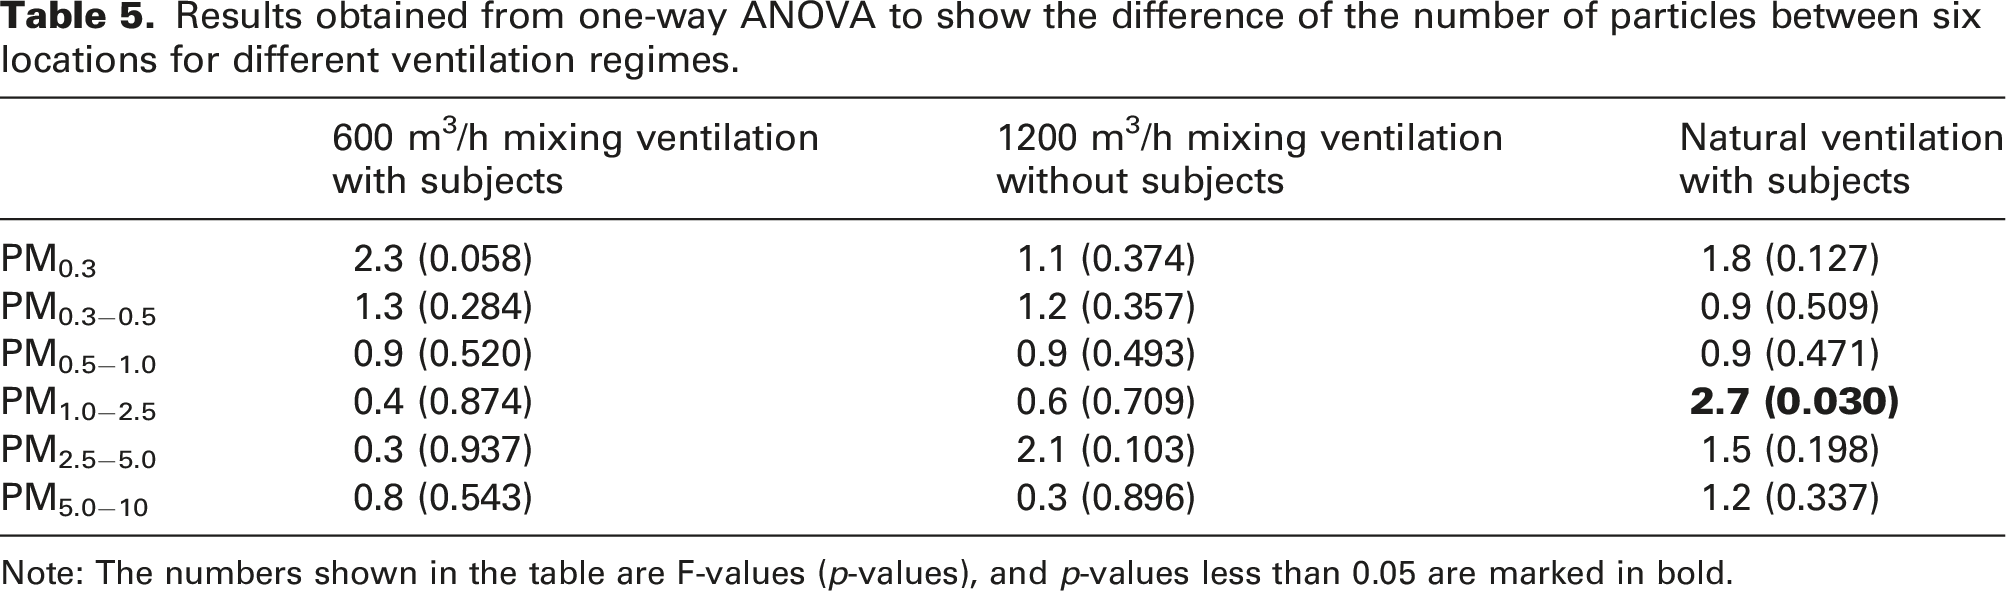
Note: The numbers shown in the table are F-values (p-values), and p-values less than 0.05 are marked in bold.
Comparison of the number of particles and CO2 concentration between different conditions
Results of pairwise comparison between the three tested conditions.
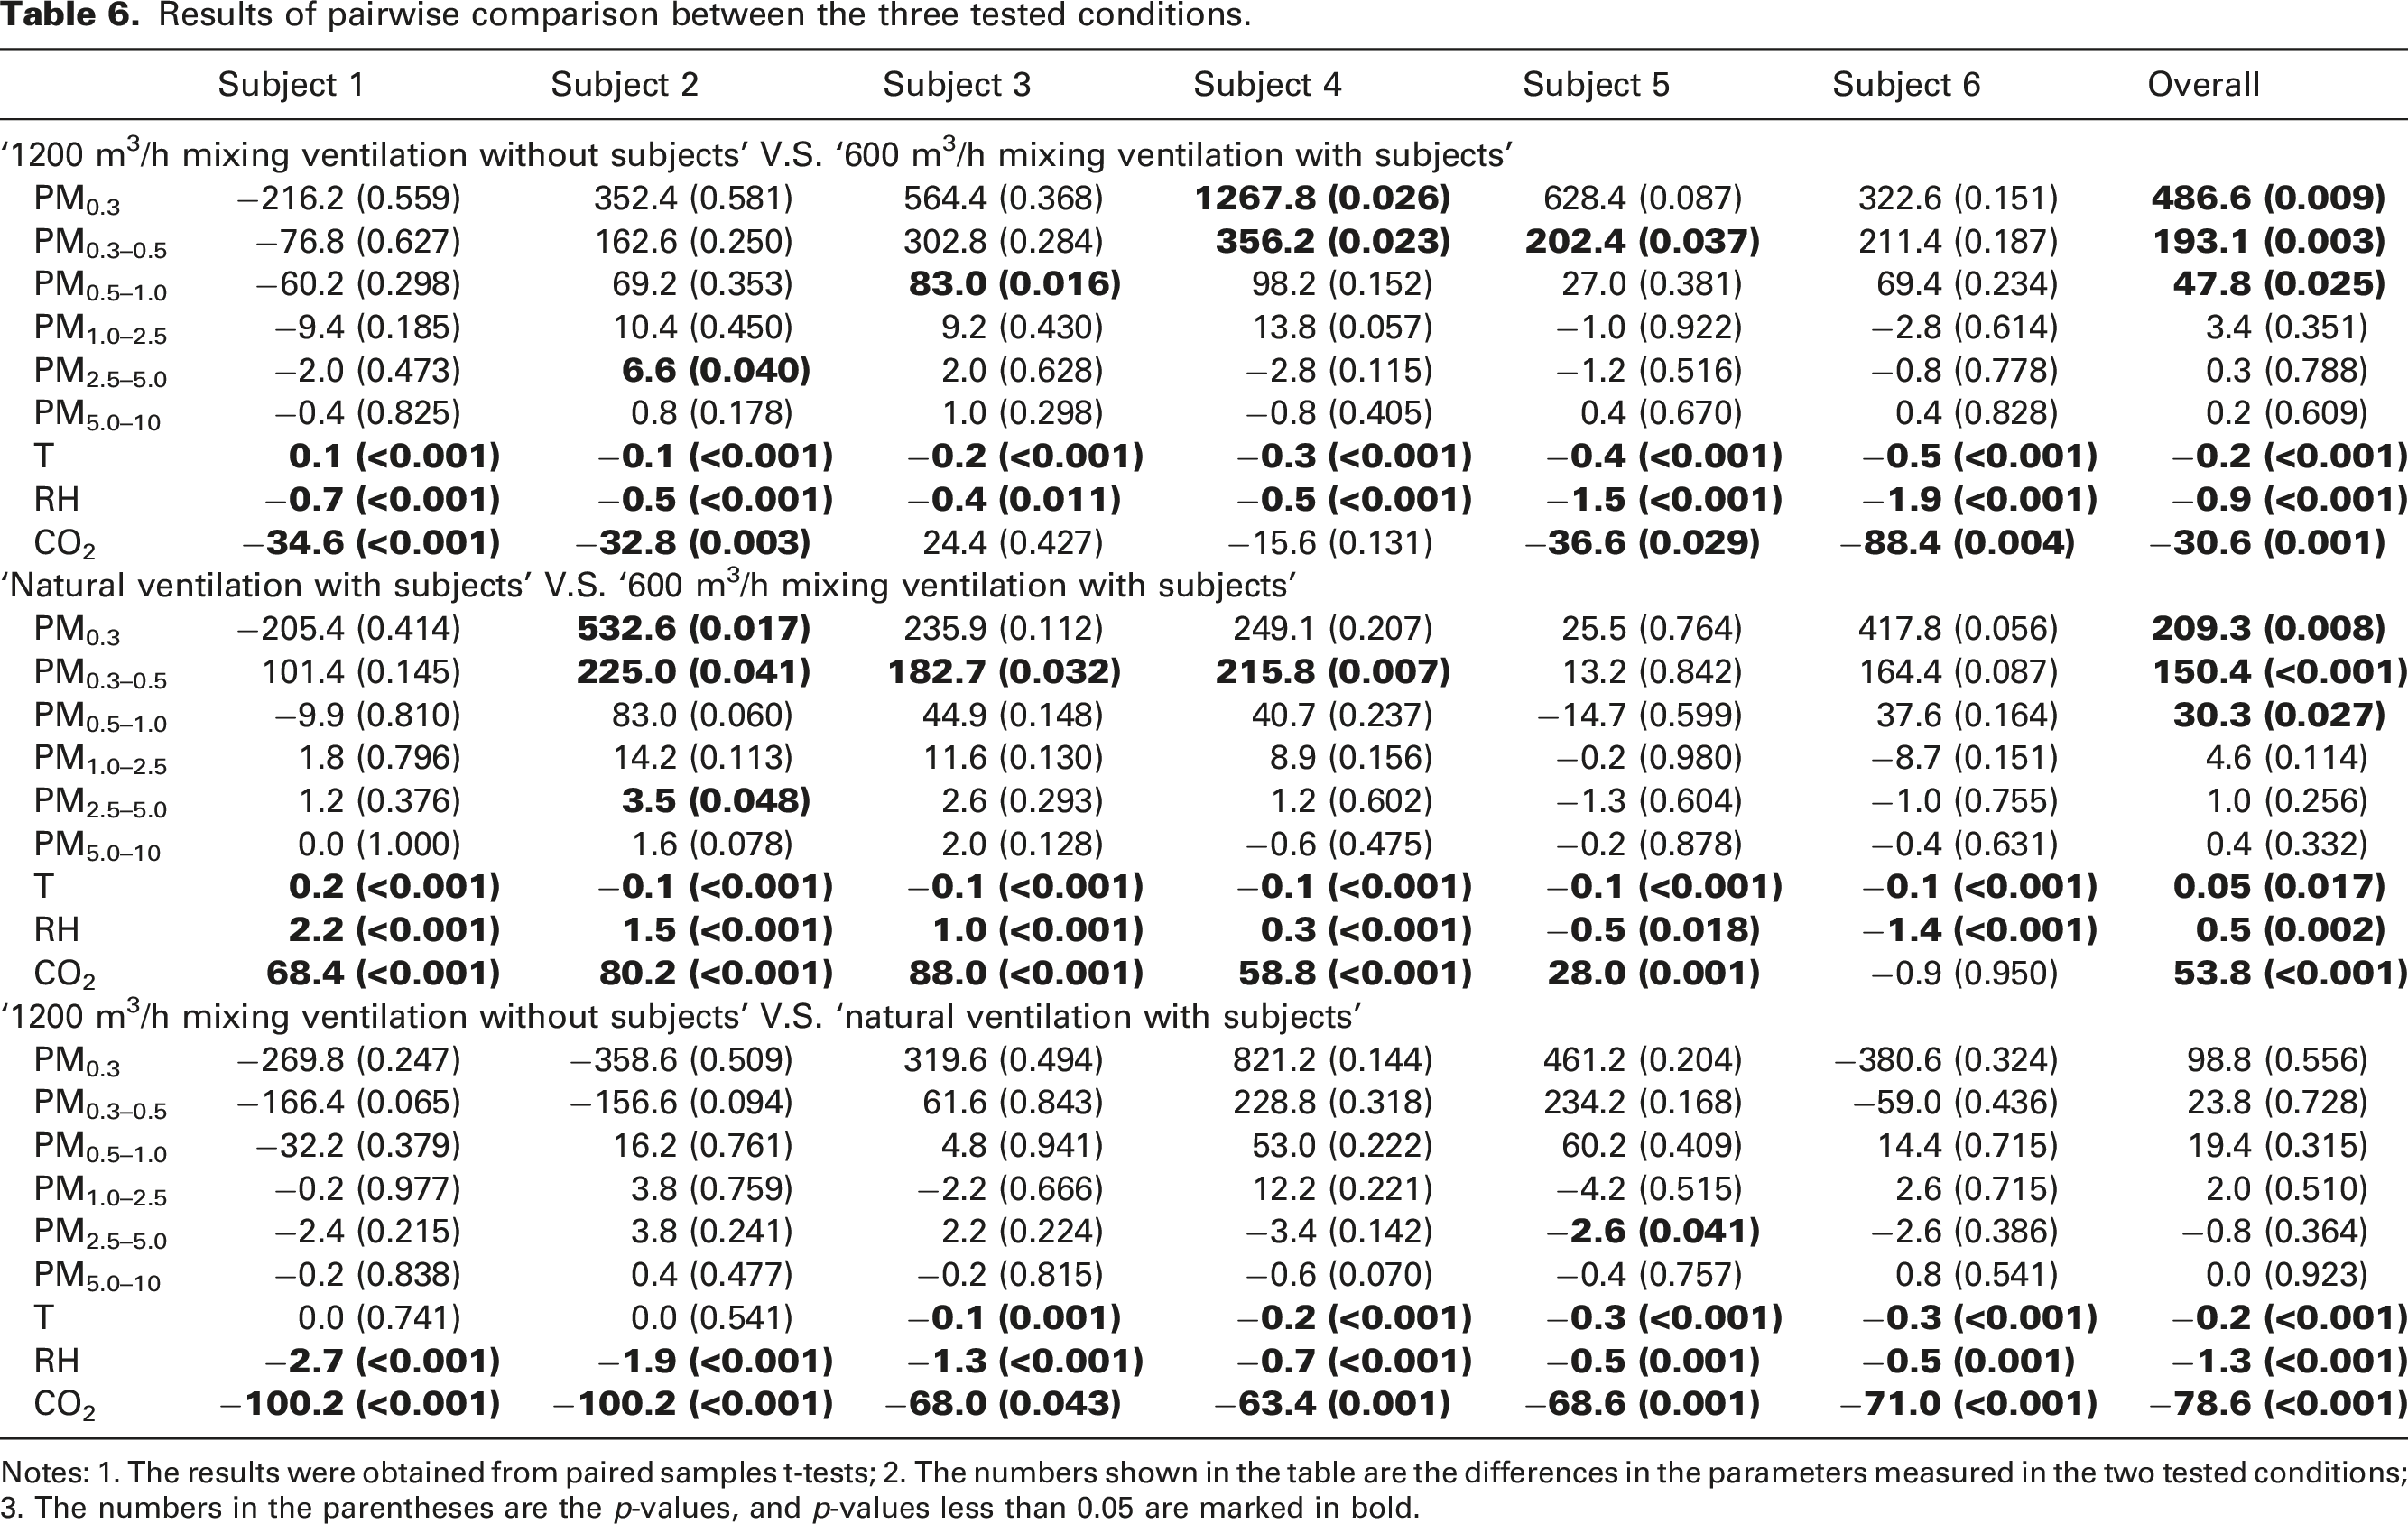
Notes: 1. The results were obtained from paired samples t-tests; 2. The numbers shown in the table are the differences in the parameters measured in the two tested conditions; 3. The numbers in the parentheses are the p-values, and p-values less than 0.05 are marked in bold.
The overall comparison results between the conditions ‘1200 m3/h mixing ventilation without subjects’ and ‘600 m3/h mixing ventilation with subjects’, show that after the subjects left the room and the ventilation rate was increased, the numbers of particles with diameters less than 1.0 μm (i.e. PM0.3, PM0.3-0.5 and PM0.5-1.0) increased significantly. However, according to the comparison results conducted for the individual locations, the differences were only significant at a few locations. For the comparison between the conditions ‘Natural ventilation with subjects’ and ‘600 m3/h mixing ventilation with subjects’, after the ventilation regime was changed from mechanical to natural ventilation, significant increases were also observed in the numbers of PM0.3, PM0.3-0.5 and PM0.5-1.0, and the differences were also only significant at a few locations. While for the comparison between the conditions ‘1200 m3/h mixing ventilation without subjects’ and ‘Natural ventilation with subjects’, after the ventilation regime was changed from mechanical to natural ventilation and after the subjects entered the room, no significant changes in the number of particles occurred.
Relationships between the number of particles and CO2 concentration under different conditions
Relationships between the number of particles and CO2 concentration.
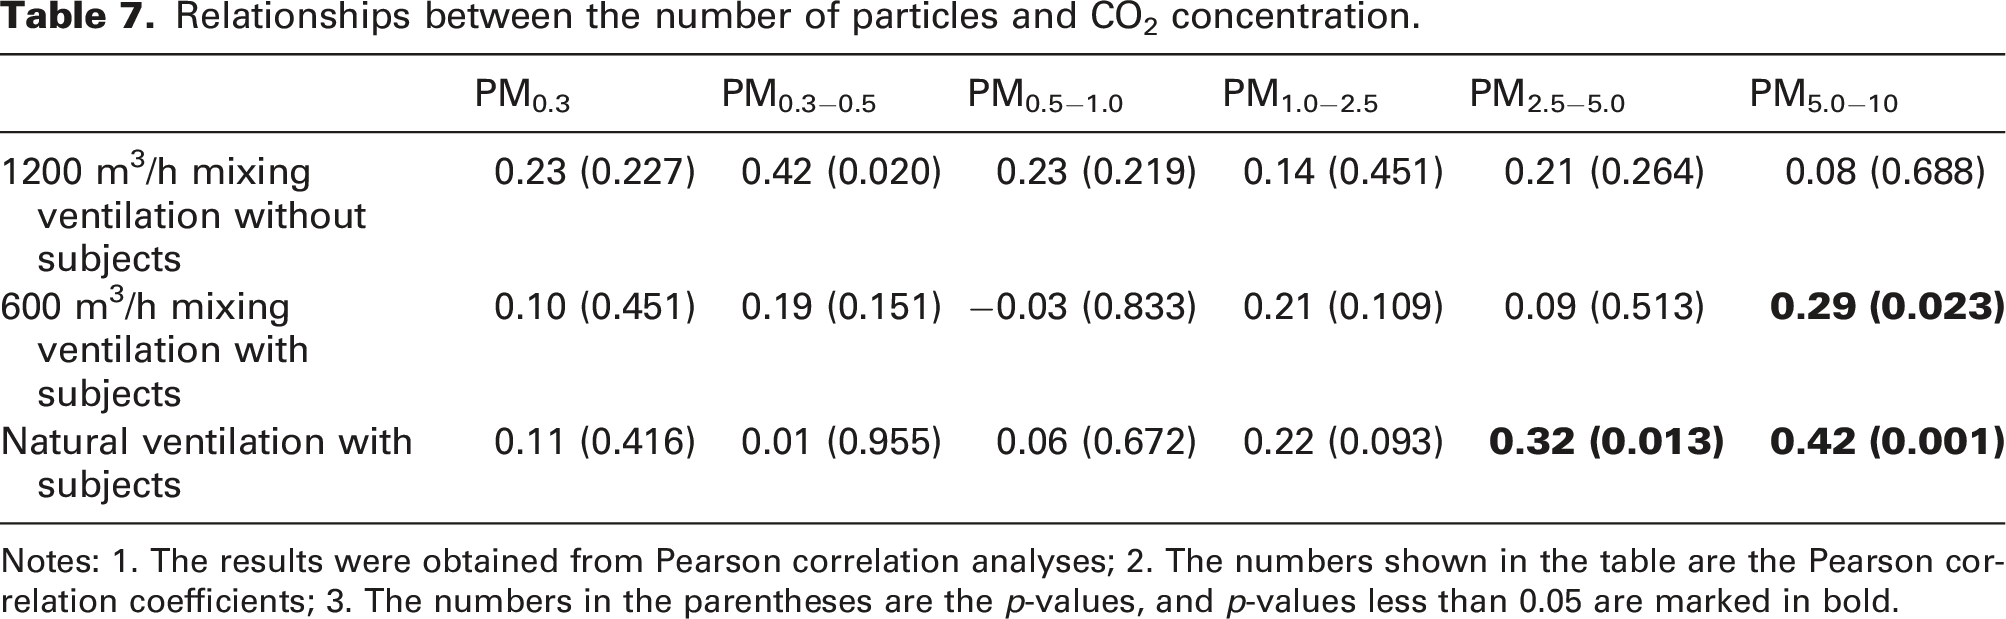
Notes: 1. The results were obtained from Pearson correlation analyses; 2. The numbers shown in the table are the Pearson correlation coefficients; 3. The numbers in the parentheses are the p-values, and p-values less than 0.05 are marked in bold.
Discussion
Number of particles measured in different people’s breathing zone
The comparisons presented in Table 3 showed almost no differences in the number of particles between different subjects’ breathing zones, except for one subject in the morning test. More particles were measured in this subject’s breathing zone than for the other subjects in the morning, while such difference was not observed in the afternoon. This might have been caused by the breakfast this subject ate before the experiment which was a hot meal and contained several kinds of herbs and spices. Since all the subjects had the same lunch, there was no difference caused by the food in the afternoon.
Although differences in the number of exhaled particles between different people have been found before, those differences were explained by the different collecting and measuring methods20,43 or health status. 44 Since only one measurement method and one device were used in this study, all the subjects were healthy and their body mass indexes were similar, therefore, it makes sense that almost no significant differences in the number of exhaled particles were measured between these subjects in the current study.
According to the outdoor measurement results, the concentration of outdoor fine particles was more than twice as much as those in the subjects’ breathing zones, which also confirmed the findings of previous studies that outdoor particles are the main source of indoor particles.45–47 On the contrary, the main part of the indoor CO2 concentration was produced by humans through breathing (the CO2 concentration in the exhaled breath can be 100 times higher than the outdoor level 48 ) and therefore, it can be used to decide the maximum room occupancy. 49 The different exhalation/outdoor concentration ratios between particles and CO2 make it difficult to use the CO2 concentration as a proxy for the number of exhaled particles.
Number of particles and CO2 concentration in a classroom setting
As shown in Table 6, compared with ‘600 m3/h mixing ventilation with subjects’, the number of small particles (particles with diameters less than 1 μm) was increased significantly in the condition of ‘1200 m3/h mixing ventilation without subjects’. This might be explained by the fact that particles came through the ventilation ducts, so, the higher the ventilation rate, the more particles were detected. The ventilation system used in the SenseLab has F7 filters which can filter more than 65% of PM2.5, but it cannot effectively filter out particles smaller than 1 μm. Regarding the comparison between conditions ‘600 m3/h mixing ventilation with subjects’ and ‘Natural ventilation with subjects’ (in which the subjects were the same, the only difference was that the ventilation changed from mechanical to natural), numbers of small particles also increased significantly. This might indicate that the numbers of small particles directly coming through windows were larger than those coming through ventilation ducts when the ventilation rate was relatively low (600 m3/h). For the comparison between ‘1200 m3/h mixing ventilation without subjects’ and ‘Natural ventilation with subjects’, no significant difference between the particle numbers was found. One possible explanation is that the number of particles directly coming from outside (through the windows) plus those generated by subjects equals the numbers of particles coming through the ventilation ducts when the ventilation rate was relatively high (1200 m3/h). All of these characteristics of indoor particles were quite different from CO2 which was significantly lower in the condition without subjects than in the condition with subjects, and also significantly lower with mechanical ventilation than with natural ventilation. These results indicate that most indoor particles measured in this study originated from outdoors (either through windows or through ventilation ducts). Therefore, the higher the ventilation rate the more particles (especially the small ones) were monitored in the room, which was the reverse for the CO2 concentration.
Relationships between the numbers of particles and CO2 concentrations in a classroom setting
In terms of the relationships between the number of particles and CO2 concentration, only the coarse particles (particles with a diameter larger than 2.5 μm and smaller than 10 μm) were found to be significantly correlated with the CO2 concentration when there were subjects inside the room. Similar results were also reported by Lazović et al. 50 and Fromme et al. 51 However, these two studies did not consider smaller particles, and no significant relationships were found between the CO2 concentration and particles with a diameter less than 2.5 μm in the current study. A possible explanation could be that the activities people performed increased both the indoor CO2 concentration and the number of coarse particles.52,53 Nevertheless, the fine particles (with a diameter less than 2.5 μm) deserve more attention since they have been shown to be the major component of respiratory particles and possibly the main carriers of SARS-CoV-2. 18 The not significant relationship between the number of fine particles and the CO2 concentration observed in this study could be explained by the fact that the main source of indoor particles is outdoor air, while the main source of CO2 indoors is the occupant.
Given the outcome that (1) most measured indoor particles came from outdoors and exhaled particles only presented a very small portion of them, while exhaled CO2 presented a large portion of indoor CO2; (2) the impact of the ventilation regime on indoor CO2 concentration was different compared to the impact on the number of indoor particles; and (3) the relationship between the number of most indoor particles and CO2 concentration was not significant, it is impossible to conclude that the indoor measured CO2 concentration is a good proxy for the number of exhaled indoor particles.
Limitations and future studies
The findings of this study have to be seen in the light of some limitations. The first one is the number of participants which was lower than the occupancy in real classrooms. Because this study was conducted during the COVID-19 pandemic, to ensure the safety of all the participants, more than 1.5 m social distance was kept between each of them. In future studies, more participants should be involved to test the real situation in classrooms. The second limitation is the filtration of outdoor air. Because of the limitation of the filters used in the HVAC system of the Experience room, the smaller particles were not filtered out from the outdoor air, which made it difficult to study the characteristics of the exhaled particles, and hence, impossible to draw a definite conclusion on the relationship between CO2 concentrations and exhaled particle numbers. To better understand the distribution of exhaled particles, future studies should be conducted in a clean environment without any other particles, or at least filter out outdoor particles as much as possible.
Conclusion and recommendation
To verify whether the CO2 concentration can be used as a proxy for the number of exhaled aerosols in a classroom setting, two different experiments were performed: the measurement of (1) the number of particles with different sizes and CO2 concentrations in a person’s breathing zone and (2) the distribution of particles with different sizes and CO2 in a classroom setting under different ventilation regimes. The results showed that (1) contrary to CO2, the main source of indoor particles came from outdoors and not from occupants; (2) the impact of ventilation regimes on indoor particle numbers was different compared to the impact on CO2 concentration; and (3) almost no significant relationship between the number of indoor particles and CO2 concentration was observed. Based on these results, this study could therefore not conclude that the CO2 concentration in a classroom can be used as a proxy for the number of exhaled particles by the occupants.
To study the distribution of exhaled particles, more research with alternative methods, such as visualization techniques in combination or not with tracers, such as soap bubbles or coloured mist produced by a mannikin head, is needed. Although the particle counter used in this study has proven to be a reliable device to measure aerosol concentrations, it cannot distinguish the exhaled particles from the particles originating from outdoors, being the main source of indoor particles. Therefore, a particle counter can in fact not accurately measure the exhaled number of particles, unless all the particles coming from outdoors (or other sources than breath) can be filtered out.
Footnotes
Author contributions
Dadi Zhang: conceptualization; methodology; investigation; data analysis; writing-original draft preparation; writing-review and editing. Philomena Bluyssen: conceptualization; methodology; supervision; writing-original draft preparation; writing-review and editing.
Declaration of conflicting interests
The author(s) declared no potential conflicts of interest with respect to the research, authorship, and/or publication of this article.
Funding
The author(s) disclosed receipt of the following financial support for the research, authorship, and/or publication of this article: This study is part of the ZonMw funded project “SARS-CoV-2 transmission in secondary schools and the influence of indoor environmental conditions” (no. 50–56300-98–689) coordinated by the University Medical Centre Utrecht in the Netherlands. Participants are the Erasmus Medical Centre in Rotterdam, the University of Utrecht, and the Delft University of Technology in Delft, all in the Netherlands.