
Abstract
This study investigated the impact of outdoor air pollutants on indoor air quality in a high-rise building, considering factors related to the seasons and air infiltration. Further, the impact of atmospheric weather conditions on air infiltration has been analysed in a downtown area of Suzhou, China. The influence of the outdoor air pollution rate on indoor air quality in the office building was investigated based on on-site measurements and computer simulations. Results showed that the impact of outdoor air pollutants on indoor air quality was highest in winter, followed by spring, autumn and summer. Furthermore, multiple factors, which affect the indoor air quality in a high-rise building, have been further investigated in this study, including stack effect, wind effect, infiltration rate, outdoor air pollution rate, seasonal change and air filter efficiency. The significant influence of these factors on the indoor air quality level with floor height variations has been verified. Based on the analysis, a high-efficiency filter is recommended to maintain healthy indoor air quality. Meanwhile, a double-filter system is required if a building is exposed to heavily polluted outdoor air considering the most substantial impact of outdoor air pollutants on indoor air quality in winter. Moreover, a numerical model of steady-state indoor PM2.5 concentration was established to determine the suitable air filter efficiency and airtightness.
Keywords
Introduction and background
During the last decade, the impact of particulate matter (PM) issues has been highlighted as a top priority in China due to its extreme health harm to human beings. Because of its small size, the fine and ultra-fine PM can readily and deeply access into human lungs, even the bloodstream. Previous research indicated that smaller size particles were the more hazardous to human health, being linked to higher morbidity and mortality.1–3 Meanwhile, with the rapid urbanization and economic development in many countries, people spend a large share of their time on indoor activities. Concern was also raised by the U.S.A’s Environmental Protection Agency (EPA) report that indoor air pollution levels could much more dangerous than the outdoor levels. 4 For example, the indoor PM2.5 (particles that have diameter less than 2.5 micrometres) level in an office building could be three times higher than the value recommended by the U.S.A’ National Ambient Air Quality Standard (NAAQS). 5 Providing a healthy indoor environment in office buildings has a crucial positive impact on employees' health and working efficiency. According to statistics, 6 the number of high-rise buildings has increased dramatically, with around 86% of office buildings now being over 100 m high. Hence, a 100-m tall office building was selected as the objective building in this study.
Airborne particles in buildings come from the outdoors through the building envelope with infiltrating air or the ventilation system's leakages.7–12 Two existing strategies have been widely used to control IAQ in buildings: installing a high-efficiency air filter system10,13–15 and increasing the ventilation rate.10,13,16–20 In mechanically ventilated buildings, the outdoor particles, which infiltrate through gaps in the building’s envelope with the infiltration air, could directly impact IAQ. Furthermore, air infiltration could increase the building's heating load by 25% to 30%.21,22 Infiltration could negatively affect indoor thermal comfort, ventilation system efficiency and acoustic insulation performance.22,23 Hence, infiltration air is undesired if the outdoor air is contaminated. It is crucial to predict the infiltration rate and to help designers develop a more appropriate design strategy to improve the IAQ.
Infiltration is the unplanned flow of outdoor air into the internal space through cracks in the building and leakage points in the building envelope. 24 The stack effect and the wind effect are the two main mechanisms for developing pressure differences between inside and outside, and both contribute to the air exchange through cracks and cavities in the building. Based on the ASHRAE Handbook of Fundamental , 24 the wind-induced pressure difference increases with height. Meanwhile, the stack-induced pressure differences vary with the difference in height between inlet and outlet openings affected by the location of the neutral pressure level (NPL). 25 Hence, the total pressure difference on the windward facade varies with the building height, which results in air infiltration rates varying between each floor of a building which, in turn, means that the different air infiltration rates will cause IAQ conditions to differ on each floor. However, there is little research about how the air infiltration rate's vertical variation affects each floor's indoor pollutants' concentration. The understanding of this effect could help maintain a good IAQ while simultaneously saving energy.
In addition, many studies have shown that fine and ultra-fine particles have a higher possibility of entering the indoor environment through the ventilation system than coarse particles due to their smaller size, and also it is hard to capture them using a conventional air filter .2,26 Small size particles are also easier to infiltrate and penetrate buildings than coarse particles. 27 Hence, the particles are smaller than of 2.5 µm, as PM2.5, were considered in this research. Compared to the ambient PM standard, the indoor PM control standard lacks development since only a few countries have established indoor PM control standards. The existing recommended concentration limit for indoor PM2.5 concentration is mainly aimed at industrial environments. 28 Therefore, the World Health Organization (WHO) Air Quality IT-1 level 29 of 35 µg/m3 for PM2.5 was chosen to evaluate the indoor PM2.5 concentrations in this study.
The objective building for this study was in Suzhou, which is a major city in the southeast of Jiangsu Province, China. The city is a typical industrialized city developed over recent decades. Based on a statistical analysis of historical hourly weather data between 1 January 1980 and 31 December 2018,
30
the temperature typically varied from 0
During the last five years, airborne particle pollution has been a persistent problem in Suzhou due to its large manufacturing sector. Since natural ventilation is rarely used, mechanical ventilation systems are necessary for office buildings in Suzhou. Moreover, the wind speed varies slightly between seasons in Suzhou, and the wind direction in Suzhou changes throughout the year. According to weather statistics, 30 the windiest day of the year is 2 May with an average speed of 4.4 m/s. The wind speed was measured at 10 m above the ground. While on the calmest day of the year (23 October), the average wind speed was 3.8 m/s. During spring and autumn, there is a relatively low air temperature difference between indoors and outdoors. The relatively high wind speed can impact on air infiltration in high-rise buildings.
In summary, this study aims to investigate how outdoor air pollutants affect indoor air quality through the leakage in the building envelope in a high-rise mechanically ventilated building. This study's results contribute to a better understanding of the role of air infiltration requirements for controlling the negative impact of airborne particles on human health for buildings in polluted cities. To this end, three research questions have been defined: How do ambient meteorological conditions affect the air infiltration rates? How do the air infiltration rates affect the IAQ in a high-rise mechanically ventilated building? How does the air filter efficiency affect the ingress of outdoor airborne particle concentrations?
Methodology
To investigate the influence of weather conditions on infiltrating air, Suzhou's daily average meteorological conditions in 2018 were collected from the China Meteorological Bureau database to estimate the daily and seasonal variation of air infiltration rate on each building floor. Furthermore, to answer the second research question, field measurements and numerical simulations were undertaken to predict the IAQ on each floor of a building under different circumstances, including various outdoor air conditions and building locations. Additionally, according to the IAQ simulation results on each floor, different efficiency air filters were applied to investigate the effects of filter efficiency in controlling the indoor PM concentrations.
The methodologies for analysing the impact of increasing outdoor pollution level on IAQ in a high-rise mechanically ventilated building can be subdivided into four steps: (1) Estimate the daily and seasonal variation of the air infiltration rate based on collected data; (2) Perform on-site vertical profile measurements of outdoor air pollutants up the height of the building; (3) Develop numerical simulations based on collected data to predict indoor PM2.5 level on each floor of the building by using power-law equations; (4) Compare the indoor PM2.5 levels for different air filter efficiencies.
Designed office building
As a case study, a hypothetical office building was modelled. The footprint plan area of the building was 259.64 m2, which was around 16.11 m (W)
Instrumentation
A TSI Model 8534 DustTrak Aerosol Monitor (TSI incorporated USA) was used to measure PM2.5 concentrations. As a handheld instrument, the 90° light scattering technique, in which the amount of scattered light is proportional to the volume concentration of an aerosol, was applied to estimate concentration' values. The mass resolution of the DustTrak is 1 µg/m3 or ±0.1% of the reading, while the detection range is from 0.1 to 15 µm approximately. This instrument has been used to measure the atmospheric particles in several widely accepted papers.32,33 The instrument was calibrated using Arizona Test Dust by the manufacturer to relate light scattering intensity to aerosol mass concentrations and be recalibrated at the experiment site before every measurement.
Test sites and experimental description
Due to the experiment site's limitation, a case study was conducted to investigate the outdoor particles' vertical profile. The measured data were then compared with published data which were measured in a city close to Suzhou, to see whetherthose data could be applied in this case study. The selected building, which will remain anonymous, was approximately 12 storeys tall(∼63 m) . The test building was located in a relatively open area surrounded by a pedestrian road and a vehicle road. Time-resolved measurements were conducted during two periods in different seasons: spring (9:00 am–11:00 am, 27 March–3 April 2019), summer (9:00 am–11:00 am, 20 May–27 May 2019), autumn (9:00 am–11:00 am, 15 October–22 October 2019) and winter (9:00 am–11:00 am, 26 November–02 December 2019).
Samples were collected on the first floor (1.2 m) and 12th floor (62.6 m). The calibrated instrument was placed outside of each floor's balcony that faced a square, approximately 1.2 m above each floor level and 1 m away from the building façade. One researcher with an instrument was deployed on each sampling site in this study, ensuring the same logging interval (10 s) was used. The locations of building A and building B in the experimental site are illustrated in Figure 1.
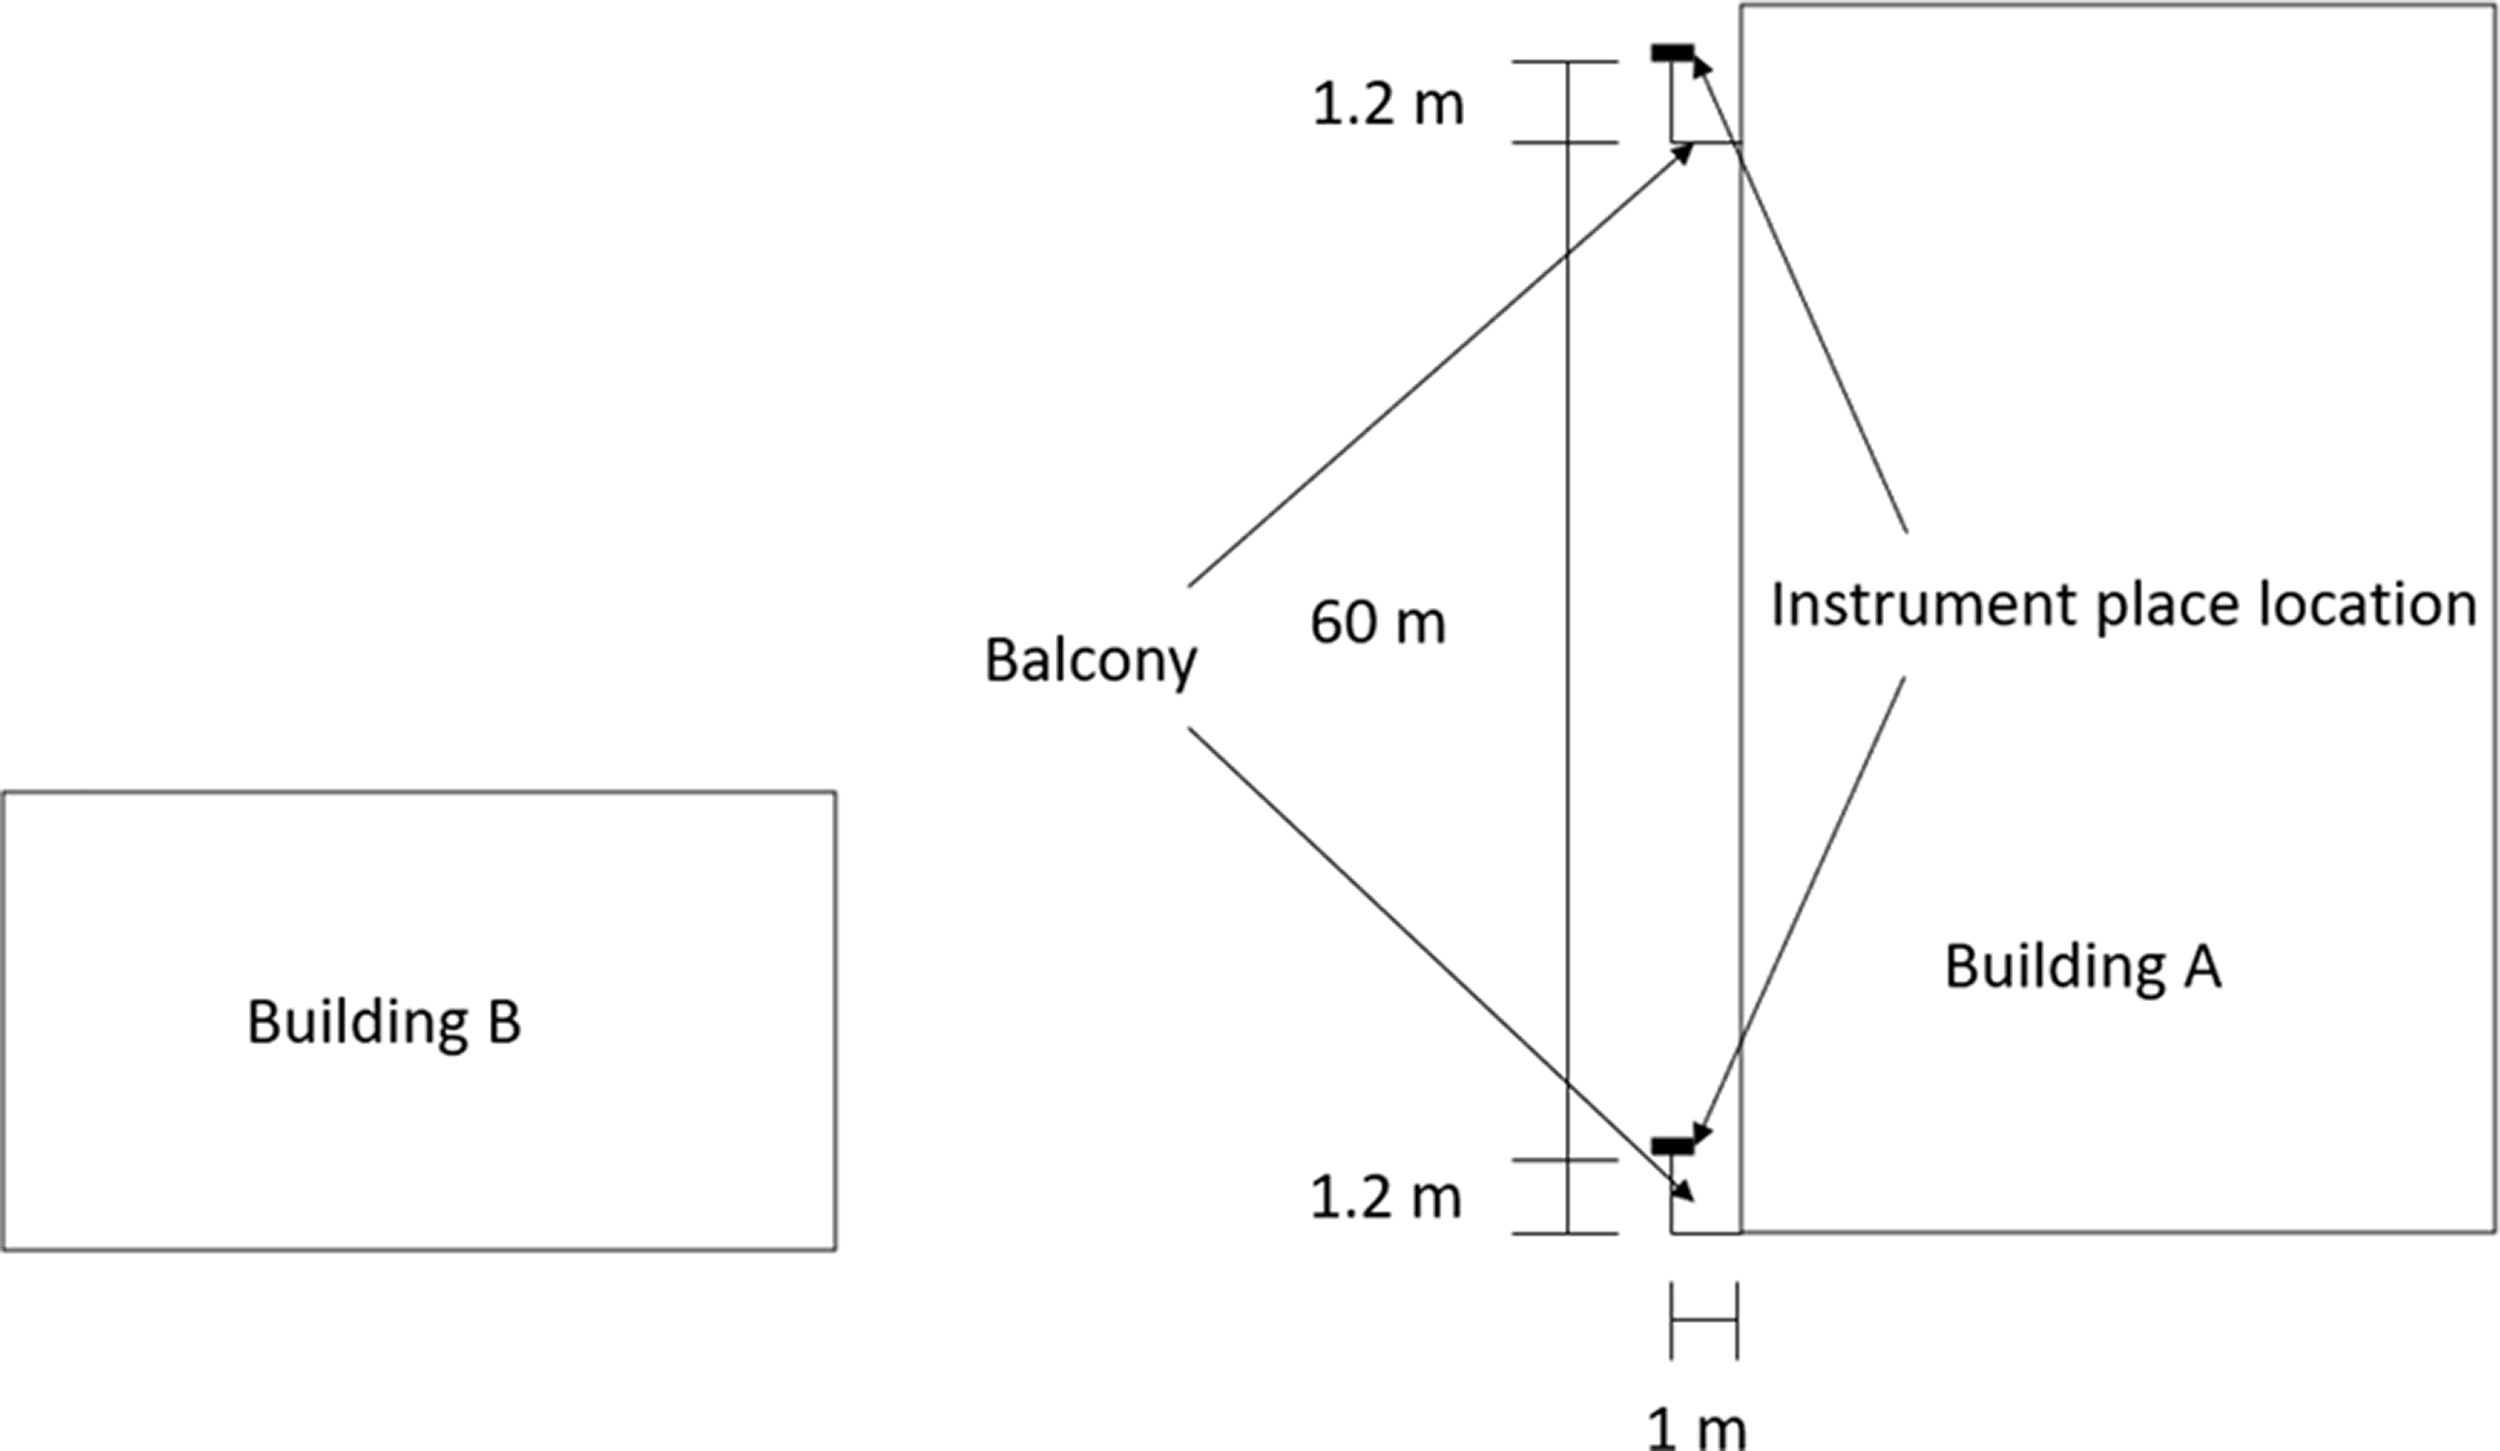
The detailed information of the experiment site.
Weather characteristics
Suzhou is located in the Yangtze River Delta's central part in China's east (31°18ʹN 120°36ʹE), and it borders Shanghai. The city is situated in the subtropical zone, which indicates that it experiences a warm and moist monsoon maritime climate. The meteorological conditions of Suzhou in 2018 were used to analyse the seasonal variation of the impact of outdoor air pollutants on indoor air quality. The daily average outdoor air dry-bulb temperature and wind speed from 1 January 2018 to 31 December 2018 are shown in Figures 2 and 3. From Figures 2 and 3, the outdoor air temperature of Suzhou in 2018 varied from 0
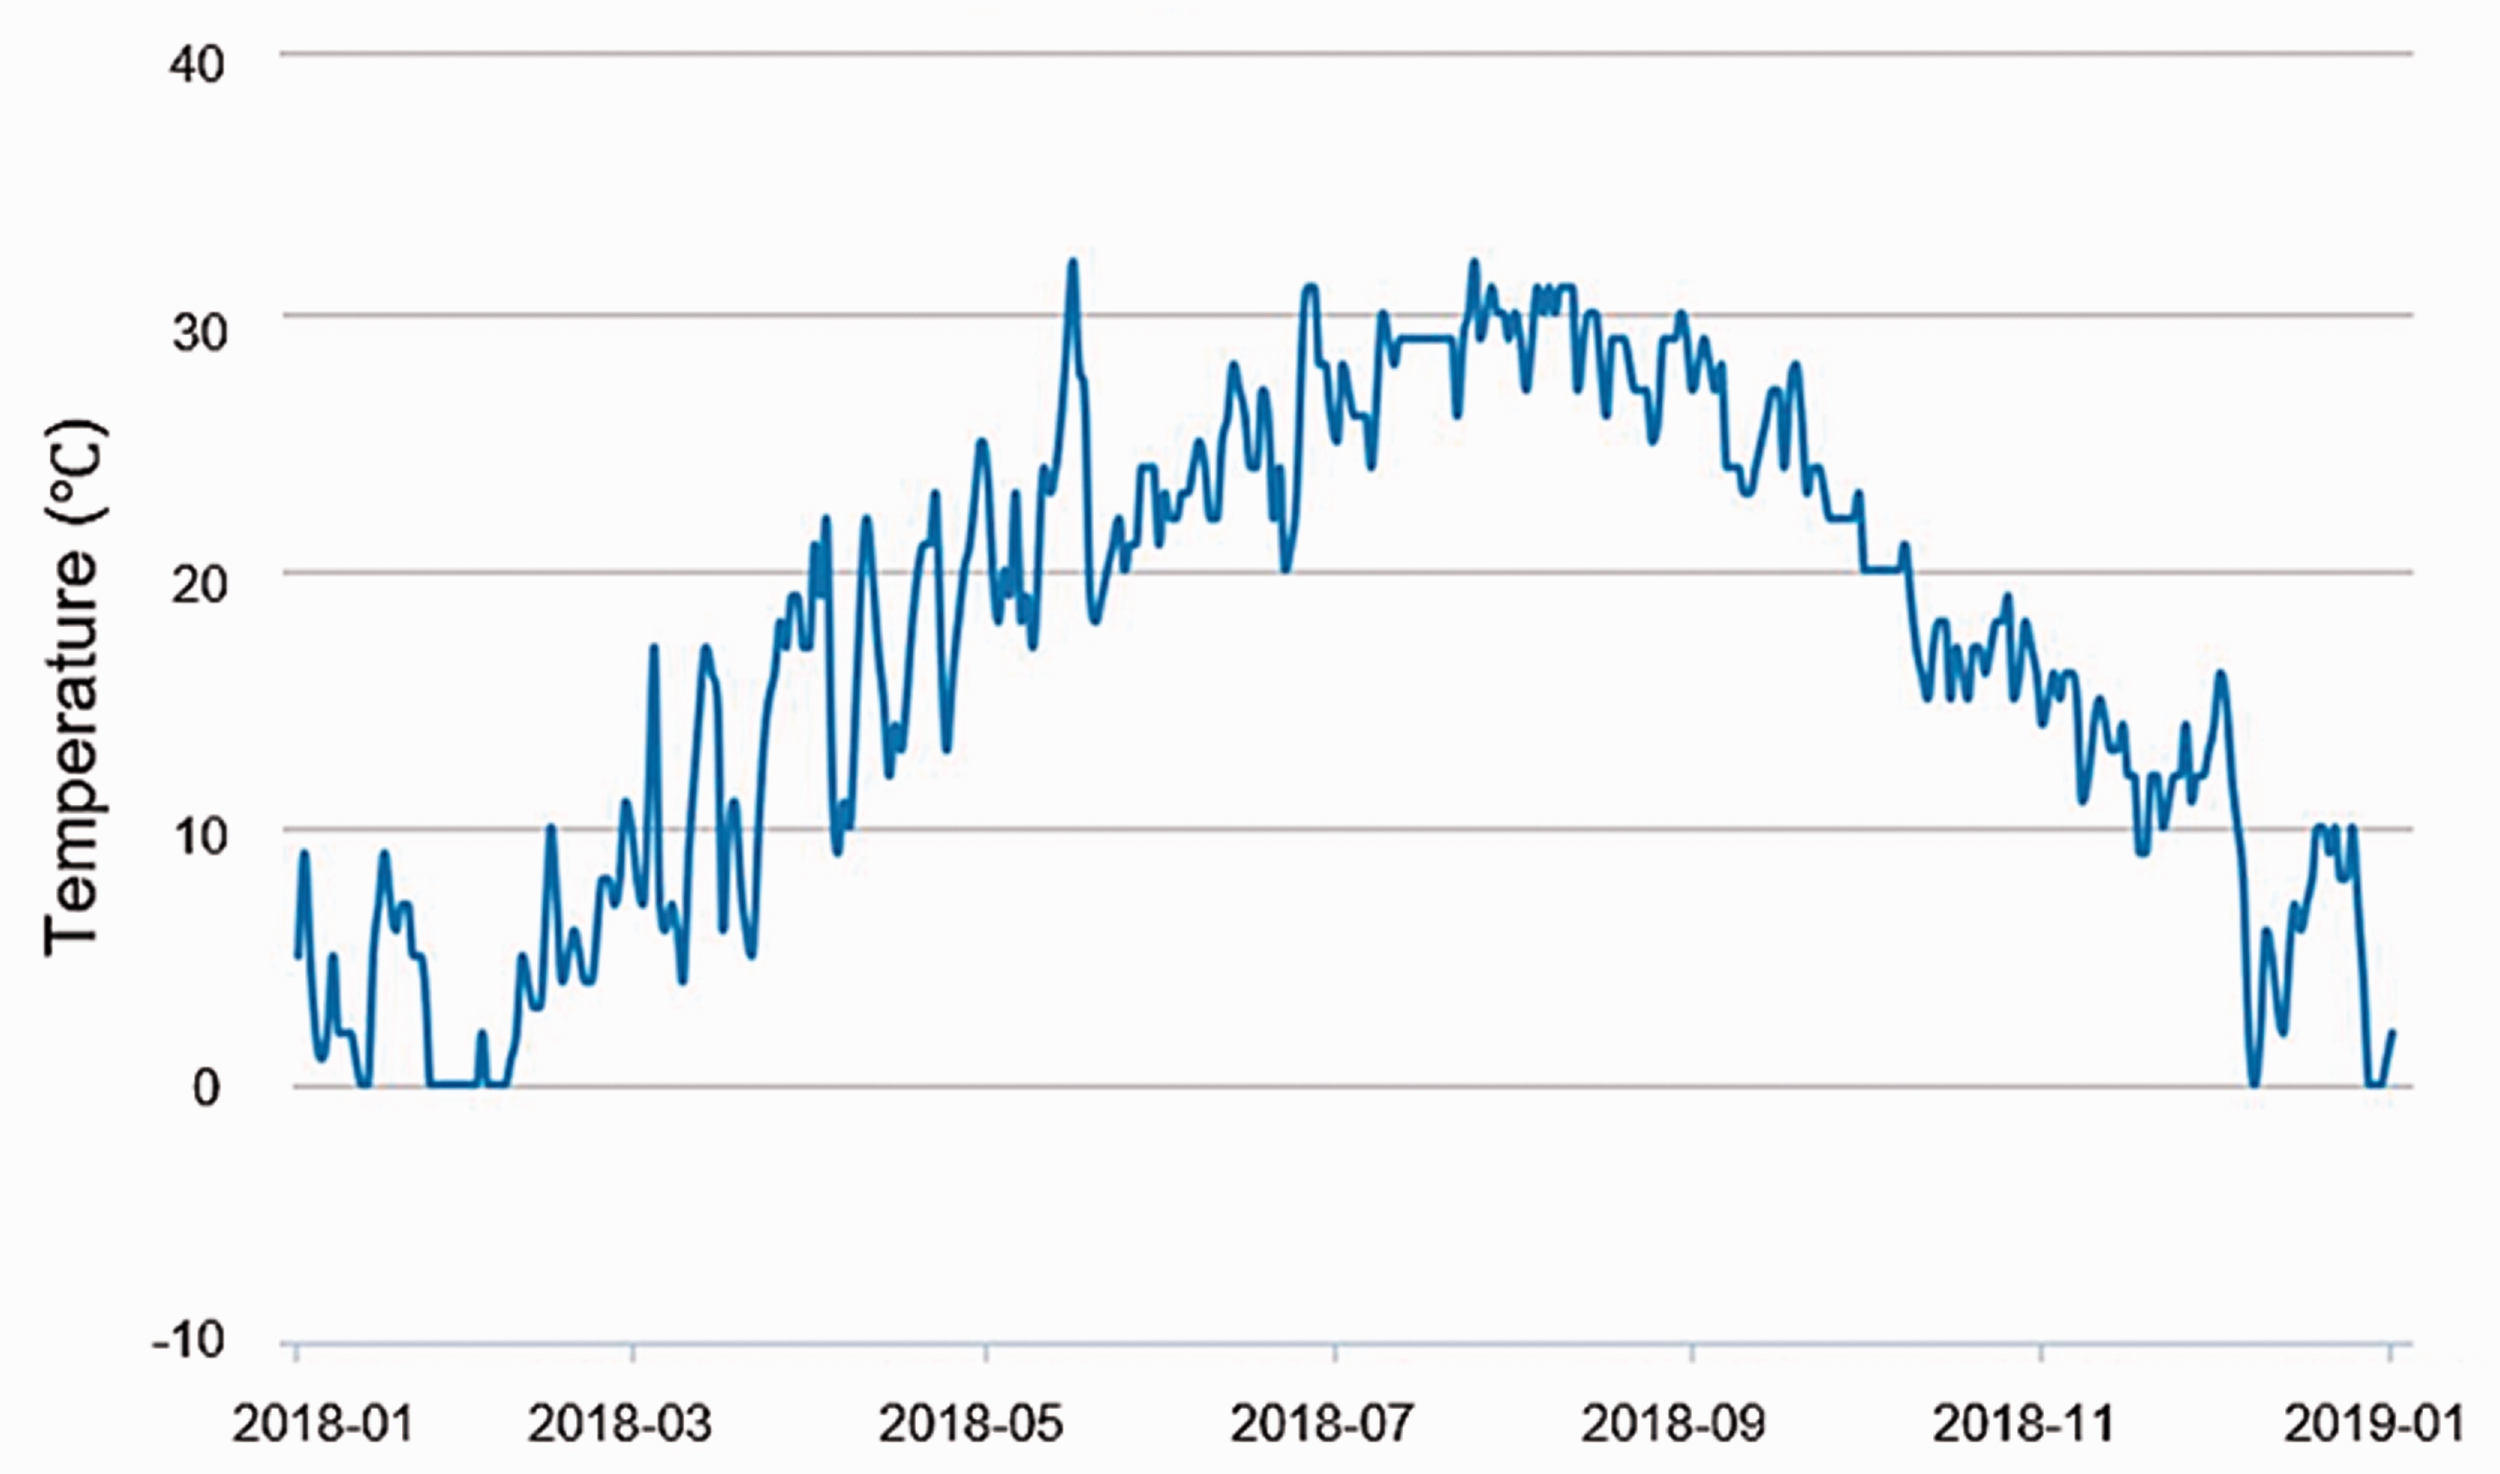
Suzhou daily average outdoor dry-bulb air temperature from 1 January 2018 to 31 December 2018. 34
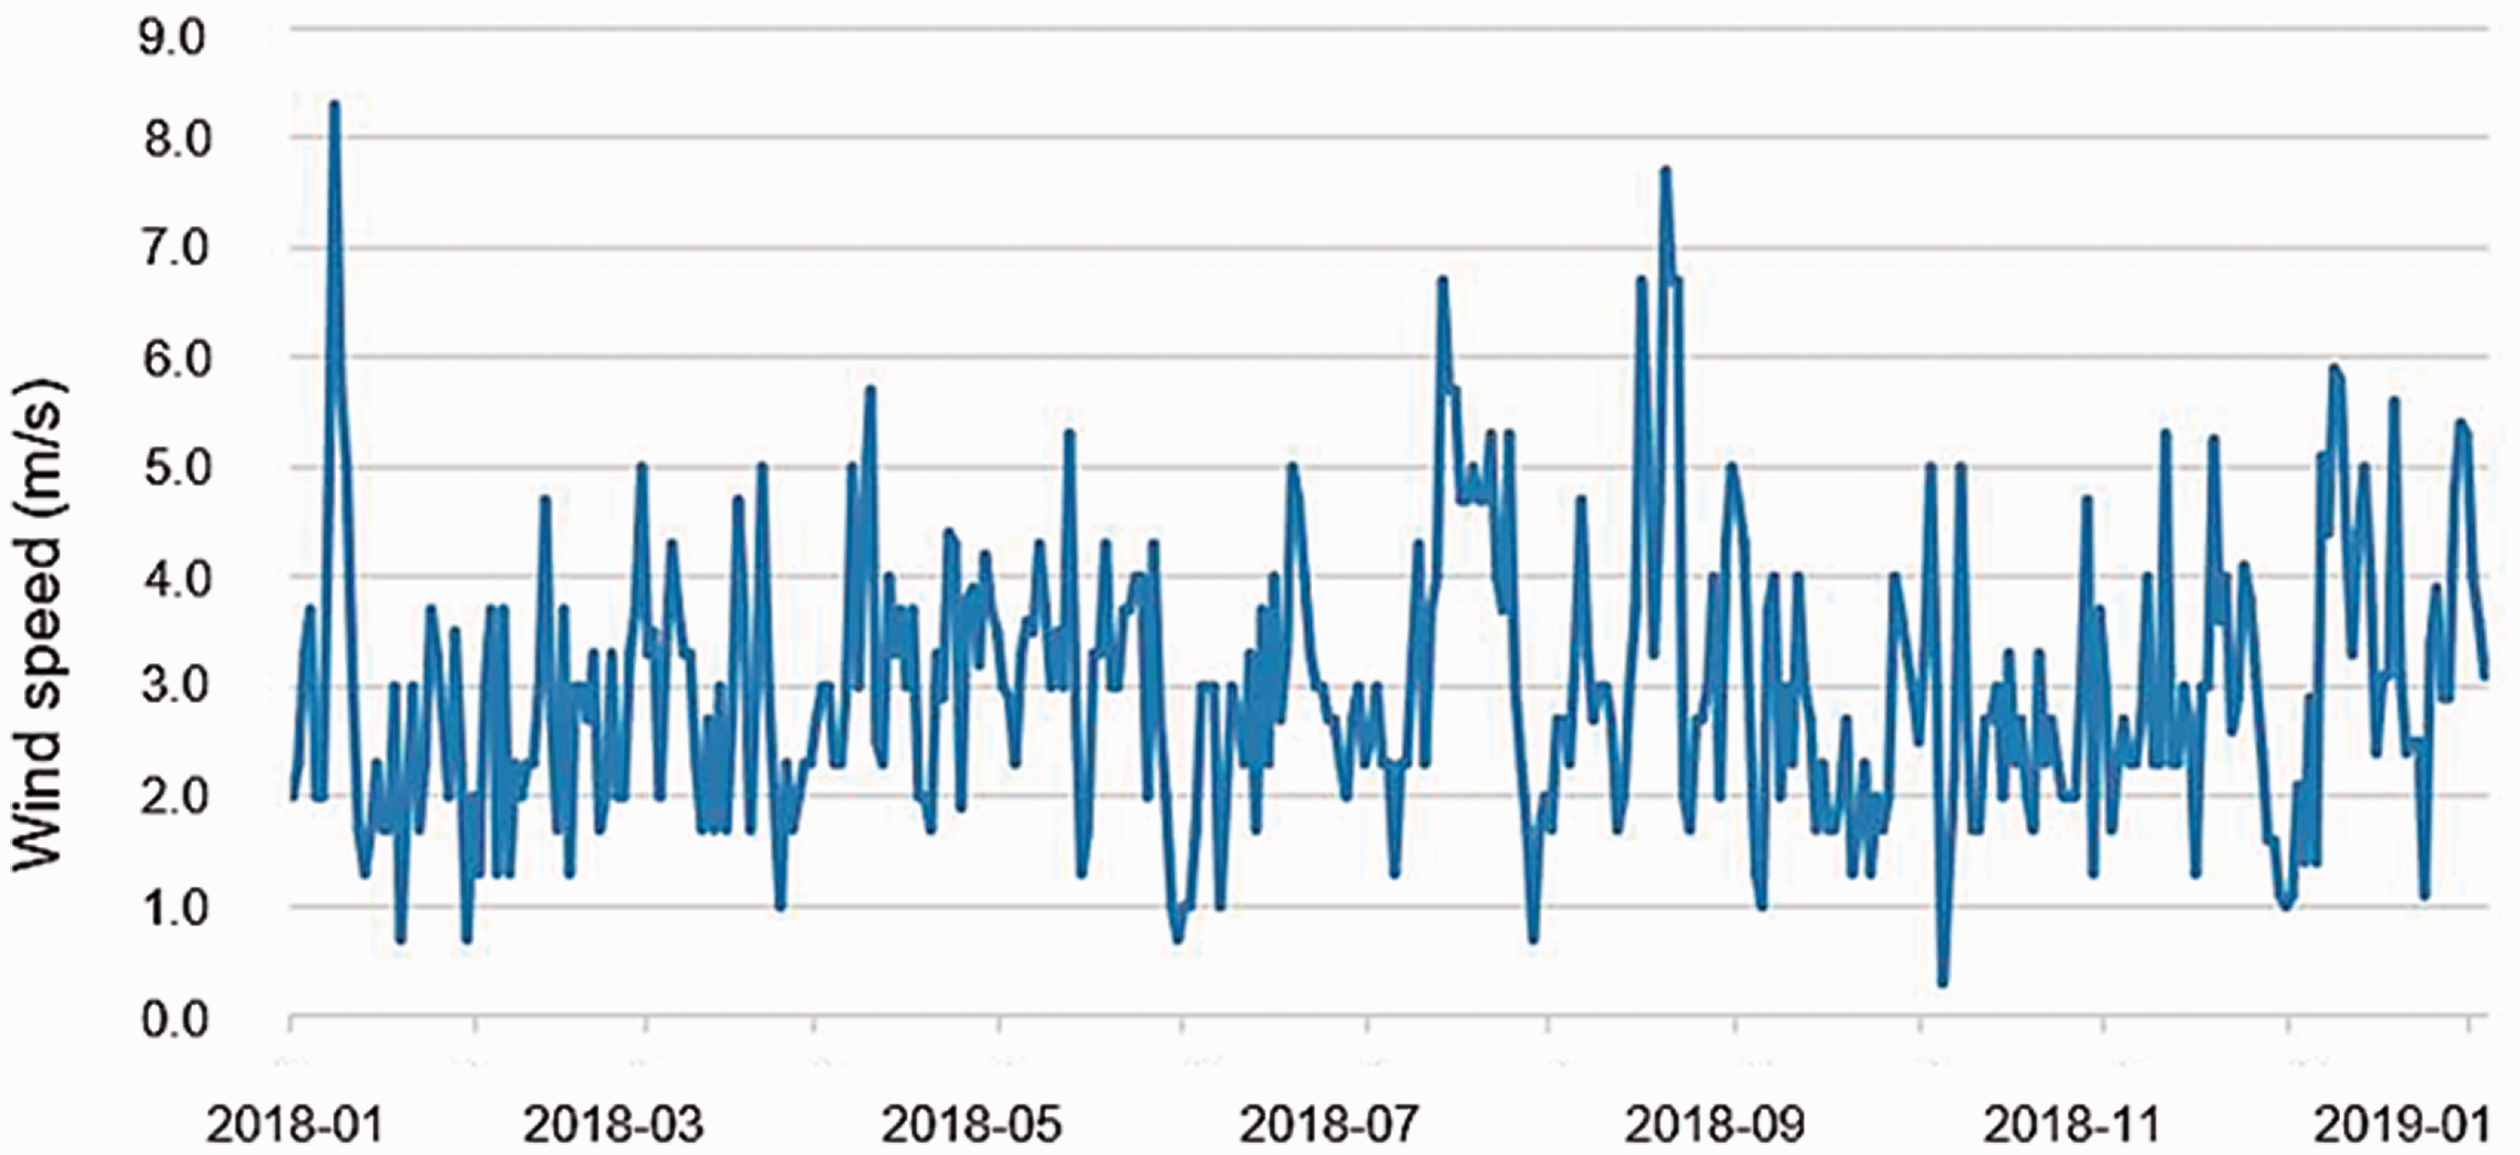
Suzhou daily average wind speed from 1 January 2018 to 31 December 2018. 35
Analysis of indoor PM concentration
Over time, indoor PM concentration levels can be remodelled as a function that mainly depends on source terms and loss terms. Assume that the particle concentration in the room is uniform,
38
equation (1) represents the dynamic solution of the mass balance equation that describes the indoor concentration.10,39–41


Estimation of infiltration rate
Both stack and wind effects are required to determine the pressure difference between the indoors and outdoors to estimate of the air infiltration rate in a building. In addition, the infiltration rate is also affected by the type of air pollutants, building surface material and crack geometry.27,43,49,50 Because this paper aimed to investigate the impact of outdoor air pollutants on the IAQ in a high-rise mechanically ventilated building, several presumptions were made: The building that was used in the case study is rectangular. Leakage was uniformly distributed on the south facade of the building, and there was no leakage in the other three facades. Crack geometry was uniform. It means that it is an idealized rectangular straight crack with a fixed dimension throughout the leakage path, that the inner surface of the crack is smooth, and that the airflow is the stable laminar flow through the crack. Further, the width of the crack is greater than that height. This means that the airflow can be reasonably thought of as a two-dimensional model. Indoor air temperature was assumed to be uniform. Average values of the wind pressure coefficients were used in this study. Particle size distribution was assumed to be uniform. Fan operation was independent of any wind-induced or stack-induced pressure differences imposed across it.
Based on the ASHRAE Handbook,
24
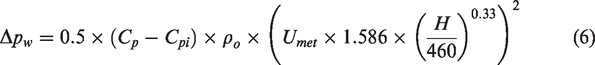
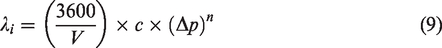
the local wind pressure on buildings can be determined by equation (4)


In theory, the NPL is precisely at the mid-height of a building if the building's cracks and other openings are uniformly distributed vertically.24,51 However, many factors, including the mechanical supply and exhaust system, affected the indoor air pressure level and contributed to the NPL location variation.25,44,45,52,53 Hence, this study defined the NPL at 30%, 50% and 70% of the total building height to investigate the stack-induced pressure difference between the inside and outside of the building.
24
Then the total pressure difference can be calculated by equation (8)

After determining the total pressure difference between indoors and outdoors, the air infiltration rate could be determined by equation (9)24


Results and discussion
Prediction of the pressure difference between indoors and outdoors
Based on the collected data, all calculations were carried out to change the pressure difference between both sides of the building's south facade in a year.
The impact of meteorological conditions on the pressure difference between indoors and outdoors
For a typical year, Suzhou's daily averaged outdoor air temperature varies between 0
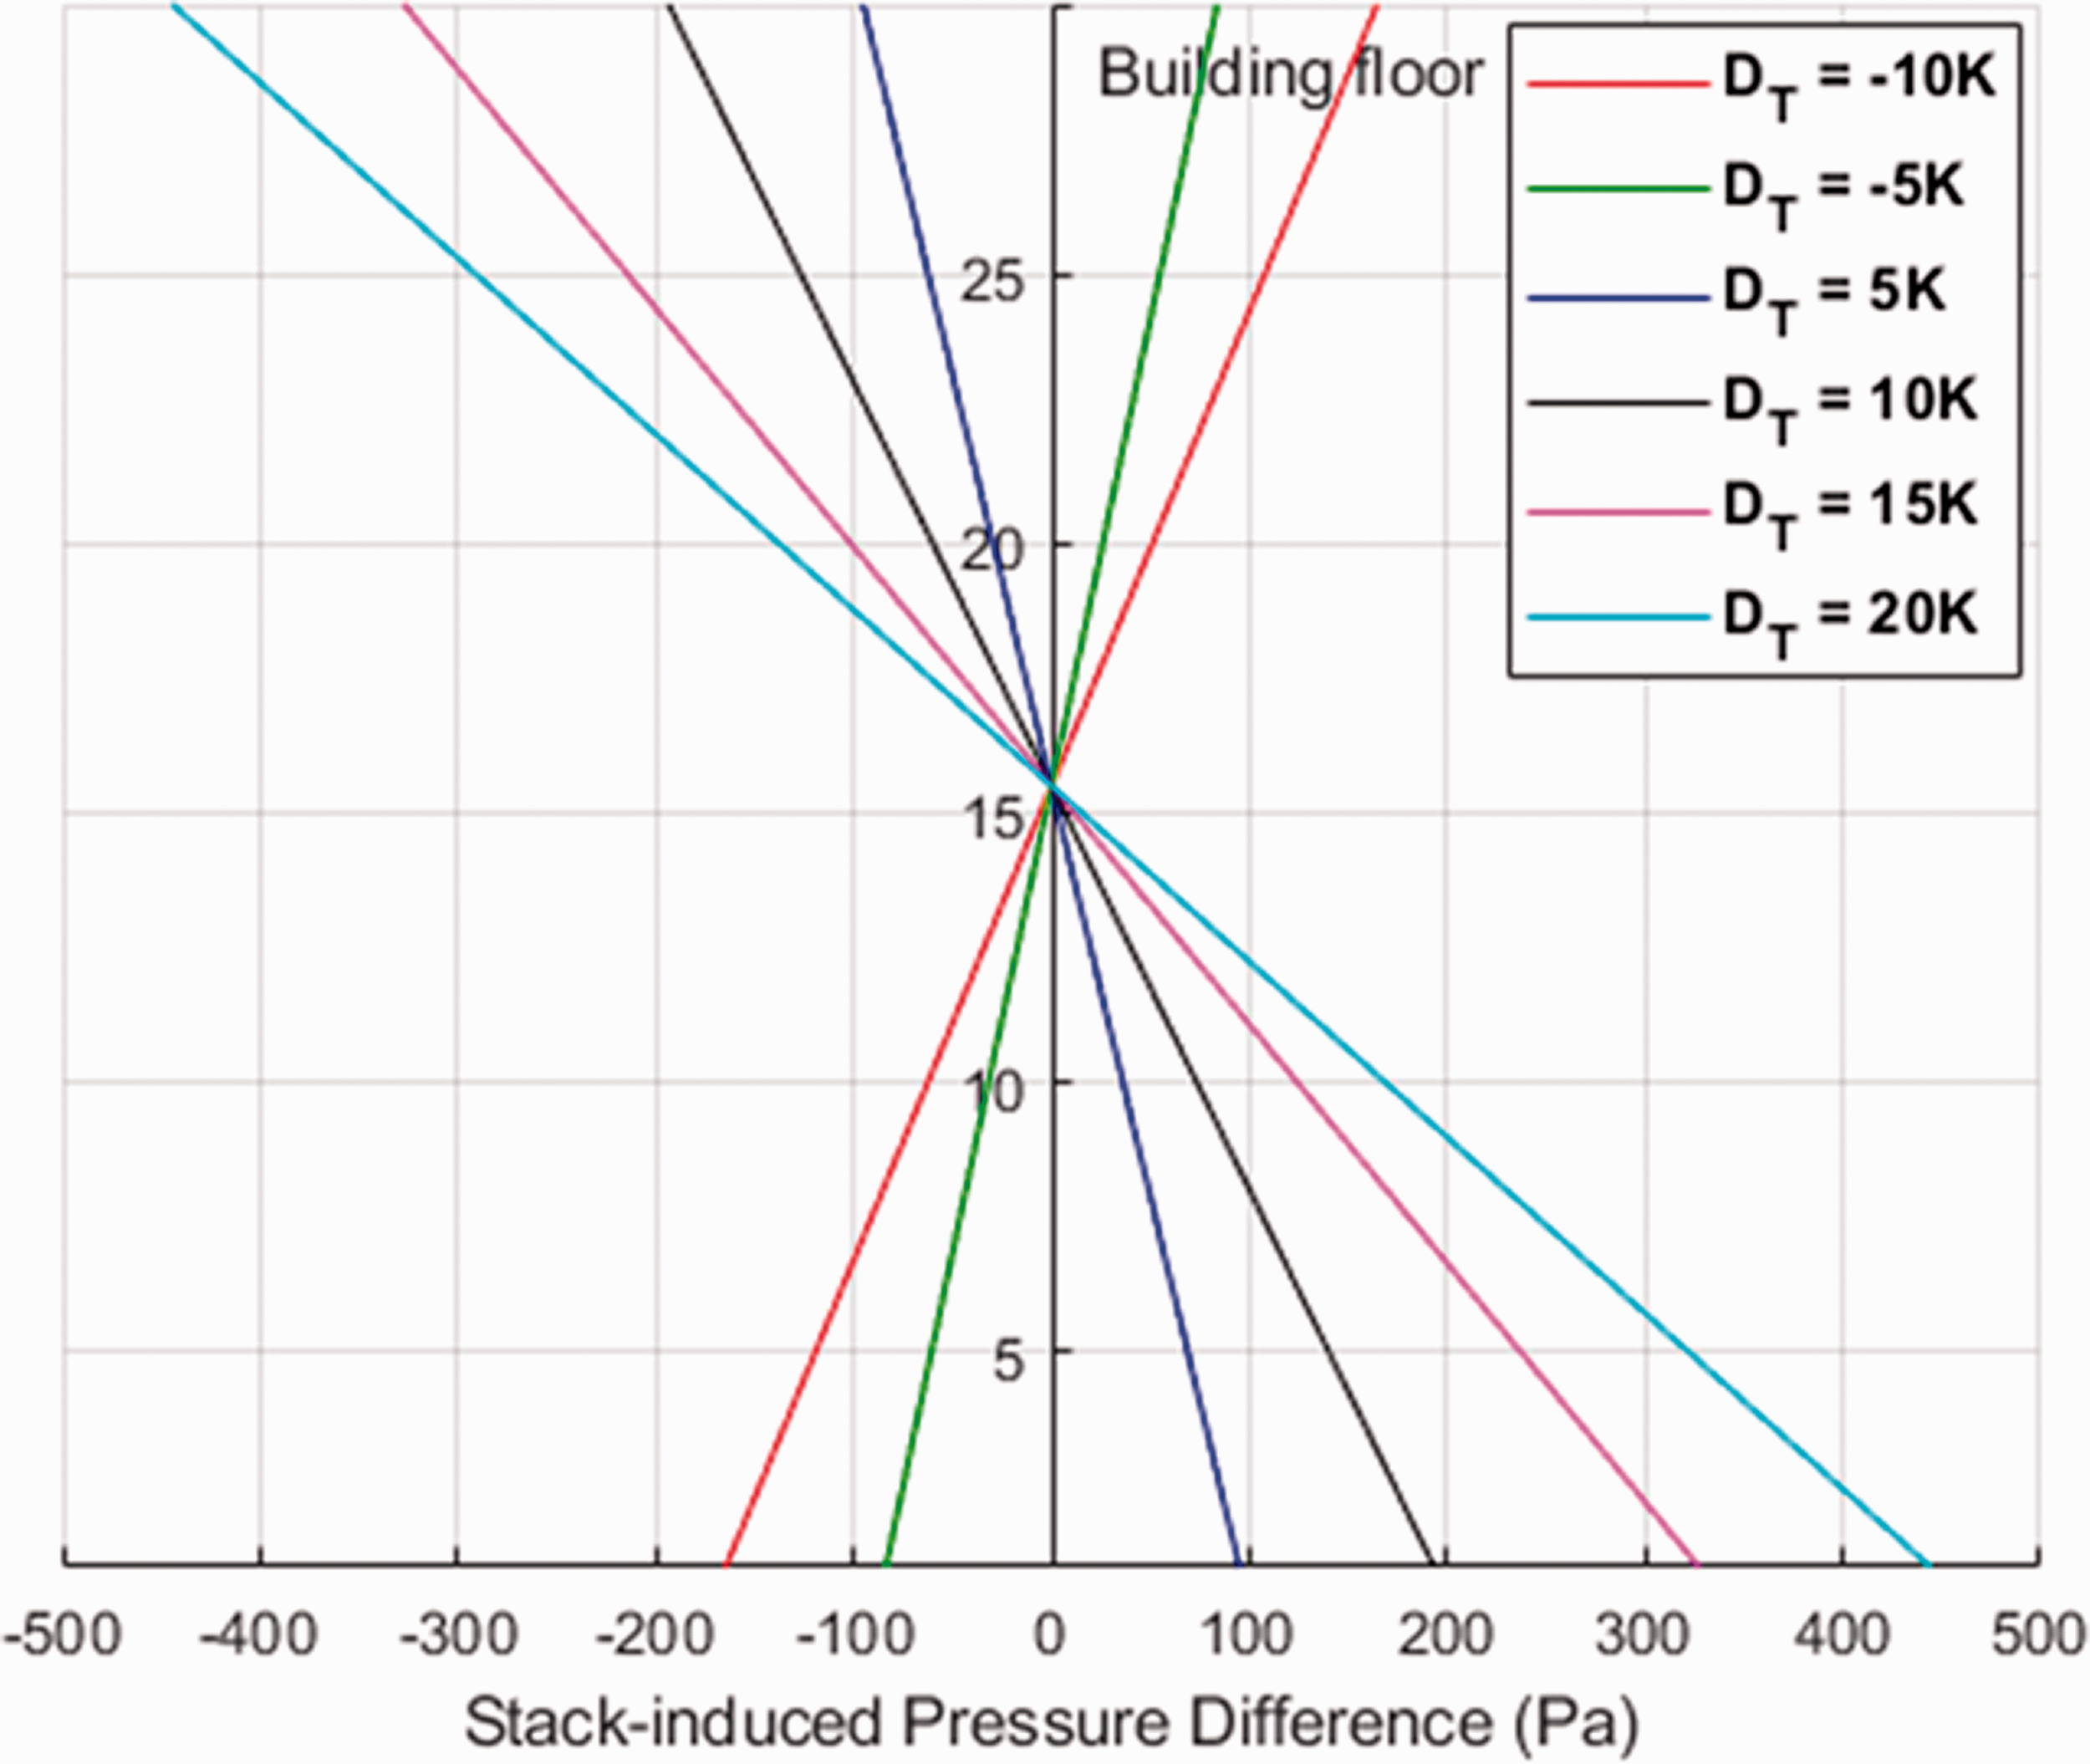
The impact of the temperature difference between indoors and outdoors on stack-induced pressure difference when NPL is at 50% of the building height.
Based on the simulation results, when the difference between inside and outside temperature increased by 5 K, the stack-induced pressure difference on the building facade doubled. However, the increasing proportion of the pressure difference decreased near the transition point (where the stack-induced pressure difference equals 0). This means that the stack-induced pressure difference was linearly proportional to the building height.
From reference, the ambient wind speed in 2018 varied from 0.3 m/s to 8.3 m/s. Based on such data sources, simulations were carried out to investigate the impact of ambient wind speed on wind-induced pressure difference, and the results are shown in Figure 5. Figure 5 indicates that the wind-induced pressure difference was also increased with an increase in the outdoor wind velocity, while the increased margin of the pressure difference was increased along with the building height. More specifically, the pressure difference was increased from 0.02 Pa to 1.98 Pa on the ground floor if the ambient wind velocity rose from 1 m/s to 8 m/s, while on the top floor, it rose from 0.32 Pa to 29.20 Pa. A non-linear correlation between the wind-induced pressure and the building height can be determined from Figures 4 and 5.
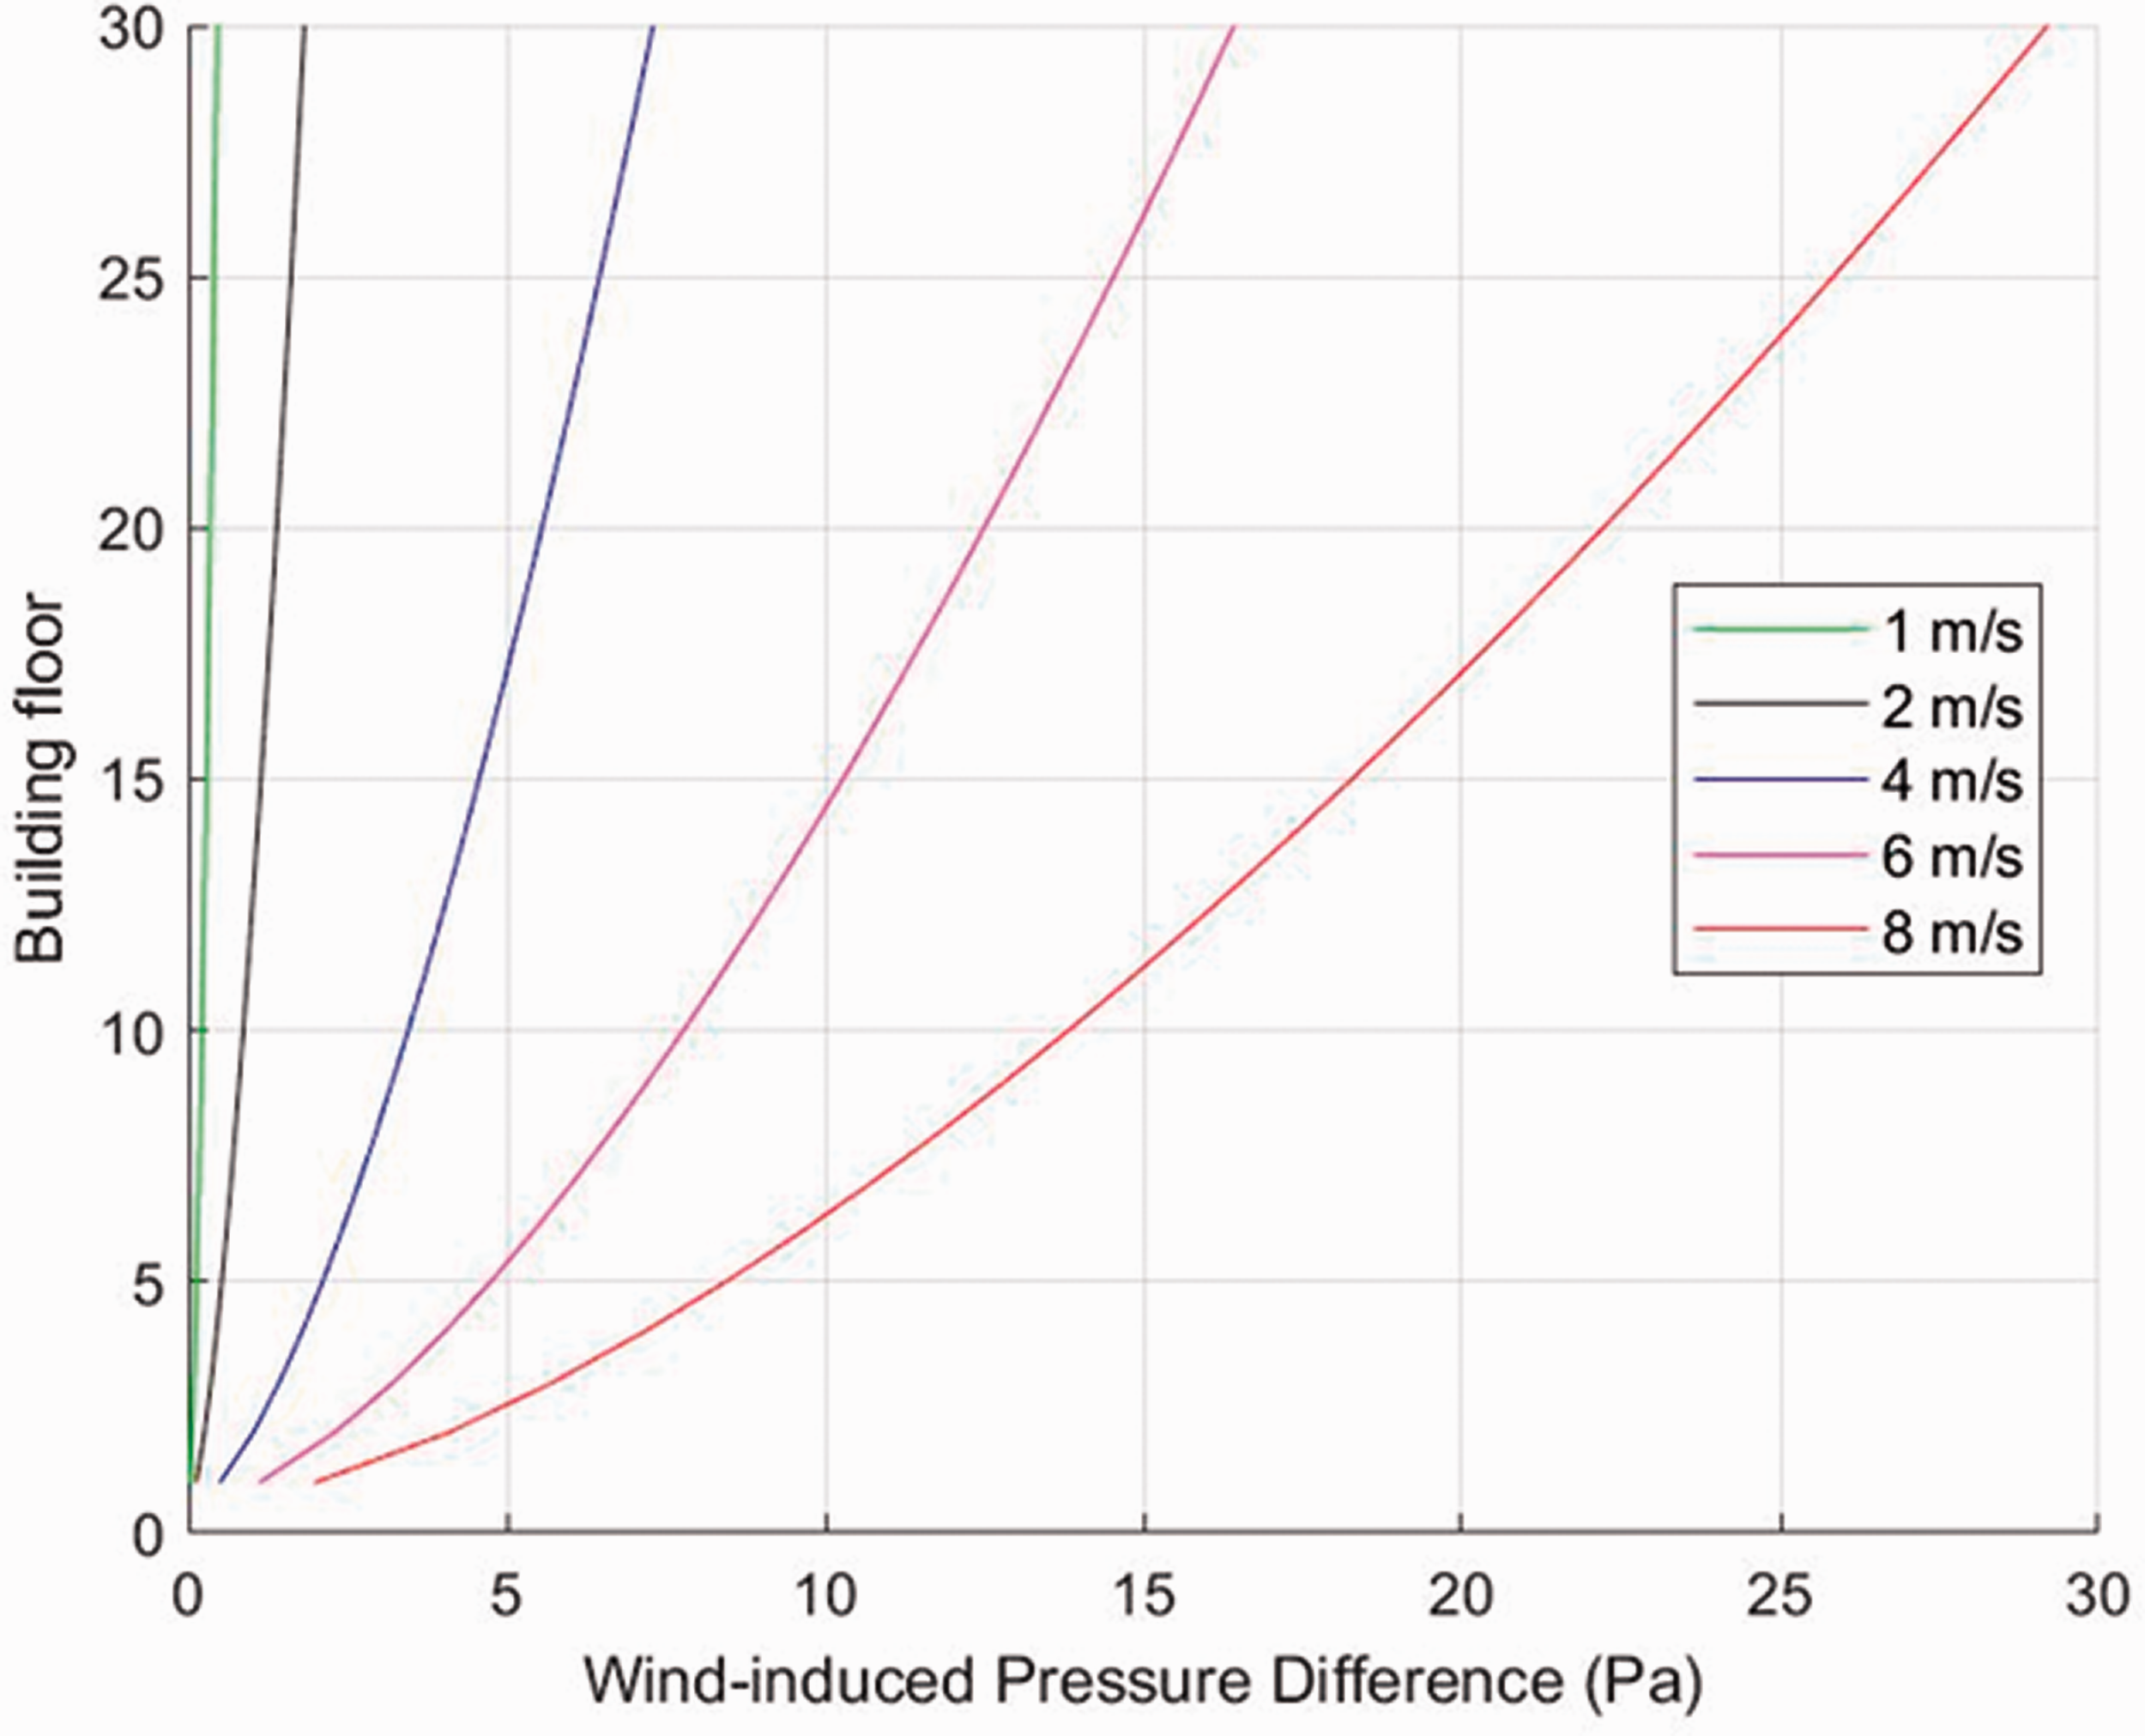
The impact of wind speed on wind-induced pressure difference when the wind direction is perpendicular to the building south façade (θ = 0°) when NPL is at 50% of the building height.
Since the wind speed does not affect the variation trend of pressure difference in the vertical direction, the annual average outdoor wind speed, 4.1 m/s, was taken as an example to investigate the influence of wind direction on the wind-induced pressure difference. The results are shown in Figure 6. If the wind direction was changed from 0° to 45°, the wind-induced pressure difference was decreased by around 30% at both the top and ground floors. If the direction changed from 90° to 180°, it caused a 56.3% decline in the pressure difference. As a special case, the wind-induced pressure difference was reduced to 0 if the direction was around 70°. 24 Overall, the pressure difference between the wind and south facades was proportional to the wind angle with a negative gradient. Furthermore, such a relationship is not affected by the wind speed since the gradient stayed constant along with the varing wind speed.
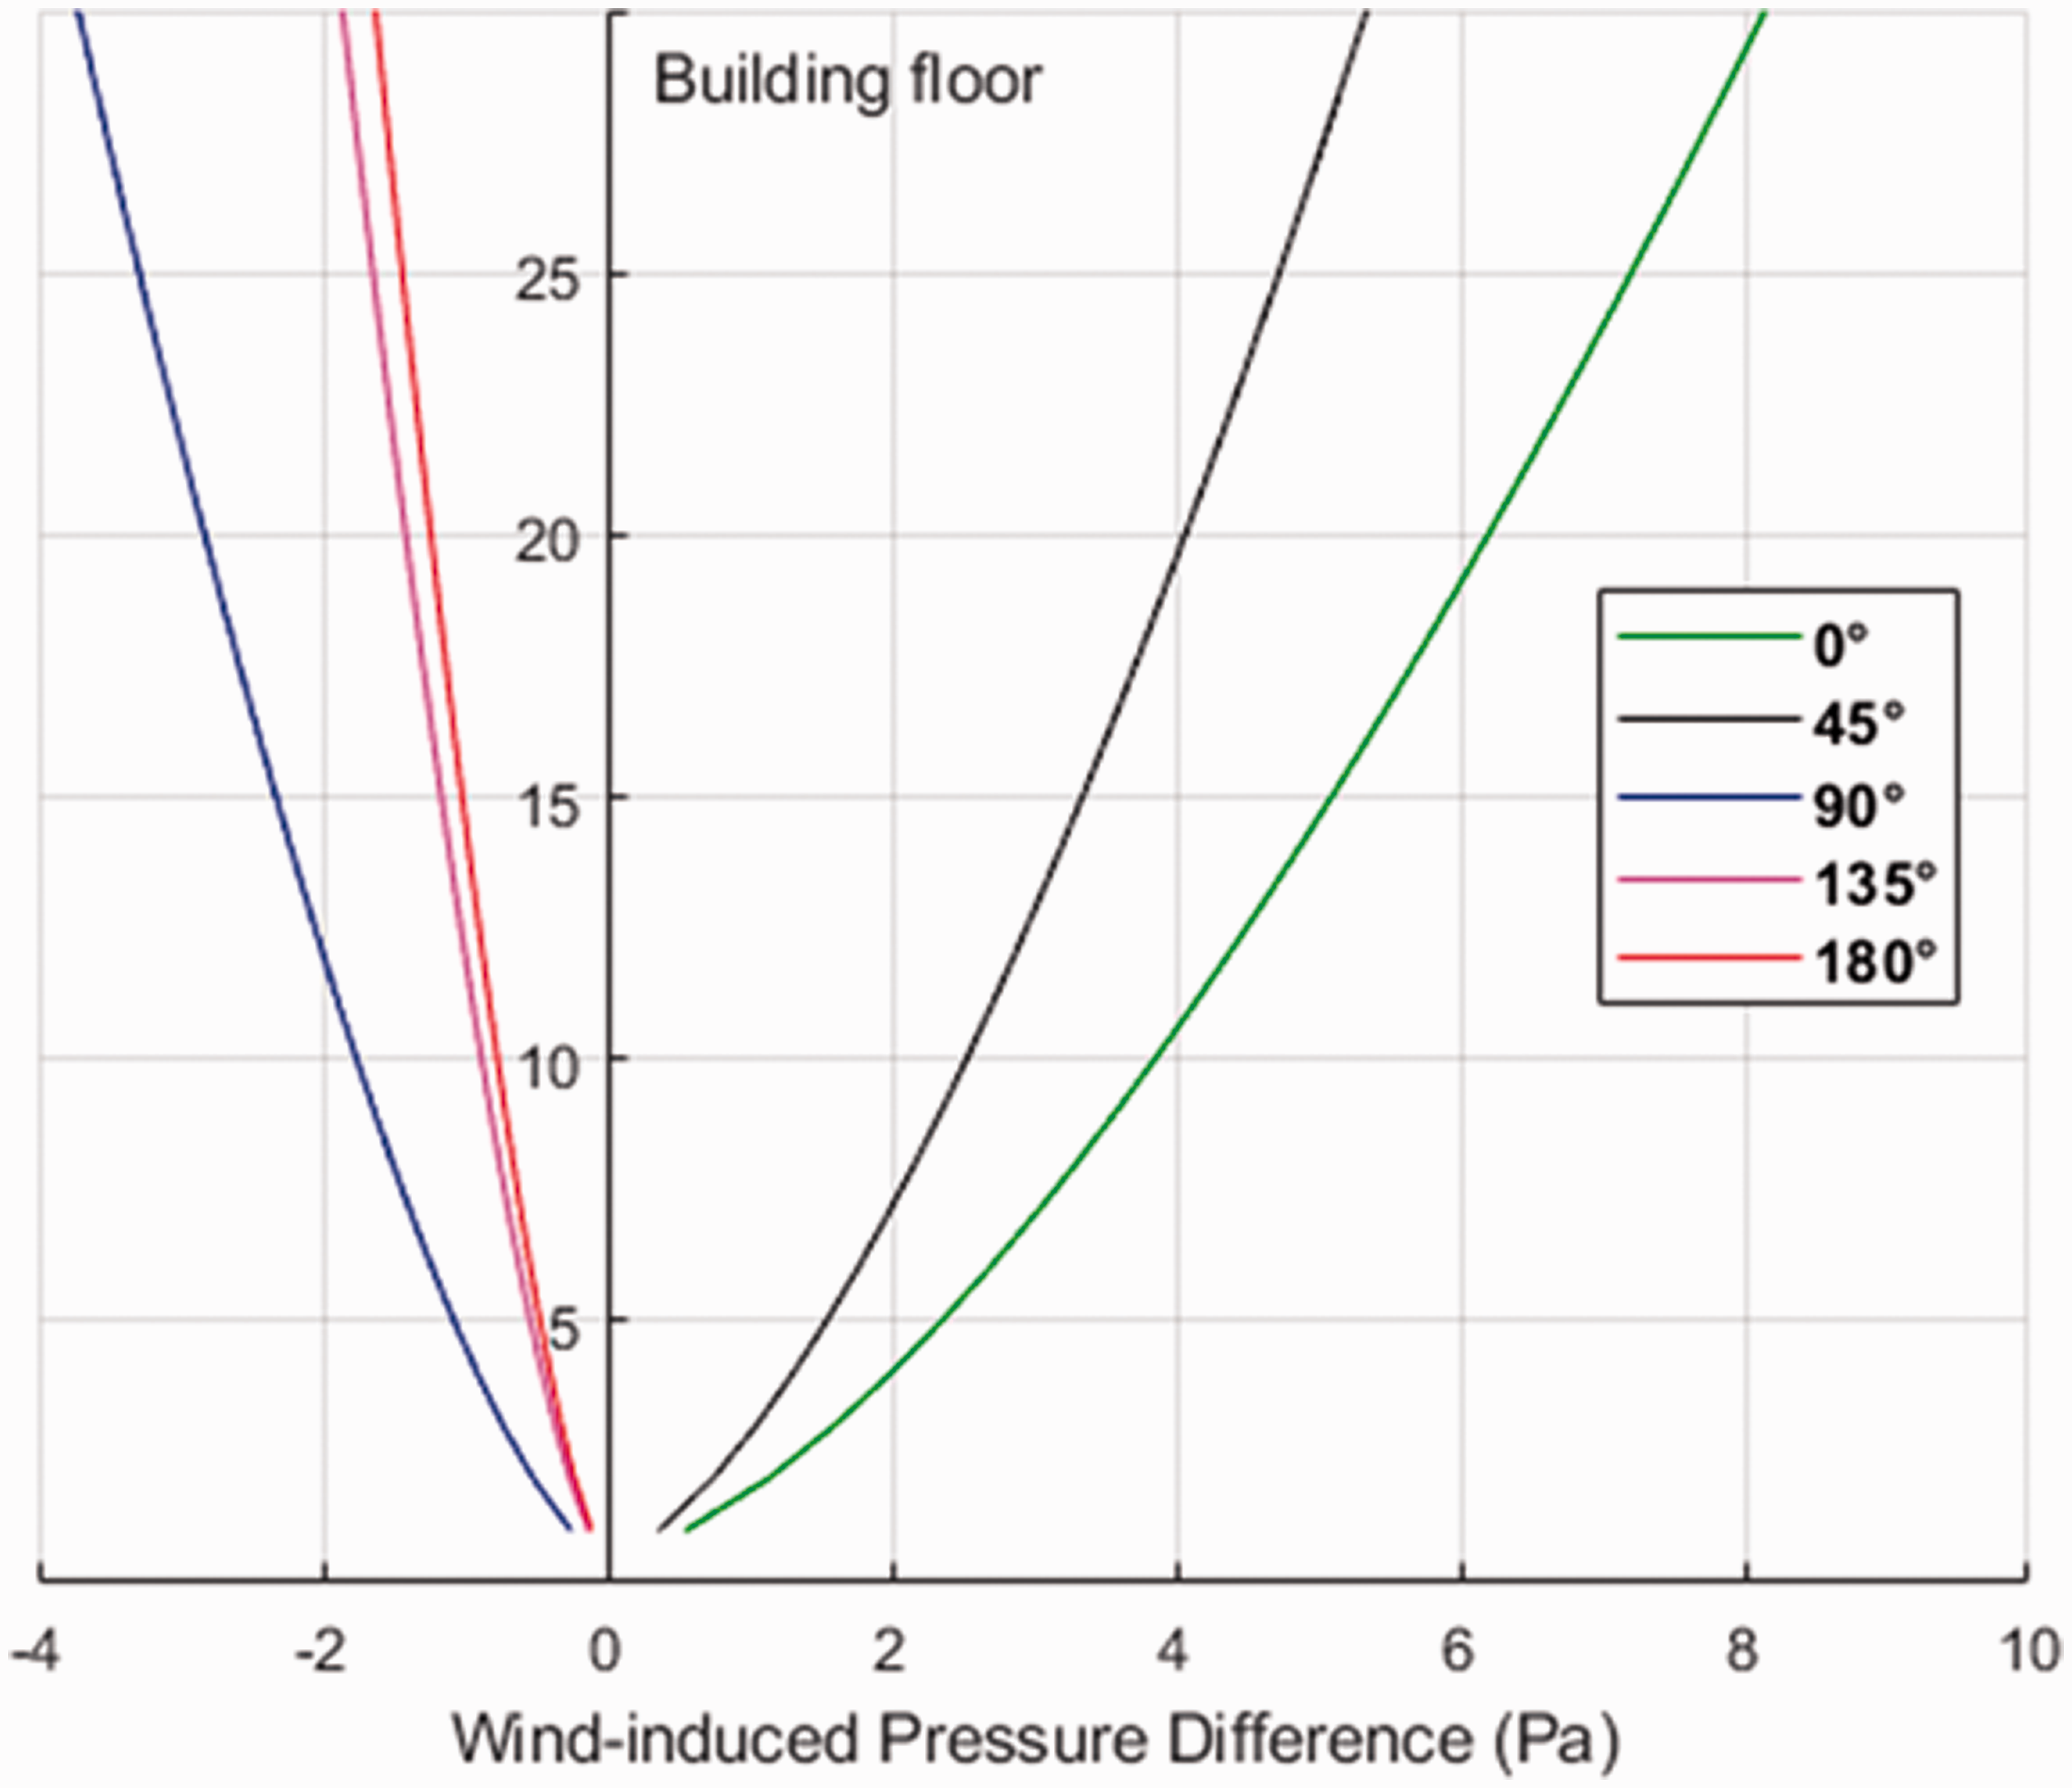
The impact of the wind direction on the wind-induced pressure difference when Umet = 4.1 m/s.
The impact of the neutral pressure level NPL on the pressure difference between indoors and outdoors
Figure 7 displays the impact of the NPL on the stack-induced pressure difference when the wind direction was perpendicular to the south facade of the building. These results show that the NPL height had a significant impact on the stack-induced pressure differences on each floor of the building, and it also affected the height of the transition point. When the NPL location was changed from 30% to 70% of the building height, the stack-induced pressure difference fluctuated around 140% on each floor. Based on the results of simulations, the temperature difference did not impact on the fluctuation of the pressure difference on each floor. However, the pressure difference was increased on the lower floor and was decreased on the upper floor if the indoor air temperature was higher. Otherwise, it decayed on the lower floor and rose on the upper floor. Moreover, the transition point occurred at around the 10th floor, 15th floor and 22nd floor if the NPL was set at 30%, 50% and 70% of the building height, respectively. 24
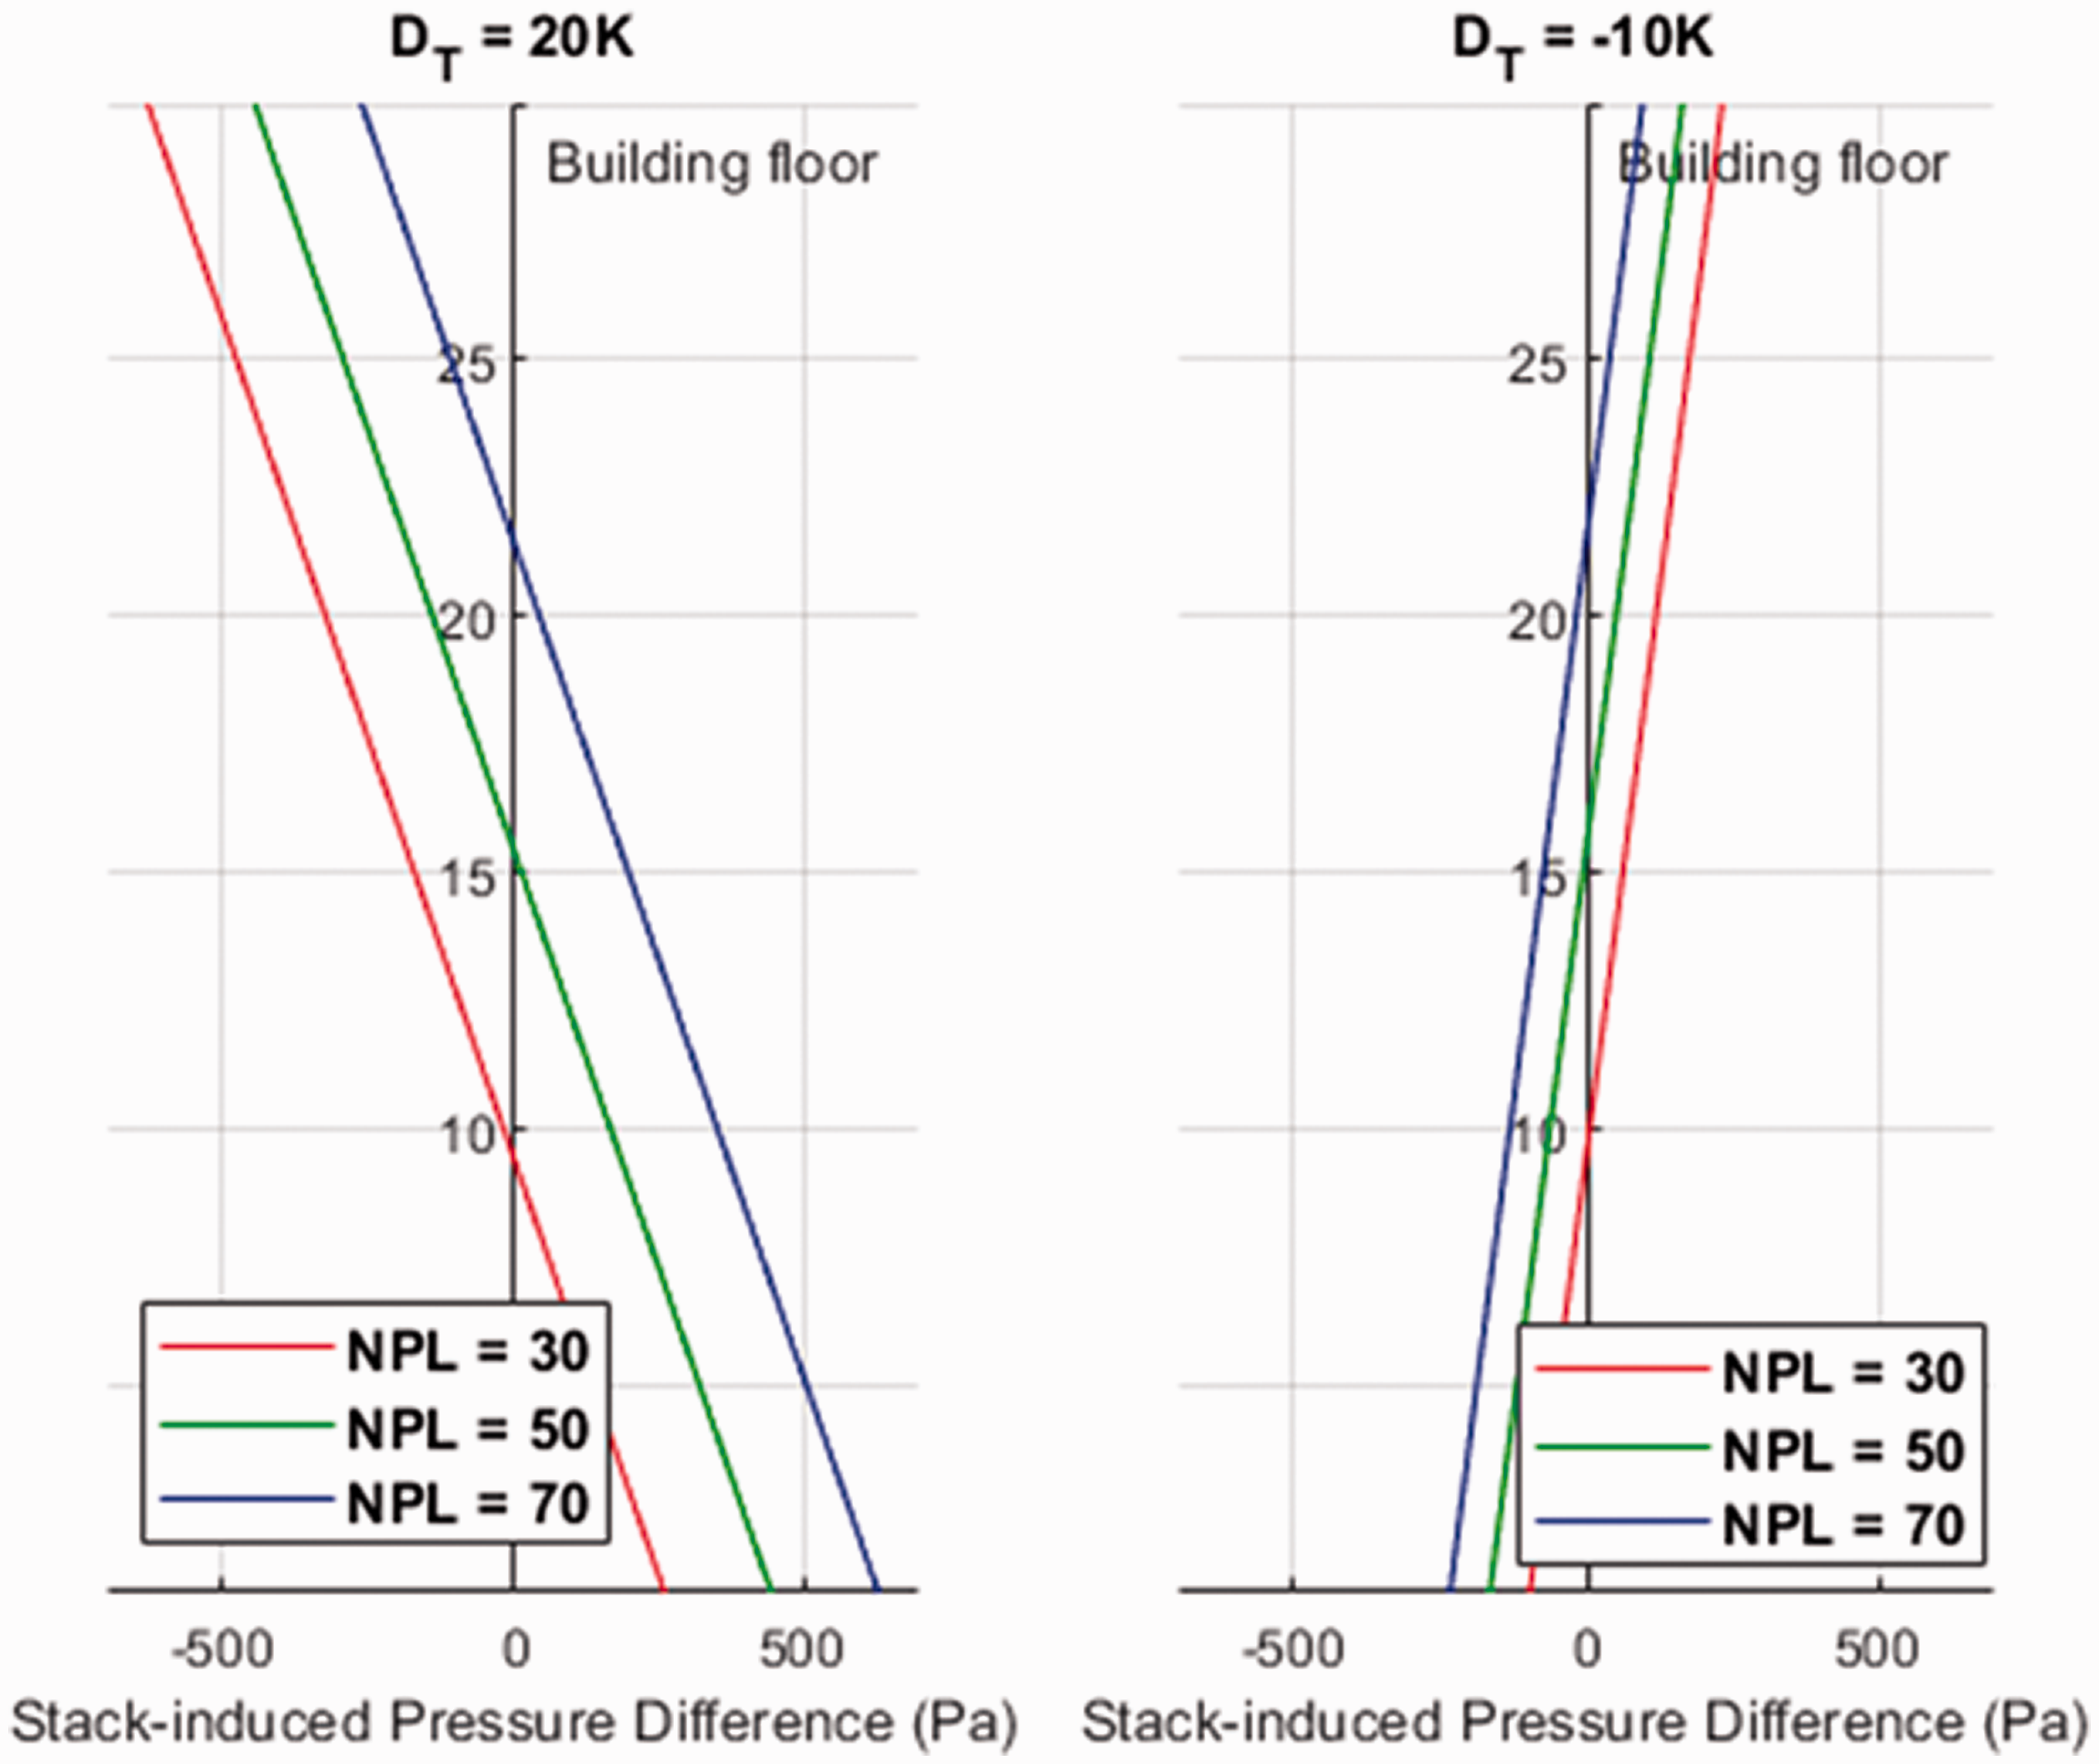
The variation law of stack-induced pressure difference along with the building height under different NPL when wind direction is perpendicular to the south façade of the building (θ = 0°).
Numerical prediction of indoor PM2.5 concentration
Over the past decade, vertical particle profiles on high-rise office building facades have been focused on by researchers.33,54–59 Generally, the outdoor airborne particle concentration would decrease with the rise in height. Furthermore, several studies indicate that the outdoor particle concentration shows a stronger apparent decreasing trend with the height in open areas than in urban areas.33,57 The outdoor particle level's vertical pattern is influenced by many factors, such as atmospheric stability, ambient meteorological conditions and the surrounding environment.54,58,60,61
In this study, a case study was conducted to investigate the difference in outdoor PM2.5 and indoor concentrations between the top floor and the ground floor of a single tall building in Suzhou. The concentration of PM2.5 was decreased significantly on the top floor throughout the whole year, which is coincident with results determined by previous studies.33,57,59 On the 12th floor (62.6 m), the averaged PM2.5 concentration was decreased by 8.4% (3.7%–12.3%), 23.4% (20.5%–34.3%), 17.1% (15.7%–20.9%) and 16.7% (12.2%–23.4%) over four measured periods. In contrast, Liu et al. 33 investigated the vertical profile of PM2.5 based on a 100 m height office building in an urban area and a mountain in the forest park in Nanjing over four seasons. They reported that, at 65 m, the averaged PM2.5 concentration decayed 28.1%, 30%, 27% and 15.5% in the forest park, and –0.6% (the PM2.5 level was increased by 0.6% compared with the ground floor), 20%, 16.1% and 10.7% on the urban area over four seasons. The measured result of this study was between the value measured in the urban area and forest park. Thus, the results measured in this study show a good agreement with reference data since the test office building in this study is located in a relatively open space, as well being near a pedestrian road.
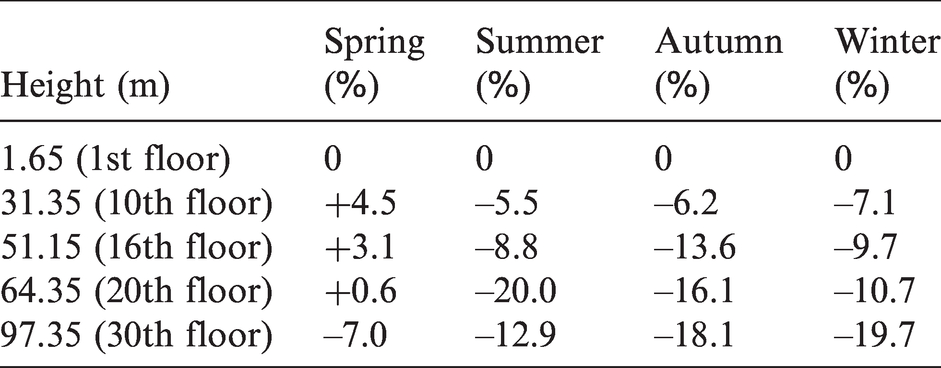
Furthermore, Nanjing is very close to Suzhou, and thus the results reported by Liu et al. 33 can be used as a benchmark for investigating the IAQ on each floor of a 100 m tall building. As introduced in the background section, the outdoor PM2.5 concentration was reduced at the top floor in both spring and autumn, while the maximum outdoor PM2.5 level occurred at around 10 m and 25 m in spring and autumn, respectively. Such a phenomenon might be due to the impact of buildings in the surrounding environment, such as the roadside trees, emission sources and surrounding building heights.33,59,62 However, in both summer and winter, the outdoor PM2.5 level generally decreased with the building height. Based on the results reported by Liu et al., 33 the seasonal vertical profiles of the outdoor PM2.5 level around the building in this study are presented in Table 1.
The seasonal vertical profiles of outdoor PM2.5 level on the south façade of the building. 33
Variation law of IAQ in a high-rise building
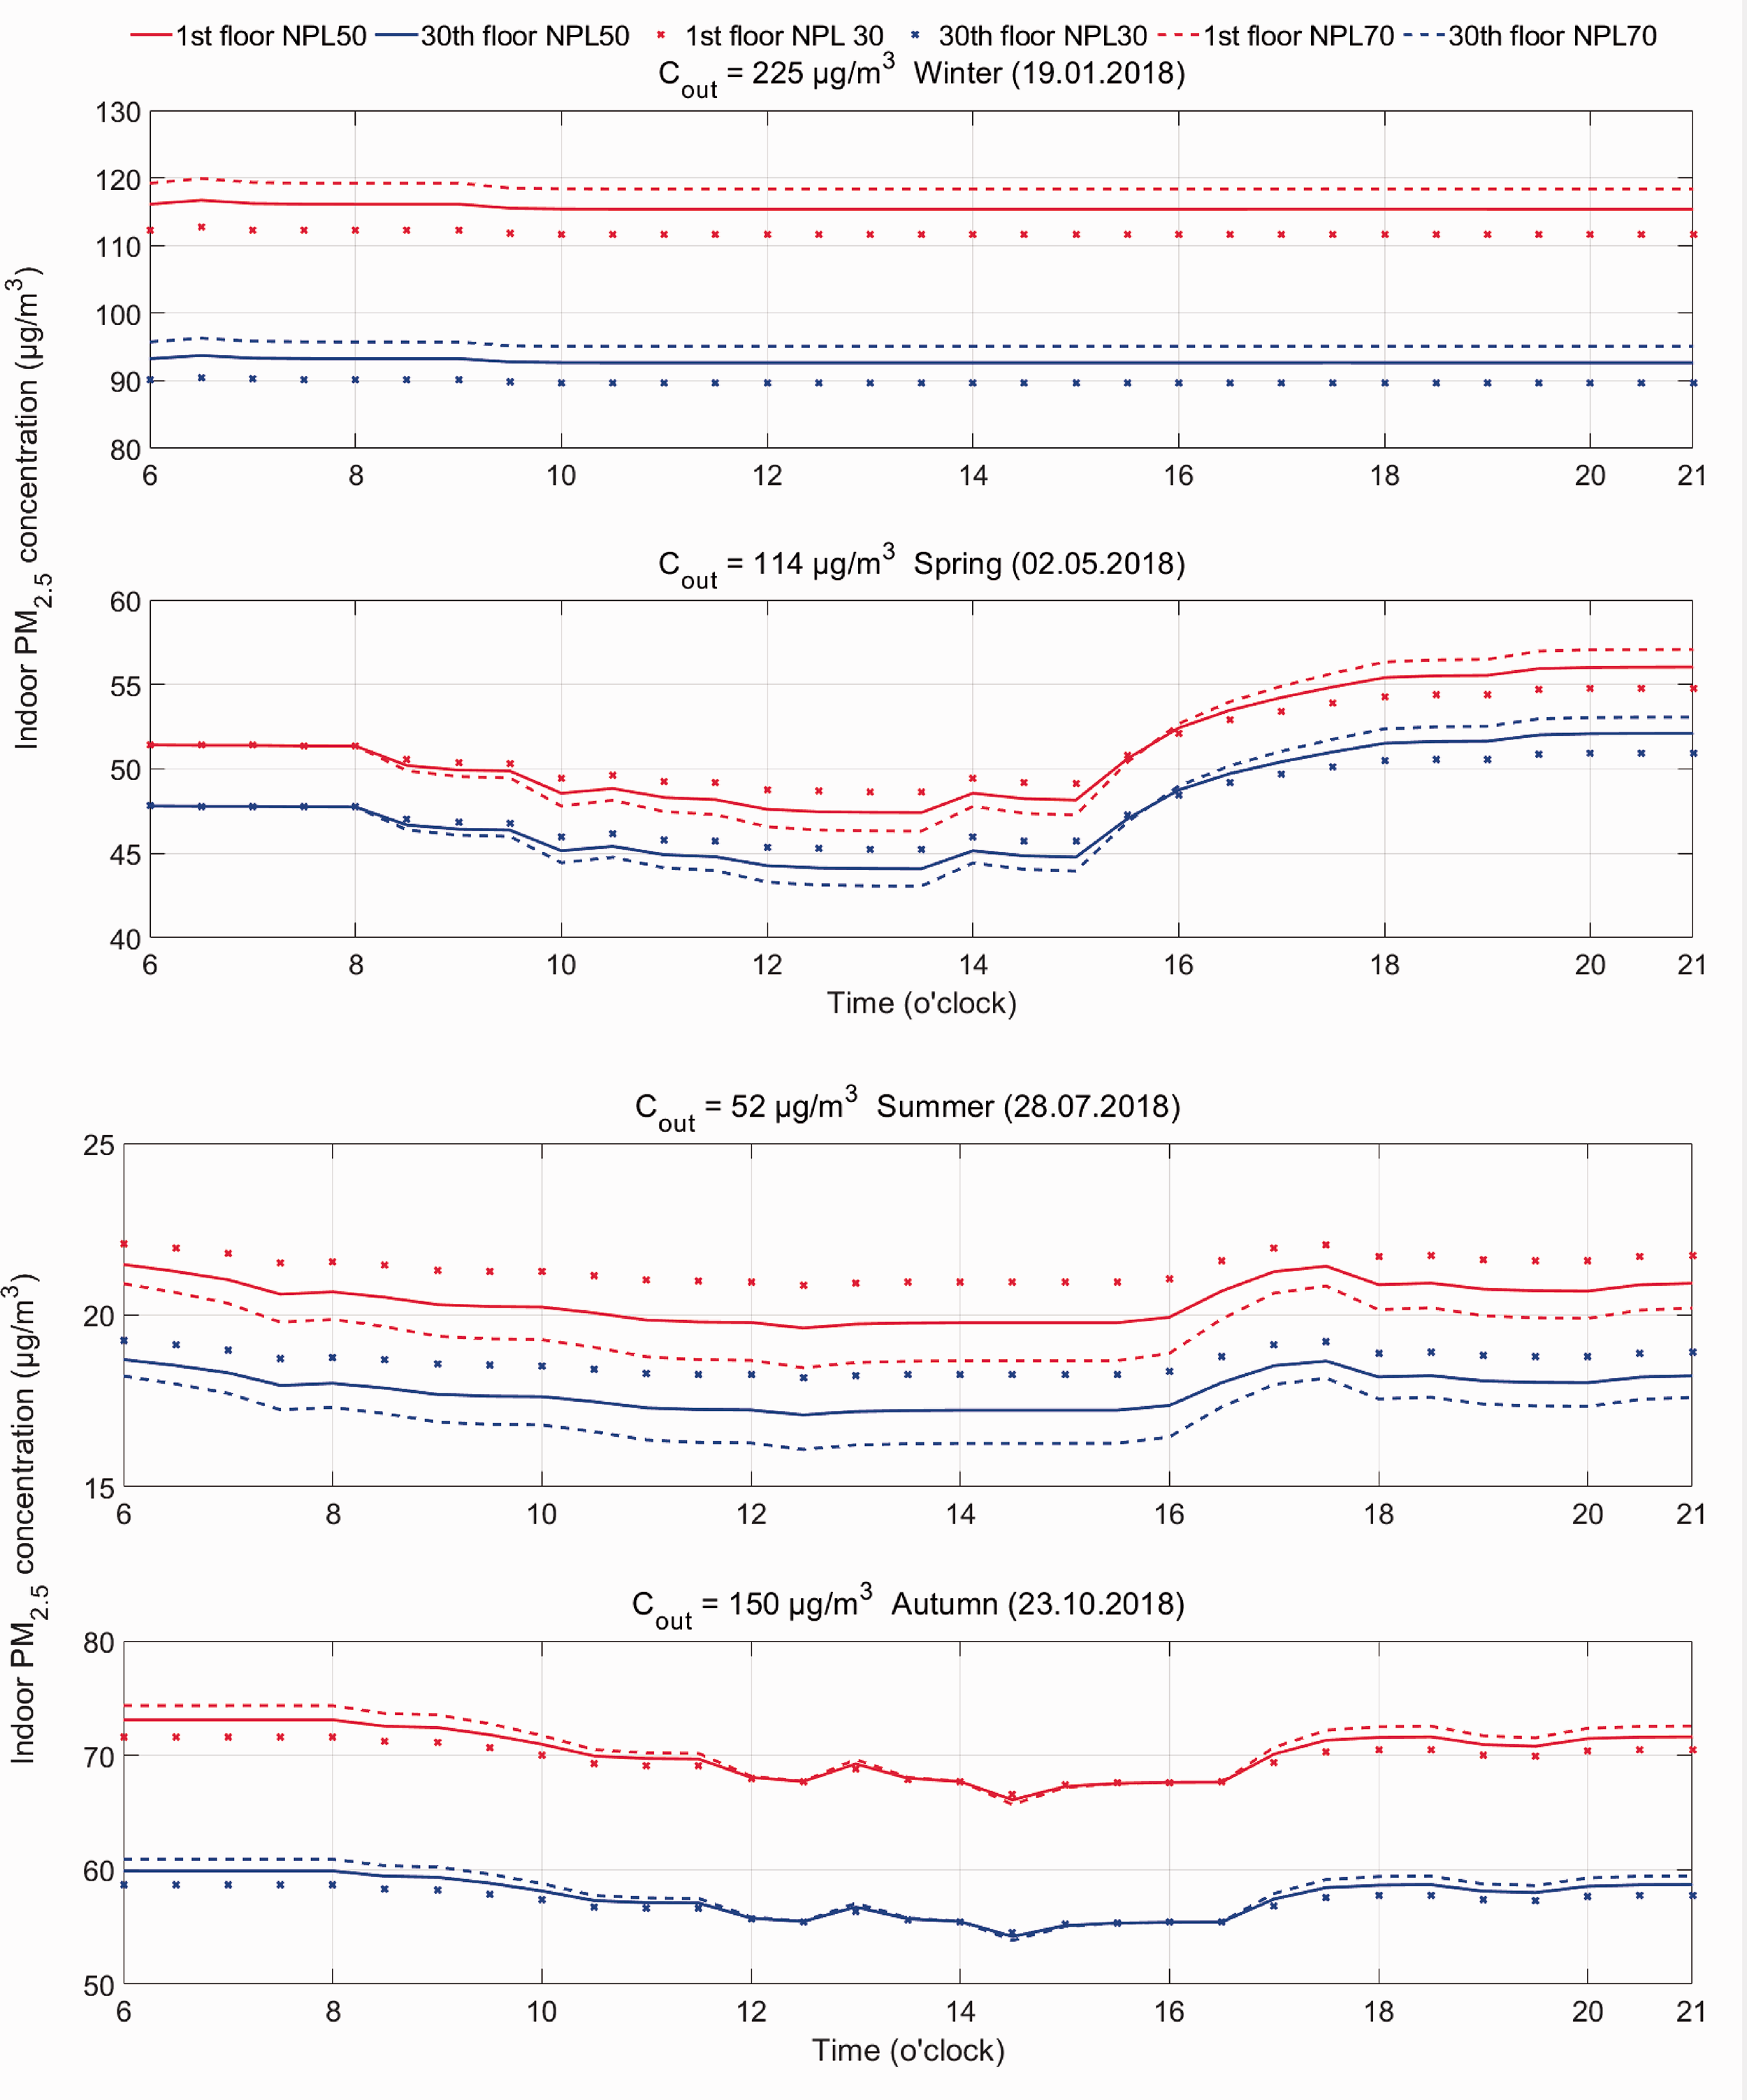
By applying the proposed air infiltration rates on each floor of a building, the hourly variation of indoor PM2.5 concentrations on four selected specific days in 2018 were simulated. The four selected days were 19th January, 2 May, 28 July and 23 October, and the daily average outdoor PM2.5 levels for these four days were 199.1 µg/m3, 47.6 µg/m3, 51.5 µg/m3 and 72.1 µg/m3, respectively. All input variables used in the simulation are listed in Table 2.
Parameters investigated for indoor PM2.5 concentration.

According to the occupancy diversity factor, 31 an office building's working hours are generally between 06:00 and 21:00. Thus, this study mainly focused on the indoor PM2.5 concentration during working hours, and the results are displayed in Figure 8. Moreover, Figure 9 displays the value range of indoor PM2.5 concentrations on five selected floors of the case study building. Figure 9 shows that the IAQ in the building was the best during summer, followed by spring, autumn and winter. In general, the indoor PM2.5 concentration showed a continuous decrease with the height in both summer and winter. However, a fluctuation was determined during spring and autumn since the outdoor particle level's vertical profile did not steadily decrease with the height. Furthermore, the indoor PM2.5 level showed 7.0%, 12.9%, 18.1% and 19.7% attenuation at the top floor when the season changed from spring to winter. The decreasing trend is the same as the outdoor PM2.5 vertical profile, and the results indicate that outdoor air pollutants have a significant impact on the IAQ. 63
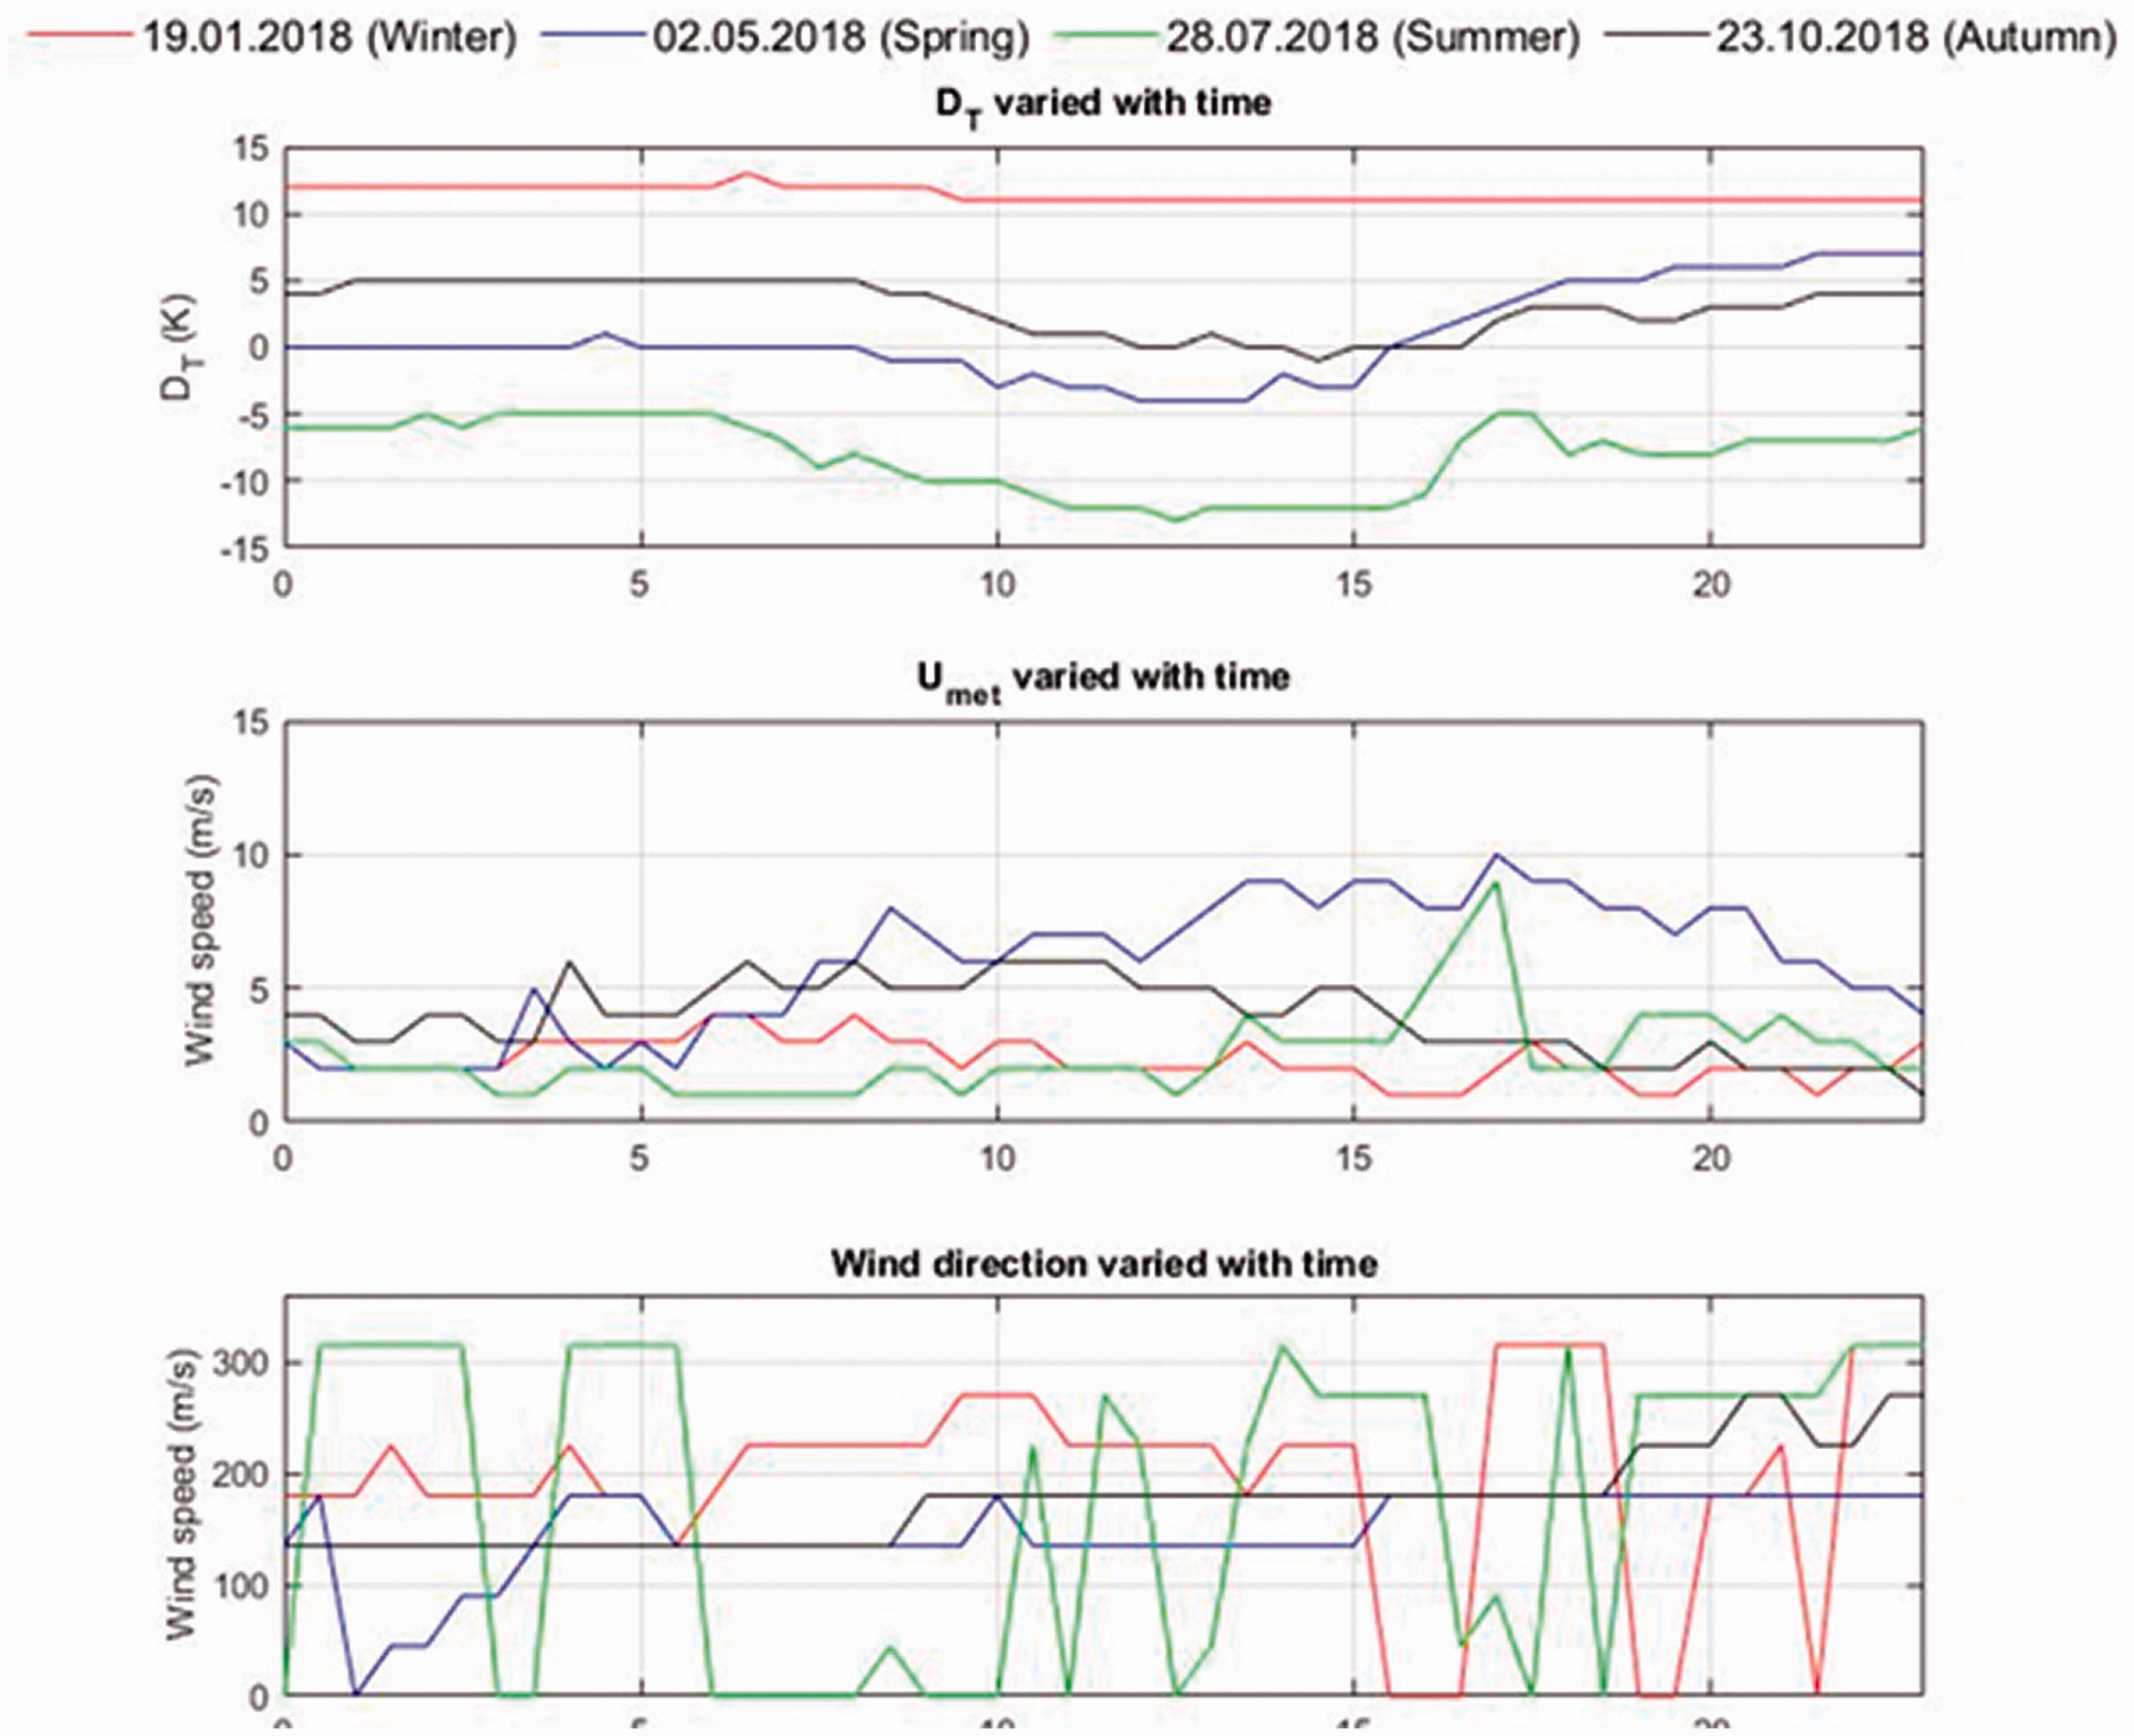
The hourly variation of outdoor meteorological conditions on four selected days. (DT = indoor air temperature – outdoor air temperature).
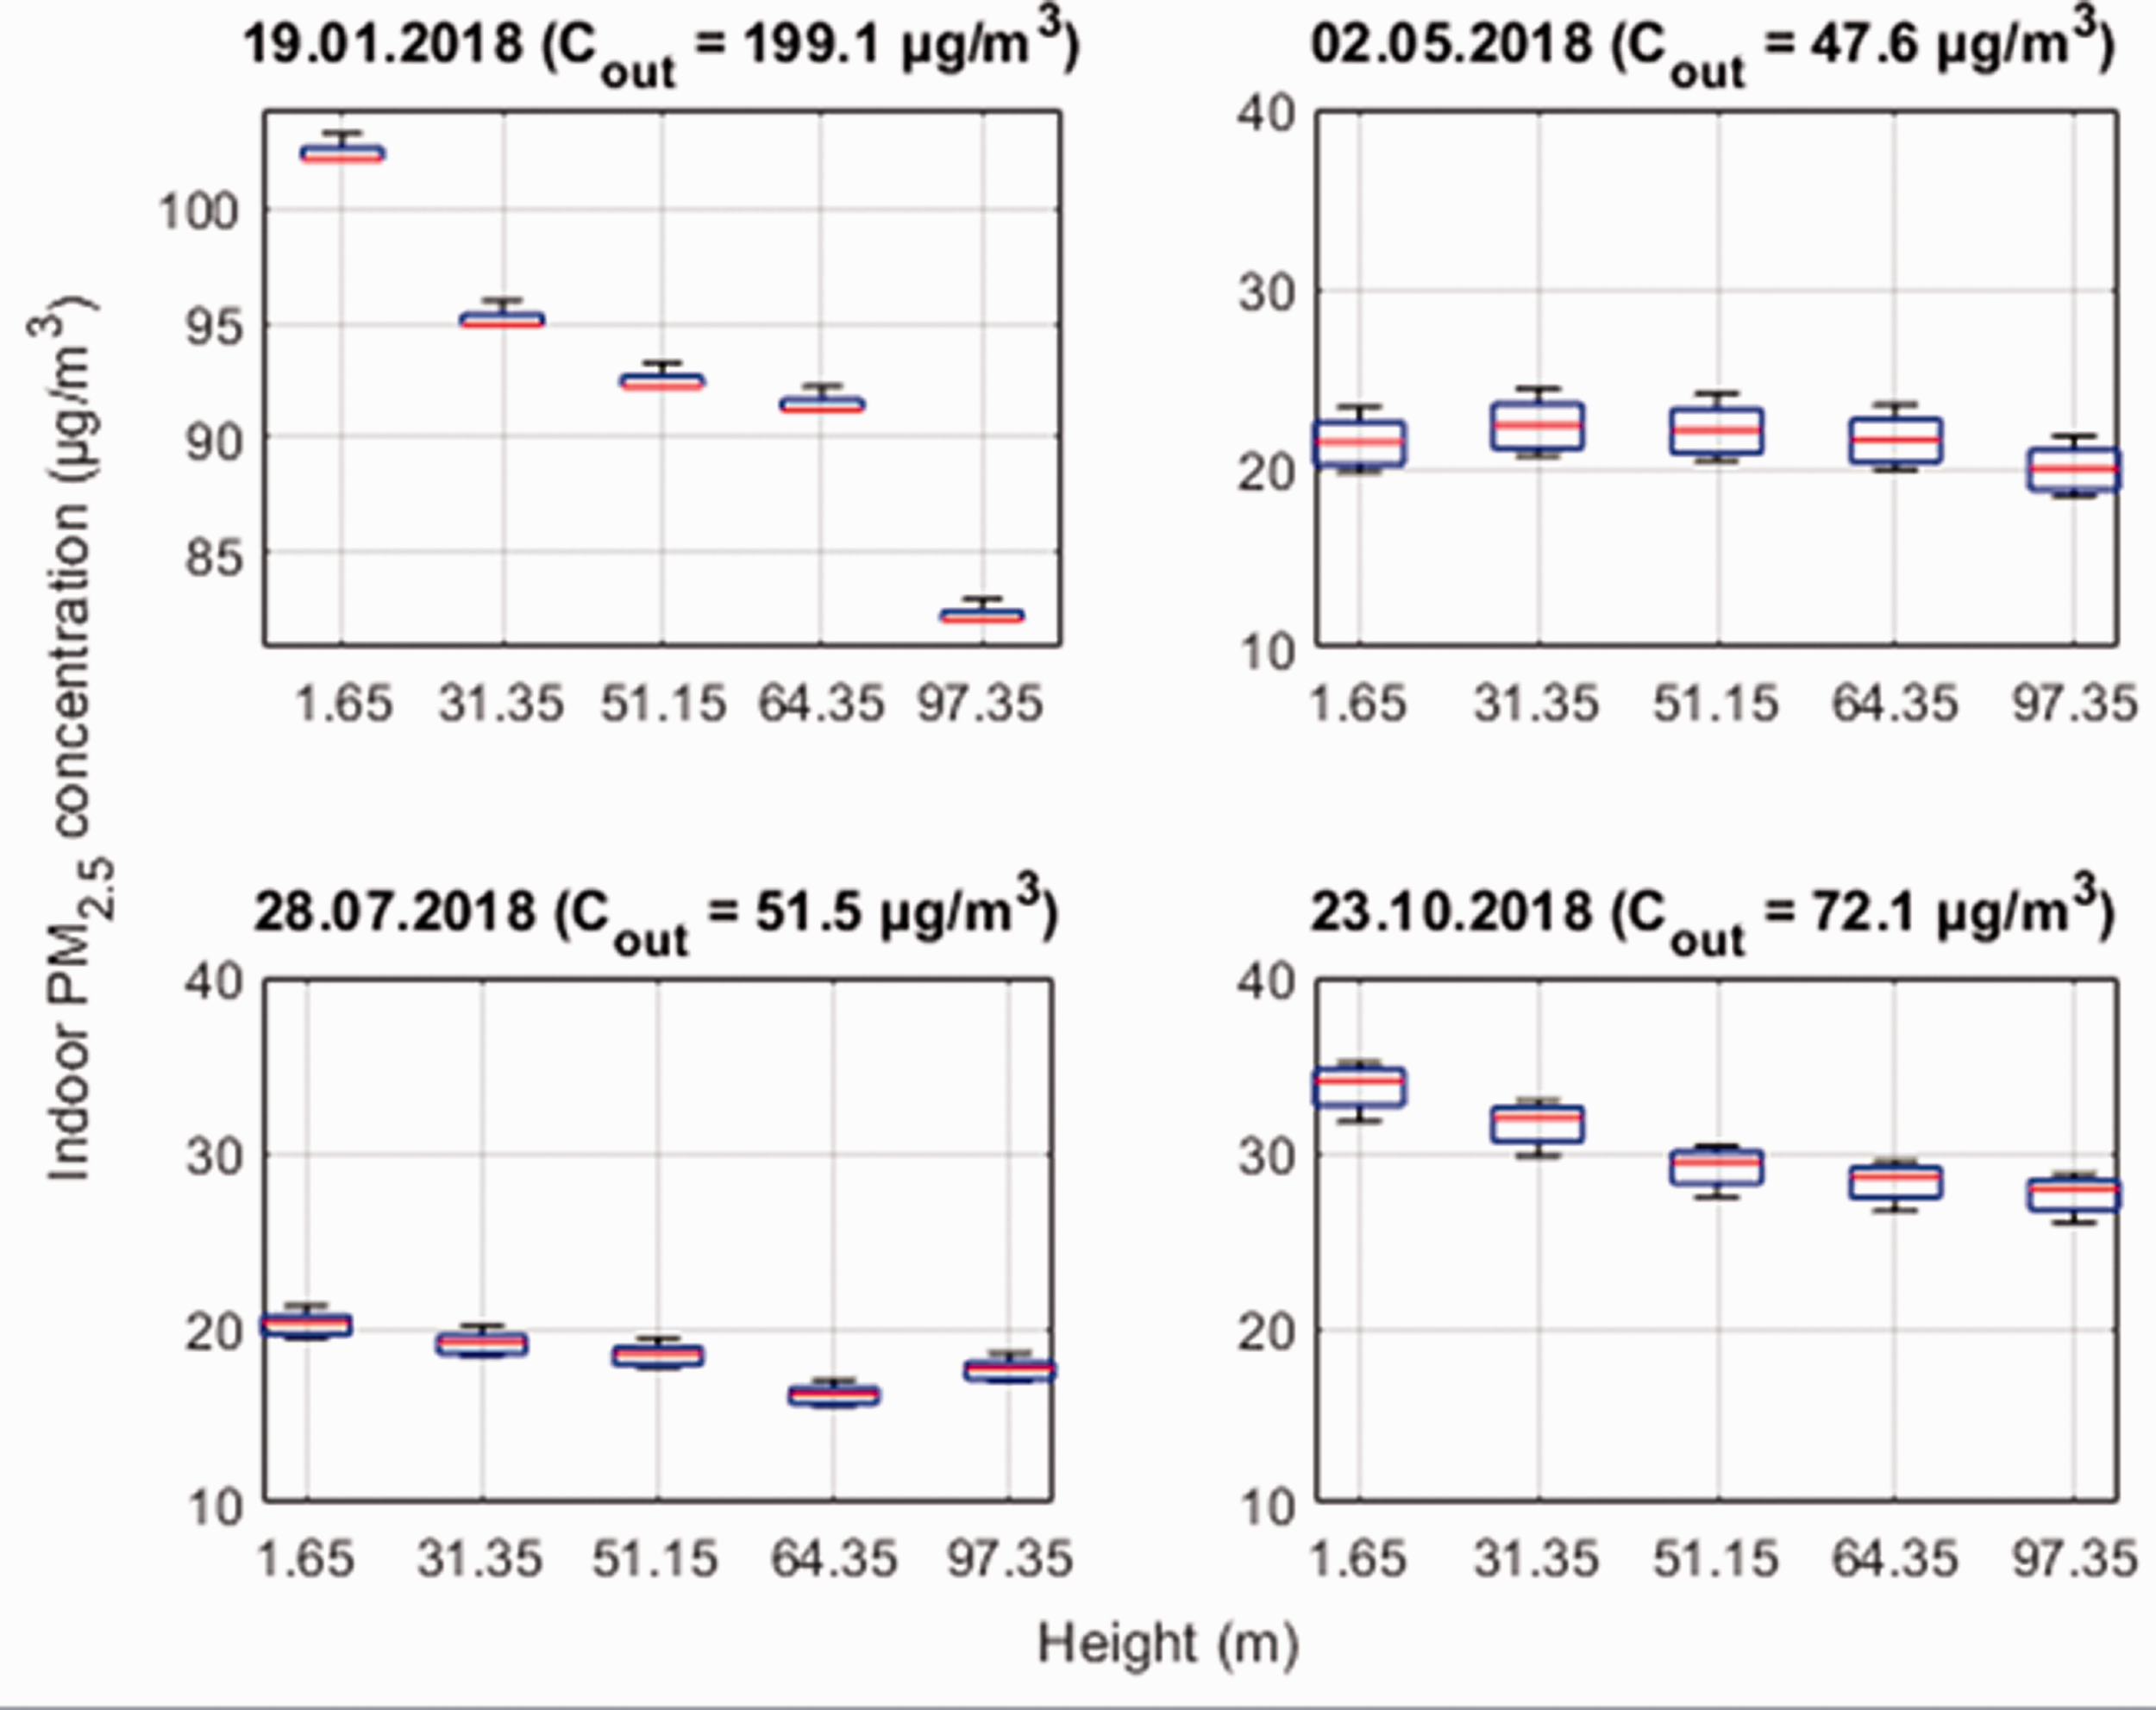
The value range of indoor PM2.5 concentration on five selected floors (in order from left to right is 1st, 10th, 16th, 20th, 30th floor) between 6:00 and 21:00 in four seasons when NPL locates at 50% of the building height (the five horizontal lines for each box in order from top to bottom: maximum value, 3rd quartile, median, 1st quartile, minimum value).
According to Figure 9, the median line approximately coincides with the 25th percentile and the minimum value line on 19 January. This indicates that the indoor PM2.5 level reached the steady-state quickly due to the significant and stable stack-induced pressure difference between indoors and outdoors. Moreover, the minimum indoor particle levels on the four selected days occurred when the stack-effect was at its maximum, while when the stack-effect was at a minimum, the concentration was maximal. In addition, the range of indoor PM2.5 concentrations was wider in the transition seasons. One reason is that the impact of wind-effect on the air infiltration rate was relatively higher in these two seasons due to the lower stack-effect. The result in this study indicates that the dominant driving force of the infiltrating air in a high-rise building was the stack-effect, which is coincident with the previous research findings.25,64
In summary, the IAQ varied evidently per floor of a building, and the outdoor air pollutant level had a significant impact on IAQ in the mechanically ventilated building. The IAQ increased with the building height generally over the year if the outdoor air was contaminated. For the target building in Suzhou, the IAQ was best in the summer, followed by autumn, spring and winter.
Impact of neutral pressure level on IAQ
Figure 10 illustrates that the outdoor air was more heavily contaminated in winter since the PM2.5 level was higher, whereas it was less polluted in both spring and autumn by comparison with summer. In terms of statistics, 34 the daily average outdoor PM2.5 level varied as 15–114 µg/m3, 7–52 µg/m3, 7–150 µg/m3, 11–225 µg/m3 from spring to winter. The extreme cases have been utilized to investigate the impact of NPL on IAQ on both the ground and top floors of the building. Figure 11 presents the variation of IAQ for the location of the NPL rising from 30% to 70% of the building height. In that situation, the average indoor PM2.5 level was increased by around 0.3%, 2.5%, 6.0% on each floor in spring, autumn and winter, respectively. A different phenomenon was found during summer when it decreased by around 7.5% on each floor of the building. Overall, Figure 11 shows that the location of the NPL was negatively correlated with the indoor particle level if the air temperature is higher indoors. In contrast, it had a positive impact on the IAQ in buildings during summer.
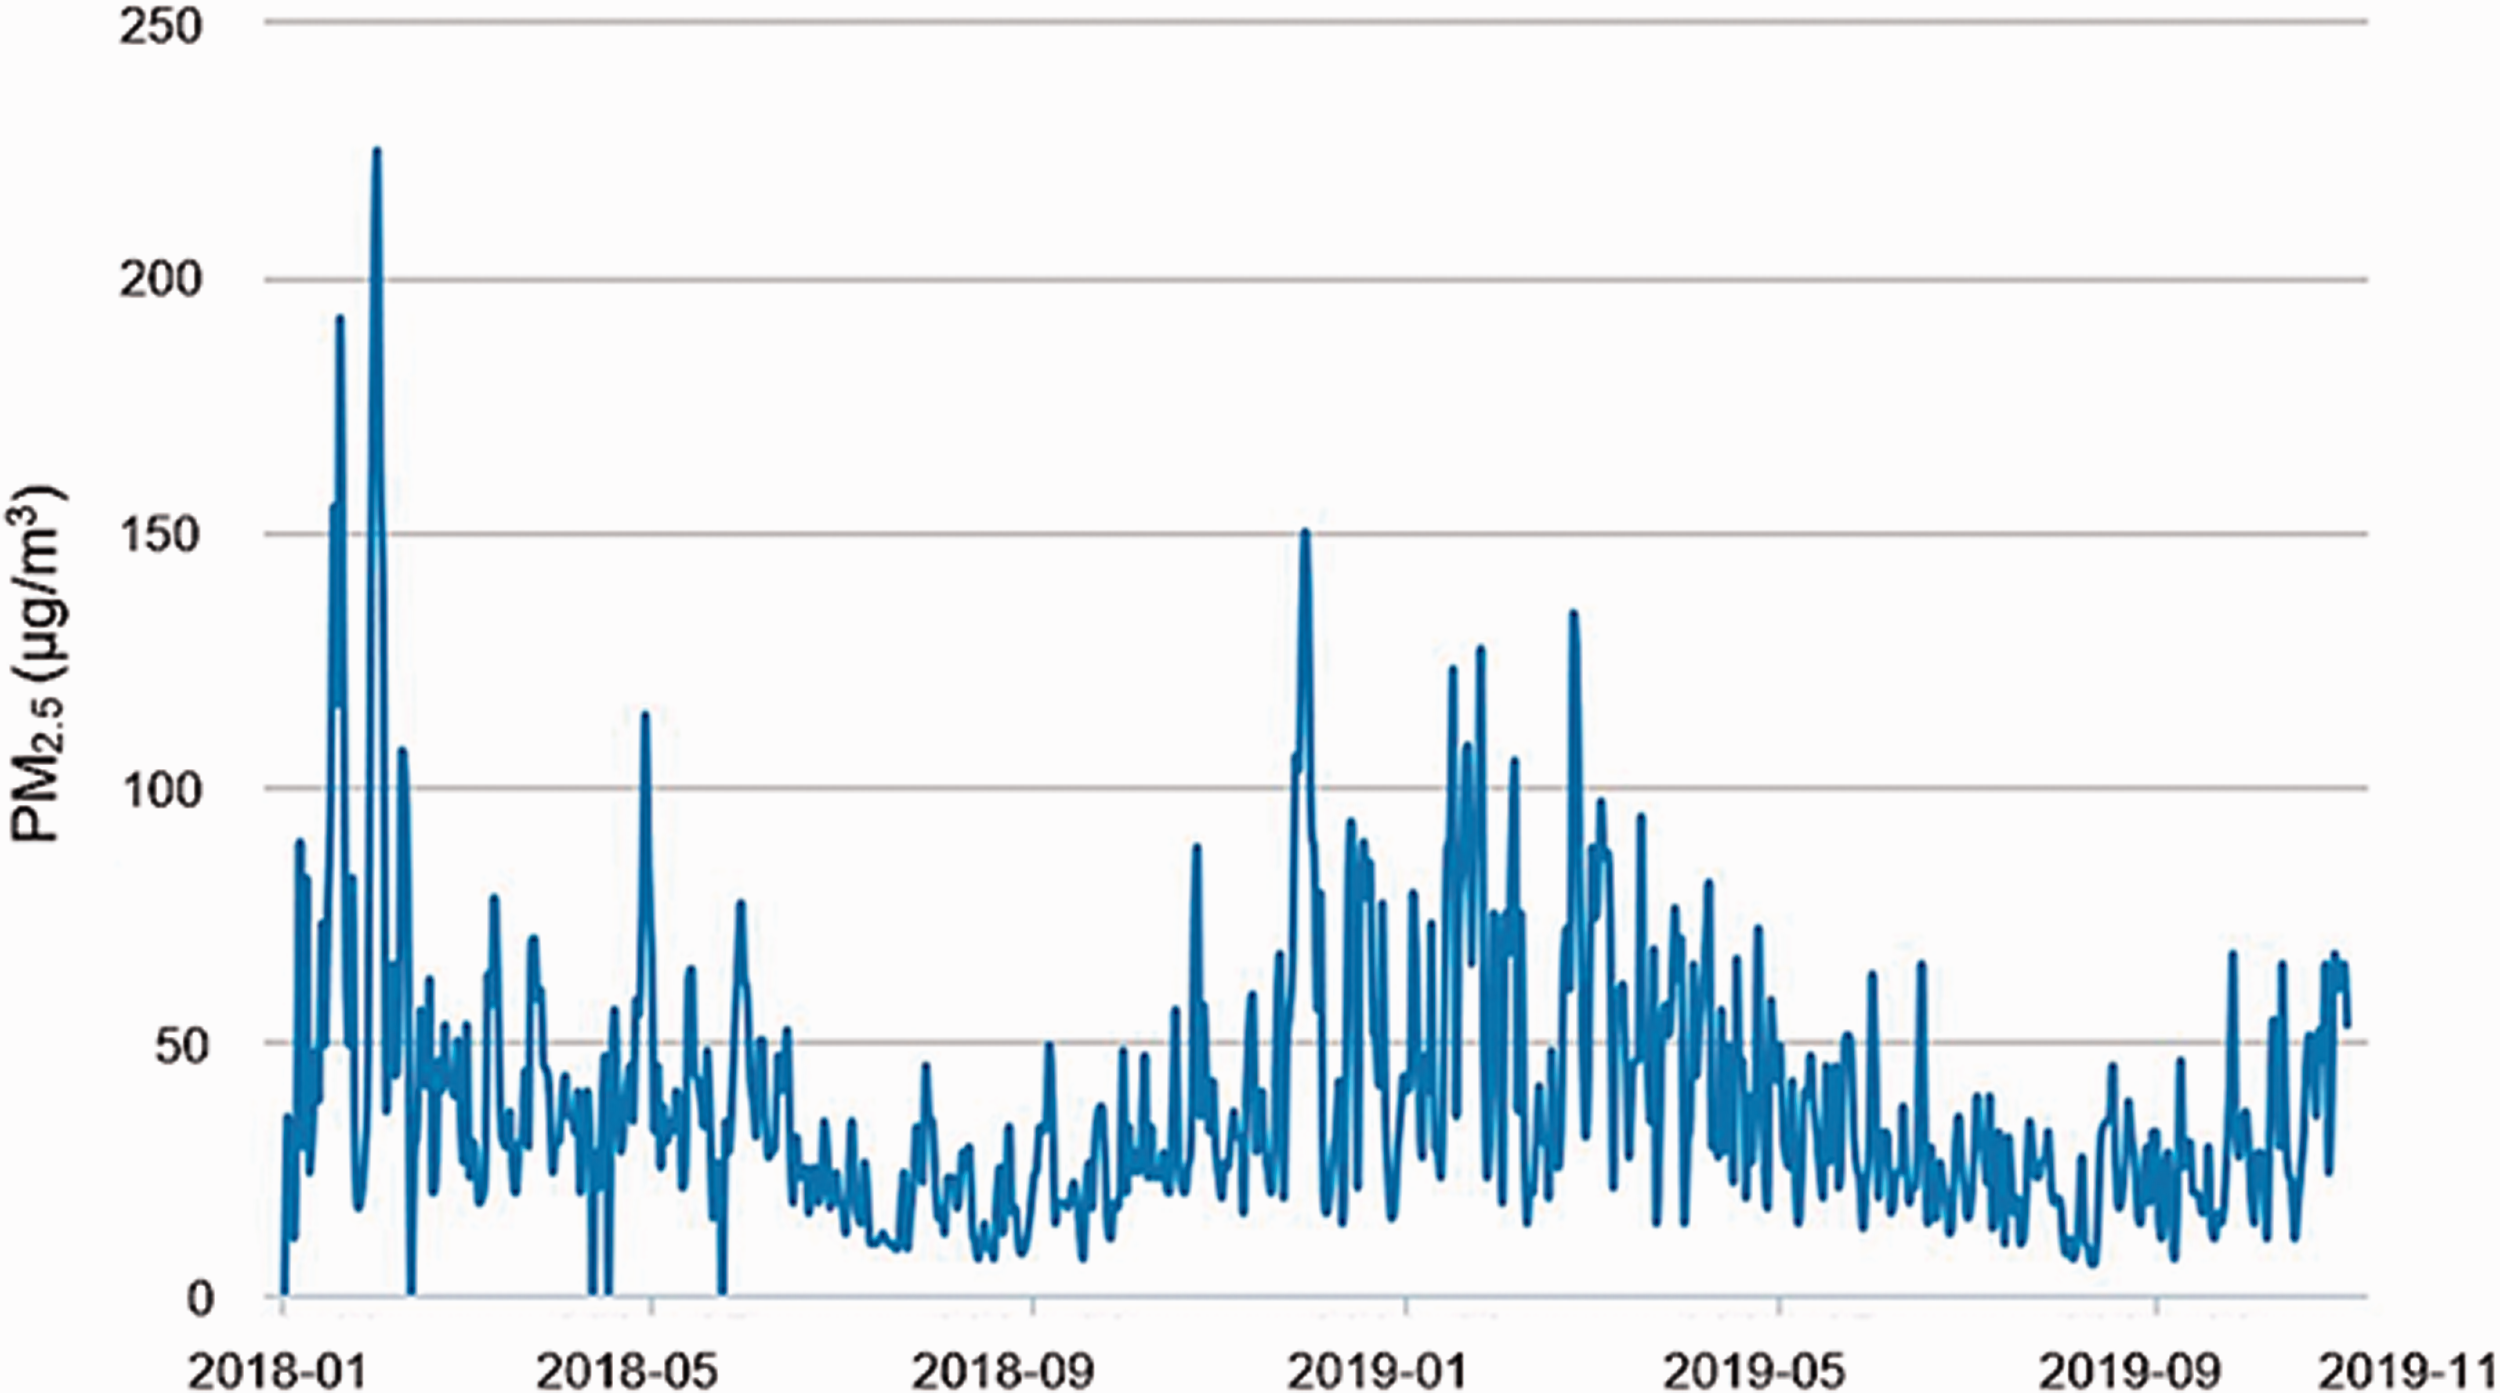
The daily average outdoor PM2.5 concentrations in Suzhou between 1 January 2018 and 1 November 2019. 34
The variation law of indoor PM2.5 concentration on each floor if the location of NPL changes.
In summary, the NPL had significant effects on IAQ. The results demonstrate that the PM2.5 concentration peaked in winter. Also, from simulations, the number of occupants suffering from PM2.5 pollution was increased when the indoor air temperature was higher than outdoors, and the effect was worsened with the increasing NPL height. Thus, the conclusion can be drawn that the IAQ was inversely proportional to the NPL if the air temperature was higher indoors, while it was in direct proportion to NPL in summer. Considering the extent of occupants suffering from PM2.5 pollution, the NPL should be maintained at a lower position if the air temperature is higher indoors, whereas a higher position for the NPL is suggested in summer.
The combined effect of air infiltration rate and filter on the indoor particle level
The outdoor PM2.5 concentration in Suzhou ranged between 0 and 300 µg/m3. Furthermore, due to the technological developments in construction and production, buildings that have been built in recent years are generally more airtight than before.65,66 Therefore, four different air infiltration rates, 0 ACH, 0.05 ACH, 0.1 ACH and 0.3 ACH, were selected to represent the well-insulated case, airtight case, typical case and leaky case, respectively.
From the simulation results, shown in Figure 9, occupants' health in a high-rise mechanically ventilated building is a deep concern since the indoor particulate pollution when the outdoor air quality has deteriorated. A suggestion for improving the IAQ in buildings is to install a high-efficiency air filter.67,68 Hence, four air filters with different efficiencies were considered in the simulation. In this study, the filters used had Minimum Efficiency Reporting Value (MERV) 8, MERV 10, MERV 14 and MERV 16. According to the literature review,14,46 the efficiency of removing PM2.5 with these four filters is 32.3%, 35.4%, 78% and 95%, respectively. Figure 12 displays the indoor particle levels’ contour plots, which varied with outdoor air quality and air infiltration rate. In the plots, each graph's red curve represents the limit value of indoor particle concentration, 35 µg/m3, given in the WHO guideline. 29 According to WHO guidelines, the dangerous area above this curve highlights the indoor PM2.5 level that is too high for human health. Figure 12 shows that the indoor air quality was improved along with the use of higher filter efficiency, which is coincident with results reported in Ruan and Rim's work. 10 Furthermore, the results indicate that the indoor PM2.5 concentration can exceed the limit value even in a low infiltration rate if the outdoor air is highly polluted. Using higher MERV rating filters from MERV 10 to 16 can maintain indoor particle concentration within a healthy range for wider ranges of outdoor air conditions. However, the MERV 10 and MERV 14 are not effective enough to control IAQ in buildings if the building is leaky or the outdoor air is highly contaminated. For comparison, when the MERV 16 air filter was utilized in the ventilation system, the IAQ in the building would be in an acceptable range if the outdoor particle level was lower than 200 µg/m3 or the air infiltration rate was lower than around 0.16 ACH. In addition, in some highly polluted cases, one filter system is not enough in Suzhou urban area, and a double-filter system should be considered. 10 Overall, the filters with a higher MERV rating have a better performance for maintaining IAQ in the building.
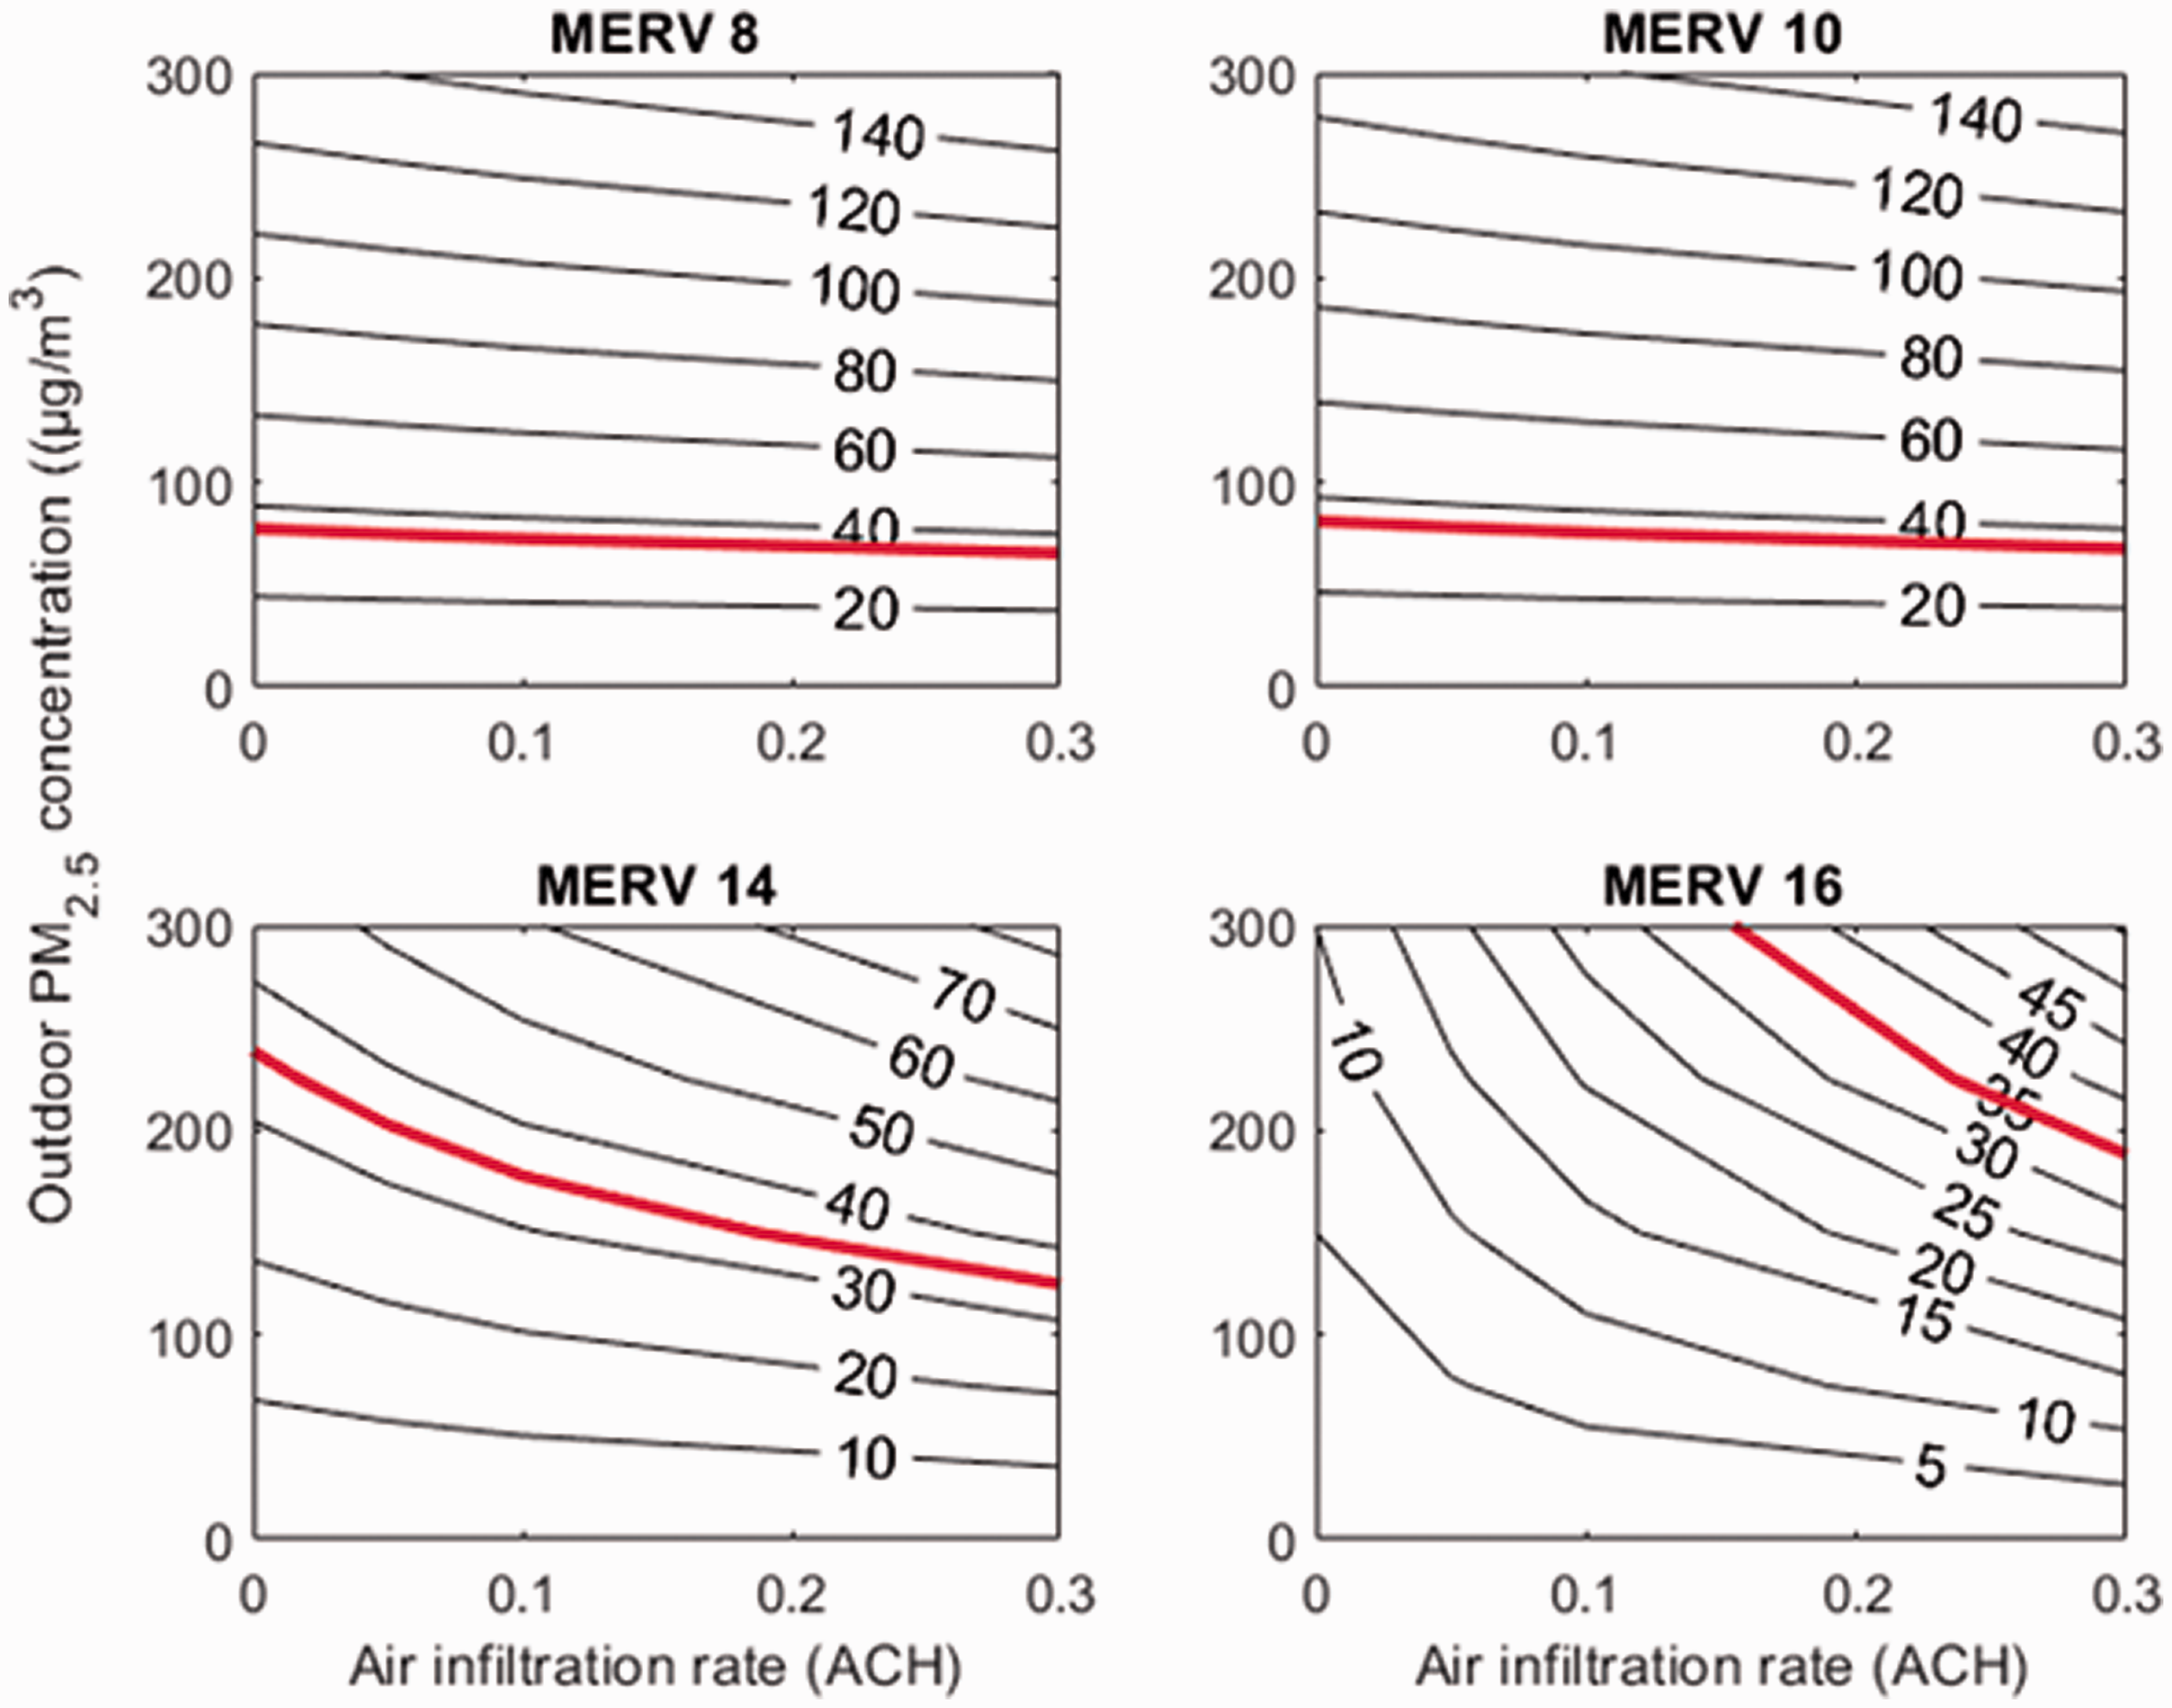
Combined effects of air infiltration rate and filters on the indoor PM2.5 concentration under outdoor concentration from 0 to 300 μg/m3.
The numerical model of the indoor PM2.5 concentration at a steady state
Figure 13 shows that the indoor PM2.5 concentration varied with the air infiltration rate, the filter efficiency and the outdoor concentration. Figure 13 presents that both the impact of the filter efficiency and the air infiltration rate on indoor particle levels are non-linear. If the infiltration rate was increased steadily and equably, the amplification of indoor particle concentrations would be increased if the air filter efficiency was increased. Meanwhile, the proportional reduction of the indoor PM2.5 concentration was decreased with the increasing of the air infiltration rate when the filter efficiency was enhanced. This result reveals that the air infiltration rate can significantly affect the air filter's efficiency.22,45,64 Furthermore, the steady-state indoor PM2.5 level can be described by equation (12), which was derived by the curve fitting method. The relative fitting equation is shown below; note that the corresponding coefficient of determination is R2 = 1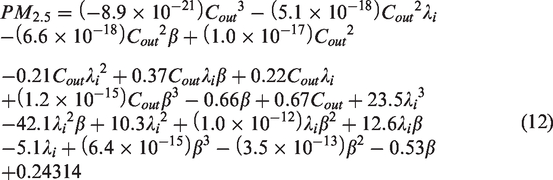
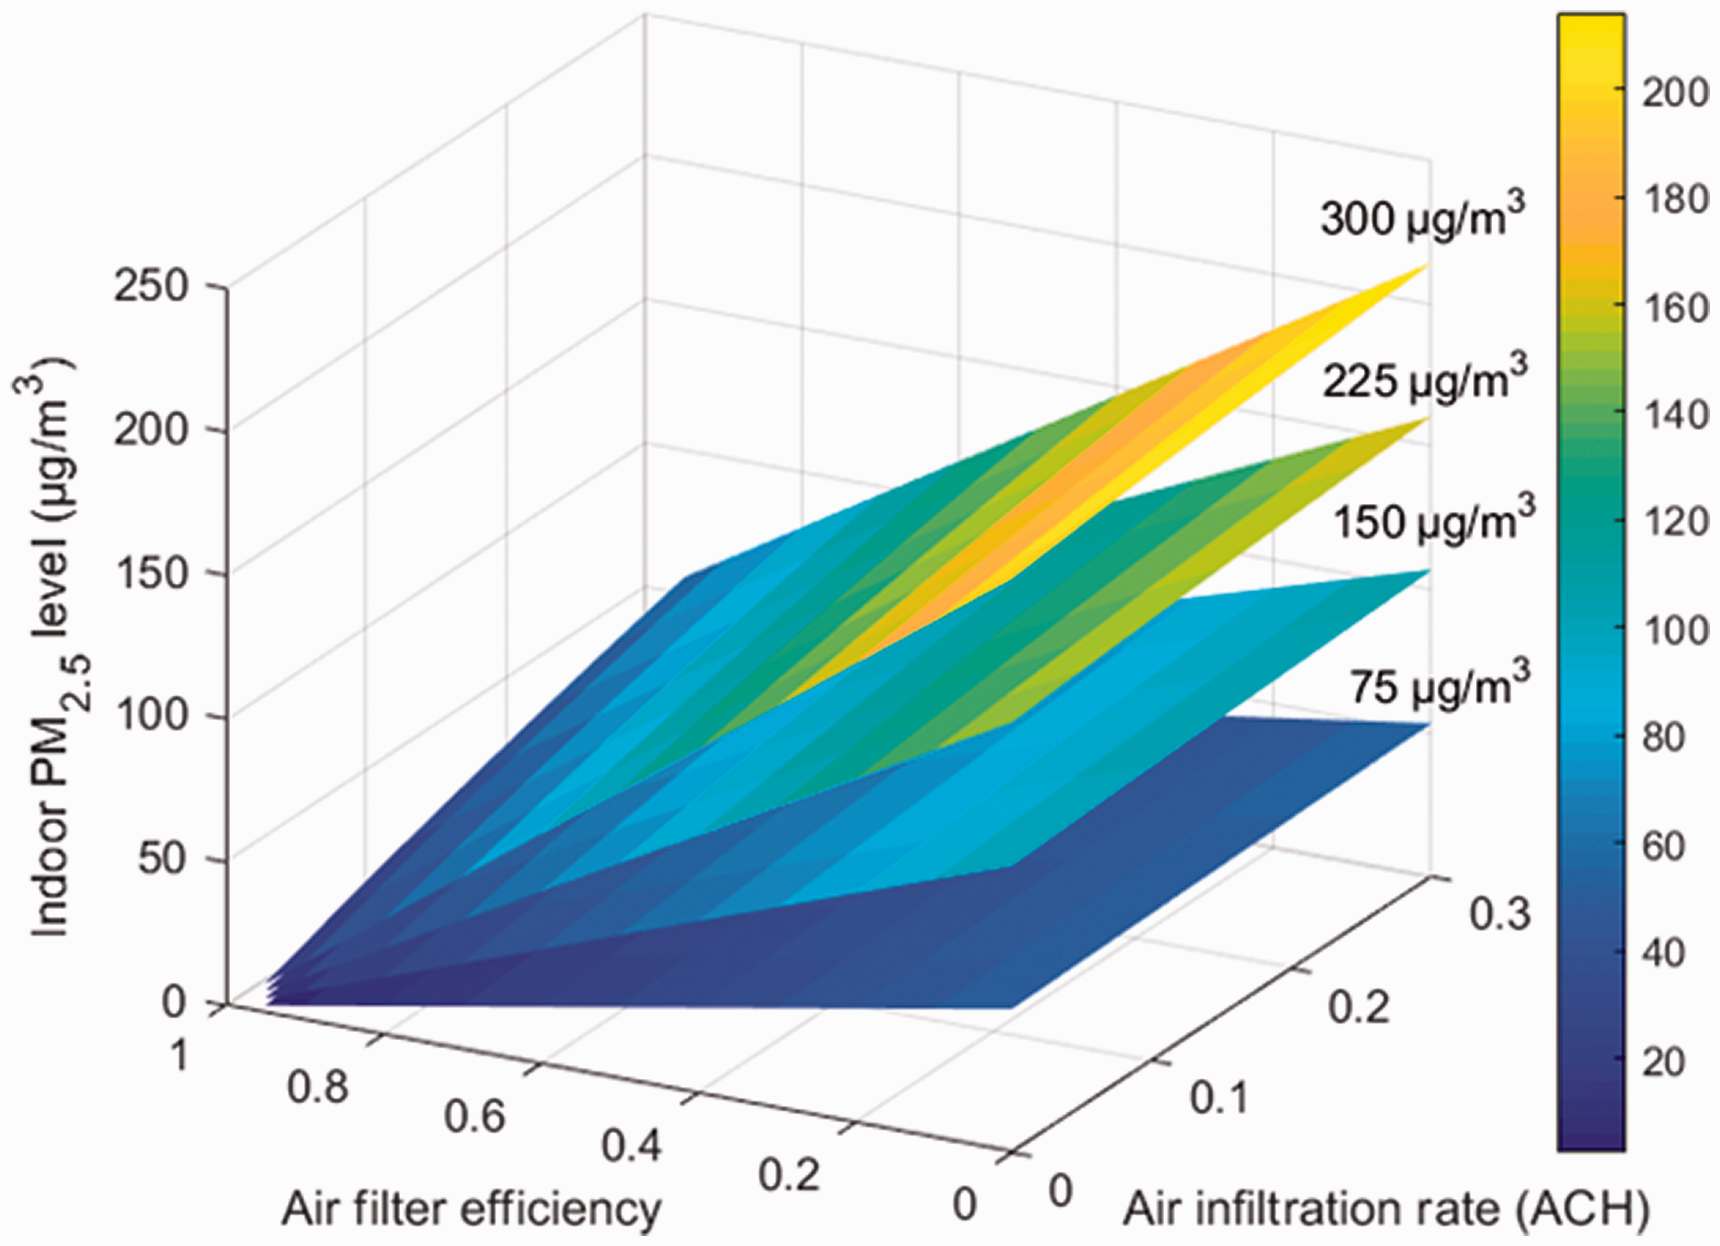
The increasing proportion of indoor PM2.5 levels varied with the air infiltration rate and the filter efficiency. (The four surfaces from bottom to top represented the value range of the indoor PM2.5 concentration under various air filter efficiency and air infiltration rate when outdoor PM2.5 concentration was 75 μg/m3, 150 μg/m3, 225 μg/m3, 300 μg/m3, respectively.)
where PM2.5 is the indoor PM2.5 concentration at the steady-state level in µg/m3, Cout is the outdoor particle level in µg/m3 and
In addition, the model was verified by findings from several previous studies. Ruan and Rim 10 simulated the indoor PM2.5 level with three different air filters in Beijing. The three selected filter efficiencies for removing PM2.5 were 30%, 65% and 95% in their studies. The input data were 1.043 ACH, 0.028 ACH, 0.5 h−1 as the outdoor air ventilation rate, infiltration rate and deposition rate, respectively. Substituting these values into equation (12) yields slightly higher indoor PM2.5 concentrations than the published results. Moreover, Ben-David and Waring 72 investigated the indoor to outdoor ratios of six air pollutants under four ventilation cases in 14 USA cities, considering the factors, including air exchange rate, infiltration rate, meteorological conditions and filter efficiency. When inputting their data into equation (12), the obtained indoor PM2.5 concentrations were also slightly higher than the reported results. This is because the recirculation process on the ventilation system was not considered in this study. Meanwhile, the fresh air supply rate was slightly higher in their study.
Therefore, the output of equation (12) is coincident with the results reported by these published researches. As a result, this equation can be applied to other buildings, and designers could use this numerical model to determine suitable air filter efficiency and acceptable air infiltration rate based on outdoor air conditions.
Conclusion
This study investigated the impact of outdoor air pollutants on IAQ in a high-rise office building. As a case study, this paper analysed the impact of atmospheric weather conditions on air infiltration in Suzhou. It employed existing strategies using measured data, collected data and numerical simulation to assess the impact of outdoor air pollutants on IAQ in a high-rise office building. The IAQ in a high-rise building was analysed considering the stack effect, wind effect, infiltration rate, outdoor air pollution rate, seasonal change, air filter efficiency and floor height, which had significantly impacted on the IAQ.
Based on the analysis, the temperature difference between indoor and outdoor and the outdoor wind speed was proportional to the pressure difference between indoor and outdoor, while the pressure difference between wind and south facades was proportional to the wind angle with a negative gradient. As a result of the seasonal effects on the IAQ found on each floor of the building, the IAQ was worst in winter, followed by spring, autumn and summer. Numerical simulation showed that the IAQ differed from floor to floor in the high-rise building. The results indicate that the indoor particle concentration was lower on higher floors than on the lower floors in a high-rise building. According to the simulation results, the air filter efficiency was negatively related to the indoor particle concentration. Hence, to control the indoor PM level within the limit value, a filter with at least a high-efficiency air filter is required, and a double-filter system should be used if the outdoor air is highly polluted. In addition, a numerical model of the reduction proportion of indoor PM2.5 level at steady state was developed to help designers determine the suitable air filter efficiency and acceptable air infiltration rate based on outdoor air conditions.
Due to the limitations of the experiment site to measure the actual infiltration rate in a high-rise building, the on-site measurement of infiltration rate was not conducted to validate the numerical simulation results. This limitation may make the validation of the numerical simulation result difficult. However, the results were numerically calculated following the ASHRAE procedure. Hence, future study is needed for validating the findings of this study. Moreover, outdoor air pollutants' vertical profiles around the building facade could vary with the building's surrounding environment, outdoor emission sources and meteorological conditions. Future studies are scheduled to investigate outdoor air pollutants' vertical profiles depending on the multiple factors discussed earlier.
Footnotes
Authors' contribution
All authors contributed equally to the preparation of this article.
Authors' Note
Moon Keun Kim is n0w affiliated with Department of Civil Engineering and Energy Technology, Oslo Metropolitan University.
Declaration of conflicting interests
The author(s) declared no potential conflicts of interest with respect to the research, authorship, and/or publication of this article.
Funding
The author(s) disclosed receipt of the following financial support for the research, authorship, and/or publication of this article: This work was supported by the Research Development Fund (RDF 15–02-32) of Xi'an Jiaotong – Liverpool University, Zhejiang Provincial Natural Science Foundation (LY19E080001), the UK ICE Research Development Enabling Fund (ICE_RDF_2020), and the Department of Civil Engineering and Energy Technology of Oslo Metropolitan University.