
Abstract
Dry indoor air has been identified as the main cause of dry skin in winter which greatly affects older occupants' wellbeing, but HVAC design standards are based on average adults and do not specify a humidity level that can prevent dry skin. A field study was carried out to understand the difference between the younger and older people with regards to thermal and humidity comfort and skin condition in winter. The study proves a research procedure that is friendly to and preferred by the participants to measure the effect of the indoor environment on their comfort and skin condition in a real living environment setting. The results suggest that younger and older occupants are different in thermal comfort, specifically older occupants prefer a warmer environment than younger occupants, and the neutral temperature produced by the predicted mean vote method is not warm enough for older occupants. The study also suggests stratum corneum hydration appears to be a good indicator to present the effect of indoor humidity on the occupants' skin condition, which can be used to determine the minimum humidity level to reduce the risk of suffering dry skin in winter.
Keywords
Introduction
With the ongoing advancements in medical technology and care support, people’s life expectancy has been steadily increasing over the past decades. In Scotland, the life expectancy projection for people born in 2016–2018 was 77.0 years for males and 81.1 years for females, increased by 7.9 years for males and 5.8 years for females born in 1980–1982. For those born in 2041, the prediction would reach 81.7 years for males and 84.5 years for females. 1 As one of the social indicators showing desirable development, this increase in life expectancy also indicates an ageing society. As a consequence, a prediction can be made that the ageing of the population will be a common phenomenon in the next decades and, thus, concerns on older people’s (65+ years old) health and wellbeing should be made.
Comparing with other age groups, older people spend significantly more time indoors. Studies show that older people spend more than 90% of their time indoors, and this figure is even higher in winter,2–5 meaning the quality of their living environment would greatly affect their living and wellbeing. However, older people’s living environment, specifically the thermal and humidity environment, may not be as comfortable as it is expected due to the following reasons.
Firstly, the commonly referred heating, ventilation and air conditioning (HVAC) design standards, such as ASHRAE Handbook 6 and CIBSE Guide A, 7 provide suitable thermal and humidity comfort zones for that of the average building occupant but may be unfit for older people’s needs in winter. The thermal comfort zone provided by the HVAC design standards is based on Fanger’s studies, 8 which was based on mainly college-age participants and very few older ones (1300 students and 128 older participants) and concluded no difference in thermal comfort between young and older people. 3 However, in recent decades, studies confirmed a difference in thermal comfort between the two age groups, specifically, the older people prefer a 2°C warmer environment in winter in comparison with the younger people. 9 This finding challenges Fanger’s conclusion, suggesting that the current thermal comfort zone for healthy young adults may not be warm enough for older occupants. On the other hand, the humidity comfort zone provided by the HVAC design standards does not consider the effect of low humidity on the skin. The CIBSE Guide A 7 gives a minimum acceptable humidity level of 40% relative humidity (RH) which considers avoiding the dryness of occupants’ mucous membrane and eyes, reduce virus survival and transmission and the second effect interacts with indoor pollutants. While the ASHRAE Handbook 6 does not specify a minimum humidity level but a maximum humidity level of 0.012 kg/kg absolute humidity (AH). However, the minimum humidity level of 40% RH may not be high enough, as dermatologists recommend a higher minimum humidity level of 45% RH should be achieved to avoid dry skin on older occupants.10,11 In summary, the research suggests that both the thermal and humidity comfort zones provided by the HVAC design standards are unfit for older occupants’ needs.
Secondly, the inappropriate heating operation and lack of necessary humidification make dry indoor air a common phenomenon in winter, and this has become an issue in older people’s seasonal living environments. A large survey study shows that dry indoor air was reported in 94% of the investigated commercial and institutional buildings worldwide in winter. 12 Other studies reveal that dry air is one of the major environmental issues in residential buildings and elderly care institutions, such as care homes and elderly nursing homes which are occupied for long durations (often 24 h every day).13–15 In many cases, the humidity of indoor air was found to be less than 30% RH, which is much lower than the minimum of 40% RH recommended by CIBSE as an acceptable humidity range in buildings. 7 As a result, there is a high occurrence of underlying health issues, such as dry skin, dry eyes and mucous membrane irritation. 7 Among these issues, dry skin is the most common and mainly affects older people.10,11
Dry skin, medically called xerosis, is one of the most frequently suffered health issues among older people. Its prevalence of older people is 29.5% to 45.3%, affecting most of the oldest-old (80+ years old).10,16,17 The cause of dry skin is complex and has not been entirely understood, but air humidity has been identified as an important factor in dry skin development. 18 However, studies on the extent to which humidity can prevent dry skin are few and lack confidence. One study recommends a minimum RH of 30% to prevent dry skin on younger and older adults through comparing data in three constant RH settings (10%, 30% and 50% RH), but this was experienced in a short exposure of 180 min in climate chambers. 19 Another study recommends a minimum of 45% RH to prevent dry skin but does not provide evidence-based data to support the recommendation. 10 Hence, there is a need to understand the effect of humidity on skin condition and explore the minimum humidity level that can reduce the risk of dry skin in winter.
As a part of a four-year project aiming at collecting evidence-based data to develop an appropriate thermal and humidity comfort zone for older people that can reduce their risk of suffering dry skin, this study aims to understand the difference between the younger and older people in thermal and humidity comfort as well as the skin condition in a typical winter living environment. In this study, two types of data have been collected: the first type was objective and quantitative by physical measurements, including temperature, humidity (in both relative and absolute terms) and two skin condition variables – transepidermal water loss (TEWL) and stratum corneum hydration (SCH); the second was subjective and qualitative by questionnaire survey and interview, including thermal and humidity sensation, satisfaction and preference.
Methodology
Research participants
Eleven young adults and 11 older adults voluntarily participated in the study. The means and standard deviation of the participant’s age, height, weight and body mass index (BMI) are presented in Table 1. Among the participants, the young group were college-age students who lived in students’ halls of residence on a university campus, while the older group were the residents in a care home. All the participants were recruited through an ethically approved process to ensure they had no skin disease and cognitive dysfunction history. Among the older participants, one of them had chronic lung disease and therefore was not able to be exposed to a high humidity environment for extended periods. Another older participant had difficulty in hearing, reading and speaking due to his old age and participated in the research with help from his partner. Moreover, an information sheet introduces the research background, providing the aim and objectives to every participant. Consent forms were signed and returned by all the participants before they were recruited.
Physical characteristics of the participants.

Participants in the two groups followed a constant daily routine during the study. The younger participants would typically leave the hall of residence in the morning or early afternoon and would study or rest when they were in their rooms. The older participants would typically stay and remain seated at rest in their rooms most of the time. In summary, all the participants had light activities in their living environment, which corresponds to a metabolic rate of 1.0 met.6,7
A difference in clothing worn by the participants indoor was observed between the two groups. The younger participants typically wore a light winter indoor ensemble, and the older participants typically wore a light winter indoor ensemble with an extra layer of light outdoor clothing. By matching their actual wearing ensembles with the tables of clothing insulation of complete ensembles in ISO 9920:2009, the participants’ clothing insulation values were obtained, which were 0.9 clo for the young participants and 1.6 clo for the older participants. 20
Research sites
The study was carried out in two similar students’ halls of residence and a care home in Edinburgh, Scotland. In the students’ halls of residence, the younger participants’ study bedrooms were selected for data collection. A typical floor plan of their rooms is presented in Figure 1. The rooms were the same size, approximately 14 m2 for one-person occupancy, including an en-suite in which an extract fan with a delay-off timer operated to prevent smell and moisture from entering the bedroom. The rooms were centrally heated 24 h a day by a wall-mounted radiator under the window.
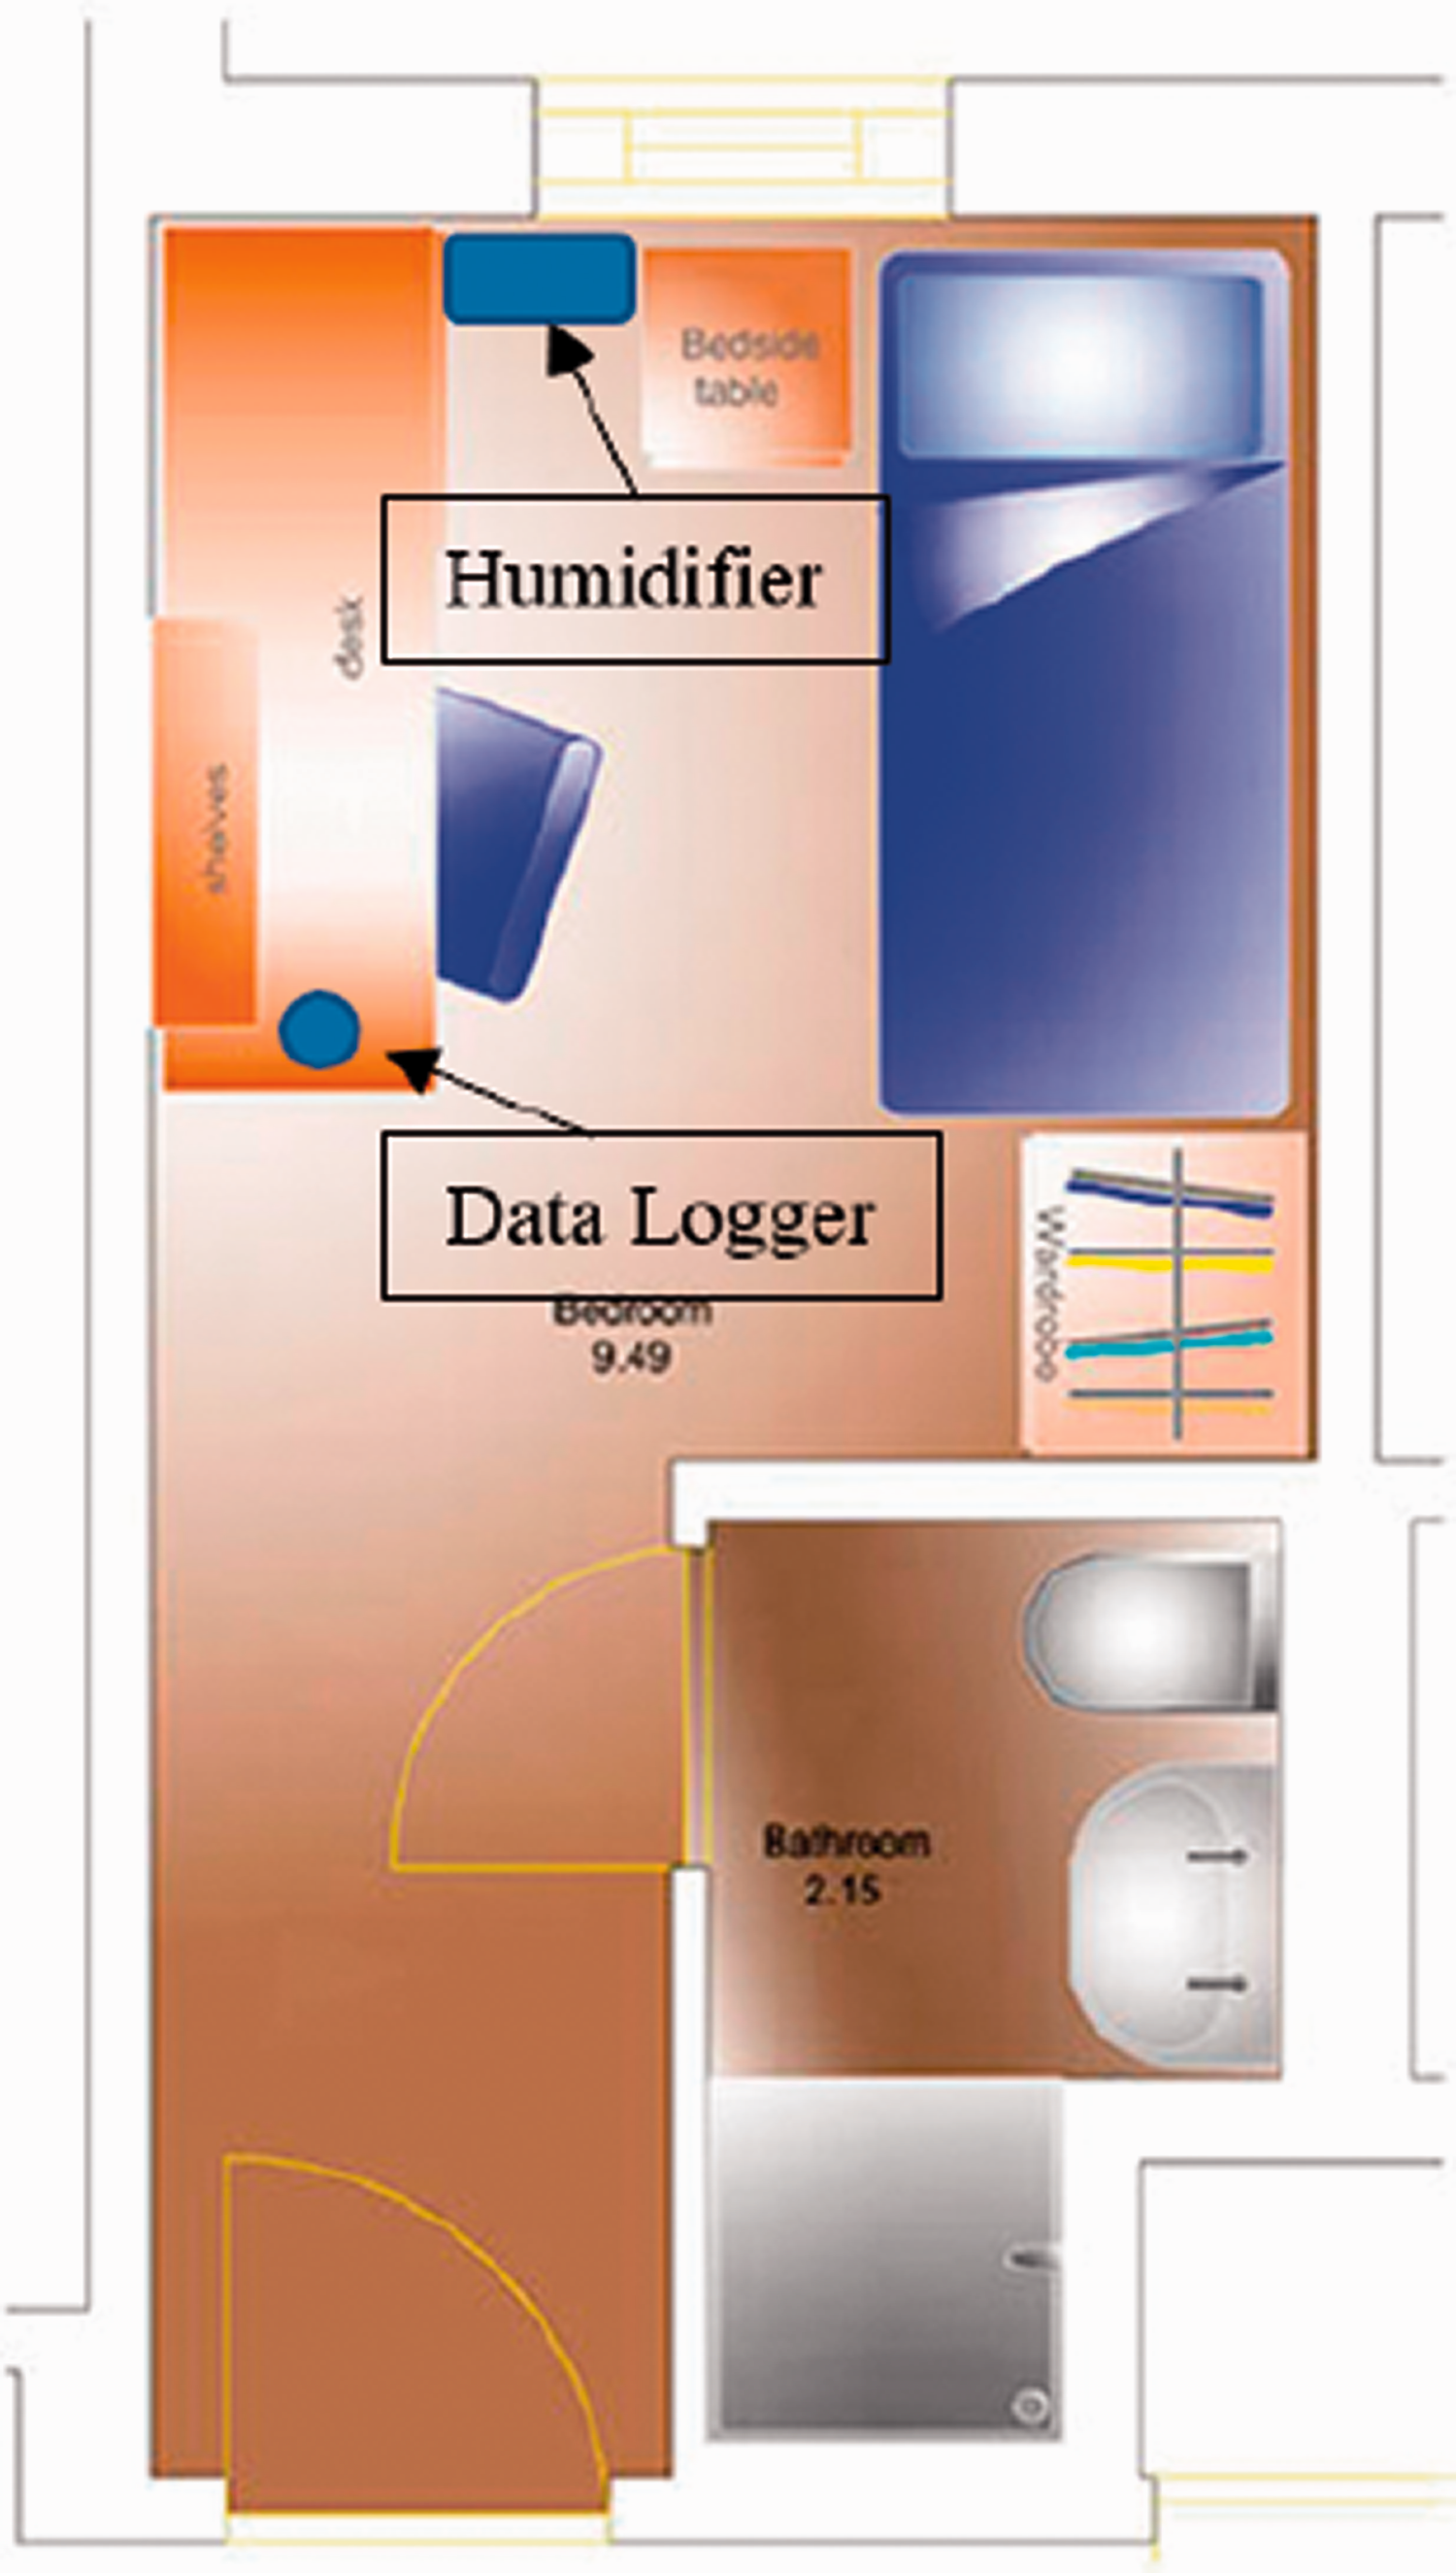
The floor plan of the measured room in the students’ hall of residence.
The care home was made of single-occupied flats with a living room, kitchen, bedroom, bathroom and hallway. A typical floor plan of the flats is shown in Figure 2. The flats were heated by a gas central heating system with a radiator in each of the rooms. The older participants’ living rooms, about 14–16 m2 in size, were selected for the data collection as the occupants spent most of their time there.
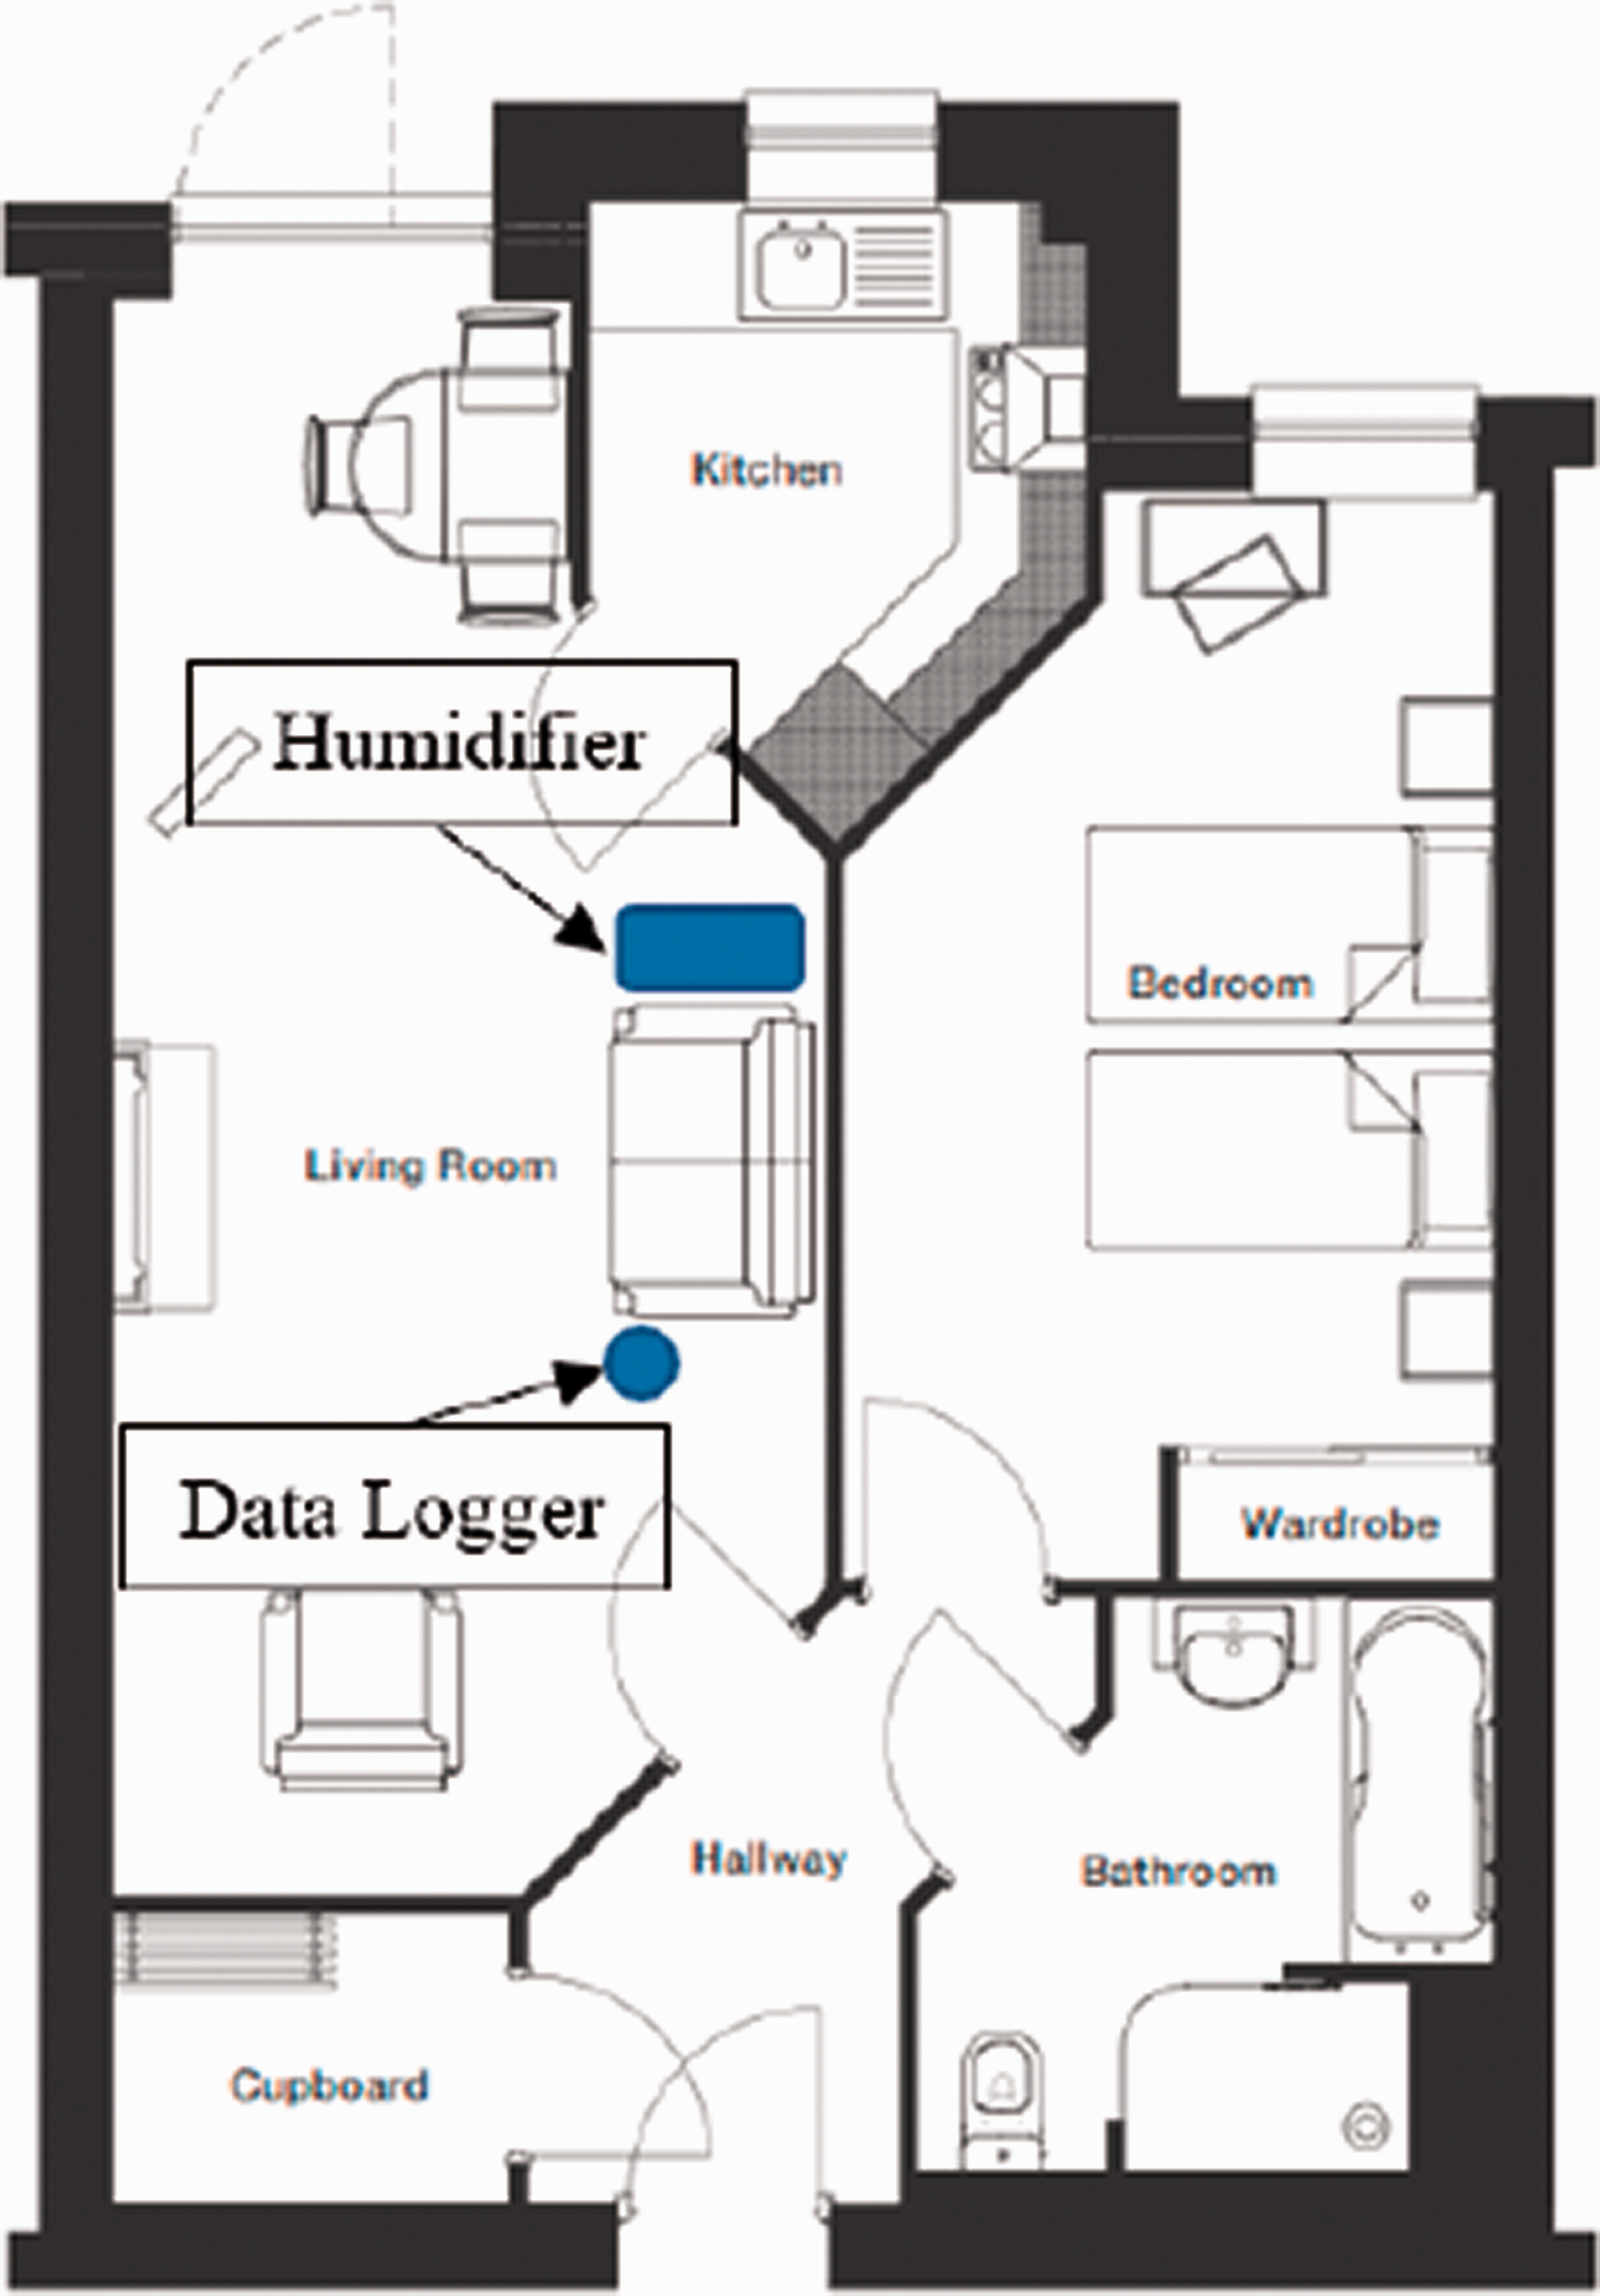
Floor plan of a typical flat in the care home.
Research procedure
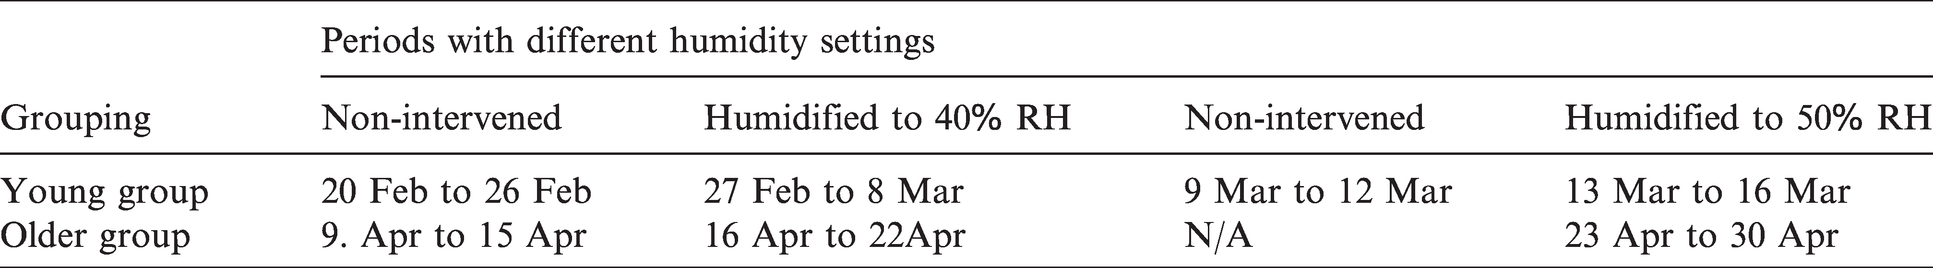
The study was carried out over four periods at different temperatures and humidity levels to test how the indoor environment affects the participants’ comfort and skin condition. The temperature and humidity levels are likely to occur in a typical heated indoor environment in winter and are moderate to the occupants.
In the first period, no environmental intervention was applied, and the measured room conditions were regarded as the baseline. In the second period, the room temperature naturally fluctuated, and room humidity was intervened by domestic humidifiers, of which the target humidification level was set to 40% RH. In the third period, the environmental intervention was stopped. This period was not implemented in the care home due to the arrangement from the care home side. In the fourth period, the room temperature naturally fluctuated, and room humidity was intervened again by the humidifiers, of which the target humidification level was 50% RH.
The humidity intervention applied in the second and fourth period was achieved by Prem-I-Air Sonico, a domestic ultrasonic air humidifier that was proven in our previous studies to be efficient in humidifying the room to the target level.21,22 The humidifiers were placed next to the radiator where the warm upward air can help the moisture distribution in the measured room. The specific locations of the humidifier in the measured rooms are presented in Figures 1 and 2. A summary of the environment setting in each period is presented in Table 2.
Summary of different humidity setting in each period.
During the research, the hourly outdoor temperature and humidity data were recorded at the Pleasance Youth Hostel weather station in the City of Edinburgh and were downloaded from the Met Office Website. 23 Temperature and RH in the participants’ room were measured 24 h a day by data loggers. The participants’ skin condition and subjective thermal and humidity comfort were assessed through physical measurements and questionnaire surveys two times each research period with a three- or four-days interval in our visits. The visits to the younger participants varied from the late morning to the late afternoon, while the visits to the older participants were normally in the morning before noon. All participants were required to quietly stay in the measured rooms for at least 2 h before the visits to ensure they have the same activity level and have entirely adapted to the environment.
Physical measurements
Environment measurements
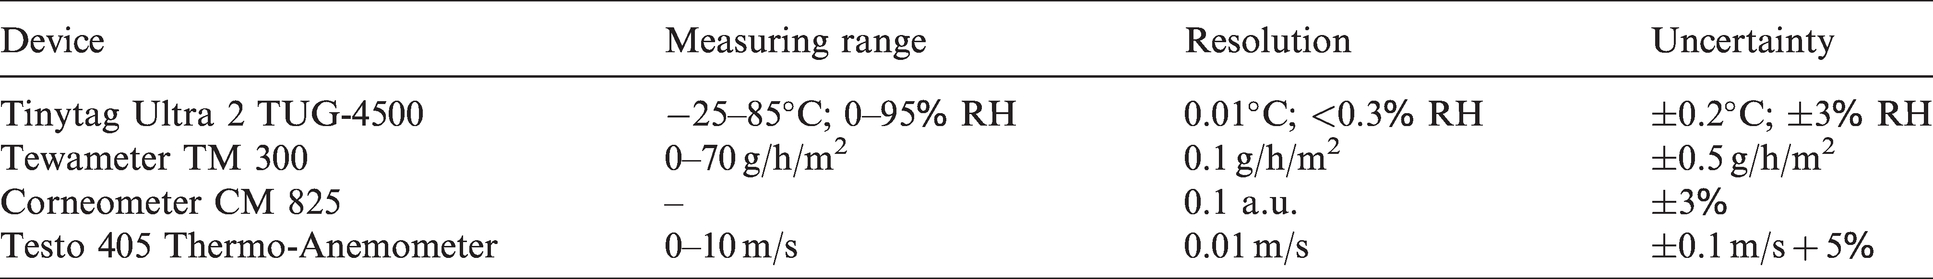
The environment measurements include the measurement of the indoor air temperature and humidity in both relative (RH) and absolute (AH) terms. The indoor air temperature and RH were measured by the Tinytag Ultra 2 TUG-4500 Internal Temperature and Relative Humidity Data Logger. To get the most accurate readings of the occupants’ exposed environment and to avoid annoyance, the logger was placed on the desk (approximately 0.7 m height above the floor) in the students’ halls of residence (Figure 1) and on the tea table or next to the sofa (0.4–0.5 m height above the floor) in the care home (Figure 2). An effort was made to ensure that the logger positioned in each of the rooms represented the occupant and was away from the window and radiator to avoid direct exposure to radiation. Log data were captured every 10 min throughout all research periods. The indoor AH (kg/kg) was obtained by calculations according to the measured temperature and RH, using equation (1)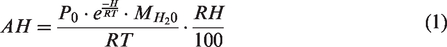
Skin condition measurements
In this study, the skin condition of the participants was assessed by two variables, TEWL and SCH, all of which are based on the moisture transfer between the skin and its surrounding environment. The moisture transfer between the skin and its surrounding environment happens in the stratum corneum, the outermost layer of the skin surface, in which the moisture content transfers to its exposed environment by transpiration.24,25 The transpiration process can be presented by Fick’s diffusion law (equation (2)) revealing the mass of moisture per cm2 being transported in a defined period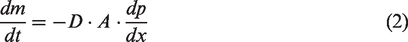
Among the two variables, TEWL is defined as the flux density of moisture transferred from the stratum corneum to the environment and presents the barrier function of the skin which is clinically relevant to skin conditions and diseases.26–28 An increase in the TEWL indicates an impairment of the skin barrier function and unhealthy skin conditions. TEWL is the most frequently used skin variable for the skin condition assessment, as its measurement is straightforward, non-invasive and economical.26–28 Kottner et al. 29 synthesised the TEWL on about 50 skin areas of younger and older people in 167 studies, and the results can be used as the benchmark to evaluate the skin condition. Specifically, the average TEWL on the distal right volar forearm in healthy subjects is 7.3–11.8 g/h/m2, and values higher than the range indicate unhealthy skin condition.29,30 SCH is the hydration state in the stratum corneum during the moisture transpiration process from the skin to the environment. It is indirectly measured by a combined variable of skin’s electrical properties that are relevant to the moisture content in the stratum corneum. 26 The SCH value on healthy skin does not differ much on different skin sites. 26 SCH value higher than 50 arbitrary units (a.u.) indicates sufficiently moisturised condition, while values below 50 a.u. indicate dry skin and below 35 a.u. indicate very dry skin.30–32
The TEWL and SCH were measured by the Courage-Khazaka MPA-5 Central Multi-probe Unit with the Tewameter TM 300 (measuring TEWL) and the Corneometer CM 825 (measuring SCH). The measurements were non-invasive and did not cause any discomfort or damage to the skin surface. Each measurement took less than 1 min and hence minimised the uneasiness of contacting their skin. All skin measurements were conducted on the distal right volar forearm of the participants two times in each period. Additionally, air velocity near the measured skin site was measured and checked before every skin measurement, as direct airflow on the measured skin site would affect the skin measurement accuracy. 26 The air velocity was measured by Testo 405 Thermo-Anemometer, and all skin measurements were conducted at air velocity less than 0.05 m/s.
Specifications of the measurement equipment
Specifications of the equipment for the environment and skin condition measurements are presented in Table 3.
Specifications of the measurement equipment.
Subjective measurements
Questionnaire survey
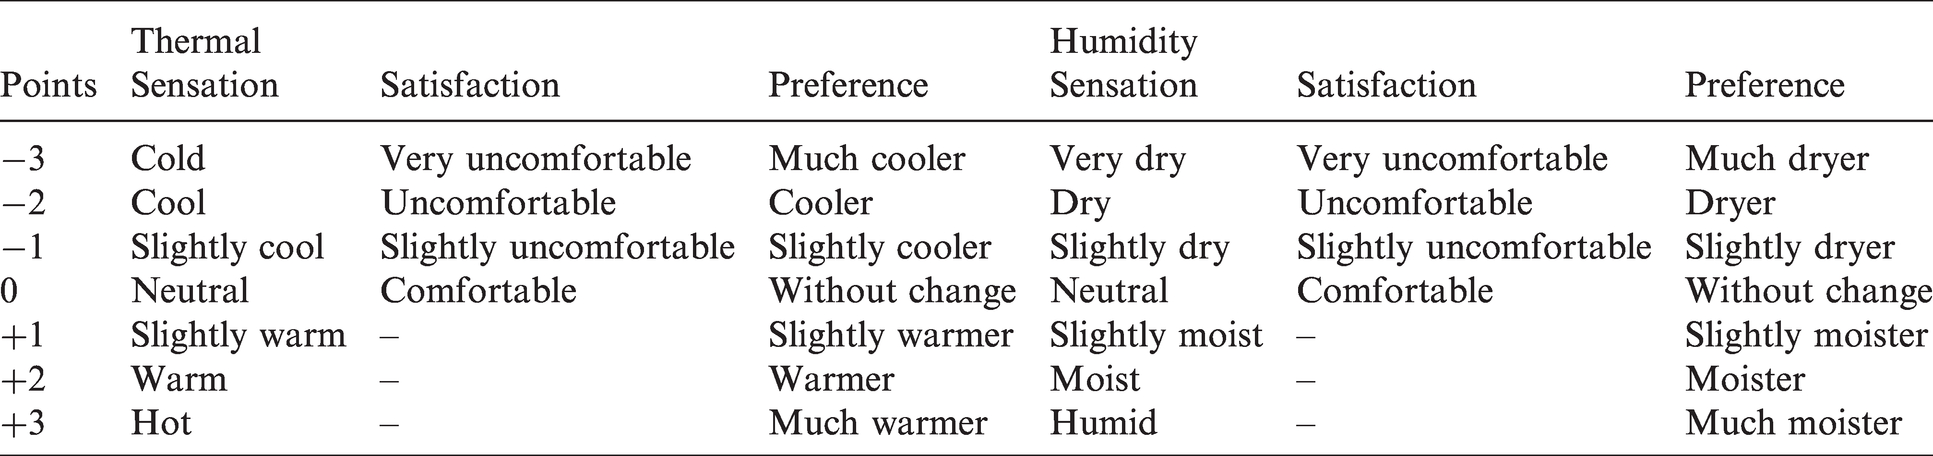
A questionnaire survey was conducted to investigate the participants’ subjective responses to the indoor and humidity environment. The questionnaire consists of six questions on the participants’ subjective thermal and humidity comfort (Table 4). The three questions were on thermal comfort, based upon the ISO 10551:2019 33 and ASHRAE Standard 55-2020 34 and consist of occupants’ votes on their thermal sensation (TSV), satisfaction and preference. Three additional questions used in other relevant studies 35 were on humidity comfort and consist of occupants’ votes on their humidity sensation, satisfaction and preference. The questionnaire was given and answered orally and was completed by each participant during every visit.
Scales used for each question in the questionnaire survey.
Predicted mean vote
Predicted mean vote (PMV) of the participants was investigated to assist in understanding the participants’ subjective thermal comfort. The PMV is a commonly used method in thermal comfort assessment and has been widely adopted in standards, such as ISO 7730:2005 36 and ASHRAE Handbook. 6 It is a steady-state heat balance model based on the thermal balance of the human body and combines the influence of air temperature, mean radiant temperature, air movement and humidity with that of clothing and activity level into one value on a thermal sensation scale (Figure 3).7,8
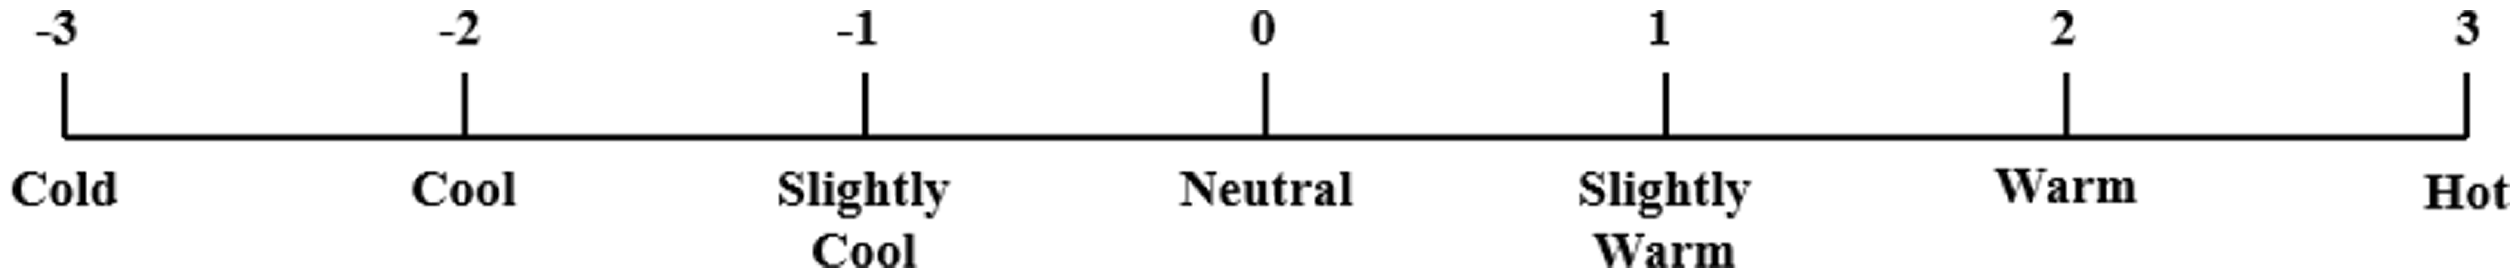
The thermal sensation scale in PMV.
The value of PMV was calculated by equation (3)


Among the equations,


Statistical analyses
Data for comparing the difference between the younger and older groups were analysed by the paired T-test. Results of the physical and subjective measurements were analysed by repeated measure analysis of variance (ANOVA) without replication through the IBM Statistical Package for the Social Sciences (SPSS) Statistics 22, a widely used programme for statistical analysis in social science. The significance level was set to 0.05 (p < 0.05). Results are expressed as means ± SD.
Results
Indoor and outdoor environment
Figure 4 shows the outdoor temperature and RH during the fieldwork in the students’ halls of residence and care home. During the fieldwork, the outdoor average temperature of the students’ halls of residence and care home were 2.5 ± 2.9°C and 9.1 ± 4.6°C, respectively, and the outdoor average RH of the students’ halls of residence and care home were 83.9 ± 11.4% and 77.0 ± 16.8%, respectively. Based on the measured temperature and RH, the outdoor AH of the two research sites were calculated. The outdoor average AH of the students’ halls of residence and care home were 4.5 ± 0.6 and 5.5 ± 1.0 g/kg, respectively. In summary, the outdoor average temperature of the students’ halls of residence was 6.6°C lower than that of the care home, and the outdoor average humidity of the students’ halls of residence was 6.9% RH and 1.0 g/kg AH lower than that of the care home. The difference in outdoor temperature and humidity was caused by outdoor weather, as the fieldwork in the students’ halls of residence was conducted from February to March when the outdoor weather was colder and drier.
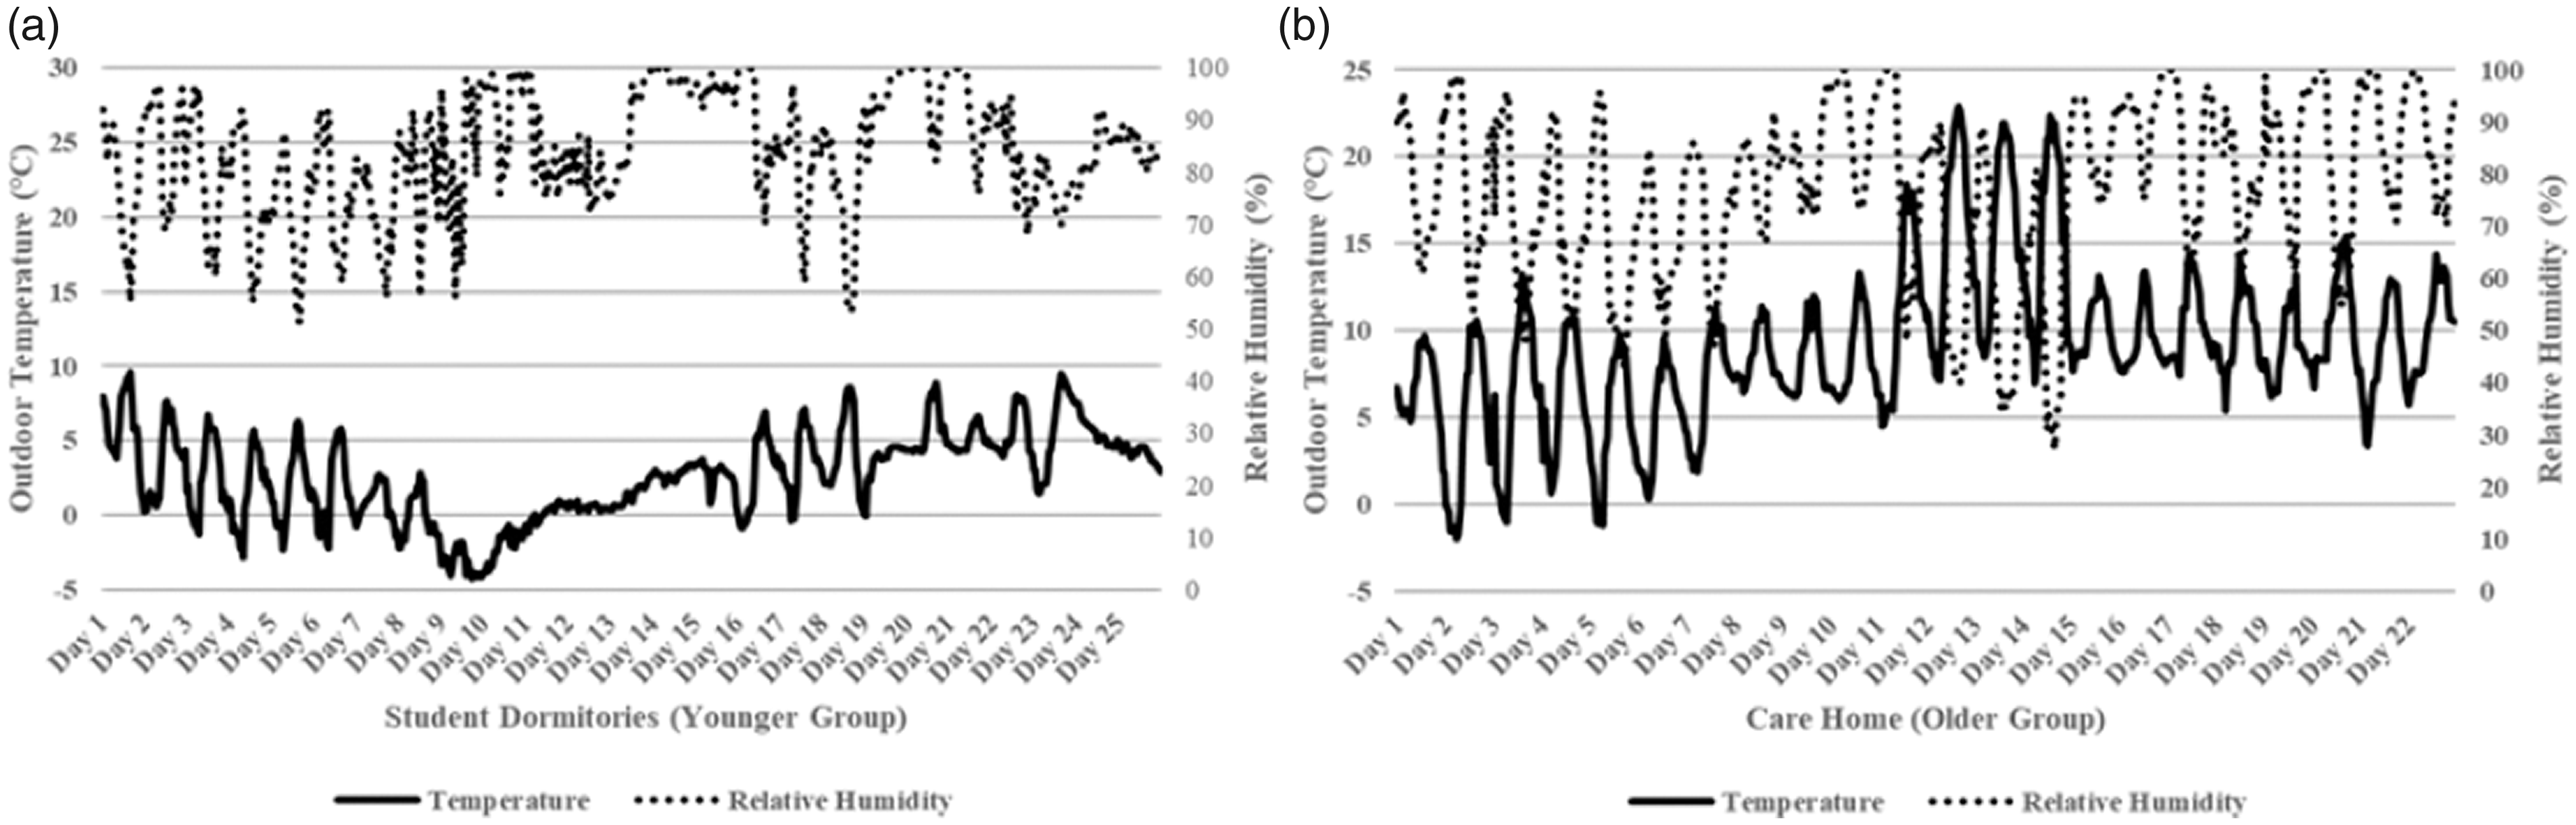
Outdoor temperature and RH during the fieldwork in the students’ halls of residence and care home. (a) Students’ halls of residence, (b) care home.
Figure 5 shows the average indoor temperature during the fieldwork in the students’ halls of residence and care home. During the fieldwork, the average temperature in the measured rooms in the students’ halls of residence and the care home were 22.8 ± 0.5°C and 22.9 ± 0.7°C, respectively. The average temperature in the measured rooms in the two research sites was stably kept at approximately 23°C, which is at the upper limit of the 17–23°C temperature design criteria recommended by the CIBSE. 6 In the first period when no humidity intervention was applied, the average RH in the measured rooms was 35.4 ± 3.2% in the students’ halls of residence and was 31.0 ± 2.3% in the care home. The indoor RH was not significantly correlated with the outdoor RH (p = 0.74), suggesting the indoor RH was mainly affected by indoor humidity sources instead of the outdoor environment. In the second period when the humidity intervention was applied at the target humidification level of 40% RH, the average humidity in the measured rooms was increased to 40.4 ± 2.9% RH in the students’ halls of residence and 37.7 ± 3.2% RH in the care home and almost reached the target humidification level. In the third period when the humidity intervention stopped, the average humidity in the measured rooms was 43.4 ± 5.0% RH in the students’ halls of residence and did not decrease to the baseline in the first period. In the fourth period when the humidity intervention was applied at the target humidification level of 50% RH, the average humidity in the measured rooms was increased to 50.5 ± 3.4% RH in the students’ halls of residence and 41.8 ± 1.9% RH in the care home.
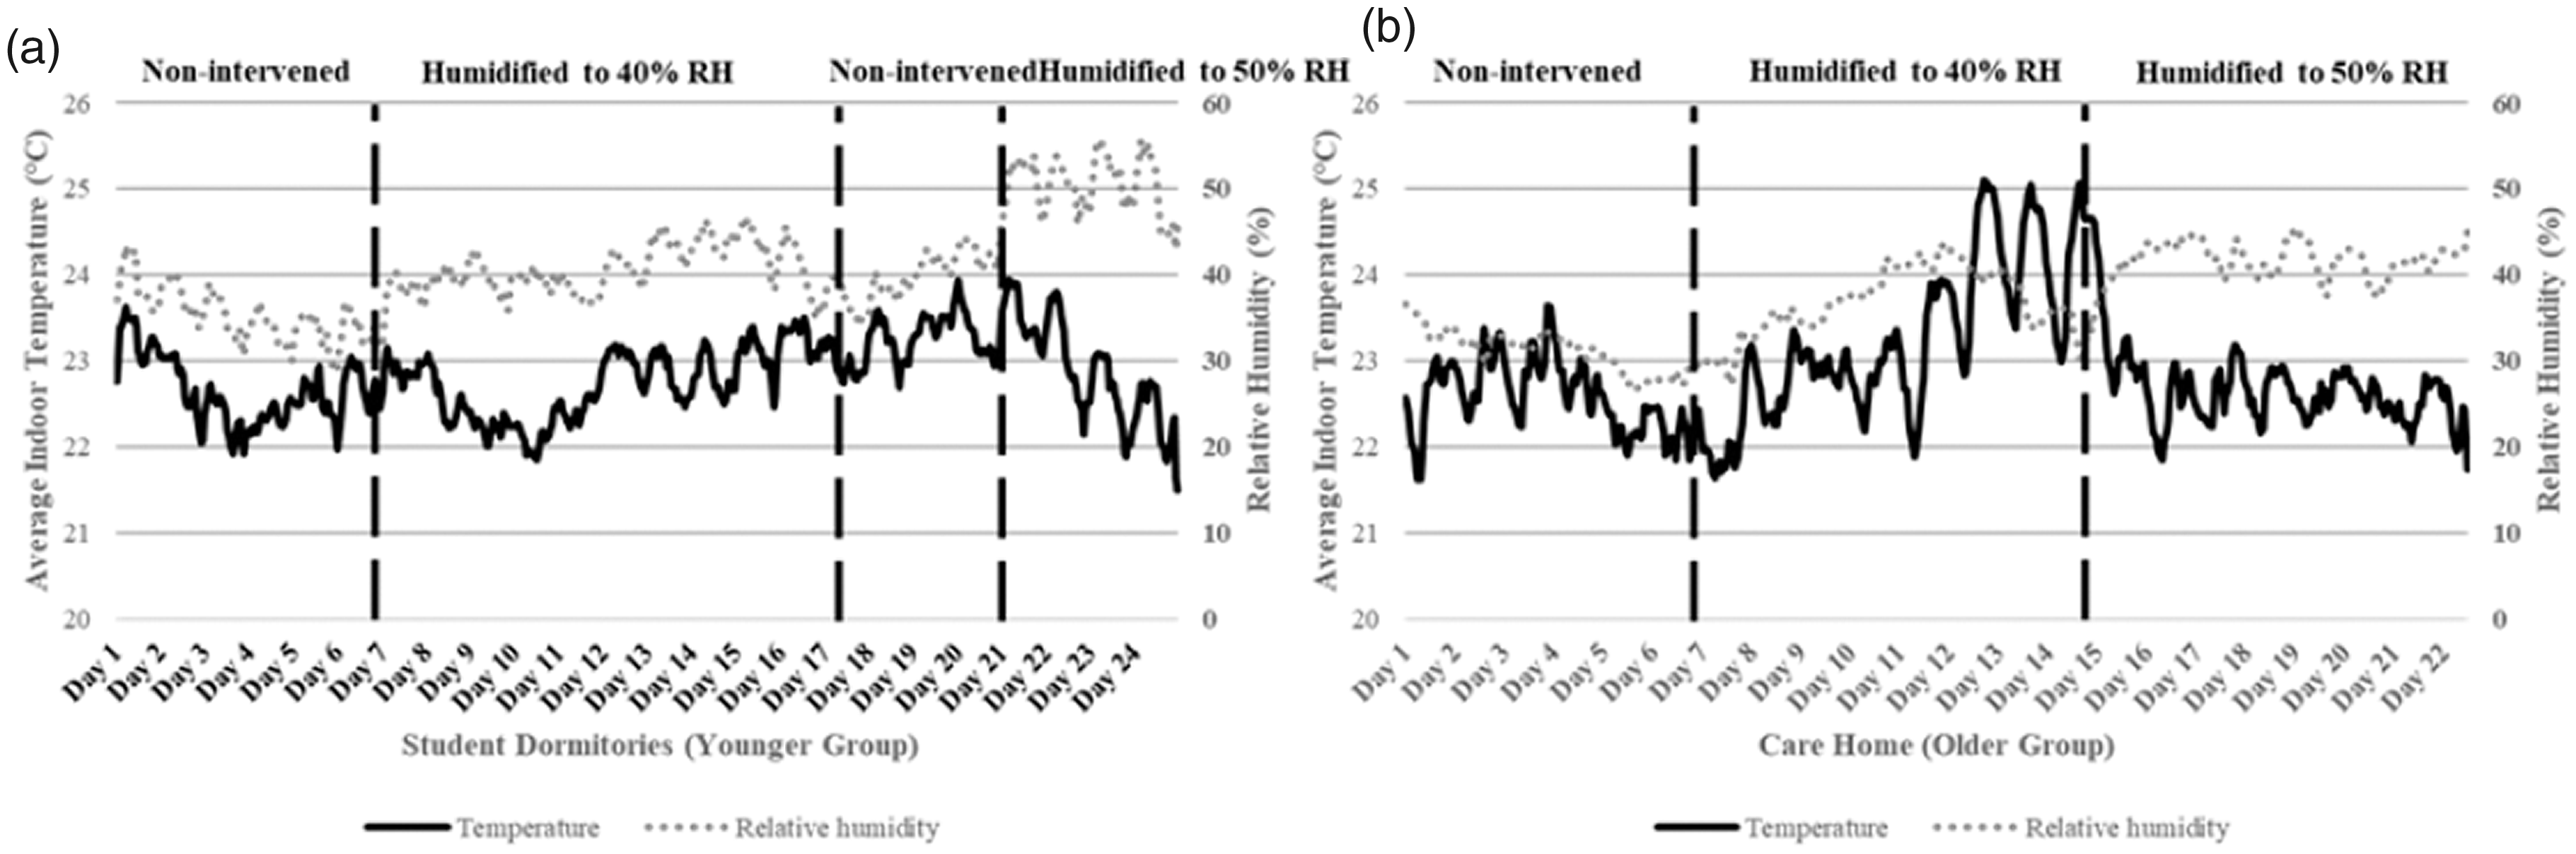
The average indoor temperature and RH during the fieldwork in the students’ halls of residence and care home. (a) Students’ halls of residence, (b) care home.
Figure 6 shows the percentage of occurrence when the measured RH in and out of the acceptable humidity range in each period of the fieldwork. In the first period when no humidity intervention was applied, more than 90% of the measured RH at both research sites was lower than 40% RH, the lower limit of the acceptable humidity range was recommended by CIBSE. 7 In the second period when the humidity intervention was applied at the target humidification level of 40% RH, the percentage of occurrence when the measured RH was lower than the acceptable range was decreased to 50.4% and 67.9% in the students’ halls of residence and care home, respectively. In the third period when the humidity intervention stopped, the percentage of occurrence when the measured RH was lower than the acceptable range which was continuously decreased to 27.1% in the students’ halls of residence. In the fourth period, all measured RH was in the acceptable range in the students’ halls of residence and only 19.4% of the measured RH was lower than the acceptable range in the care home.
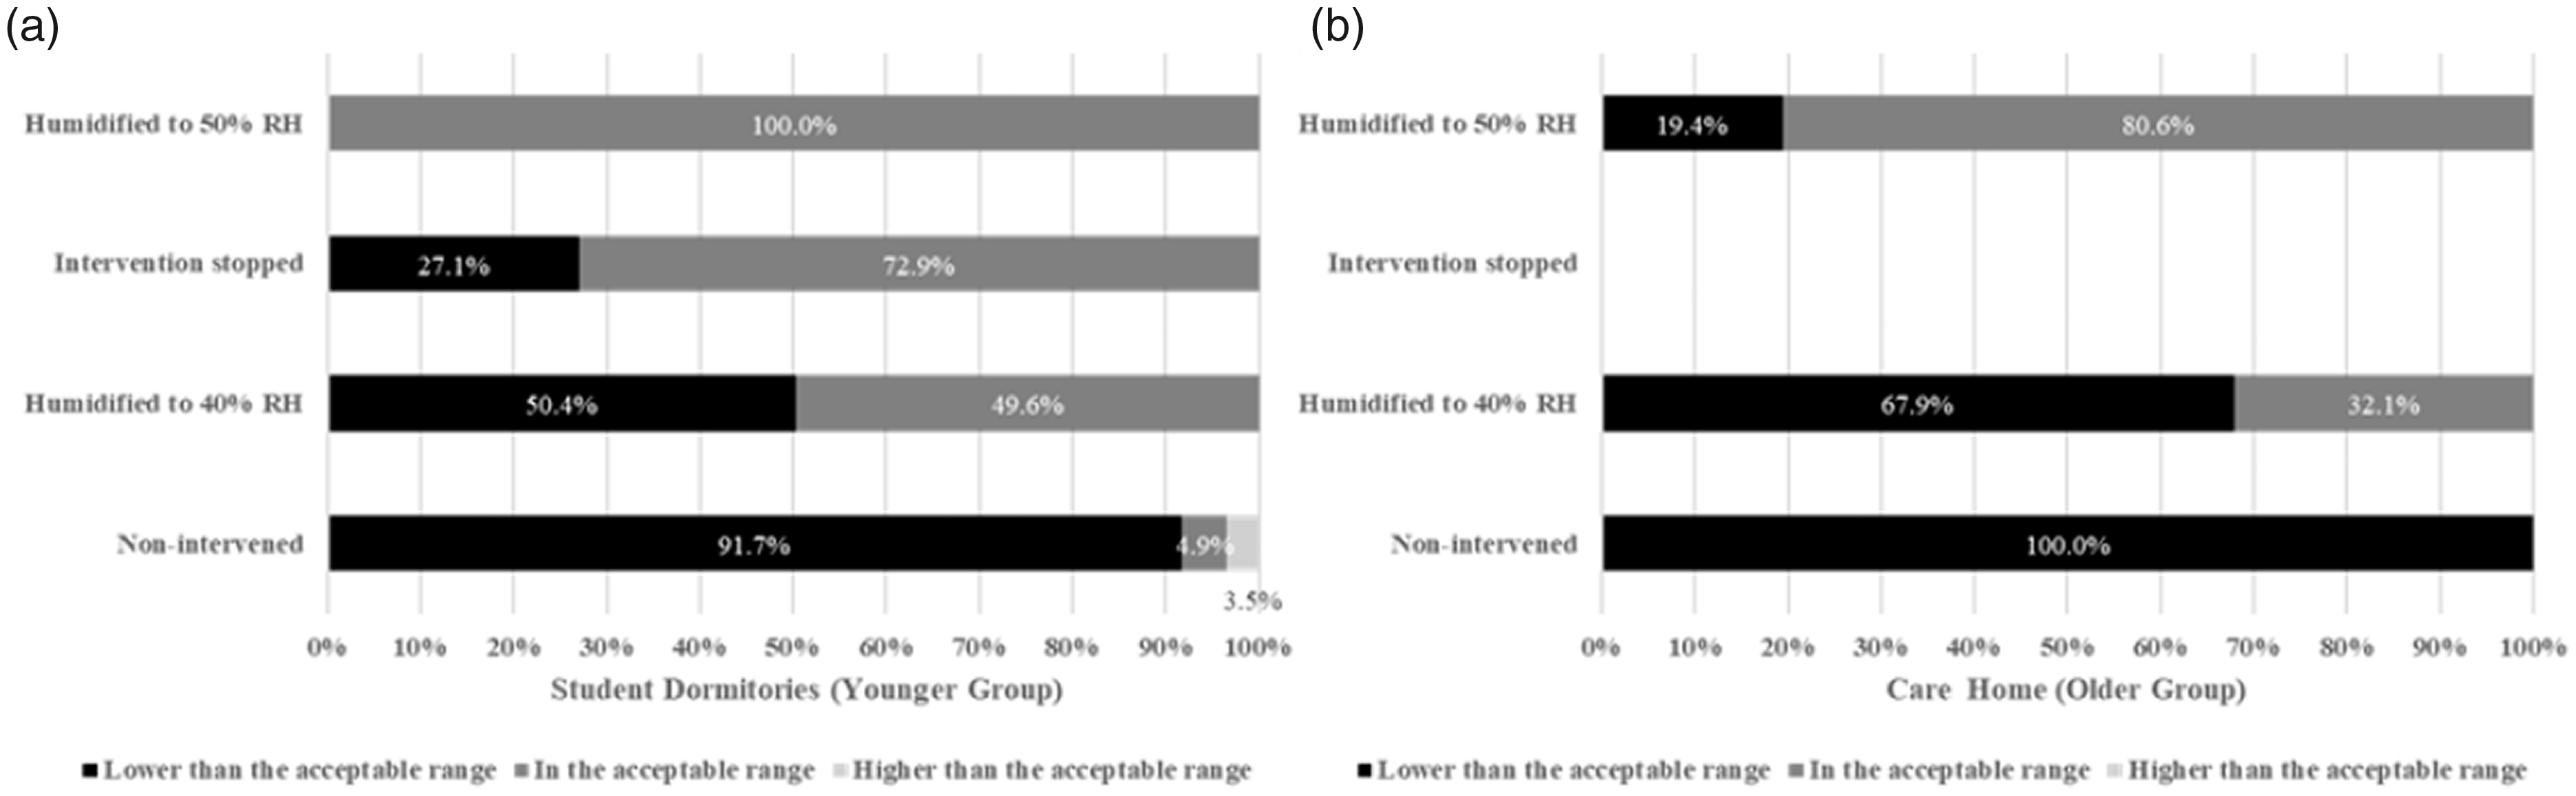
Percentage of occurrence when the measured RH in and out of the acceptable humidity range (40–70% RH) in each period of the fieldwork. (a) Students’ halls of residence, (b) care home.
Subjective comfort
Thermal comfort
Figure 7 shows the TSV and PMV of the younger and older groups at different room temperatures. The TSV and PMV of the younger group were significantly correlated with the room temperature (r = 0.37, p = 0.01; r = 0.99, p <0.001). According to the regression equations, the neutral temperature at which the younger participants were thermally neutral can be produced, which are 21.6°C by the TMV and 22.6°C by the PMV, respectively. The neutral temperature produced by the TSV is 1°C lower than that produced by the PMV. The TSV and PMV of the older group were also significantly correlated with the room temperature (r = 0.33, p = 0.01; r = 0.99, p < 0.001). According to the regression equations, the neutral temperature at which the older participants were thermally neutral is 21.7°C by the TMV and 19.9°C by the PMV, respectively. The neutral temperature produced by the TSV was 1.8°C higher than that produced by the PMV.
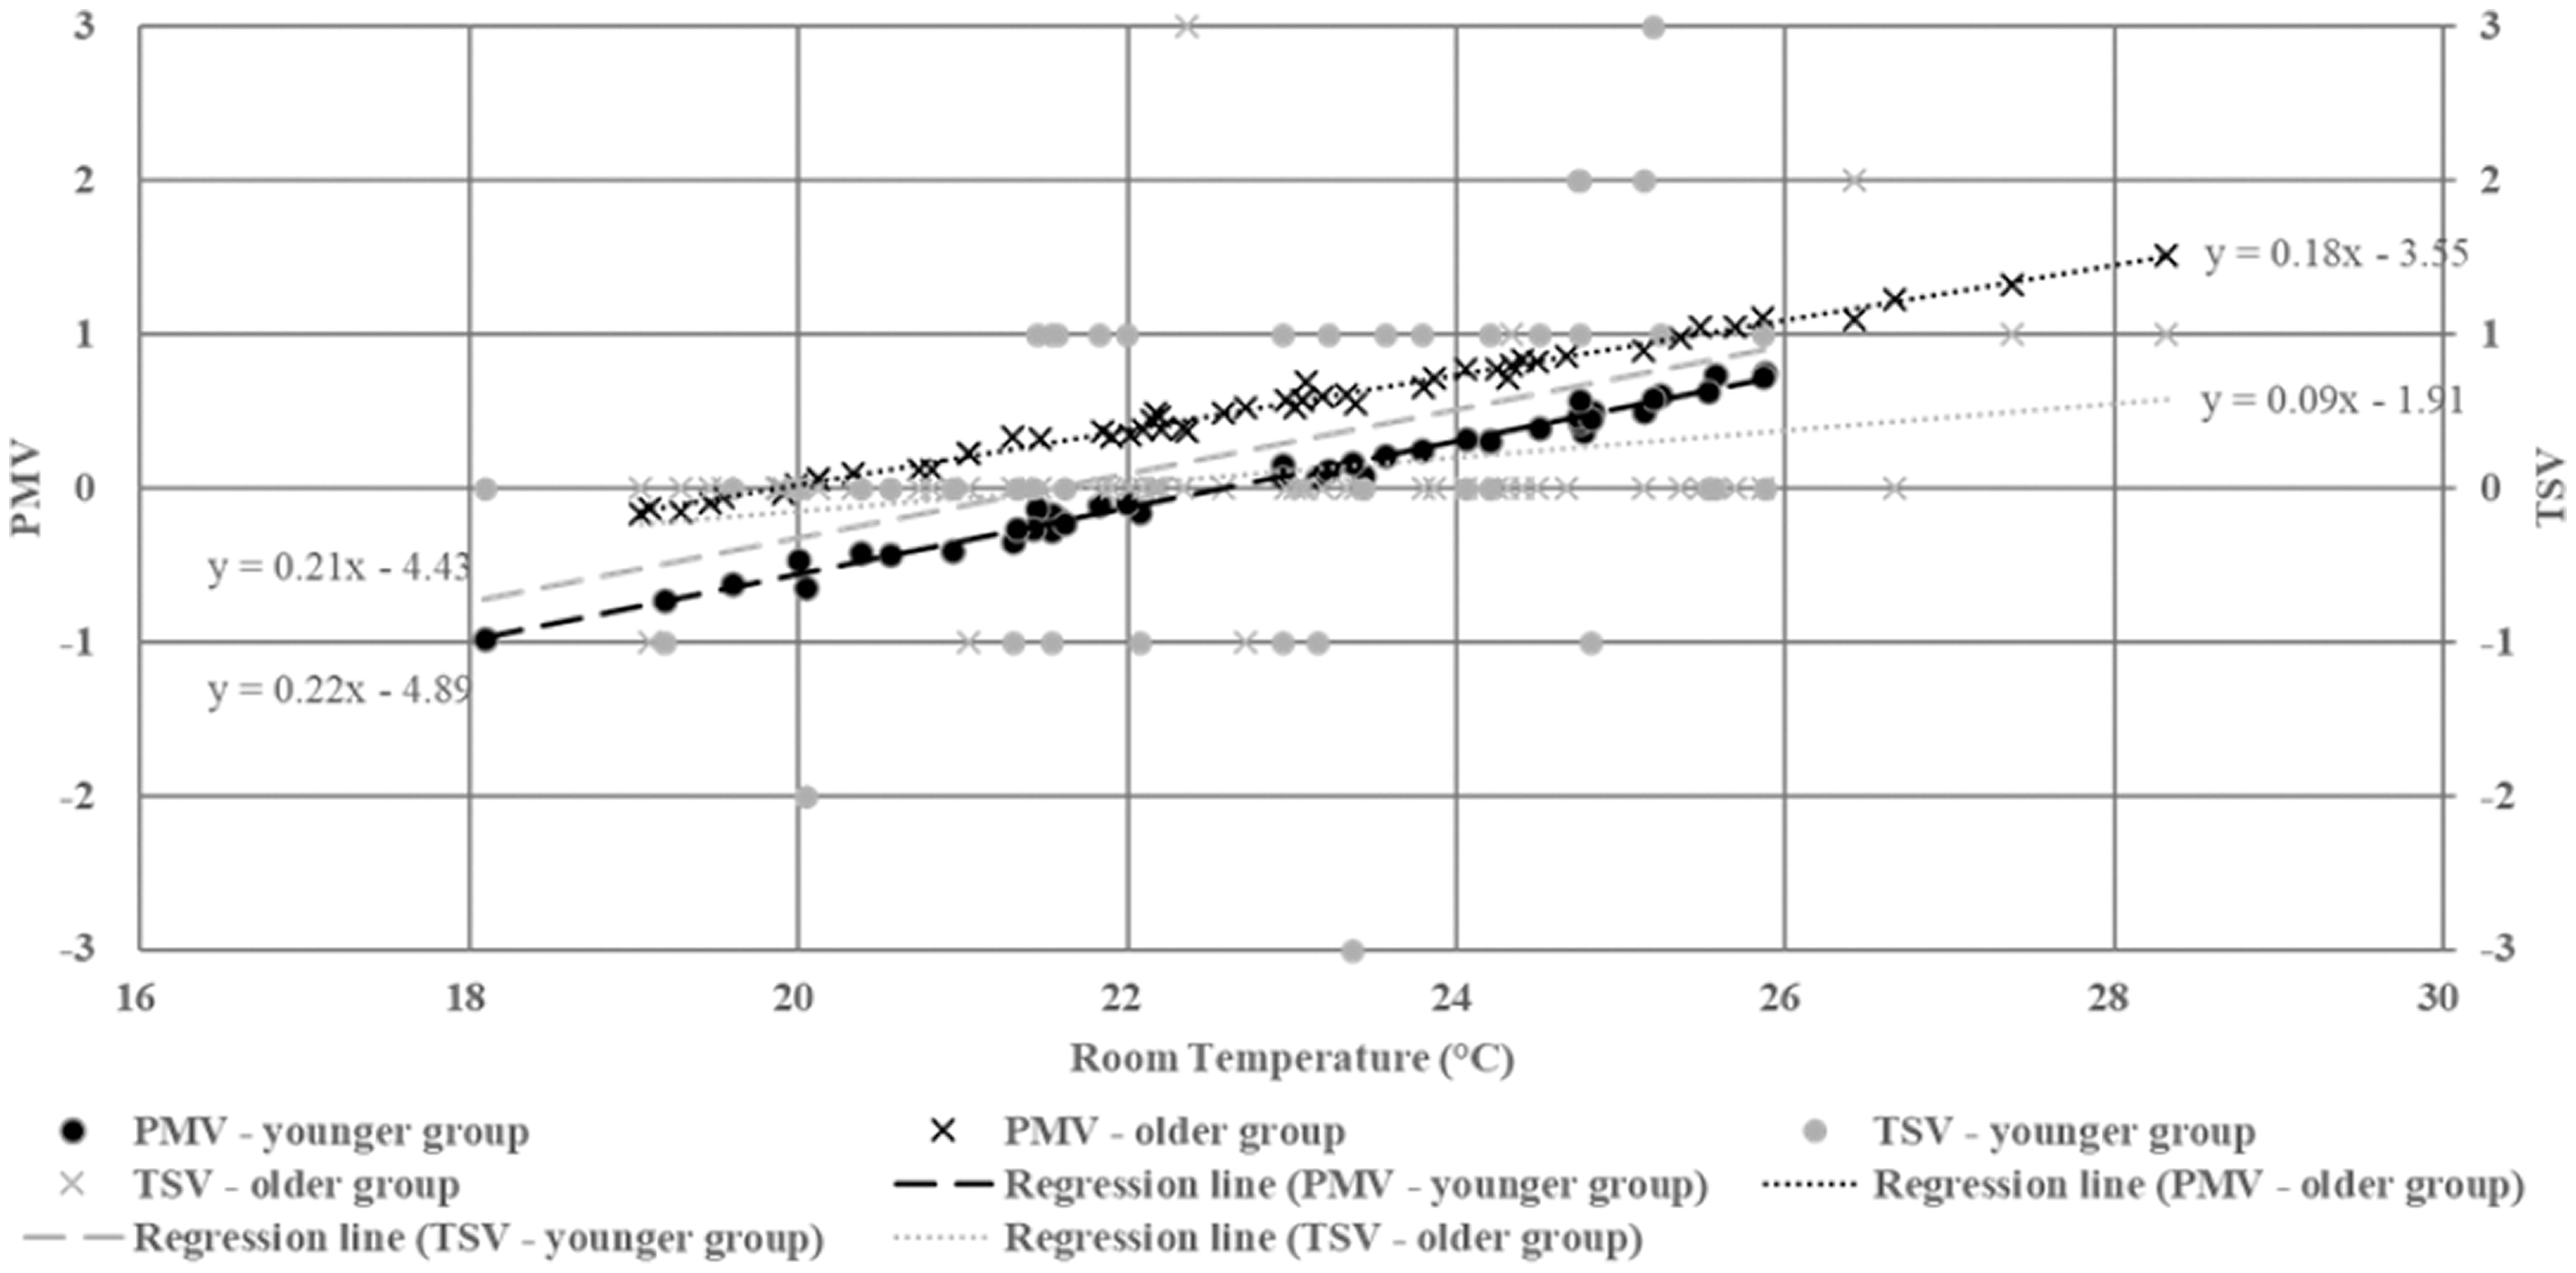
TSV and PMV of the younger and older groups vs. room temperature.
Figure 8 shows the thermal satisfaction of the younger and older groups at different room temperatures. The younger group voted ‘comfortable’ in 59.1% of their answers at an average temperature of 23.1 ± 1.7°C, voted ‘slightly uncomfortable’ in 36.4% of their answers at an average temperature of 22.6 ± 2.4°C and voted ‘uncomfortable’ in 4.5% of their answers at the average temperature of 22.4 ± 2.4°C, suggesting their discomfort was mainly caused by a low temperature. The older group voted comfortable in 90.9% of their answers at an average temperature of 23.1 ± 1.7°C and voted slightly uncomfortable in 7.3% of their answers at an average temperature of 24.9 ± 3.1°C. One older participant voted ‘very uncomfortable’ at 24.3°C. The results suggest the older participants’ discomfort was mainly caused by a high temperature. In addition, the thermal satisfaction of the younger and older groups was not significantly correlated with the room temperature (p = 0.38; p = 0.54).
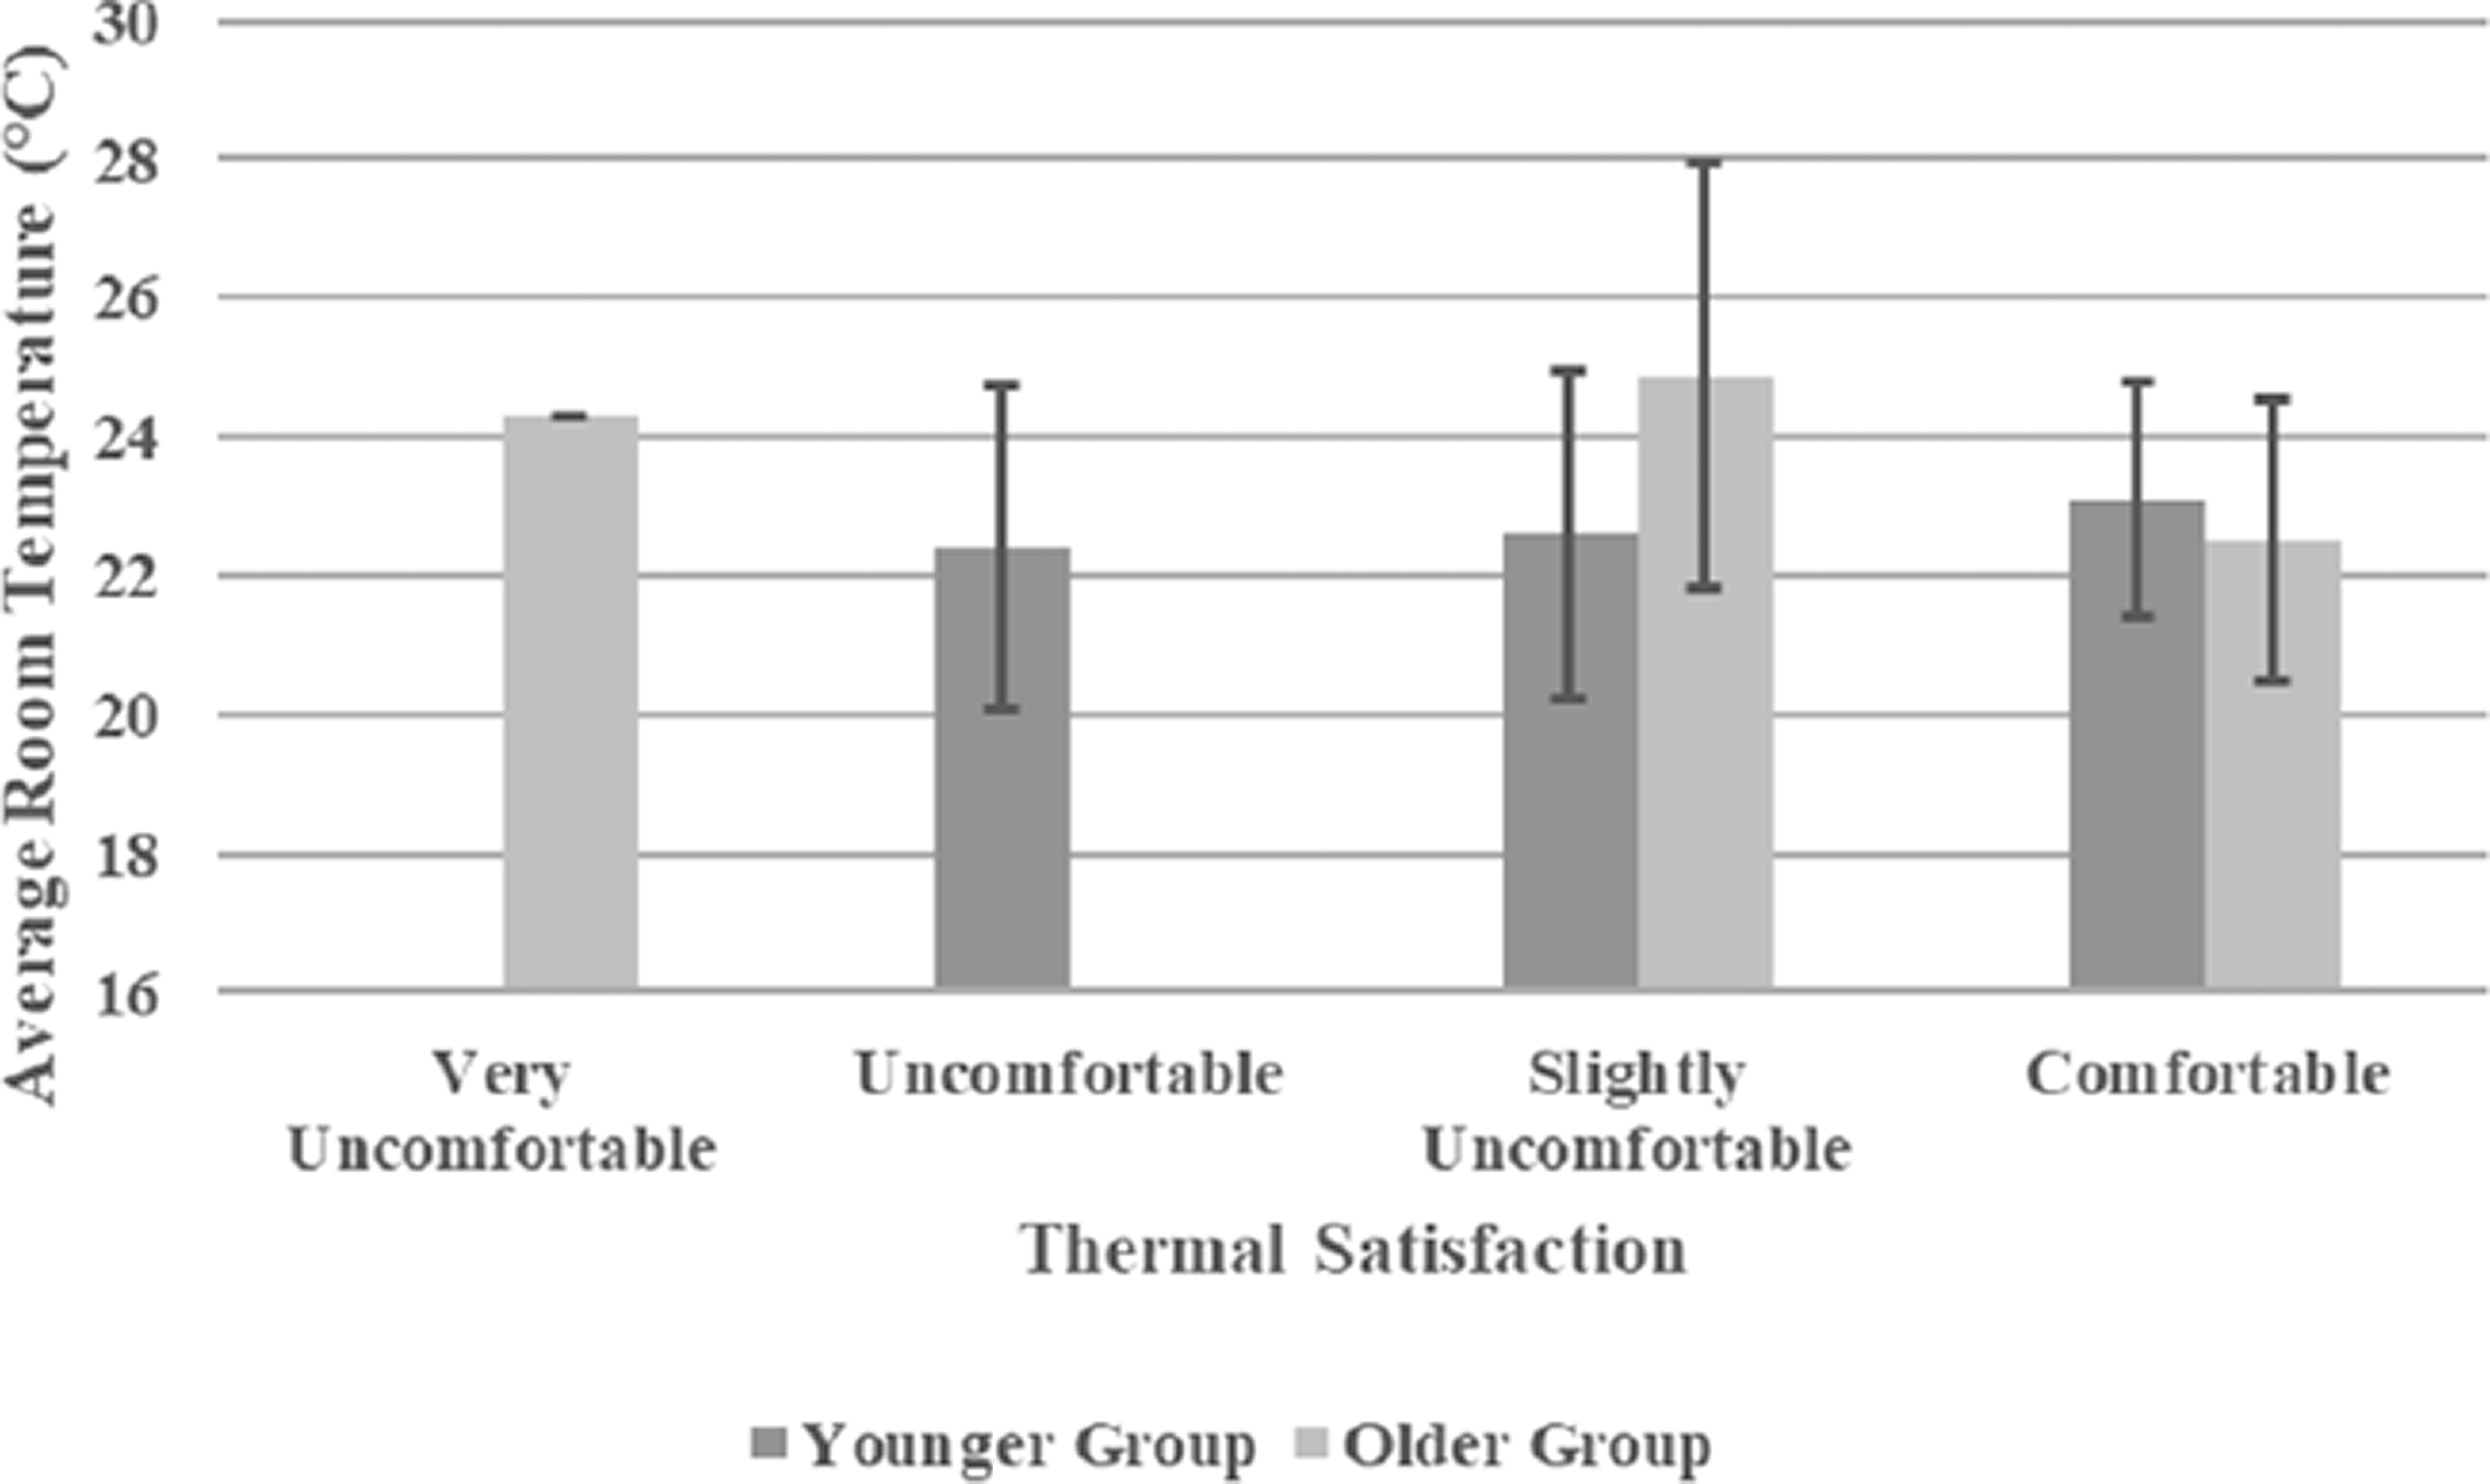
Thermal satisfaction of the younger and older groups vs. average room temperature.
Figure 9 shows the thermal preference of the younger and older groups at different room temperatures. The younger group voted ‘without change’ in 47.7% of their answers at an average temperature of 23.3 ± 1.8°C, voted ‘slightly cooler’ in 20.5% of their answers at an average temperature of 23.5 ± 1.9°C and voted ‘slightly warmer’ in 27.3% of their answers at the average temperature of 21.3 ± 1.7°C. One young participant voted ‘cooler’ at 24.8°C, and another young participant voted ‘warmer’ at 24.7°C. The older group voted ‘without change’ in 83.6% of their answers at an average temperature of 22.5 ± 2.0°C, voted cooler in 3.6% of their answers at an average temperature of 25.9 ± 1.5°C and voted slightly warmer in 7.3% of their answers at the average temperature of 21.8 ± 1.9°C. One older participant voted slightly cooler at 28.3°C. In addition, the thermal preference of the younger and older groups was significantly correlated with the room temperature (r = −0.33, p = 0.04; r = −0.28, p = 0.04). According to the regression equations, the preferential temperature can be produced, which were 23.5°C for the younger group and 23.4°C for the older group, respectively.
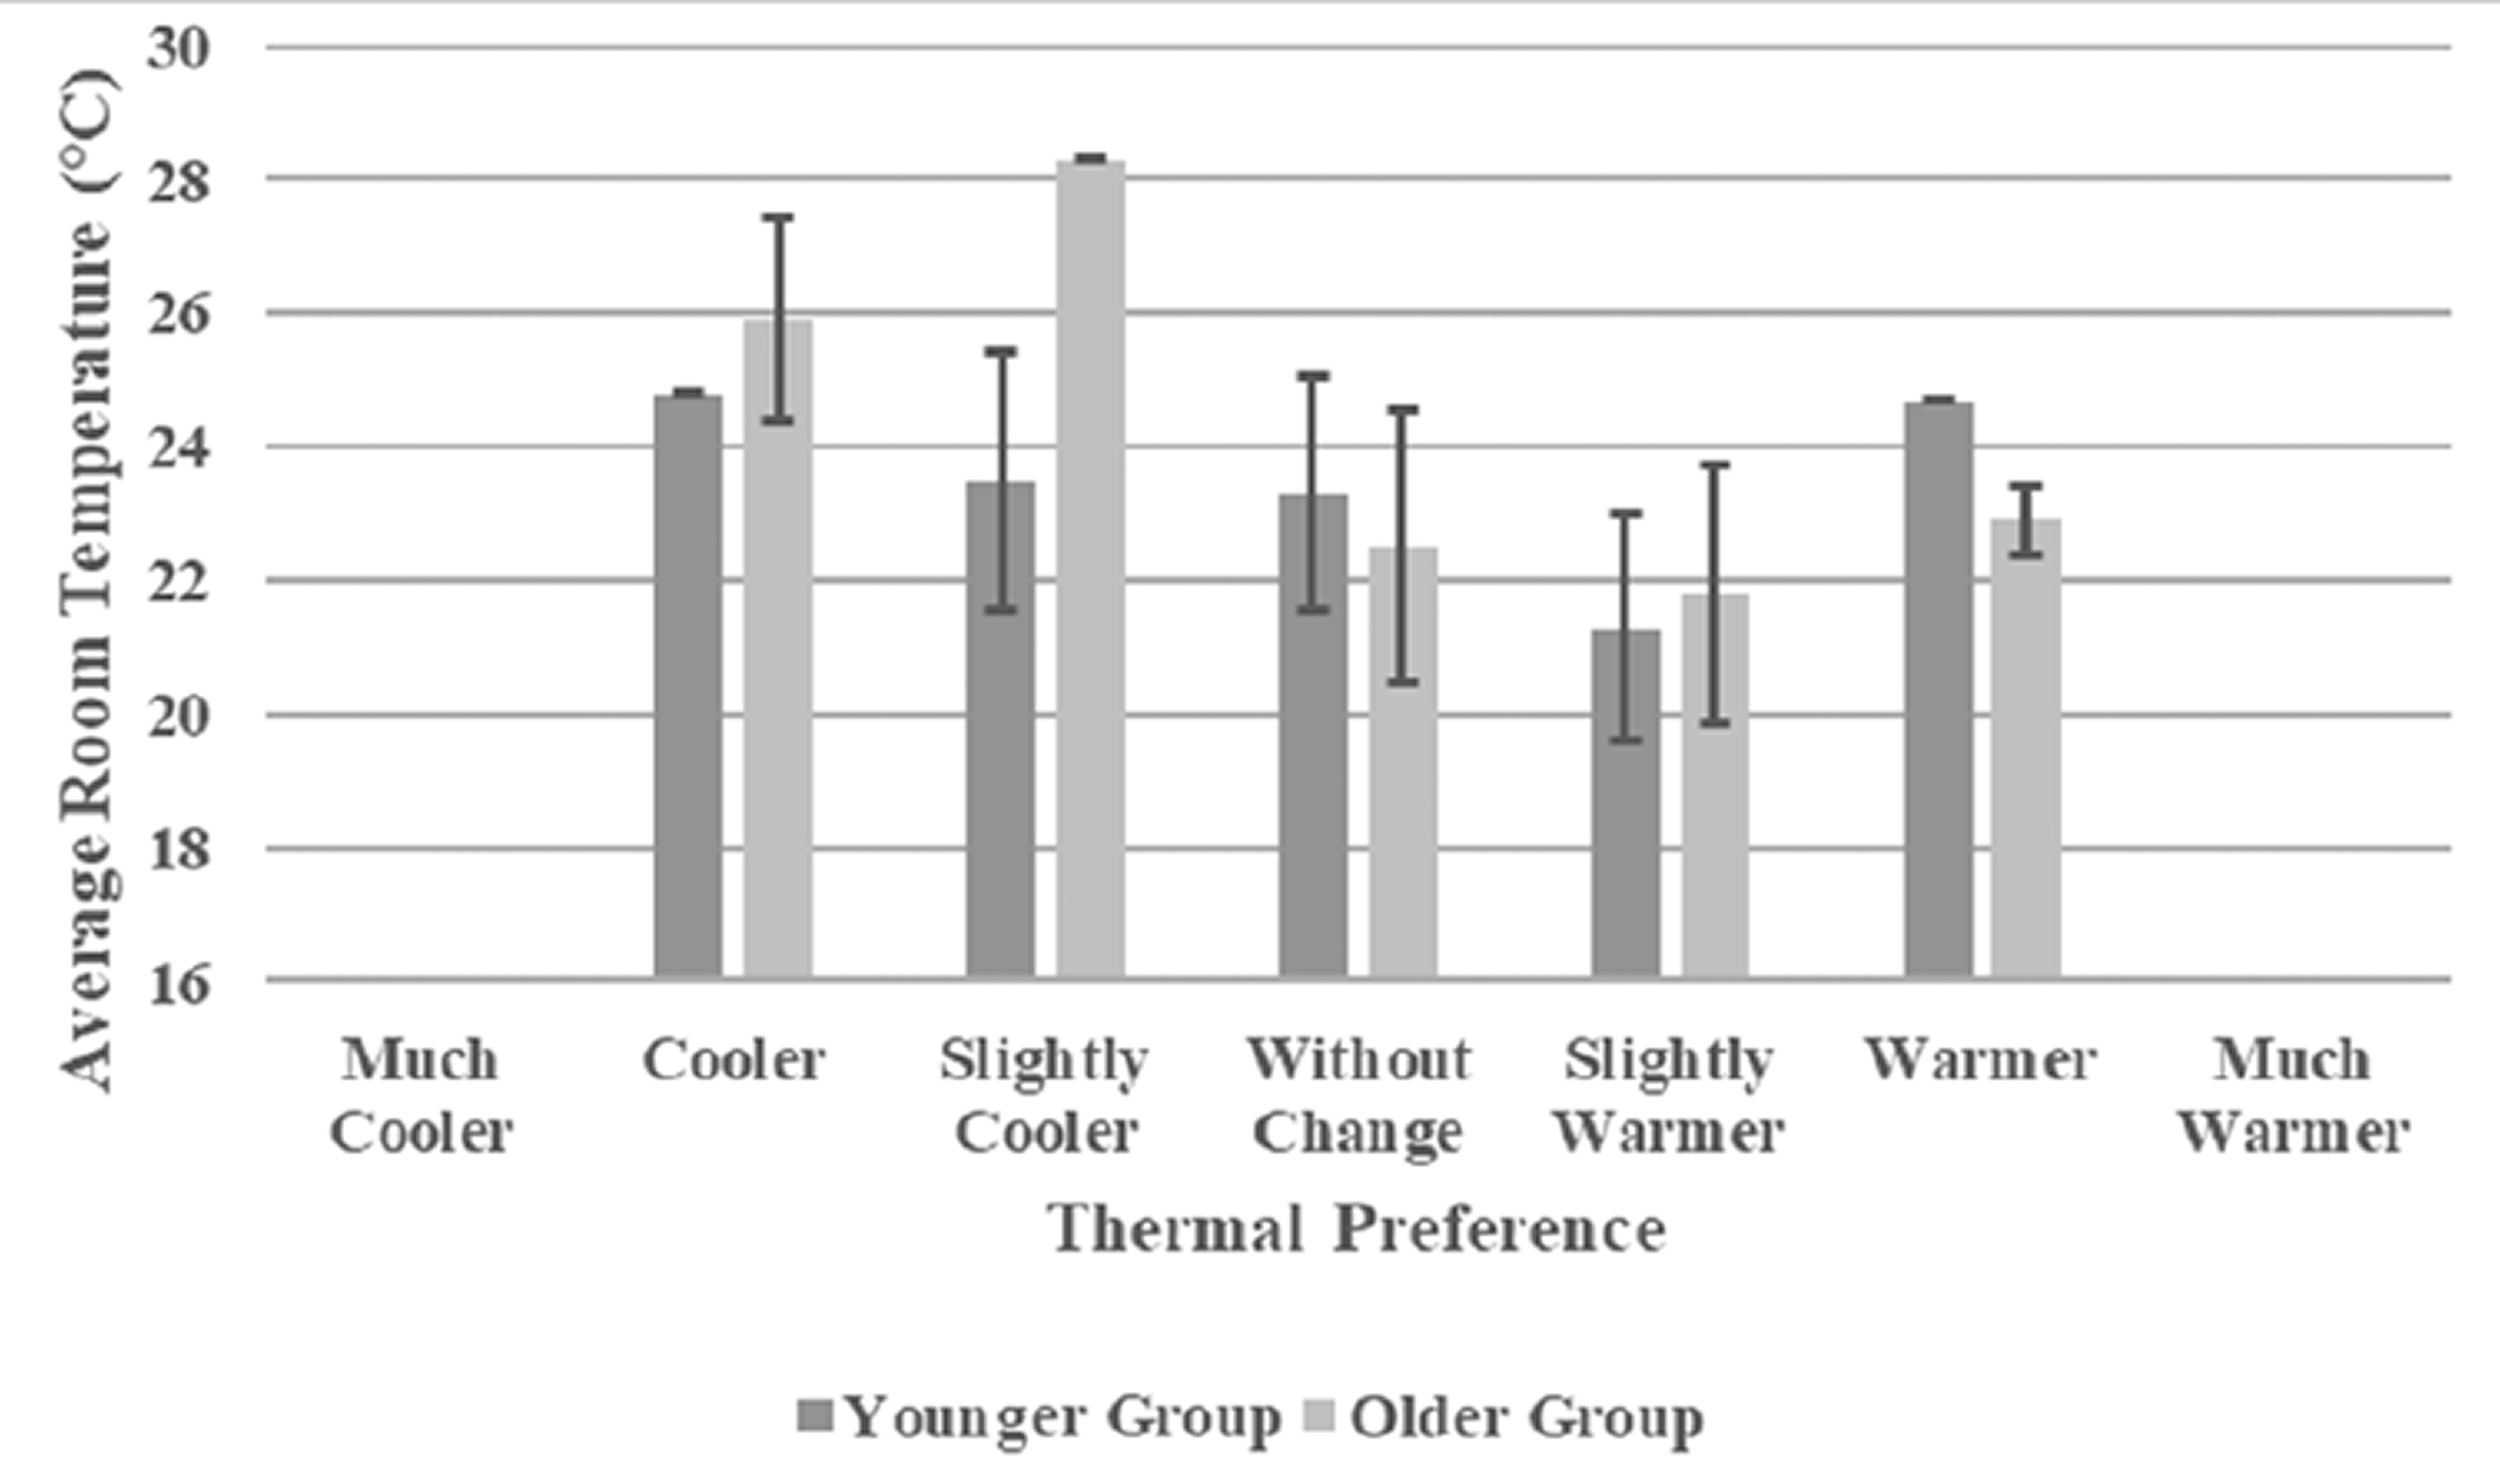
Thermal preference of the younger and older groups vs. average room temperature.
Humidity comfort
Figure 10 shows the humidity sensation of the younger and older groups at different room RH settings. The young group voted ‘neutral’ in 45.5% of their answers at an average RH of 42.7 ± 8.6%, voted ‘slightly dry’ in 22.7% of their answers at an average RH of 39.2 ± 10.7%, voted ‘slightly moist’ in 6.8% of their answers at an average RH of 50.0 ± 15.1%, and voted ‘dry’ in 9.1% of their answers at an average RH of 34.1 ± 4.8%. The older group voted neutral in 83.6% of their answers at an average RH of 39.6 ± 7.2%, voted slightly dry in 10.9% of their answers at an average RH of 44.4 ± 8.8%, and voted slightly moist in 3.6% of their answers at an average RH of 28.3 ± 0.8%. One older participant voted dry at 36.4% RH. In addition, the humidity sensation of the younger and older groups was not significantly correlated with the room RH (p = 0.10; p = 0.32), suggesting both the younger and older groups could not sense humidity changes in the RH range 23.1% to 68.5%.
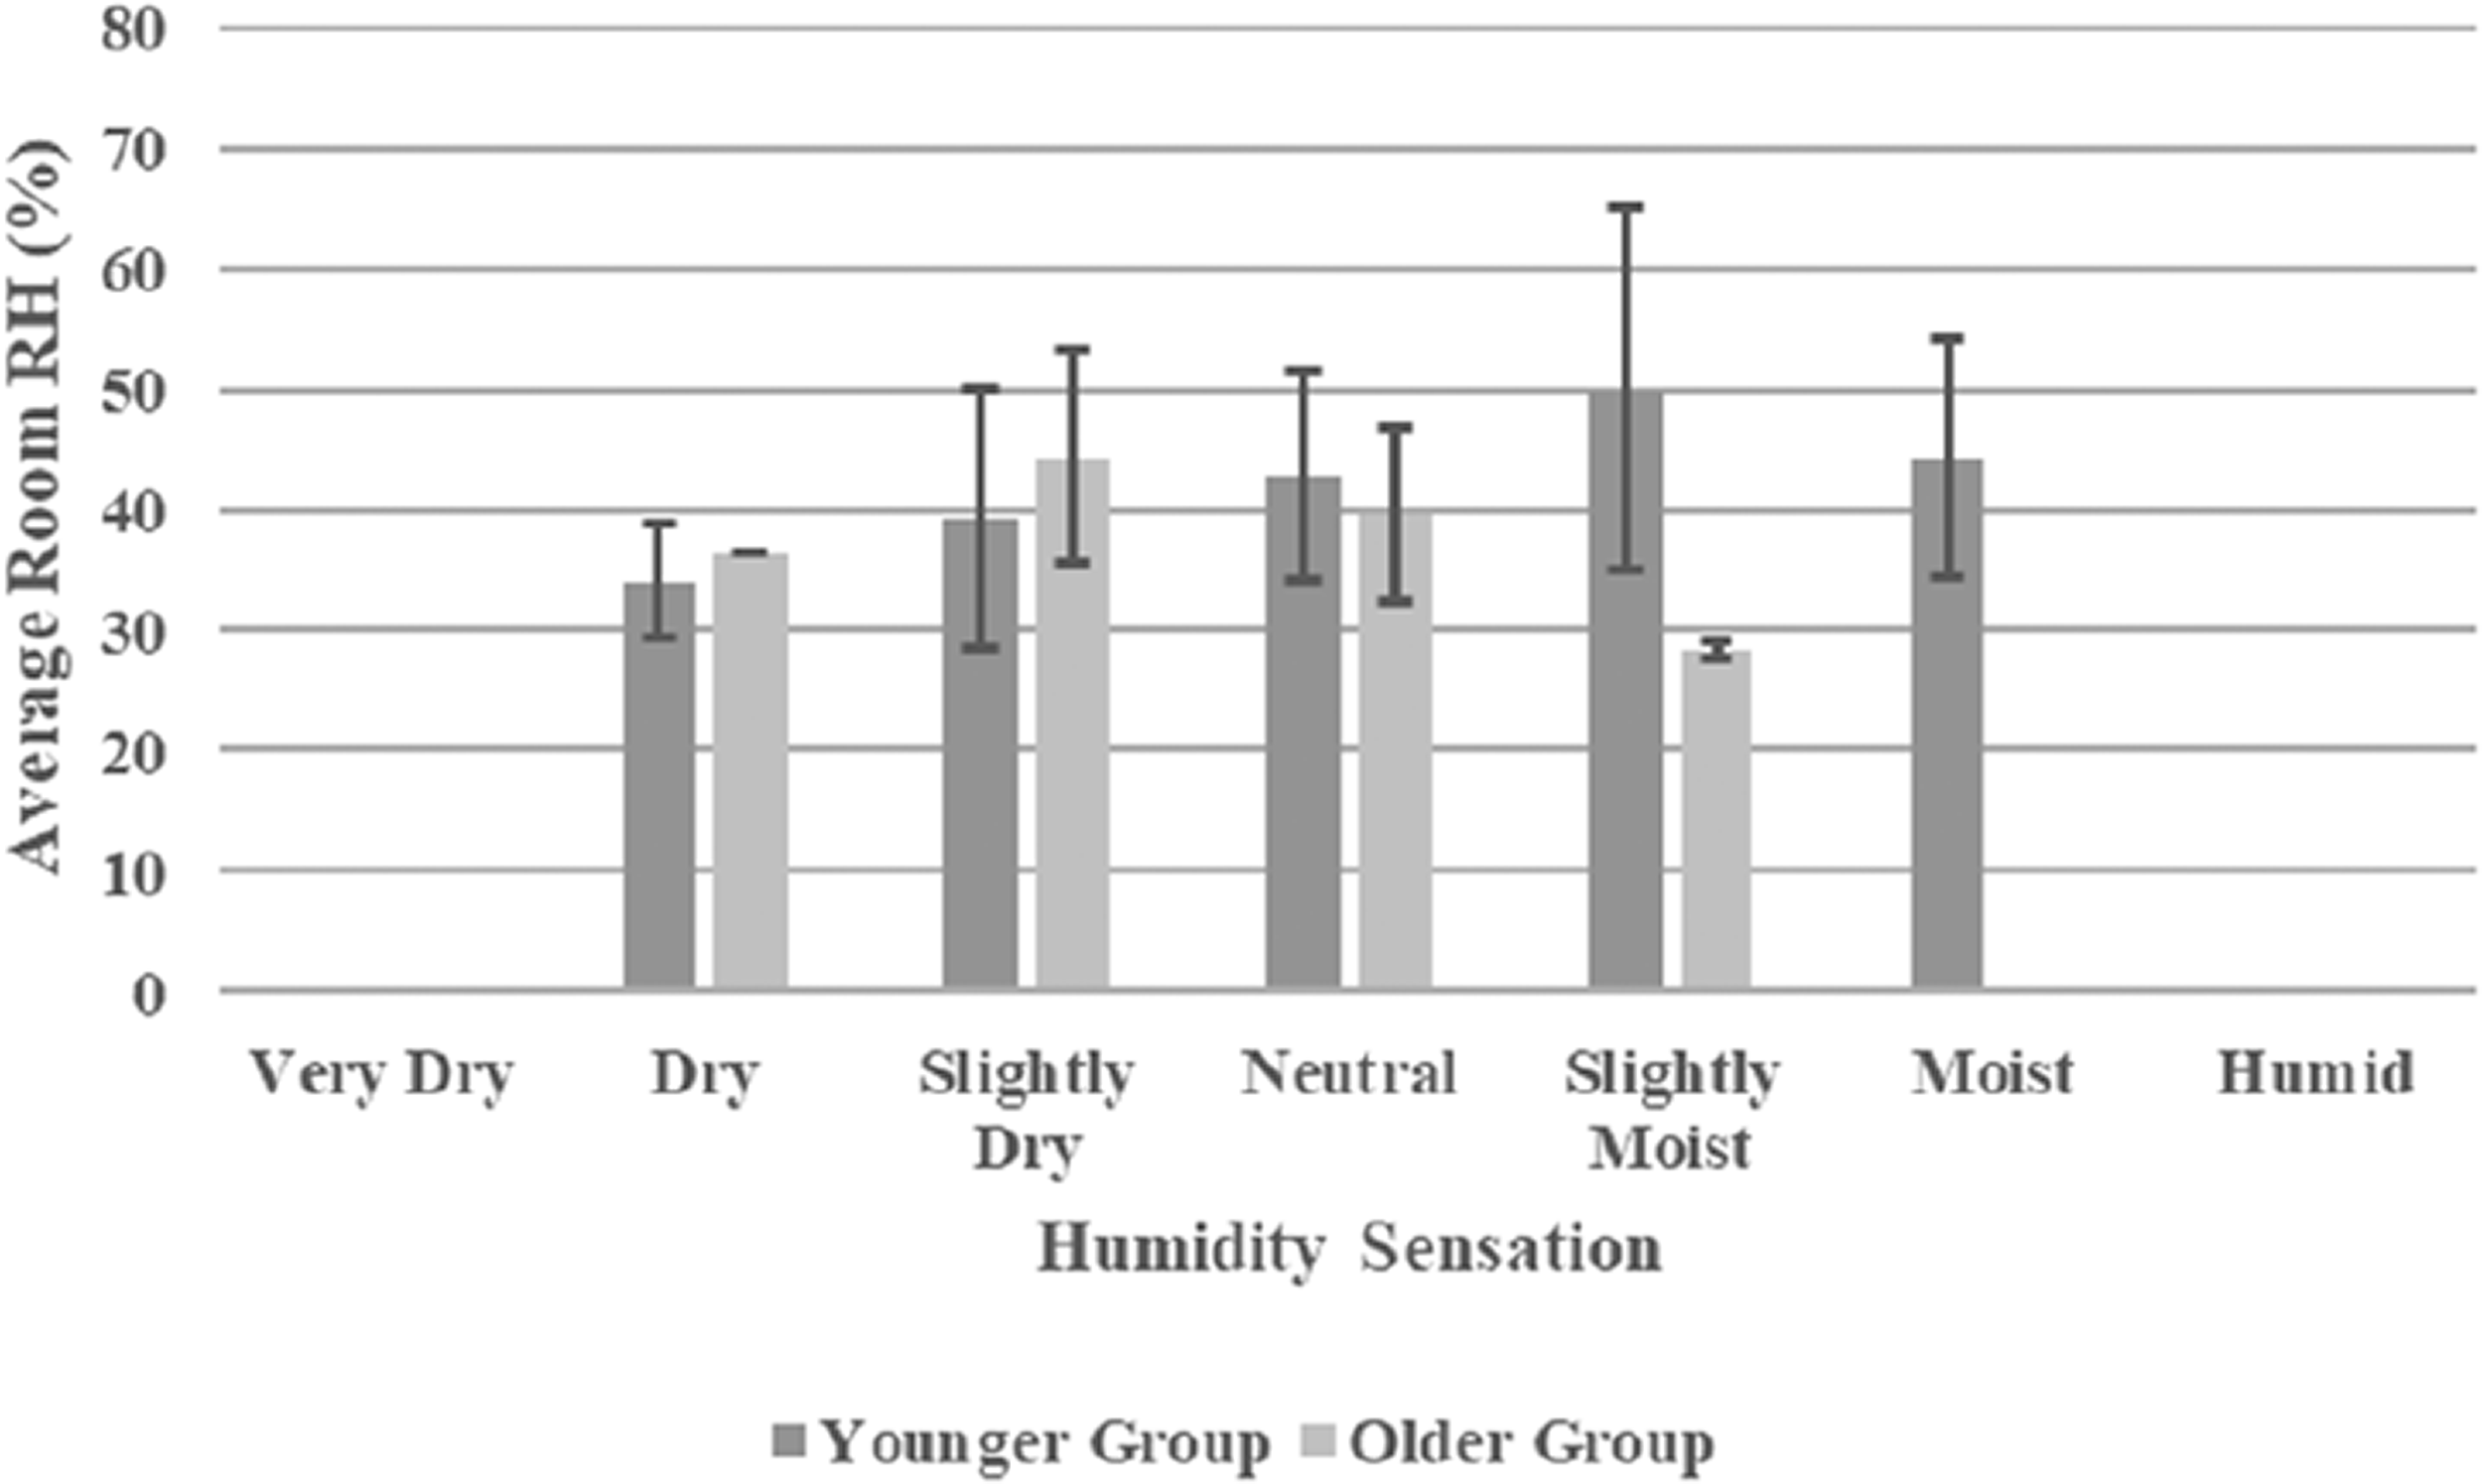
Humidity sensation of the younger and older groups vs. average room RH.
Figure 11 shows the humidity satisfaction of the younger and older groups as a function of room RH. The young group voted comfortable in 56.8% of their answers at an average RH of 41.5 ± 7.9%, voted slightly uncomfortable in 36.4% of their answers at an average RH of 41.4 ± 11.8% and voted uncomfortable in 6.8% of their answers at an average RH of 48.7 ± 16.8%. The older group voted comfortable in 87.3% of their answers at an average RH of 39.7 ± 7.2% and voted slightly uncomfortable in 10.9% of their answers at an average RH of 44.1 ± 9.3%. One older participant voted very uncomfortable at 36.4% RH. In addition, the humidity satisfaction of the younger and older groups was not significantly correlated with the room RH (p = 0.38; p = 0.26).
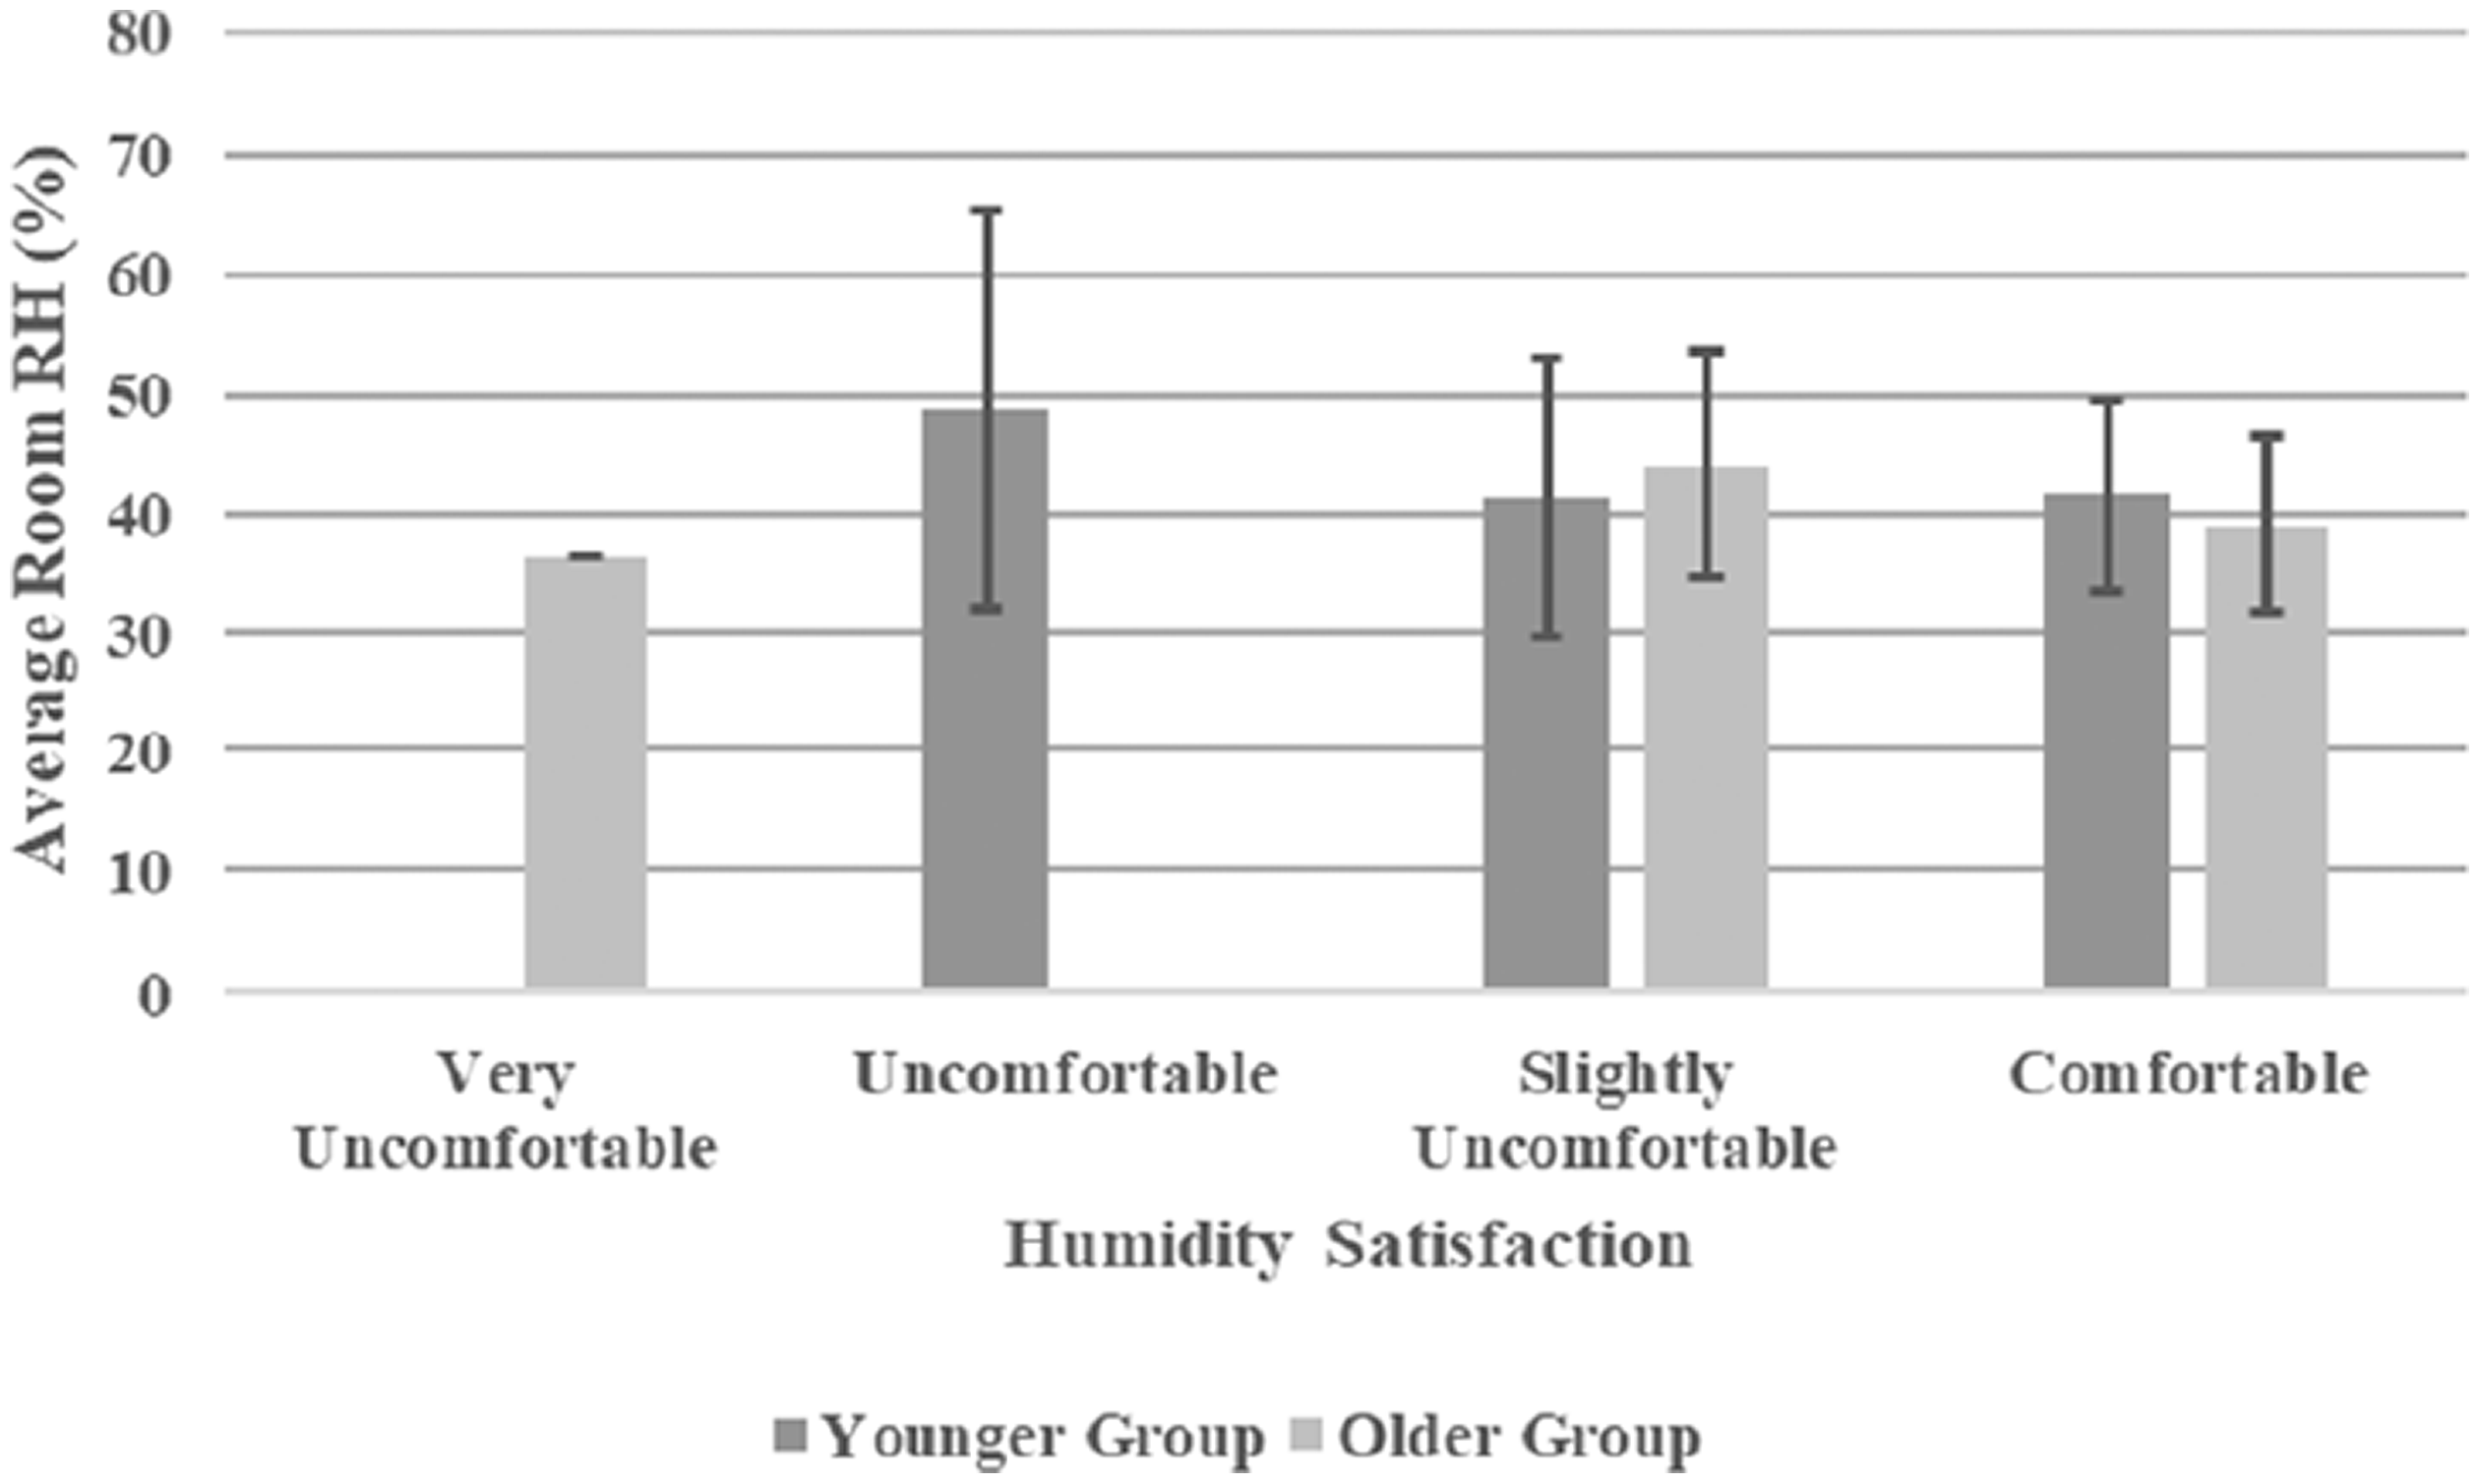
Humidity satisfaction of the younger and older groups vs. room RH.
Figure 12 shows the humidity preference of the young and older groups at different room RH levels. The younger group voted ‘without change’ in 50.0% of their answers at an average RH of 41.8 ± 8.2%, voted ‘slightly dryer’ in 13.6% of their answers at an average RH of 54.2 ± 9.7%, voted ‘slightly moister’ in 29.5% of their answers at an average RH of 37.3 ± 9.4% and voted ‘moister’ 6.8% of their answers at an average RH of 37.4 ± 9.2%. The older group voted without change in 80.0% of their answers at an average RH of 40.1 ± 6.4%, voted slightly dryer in 12.7% of their answers at an average RH of 35.7 ± 10.0% and voted slightly moister in 5.5% of their answers at an average RH of 46.4 ± 8.7%. One older participant voted moisture at 24.3% RH. In addition, the humidity preference of the younger group was significantly correlated with the room RH (r = −0.38, p = 0.004). According to the regression equation, the preferable RH of the younger group can be produced, which was 51.0%. However, the humidity preference of the older group was not significantly correlated with the room RH (p = 0.23).
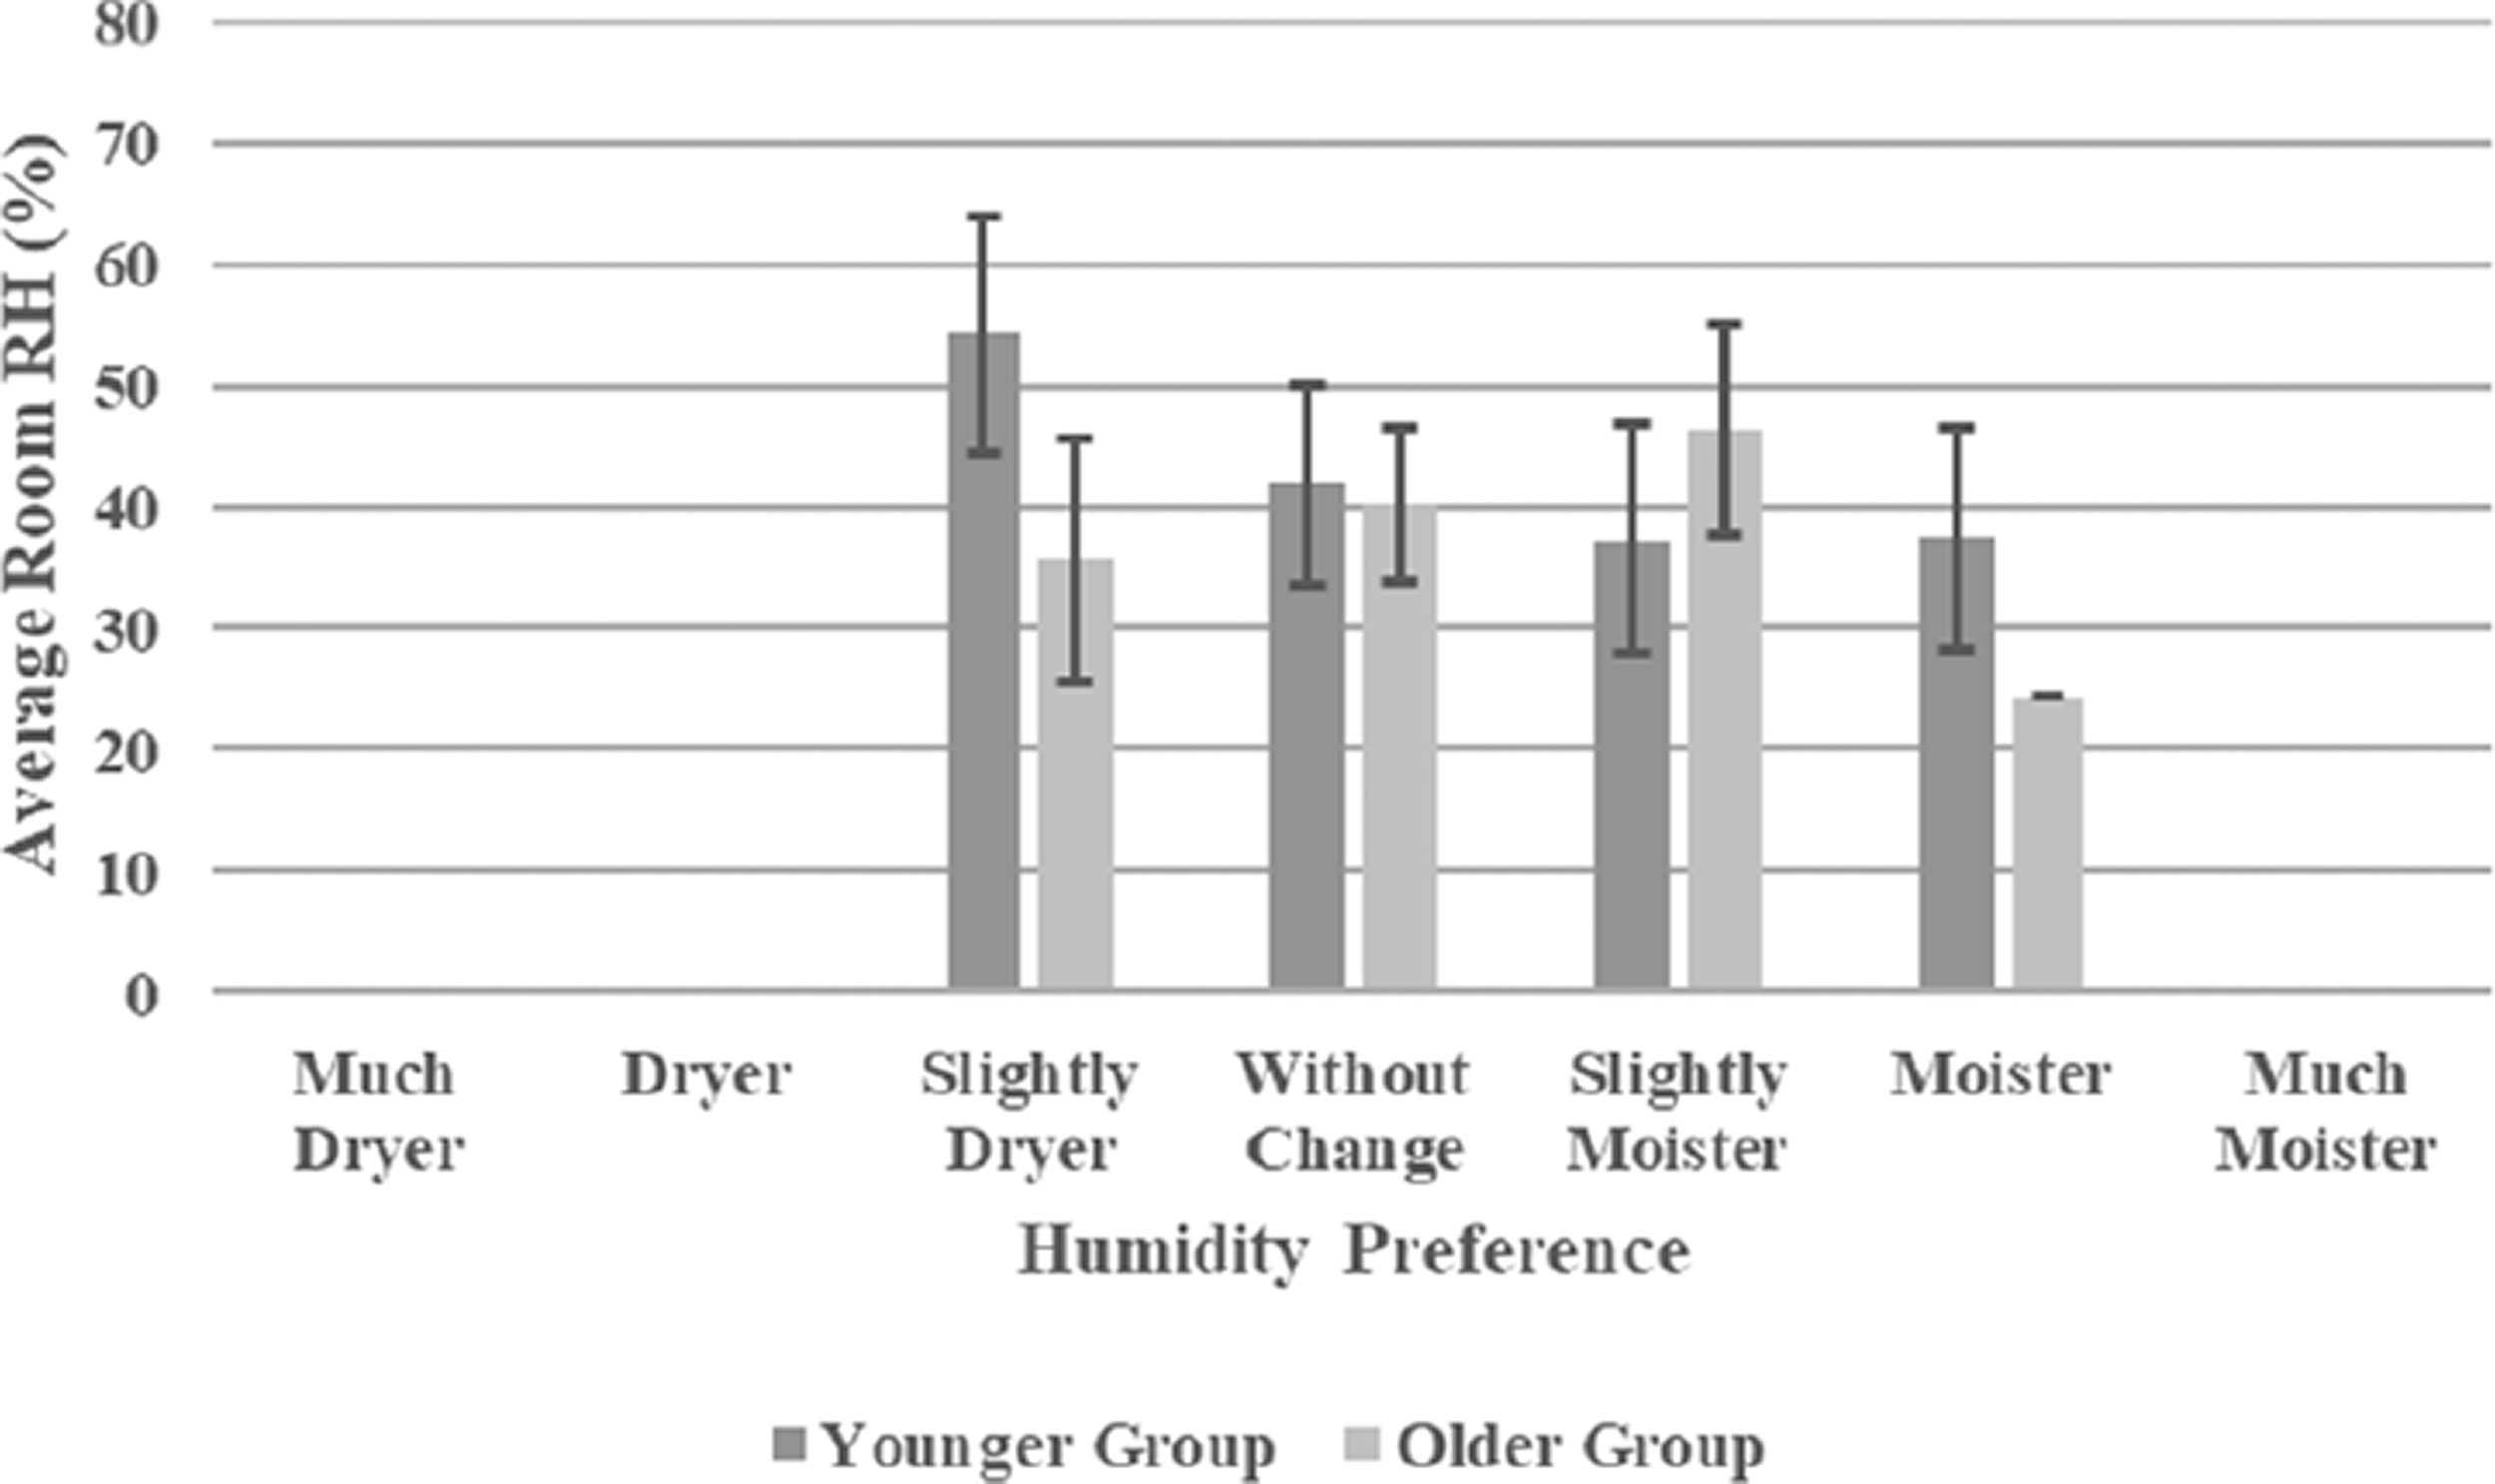
Humidity preference of the younger and older groups vs. room RH.
Skin condition
Figure 13 shows the measured TEWL of the younger and older groups as a function of the room temperature, RH and AH. The TEWL was not significantly correlated with the room temperature in the younger (p = 0.82) and older (p = 0.12) groups. Besides, it was not significantly correlated with neither the room RH (p = 0.22 in the younger group and p = 0.56 in the older group) nor AH (p = 0.15 in the younger group and p = 0.45 in the older group).
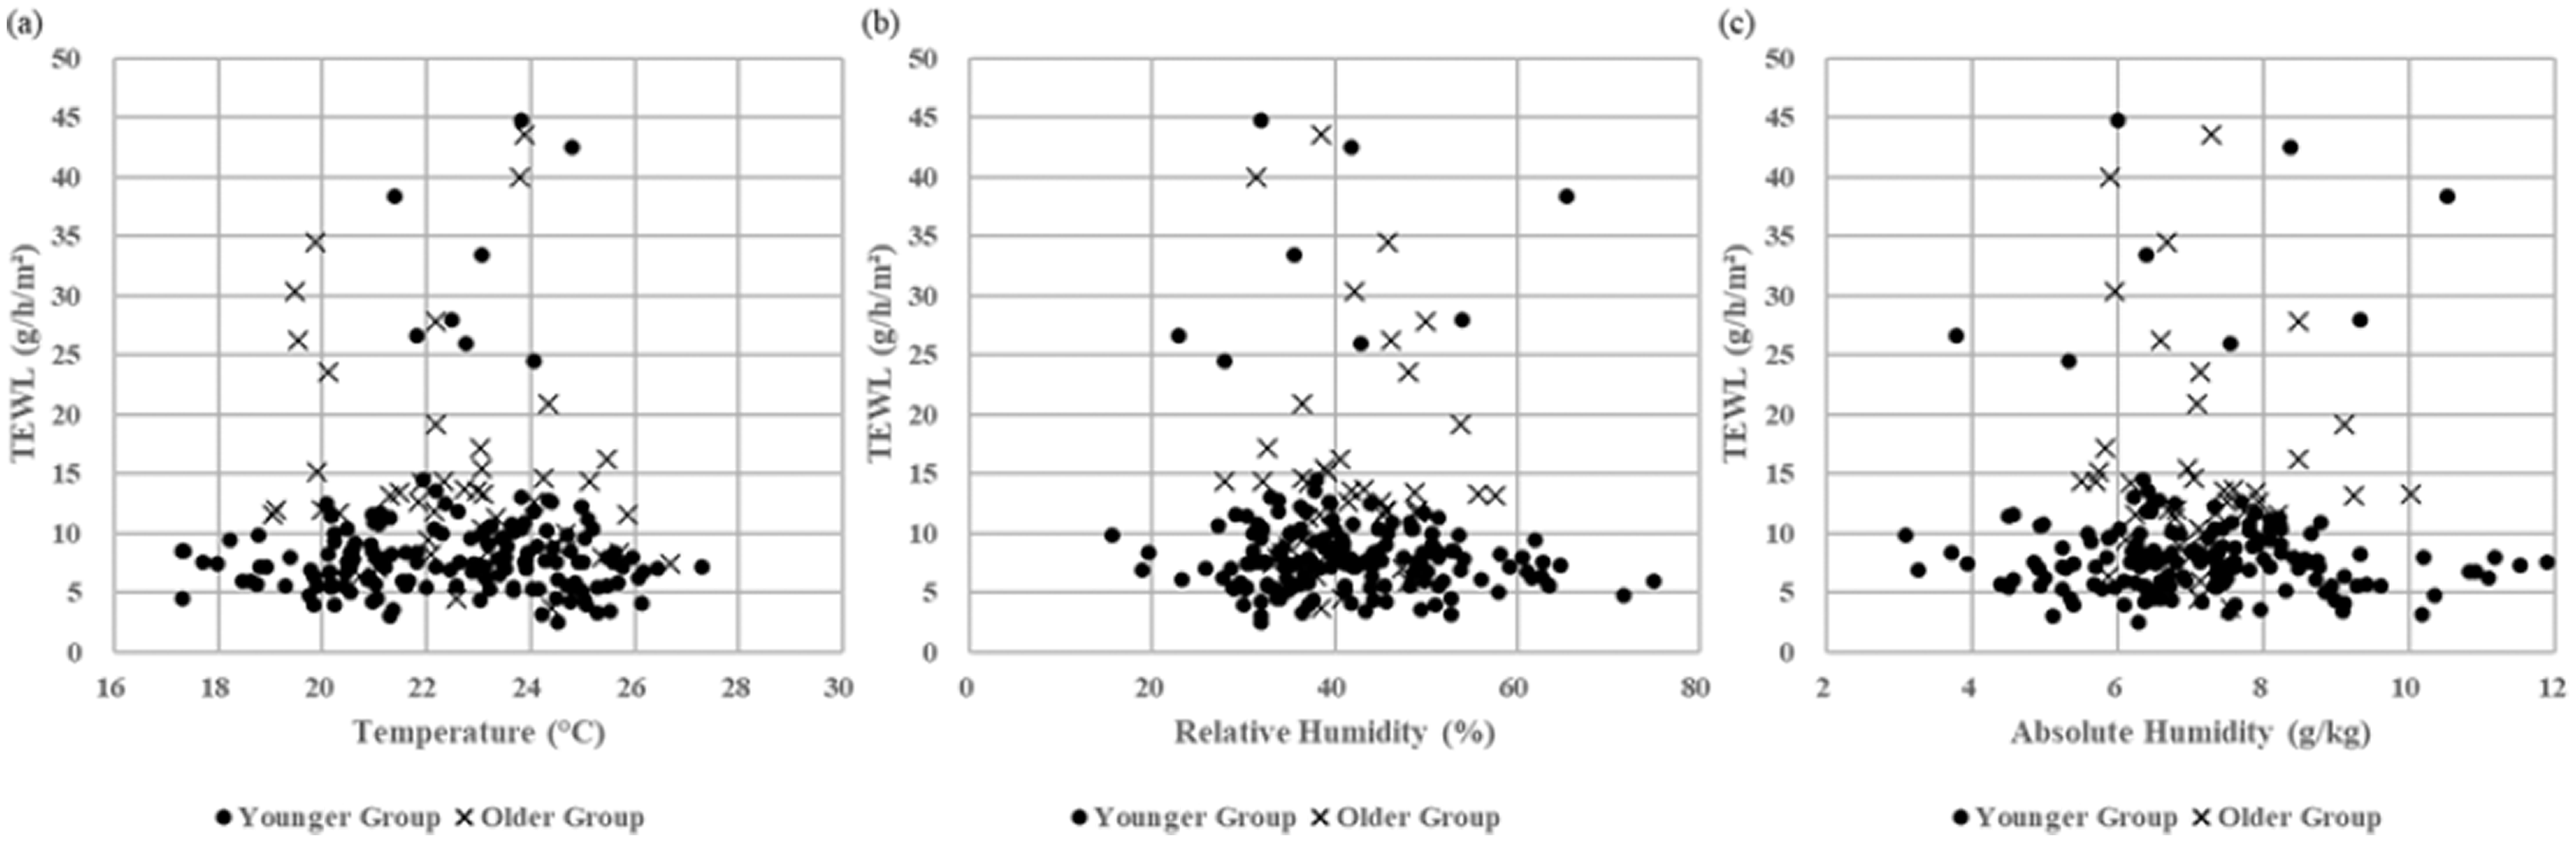
TEWL of the younger and older groups as a function of room temperature, RH and AH. (a) TEWL vs. Temperature, (b) TEWL vs. RH and (c) TEWL vs. AH.
Figure 14 shows the SCH of the young and older groups as a function of room temperature and RH. The SCH was not significantly correlated with the room temperature in the younger (p = 0.13) and older (p = 0.09) groups. Besides, it was significantly correlated with the room RH in the younger group (r = 0.23, p = 0.005) in the temperature range of 22.8 ± 0.5°C, but not in the older group (p = 0.48).
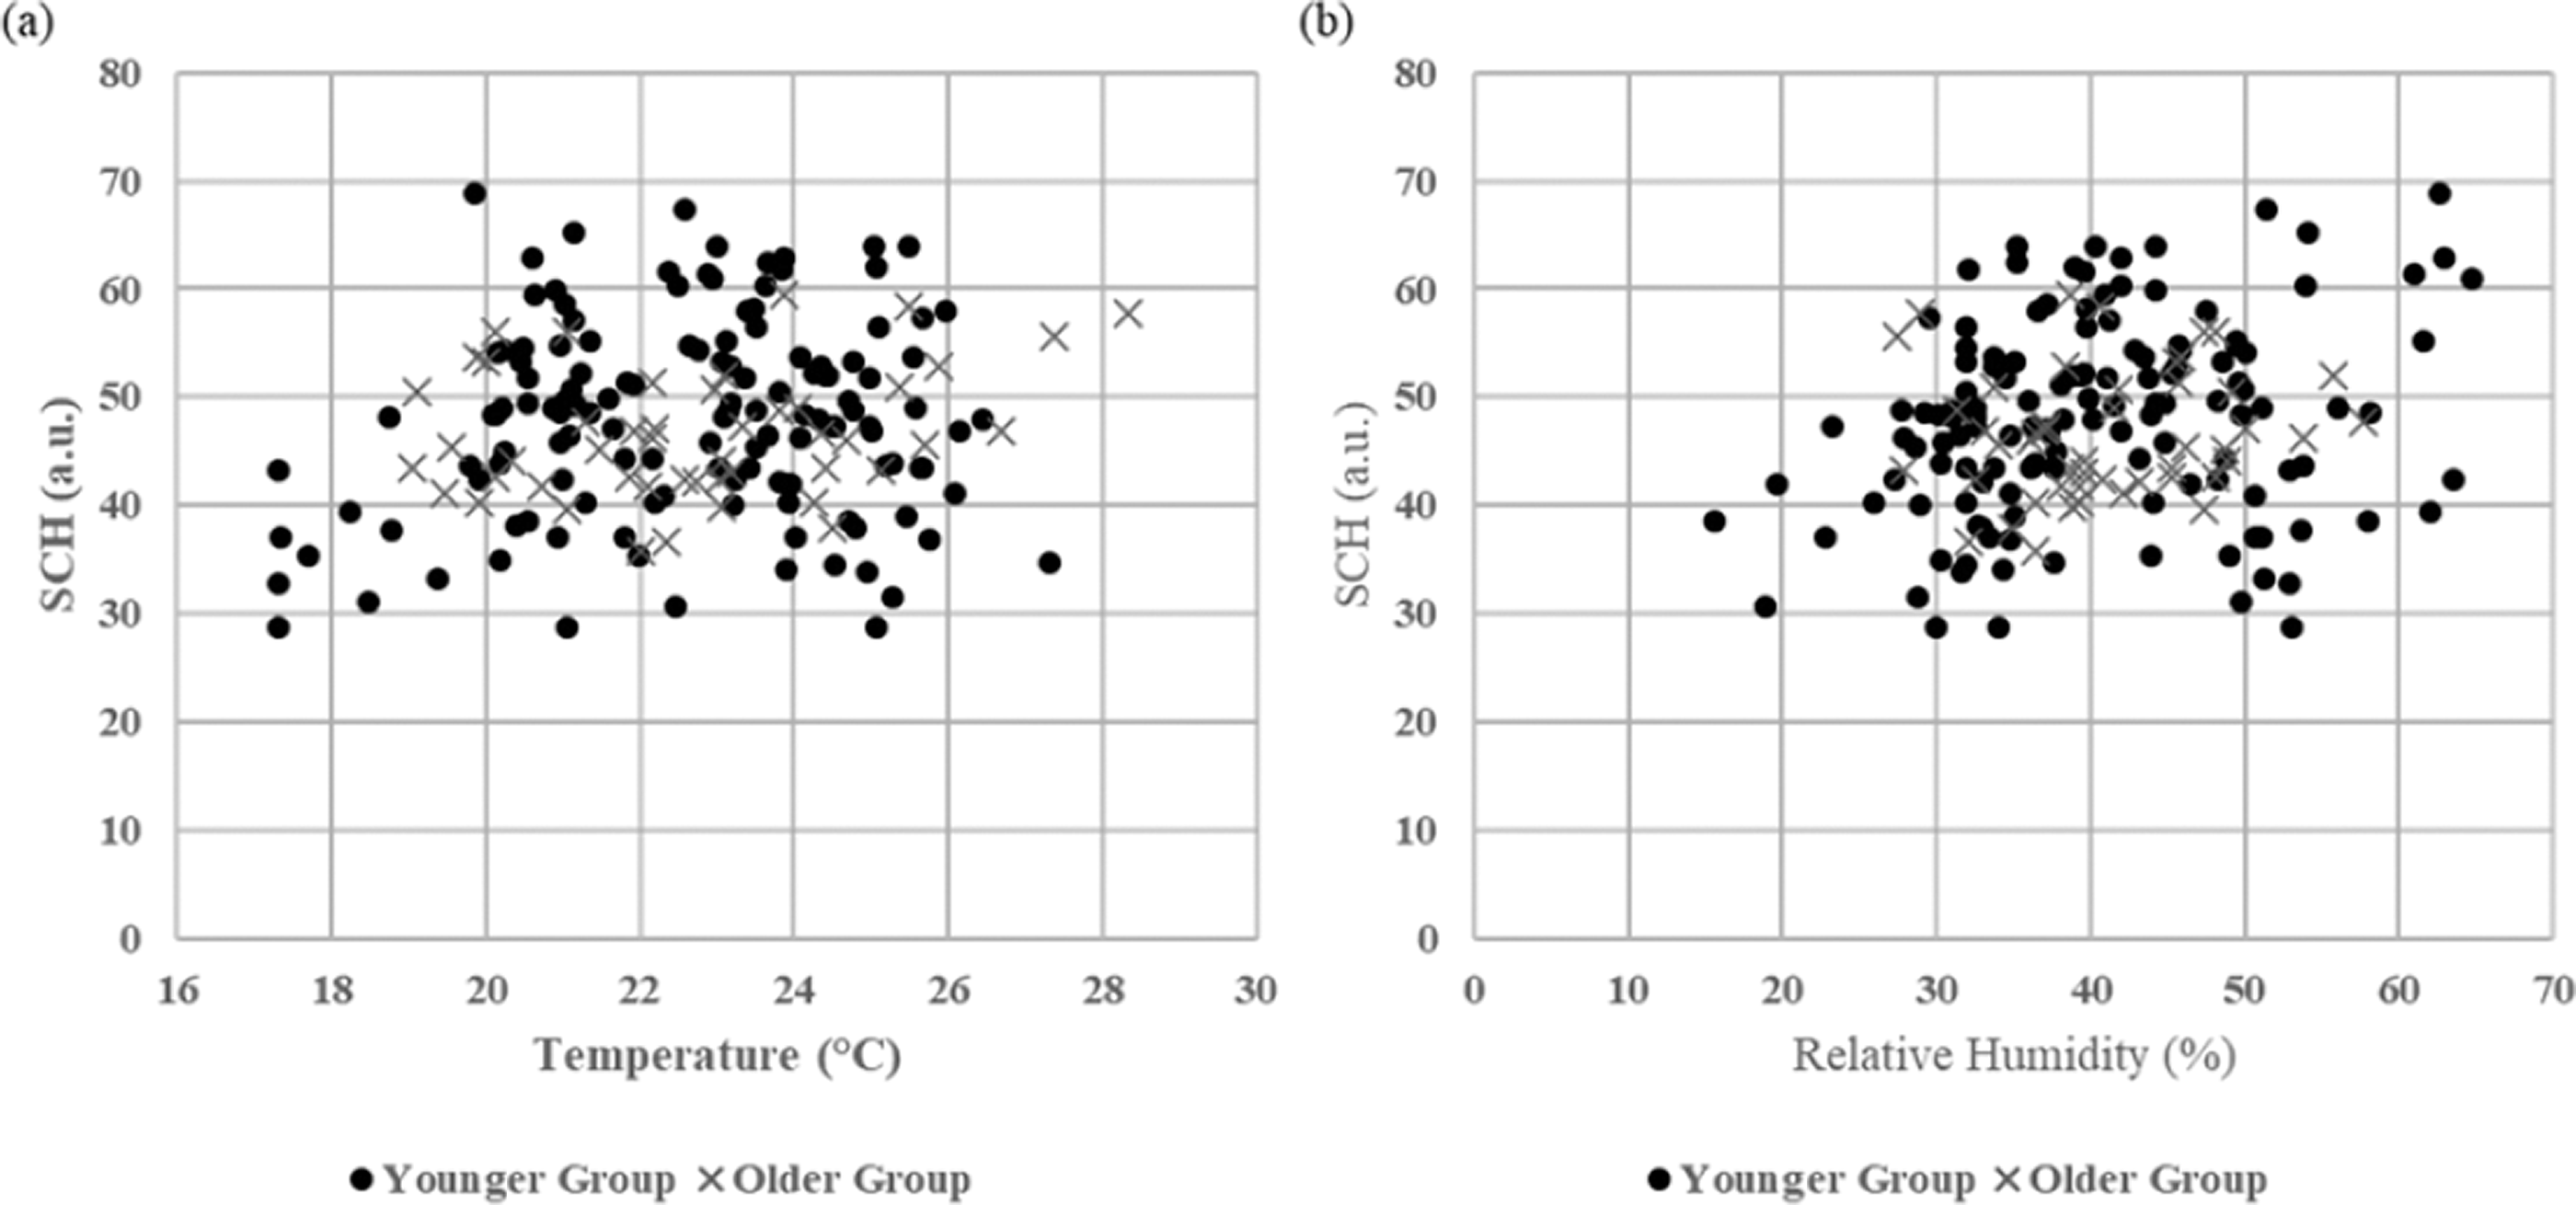
SCH of the younger and older groups as a function of room temperature and RH. (a) SCH vs. Temperature, (b) SCH vs. RH.
Figure 15 shows the SCH of the younger and older groups as a function of room AH. The SCH was significantly correlated with the room AH in the younger group (r = 0.38, p < 0.001) in the temperature range of 22.8 ± 0.5°C and older group (r = 0.36, p = 0.011) in the temperature range of 22.9 ± 0.7°C. According to the regression equations, the minimum AH level that could reduce the risk of suffering dry skin can be produced, which are 7.952 g/kg for the younger group and 8.622 g/kg for the older group, corresponding to 45.1% RH for the younger group and 48.9% RH for the older group at 23°C and 101.3 kPa.
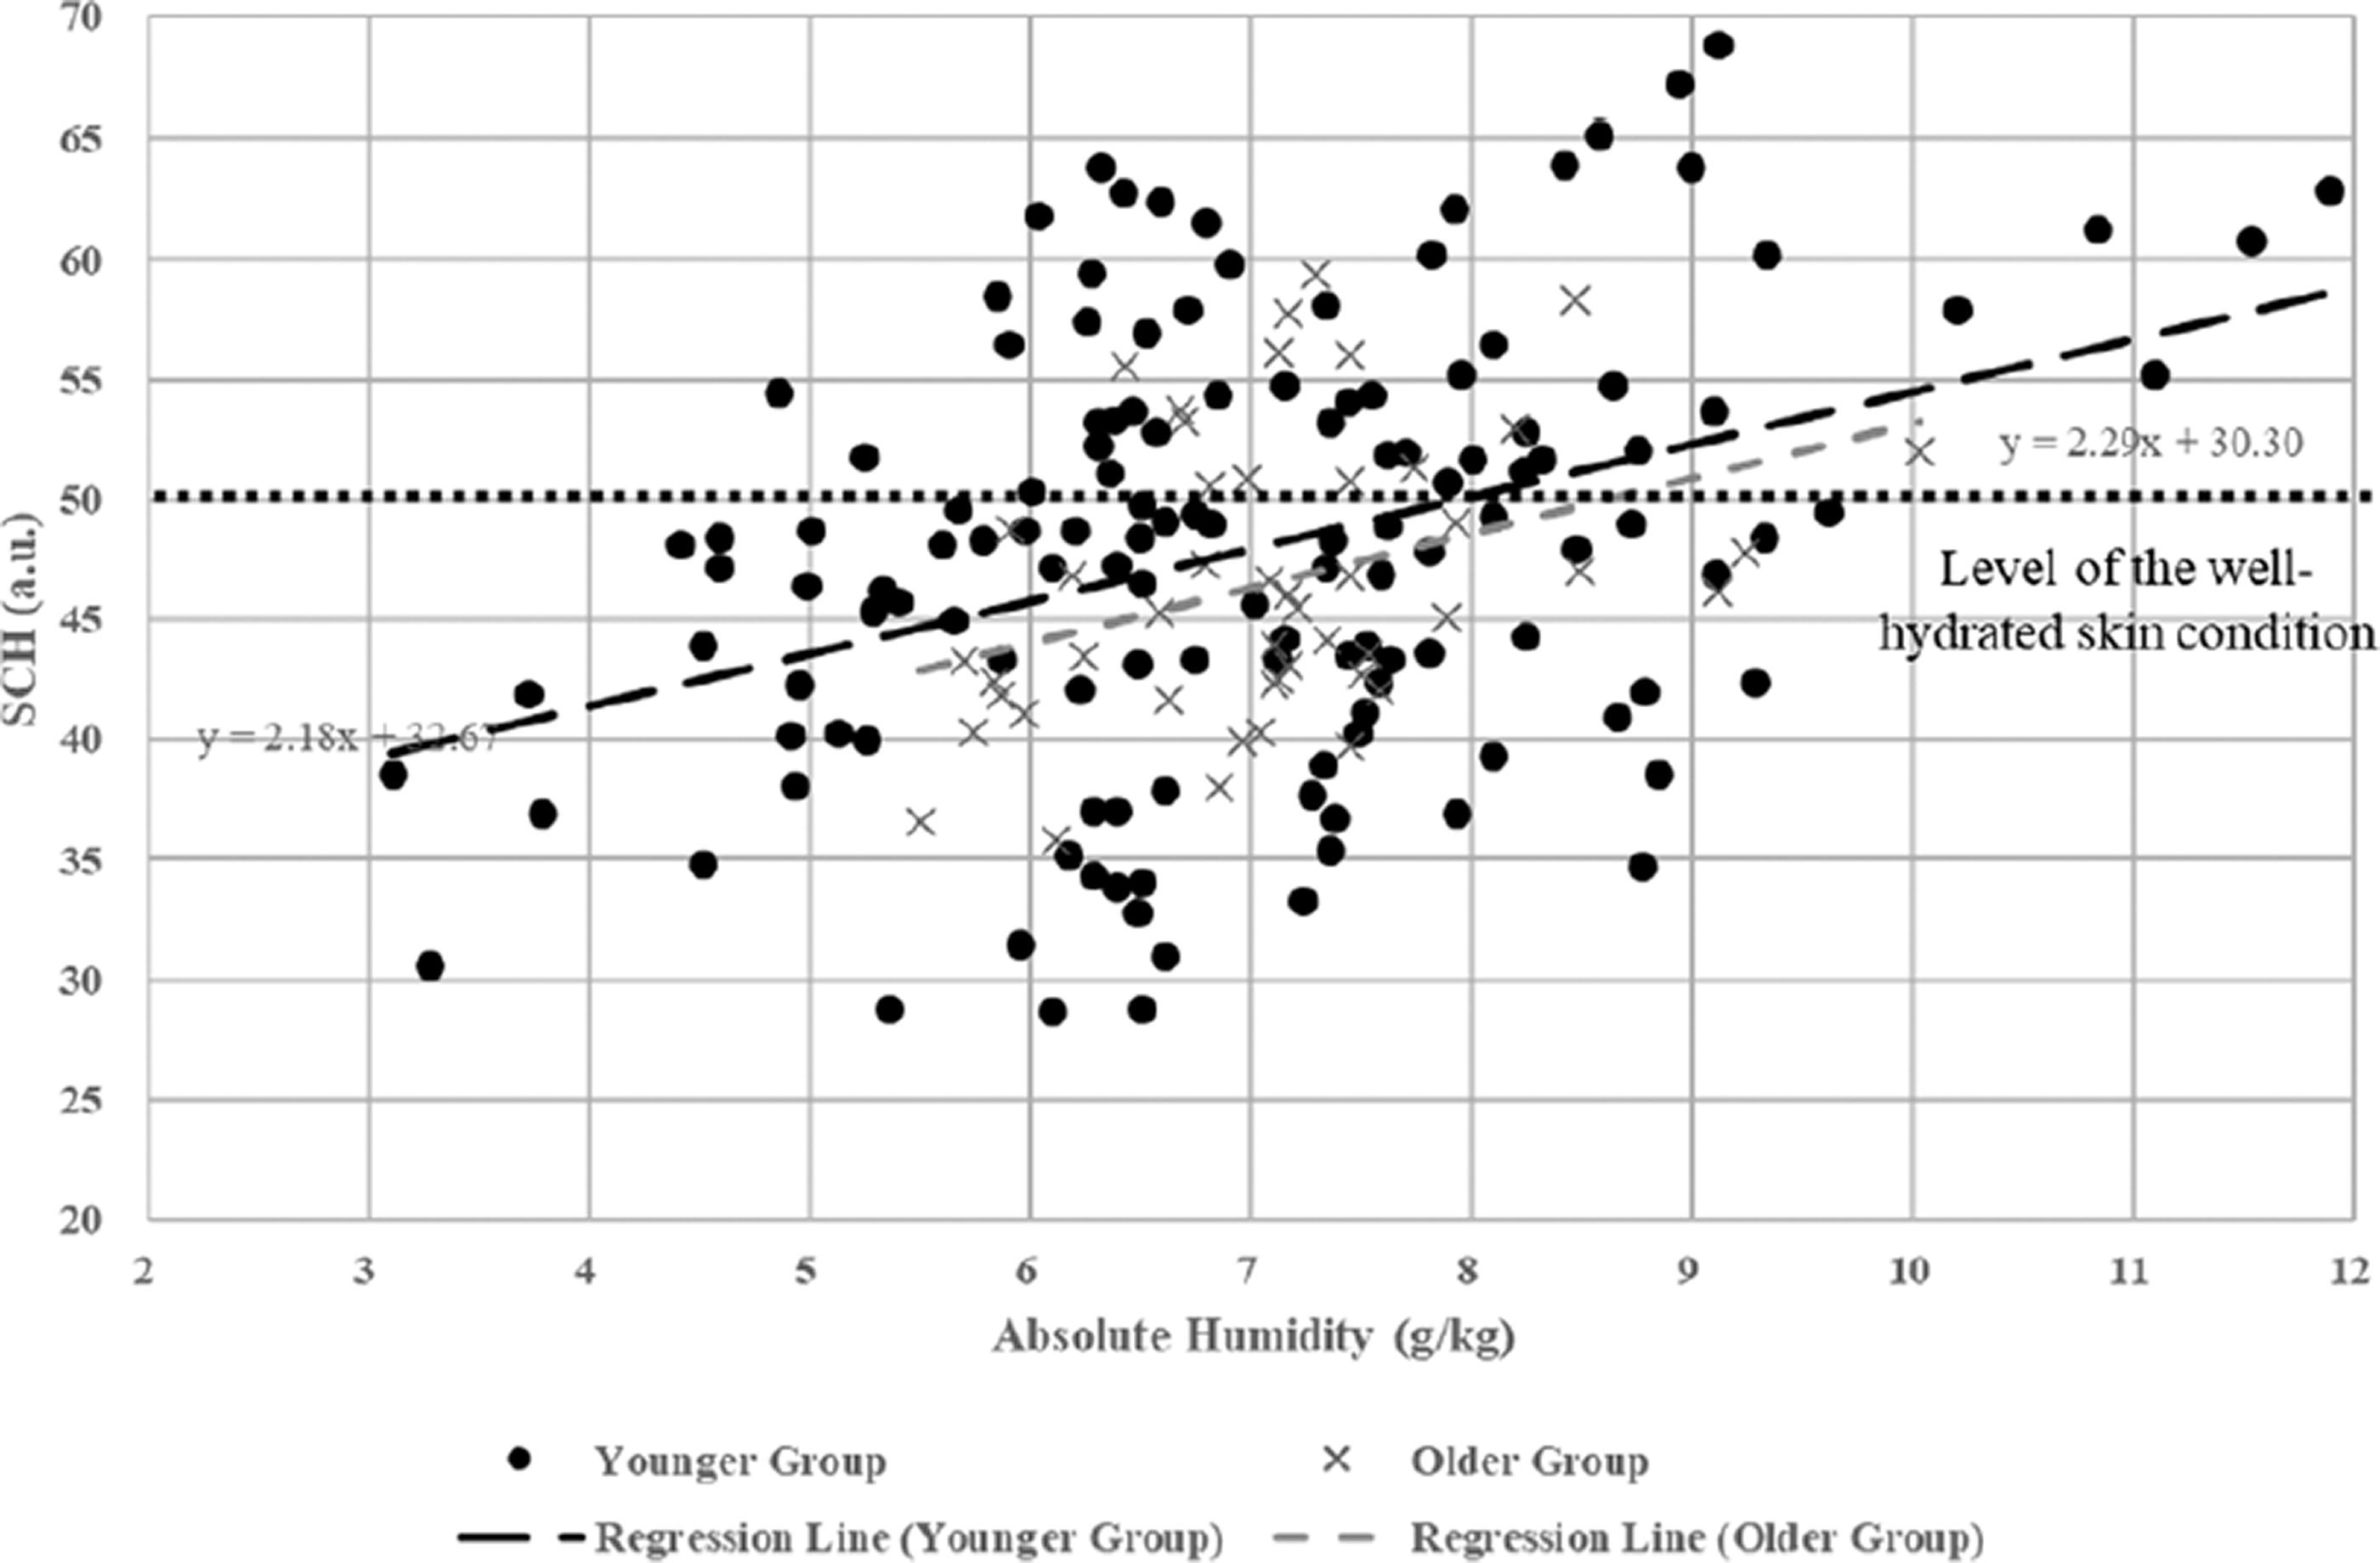
SCH of the younger and older groups as a function of room AH.
Discussion
Indoor environment
In the measured rooms, the temperature was stable and within the thermal comfort range most of the time, while the RH was low and did not meet the minimum acceptable level of 40% RH, as was recommended by CIBSE. 7 The temperature in the measured rooms at the two research sites was well maintained at approximately 23°C (Figure 5), which is the upper level of the comfort zone in winter as was recommended by CIBSE. 7 On the contrary, the average RH in the measured rooms on the two research sites was just over 30% RH, lower than the minimum acceptable humidity level as was recommended by CIBSE. 7 Such a thermally comfortable but dry environment in winter is widely reported in relevant fieldwork studies. In this case, the average indoor humidity on the measured sites was lower than 30% RH.37–39 As concerns about humidity in buildings tend to focus more on high humidity and its related issues, such as lack of ventilation and mould proliferation, 37 equivalent attention should be paid to the low humidity and its related issues.
To ease the dry indoor air, a humidifier could be used in an effective and economical way. As shown in Figure 5, the average RH in the measured rooms was increased from 35.4% to 40.4% in the students’ halls of residence and from 31.0% to 37.7% in the care home in the second period when the humidity intervention was implemented, almost reaching the minimum acceptable humidity level of 40% RH. The simple domestic humidifiers used in this study provided an effective increase in the average RH at a low cost (each humidifier consumed about 2 kWh of electricity and 3 dm 3 of water a day). However, the use of a humidifier is not common in most situations, and studies on the importance of using a humidifier are few, especially on older occupants. According to a survey on the use of humidifiers in South Korea, 37.2% of the interviewed people used a humidifier in their homes during the heating season from December to February, just 3.2% of which were in the age group over 60 years old. 40 If the use of humidifiers in winter can be promoted, this would play an essential part in easing the dry air situation effectively.
Subjective comfort
For thermal comfort, both the younger and older groups were sensitive to the temperature changes, as their TSVs were significantly correlated with the measured room temperature. According to the regression equations between the TSV and temperature, the neutral temperatures at which the younger and older groups were thermally neutral are 21.6°C and 21.7°C, respectively. The result of such a similar neutral temperature between the younger and older groups is inconsistent with the understanding that older people typically prefer a 2°C warmer environment in winter in comparison with younger people.9,41 The inconsistency is probably caused by the difference in clothing insulation between the younger and older groups. As presented, the older group usually wore an extra layer of outdoor clothing in comparison with the younger group, giving the older group an extra clothing insulation level of 0.45 to 0.55 clo and reducing their need for a warmer environment. Consequently, a higher neutral temperature in the older group would be produced by TSV if the two groups were in the same clothing level. Therefore, clothing insulation is an important factor that should be considered and detailly reported in studies on older occupants’ thermal comfort. On the other hand, another similar field study involving 11 oldest-old people (88.8 ± 4.0 years old) in the equivalent clothing insulation level (1.35 to 1.55 clo) reported a neutral temperature of 22.8°C by TSV. 21 Comparting the neutral temperature of the oldest-old people with that of the older group in the current study, a suggestion can be made that the increase in the neutral temperature occurred between the older and oldest-old people.
The difference in clothing insulation level also affected the PMV of the older group in this study. As shown in Figure 10, the neutral temperature of the older group produced by PMV is 19.9°C, which is 2.7°C lower than that of the younger group. The result is also inconsistent with the understanding that older people typically prefer a warmer environment in winter in comparison to young people.9,42 The inconsistency also came from the higher clothing insulation level in the older group. If the clothing insulation level of the older group was set to the same level as the younger group (1.0 clo), the neutral temperature produced by PMV would rise to 22.6°C, which is the same as that of the younger group. The result matches the understanding that PMV does not consider the difference in the thermal comfort between the younger and older groups. 3
However, the difference in the neutral temperature produced by the PMV and TSV in this study suggests a defect of using PMV on older people. In the younger group, the PMV produced a neutral temperature close to that produced by the TSV, suggesting the PMV could accurately predict thermal comfort close to the younger people’s real sensation. However, in the older group, the PMV produced a neutral temperature of 19.9°C, approximately 2°C lower than that produced by the TSV. A temperature of 2°C away from the optimum corresponds to about 0.6 units of PMV or about 12% of predicted percentage dissatisfied (PPD), 7 suggesting the PMV method cannot accurately predict the thermal comfort of older people. The defect of applying PMV on older people is also reported in relevant studies that also concluded that the older people, even the oldest-old who are 80+ years old, are generally thermally neutral at a 2°C higher temperature than the young people.9,13,22 As the thermal comfort zone as was recommended by the professional authorities, such as ASHRAE and CIBSE, are generally based on the PMV method, these standards should be updated to overcome the defect of the PMV method and provide appropriate comfort zones to meet older people’s need.
In terms of humidity comfort, the younger group’s humidity preference was significantly correlated with the measured humidity, while the older group’s humidity comfort in sensation, satisfaction and preference was not correlated with the measured humidity. This result suggests that, although the younger people’s humidity sensitivity is weak, they still seem more sensitive to the humidity change than older people. Therefore, the questionnaire survey is not a feasible way to investigate humidity comfort, especially for older people. Finally, this study proves a procedure that can measure the effect of the indoor environment on the occupants’ (especially the older occupants’) comfort and skin condition in a real living environment setting. The procedure is based on non-invasive dermatological measures and moderate environment controls and gives seldom disruptions to the participants’ daily routine, making the test friendly to and preferred by the participants, especially the older participants. Consequently, the potential psychological implications which may influence the participants’ subjective judgements could be minimised.
Skin condition
TEWL is the most frequently used variable in skin condition assessment in dermatology, but the mechanism of how it is affected by the environment is not entirely understood. In many pieces of literature, the skin exposed temperature and humidity are described as important factors that would affect TEWL,10,26 but whether the environmental variables increase or decrease the TEWL is uncertain. Such uncertainty can be easily seen when the results are compared with other relevant ones. In this study, the measured TEWL of both the younger and older groups show no significant changes with neither the room temperature nor humidity. However, an earlier study 22 on the oldest-old people in a care home shows a good correlation between the measured TEWL and room RH (r = 0.32, p < 0.01) and AH (r = 0.28, p < 0.01). In those studies carried out in climatic chambers, the TEWL on the back of the hand of the younger and older adults show no remarkable relations with the RH after 80 and 120 min of exposure in different RH settings.19,43 One possible explanation for such uncertainty is that the changes in the indoor temperature and humidity in the participants’ living environment were unlikely to cause impaired skin barrier function on the participants and, therefore, gave no significant changes in the TEWL which exactly indicates the barrier function of the skin. 26 Summarising the results above, the effect of the skin exposed temperature and humidity on TEWL is uncertain, making it infeasible to produce the minimum humidity level that can reduce the risk of suffering dry skin on younger and older adults in winter.
For the measured SCH, on the one hand, it was not significantly correlated with the measured room temperature neither in the younger nor the older group (p > 0.05). The result differs from a previous climatic chamber study which shows the SCH steadily increases when the skin is exposed to temperatures above 22°C at constant humidity. 38 On the other hand, the measured SCH was significantly correlated with the room AH in the younger group (r = 0.38, p < 0.001) in the temperature range of 22.8 ± 0.5°C and older group (r = 0.36, p = 0.011) in the temperature range of 22.9 ± 0.7°C. The weak but significant correlations are expected in a multifactorial system and are also reported in similar fieldwork on an oldest-old group, 22 demonstrating that the effect of room humidity on the skin condition is recognisable and can be measured in a multifactorial living environment. More importantly, it indicates that a minimum humidity level that can reduce the risk of suffering dry skin in winter can be produced by measuring the SCH. According to the regression equations between the SCH and AH, the minimum AH that can reduce the risk of suffering dry skin is 7.952 g/kg for the younger group and 8.622 g/kg for the older group, which correspond to 45.1% RH for the younger group and 48.9% RH for the older group at 23°C and 101.3 kPa. This minimum humidity level also suggests that older adults require a higher humidity level than younger adults to keep their skin hydrated and avoid dry skin.
Finally, this study proves a procedure that can measure the effect of the indoor environment on the occupants’ (especially the older occupants’) comfort and skin condition in a real living environment setting. The procedure is based on non-invasive dermatological measures and moderate environment controls and gives seldom disruptions to the participants’ daily routine, making the test friendly to and preferred by the participants, especially the older participants. Consequently, the potential psychological implications which may influence the participants’ subjective judgements could be minimised.
Research limitation and future work
Due to the arrangement from the care home side, the older group was studied half a month after the younger group, during which the outdoor average temperature was about 7.5°C higher. Although the average indoor temperature stably kept at about 23°C during the study on both groups, the difference in outdoor average temperature could potentially affect the participants’ thermal comfort. Moreover, the difference in seasons would affect the measurement of TEWL, as the season is also regarded as an environment-related factor that could affect the TEWL on the skin together with the skin exposed temperature and humidity. 26
Besides, the difference between the mean radiant temperature and the air temperature was ignored in the PMV calculation in this study that all measurement was recorded away from radiation from both solar and radiators and all rooms were well-insulated. Although this approximation fits well with the CIBSE’s suggestion and supported by a large number of field measure surveys, 44 there would be some degree difference between the two temperatures, especially in the younger participants’ living environment, which was relatively small space, and the occupants were close to the radiators (approximately 2 m). This could result in underestimation of PMV calculation compared with their actual sensation in the young group. Such a short distance could also increase skin evaporation and consequently skin dryness. This, together with the approximation could be further examined for better understanding.
Besides, the sample size of the study is too small to give general recommendations for general younger and older people. The results and research findings from the 11 younger and 11 older participants are not generally representative of the younger and older population. Therefore, this research is just in an early stage and should be continued to extend the sample size and, thus, build a better confidence in practice. The research findings can establish the comfort zones for older occupants in general practice, guiding the design and operation of their living environment.
Finally, dry skin is not the only health issue caused by the dry indoor air in winter. Other health issues, such as dry eyes, throat, nose and mucous membrane irritation, are caused by the dry indoor air as well and discomfort occupants in winter. As ASHRAE stated in the ASHRAE Standard 55-2020, 34 these health issues could be regarded as non-thermal factors to place limits on the acceptability of a very low humidity environment. These non-thermal factors should be considered and investigated to comprehensively understand the effect of dry indoor air occupants, especially the older occupants, in the future study.
Conclusion
Overall, the temperature in the measured rooms on the two research sites was stably kept in the thermal comfort range for the majority of the research period, but the average RH in the measured rooms was just above 30%, which failed to meet the acceptable RH level of 40% recommended by the design standard. Using humidifiers is an effective and economical way to ease the dry indoor air in winter, as the room humidity was improved by a simple domestic humidifier at a little cost.
For the subjective thermal and humidity comfort, both the younger and older participants did sense the temperature changes. On the one hand, the TSV method produced almost the same neutral temperature in the younger and older groups. This is because the older group had a higher clothing insulation level. If otherwise, their neutral temperature would be higher than that of the younger participants, suggesting that older people require a higher temperature than younger people to keep thermally neutral. Comparing the neutral temperature in the older group with that of the oldest-old people in another study, another suggestion is made that the increase in the neutral temperature occurred between the older and oldest-old people. On the other hand, the PMV method produced a thermal neutral temperature close to that produced by the TSV method in the younger group, showing the PMV method can accurately predict the thermal comfort of younger people. However, the PMV method produced a neutral temperature of approximately 2°C lower than that produced by the TSV method, which corresponds to about 0.6 units of PMV or about 12% of PPD. The result suggests that the PMV method predicts a neutral temperature that was low for older people and should be updated to fit older people’s need.
For the skin condition variables measured in the study, the TEWL in the younger and older groups showed no significant correlation with neither the room temperature nor humidity (RH and AH). One possible explanation for the result is that the changes in the indoor temperature and humidity in the participants’ living environment were unlikely to cause an impaired skin barrier function to the participants and, therefore, gave no significant changes in the TEWL. The result suggests that the TEWL is not feasible to predict the minimum humidity level that could reduce the risk of suffering dry skin in a real living environment setting. On the contrary, the SCH in both groups were significantly correlated with the room AH. According to their regression equations, the minimum AH that can reduce the risk of suffering dry skin is 7.952 g/kg for the younger group and 8.622 g/kg for the older group, which corresponds to 45.1% RH for the younger group and 48.9% RH for the older group at 23°C and 101.3 kPa. The result also suggests that older people need a higher humidity level than younger people to keep their skin hydrated.
Finally, the study proves a procedure that can measure the effect of the indoor environment on the occupants’ comfort and skin condition in a real living environment and in a pleasant way. The procedure was based on non-invasive dermatological measures and moderate environment interventions and caused seldom disruptions to the participants’ daily routine. By using the procedure, the difference between younger and older people in thermal and humidity comfort as well as their skin condition in a typical living environment in winter was compared. The study should be continued and repeated to gather more data and build better confidence so that an appropriate thermal and humidity comfort zone that can reduce the risk of suffering dry skin can be developed for older occupants in winter. By doing so, it can help update HVAC design standards to provide comfort zones for older people’s need and guide the service providers to offer better comfortable and healthy environment for older occupants.
Footnotes
Acknowledgements
The authors would like to thank the care home manager Mrs Catina Adams who offered the opportunity to carry out the study in the care home and Mr Chuojie Xian, who helped in the participant visits. Grateful acknowledgements to the research participants, especially the 11 elders, for their involvement, cooperation and patience in the study.
Authors’ contribution
YJ: conceptualization (supporting), data curation (lead), formal analysis (lead), investigation (lead), methodology (supporting), writing-original draft (lead), writing-review & editing (equal). FW: conceptualization (lead), data curation (supporting), formal analysis (supporting), funding acquisition (lead), investigation (supporting), methodology (lead), project administration (lead), resources (equal), supervision (lead), validation (lead), writing-original draft (supporting), writing-review & editing (equal). SRP: supervision (supporting), validation (supporting), writing-review & editing (supporting). RBW: conceptualization (supporting), methodology (supporting), validation (supporting).
Declaration of conflicting interests
The author(s) declared no potential conflicts of interest with respect to the research, authorship, and/or publication of this article.
Funding
The author(s) disclosed receipt of the following financial support for the research, authorship, and/or publication of this article: This work is part of a PhD project funded by Heriot-Watt University, UK.