
Abstract
This study aims to assess the physicochemical characteristics of the particulate matter ≤10 µm (PM10) at both congested and non-congested areas of Lahore, the second-largest city of Pakistan. PM10 samples from 10 urban sites in Lahore were analysed for source apportionment. The techniques of scanning electron microscopy/energy dispersive spectrometry (SEM/EDX) and inductively coupled plasma-optical emission spectroscopy (ICP-OES) were used to determine the morphology and the chemical composition of PM10. Thirteen elements including toxic metals were consequently detected and quantified: Ca (48.1%), Zn (17.0%), Fe (13.3%), Al (8.2%), Mg (6.6%), Pb (5.5%), Mn (0.4%), Cu (0.3%), Ba (0.17%), Cd (0.15%), Ni (0.04%), Cr (0.01%) and Co (0.008%). The results showed that the daily PM10 concentration was 6%–9% higher than the World Health Organization’s guideline values at all urban sites of Lahore. The congested sites showed higher contents than the non-congested areas for most of the elements, including Cd (41.8%), Cr (35.0%), Zn (19.7%), Cu (12.7%), Ni (6.2%), Ca (3.4%), Ba (1.2%), Mg (1.2%) and Al (0.07%). The non-congested areas showed higher contents only for Pb (0.07%) and Co (4.3%). The principal component analysis indicated that 72% of PM10 originates from road dust and vehicular sources, and 38% from industrial sources.
Keywords
Introduction
Urbanization and anthropogenic activities contribute to the air pollution in cities. Ambient air quality is deteriorating in Pakistan continuously due to anthropogenic emissions.1–8 In addition to anthropogenic sources, particulate matter (PM) is produced by natural sources. 9 Aerosol particles vary in their particle size, morphology, chemical composition and dispersion and pose a significant impact on climate and public health.10–12 Therefore, it is imperative that morphology and chemical composition of aerosol particles in the atmosphere be determined.
PM whose aerodynamic diameter is ≤10 μm (PM10) and ≤2.5 μm (PM2.5) have been widely studied.13–17 In cities similar to Lahore, in Pakistan, the growth in urbanization has significantly increased both the industrial sources and the number of vehicles that lead to an increase in the concentration of toxic metals in the environment.2,6,18–21 These anthropogenic emissions are usually linked with fast urbanization and industrialization of countries such as Pakistan and China, and could severely affect both environment and human health. 22 Consequently, increased health problems with high rates of mortality have been reported.23–29 Even though emissions from the industry and vehicles are two main sources of PM in urban environments, other sources such as road dust, solid waste treatment processes, power stations and trans-boundary pollution should also be taken into consideration.30–37
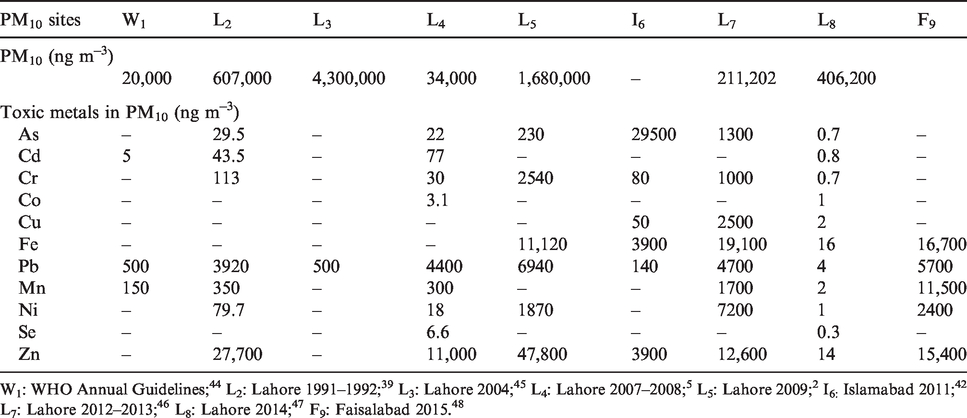
Reported concentrations of total suspended particles in the same region were 900 μg m–³, while 24-h maximum springtime PM10 concentration was higher than 460 μg m–³.34,38 In addition, Smith et al. 39 concluded that PM10 in Lahore has high concentrations of toxic and carcinogenic compounds, e.g. polyaromatic hydrocarbons (PAH), Pb. To date, there have been several studies on heavy metal concentrations and source apportionment, e.g. Khillare et al.; 33 Ghauri et al.; 34 Ali and Athar; 35 Hu et al. 40 ; Mansha et al.; 41 Nazir et al.; 42 Fang et al. 43 In Table 1, a summary of previous studies showing the chemical composition of PM10 in Lahore, from 1991 until 2014, can be found. PM10 concentrations in all studies range from 340 μg m–³ to 607 μg m–³ (Table 1). With respect to toxic metals, such as As, Cd, Cr, Co, Cu, Fe, Pb, Mn, Ni, Se, Zn, reported in these studies, there seems to be a decreasing trend in their concentrations from 1991 to 2014 (Table 1). Concentrations of Cd: 43.5 ng m–³, Pb: 3920 ng m–³ and Mn: 350 ng m–³, as stated by Smith et al. 39 , were considerably higher than the annual World Health Organization (WHO) 44 air quality guidelines for: Cd: 5 ng m–³, Pb: 500 ng m–³ and Mn: 150 ng m–³. 5 However, Alam et al. 45 reported the following concentrations: Cd: 0.8 ng m–³, Pb: 4 ng m–³ and Mn: 1 ng m–³ in Lahore and found that toxic metal concentrations were within the limits as provided by the annual WHO guideline values. 44 Based on these studies, the main source of these metals were from the soil, and from vehicular and industrial emissions.
Summary of past selected studies of PM10 and toxic metal concentrations within these for the chemical composition of PM10 collected.
This study assessed the variance of PM10 mass concentrations and their morphology at 10 different urban areas of Lahore, including five congested and five non-congested. Also, the collective source contribution of PM10 to the ambient air of Lahore was assessed using the principal component analysis (PCA) technique.
Methodology
Site description
Lahore (31.320°N; 74.220°E) is the second most-populated city of Pakistan; its population is approximately 9.44 million. In the city, there are also about 3.9 million motor vehicles and 2150 registered industries. 49 The city is situated along the Ravi River, close to the Indian border. The climate is hot and semi-arid, with wet hot summers and dry cold winters. 47
PM10 samples were collected between February 2014 and March 2014 (Figure 1) from 10 different urban sites representing both congested and non-congested areas of the city. Congested areas have a population density higher than 10,000 people per km2, while non-congested areas have a population density lower than 10,000 people per km2. 50
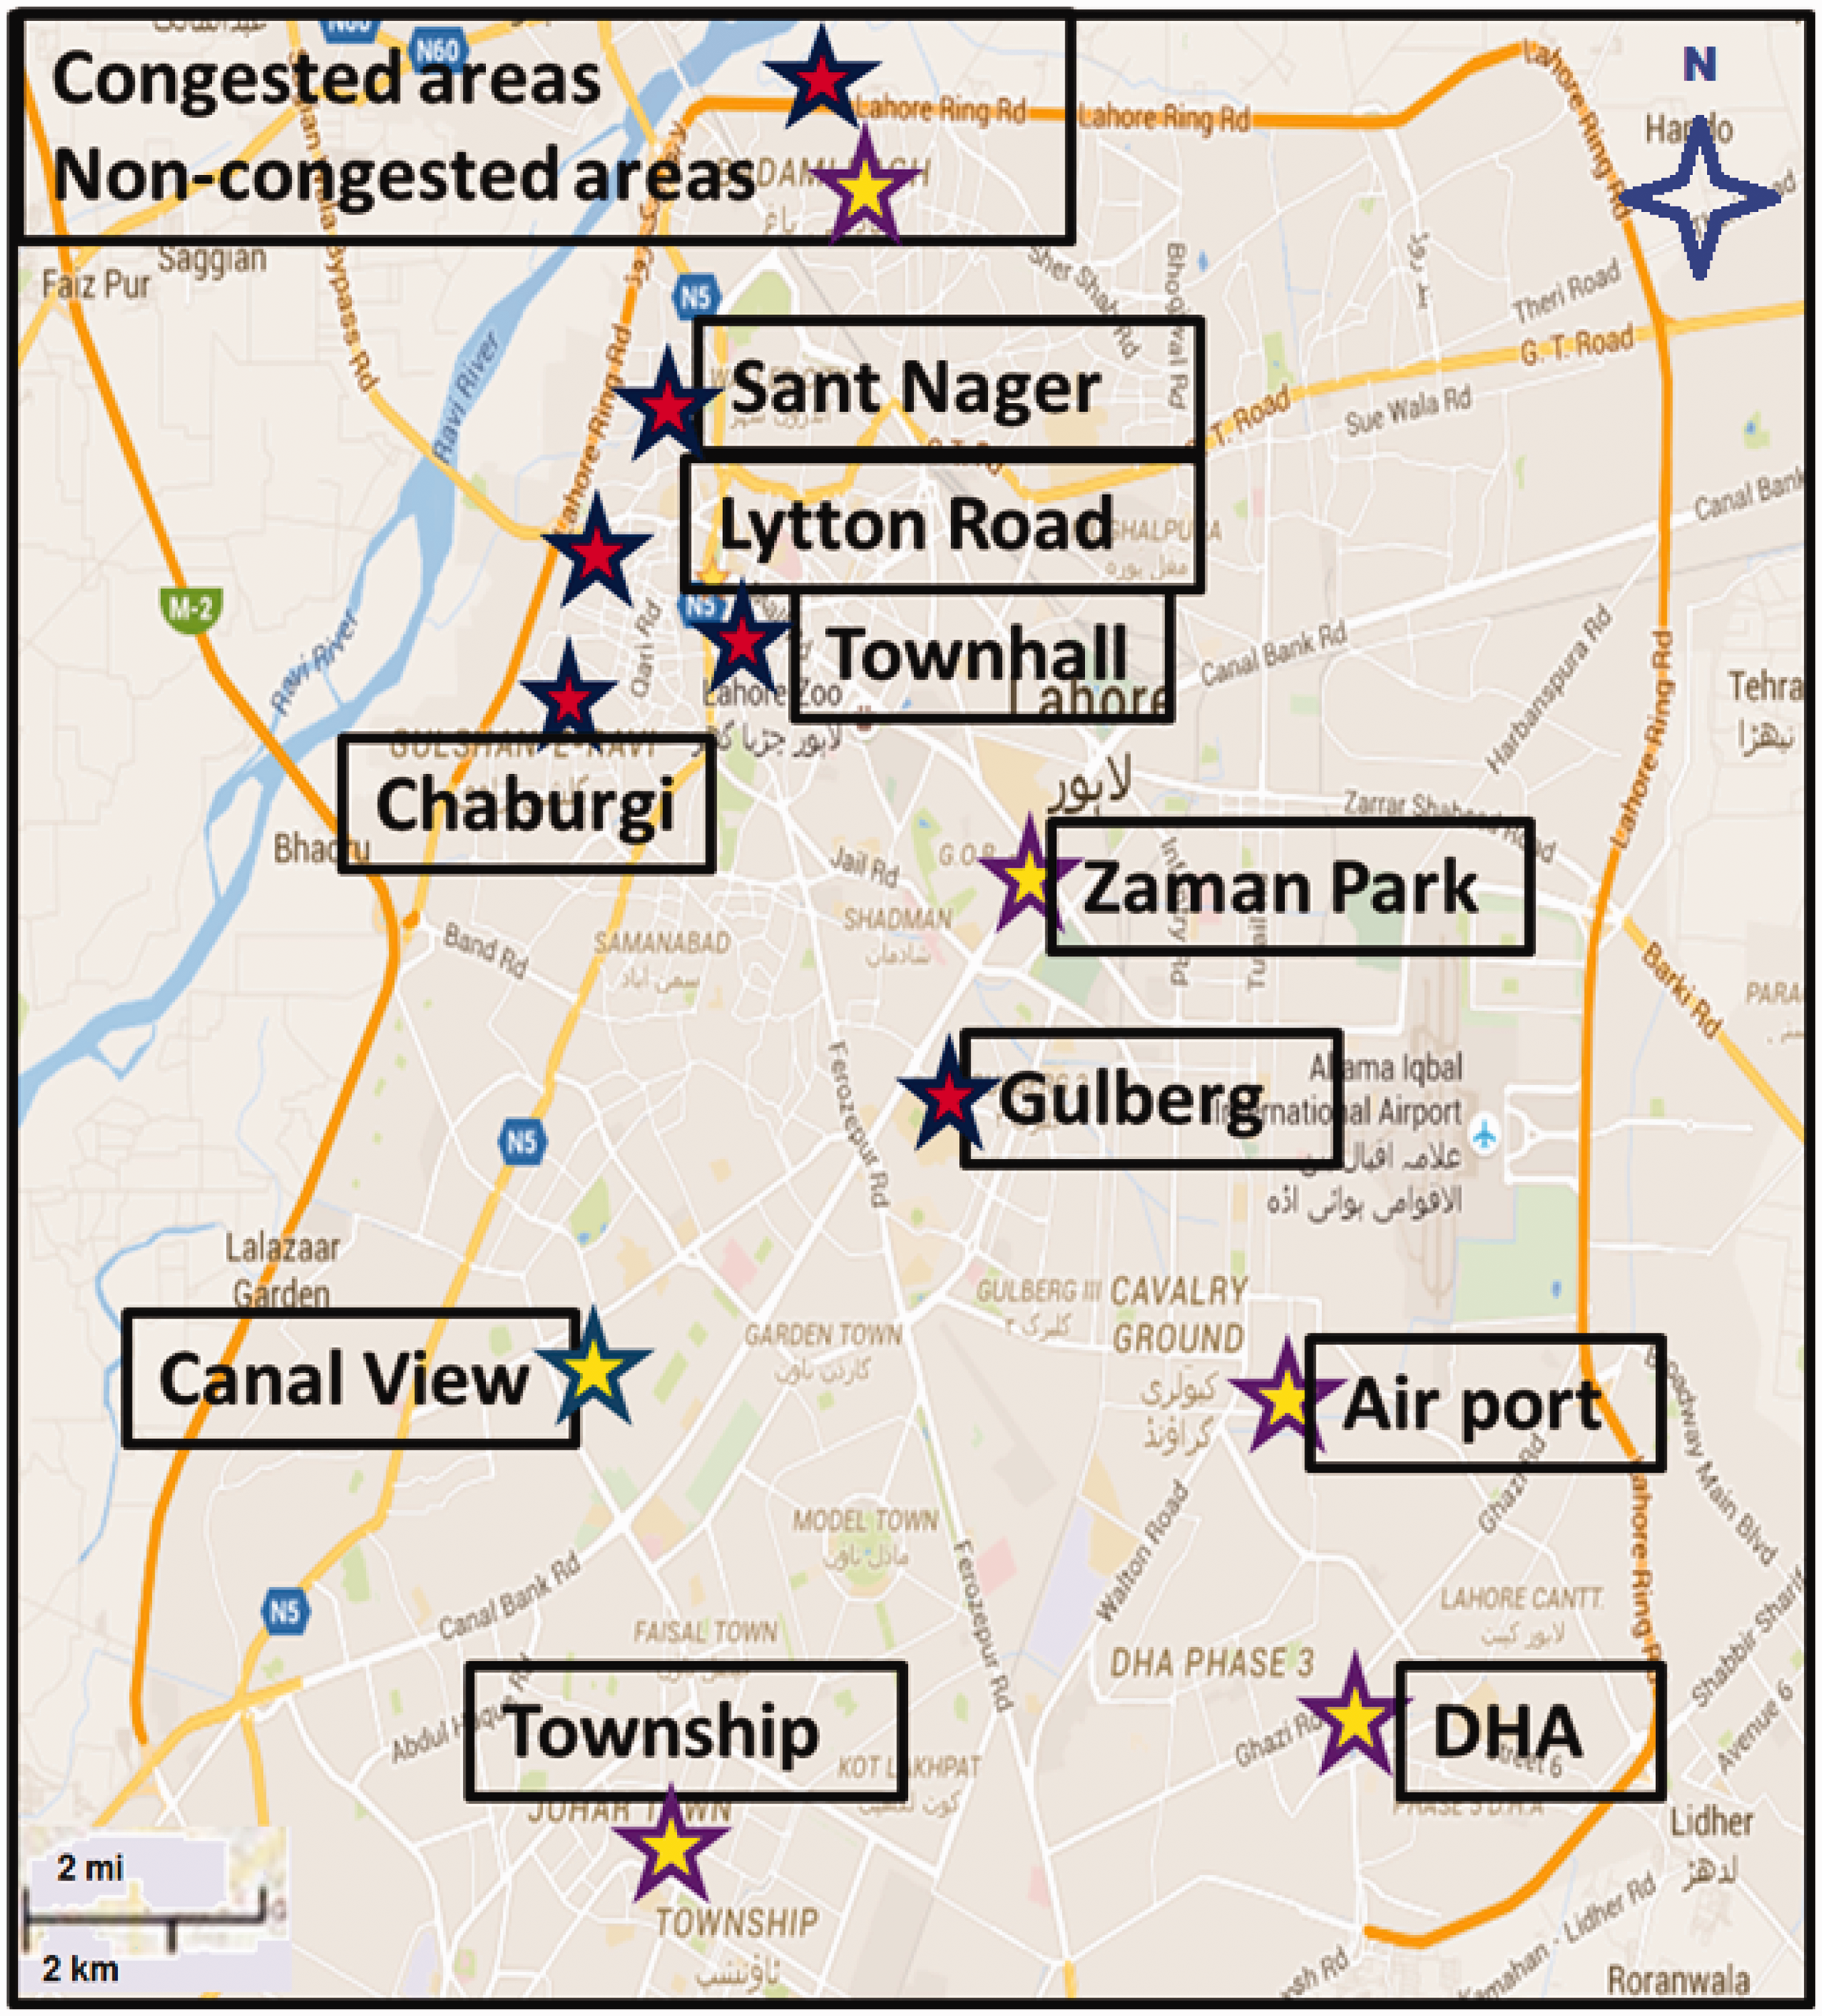
Locations of congested and non-congested areas of Lahore. Red and yellow stars represent congested and non-congested areas, respectively. Source: Google Map.Note: Please refer to the online version of the article to view the figures in colour.
Ambient sampling
A high-volume air sampler (Thermo Scientific Model: MFC-TSP) operating at a flow rate of 1.13 m3 min−1 for 24 h was used during the sampling procedure. The aerosol samples were collected on Quartz fibre filter paper with a set of three samples being collected from each site. PM10 inlets with mass flow control (MFC) system were employed for PM10 sampling. The quartz fibre filters were pre-heated in a muffle furnace at 800°C for 3 h to remove organic impurities. Before and after sampling, the filters were equilibrated in the desiccator for 24 h and then weighed on an electronic microbalance to determine the particulate matter mass. Each filter was weighed at least three times before and after sampling, and the net mass was obtained by subtracting the pre-sampling weights from the post-sampling ones. After weighing, the samples were sealed in polyethylene zip-lock bags and stored in a deep freezer at 4°C until their analysis to prevent evaporation of volatile components.
SEM/EDX analysis
The SEM/EDX analysis was performed at the Electron Microscopy Facility of the Microstructural Studies Unit of the University of Surrey, UK. The analysis was carried out using a computer-controlled field emission scanning electron microscope (SEM) (model: JEOL JSM-7100F), which was also equipped with an energy-dispersive X-ray (EDX) system. The blank and loaded quartz fibre filter papers were punched in 1 mm2 from the centre of each sample. Two sets of samples were prepared using either gold or carbon coating. A very thin film of gold or carbon was deposited on the surface of each sample, and six samples were prepared at a time. EDX magnification ×750 was used for carbon-coated samples and ×450 was used for the gold-coated ones. The fine coating of gold makes the samples electrically conductive. The SEM/EDX analysis was carried out to perceive the morphology and composition of elements.
ICP-OES analysis
Quartz fibre filter paper of 412.90 cm2 was used for hot acidic digestion. The filter paper was put in a conical flask and 30 ml of 10% nitric acid was poured on it. The conical capped flask reflux was done gently for 30 min at 95°C. After refluxing, 10 ml of deionized water was added, and the extract was allowed to cool for 30 min. Each extract was filtered by using syringe filters and was further diluted with 20 ml of deionized water. The extracts were placed in polypropylene bottles and analysed by Perkin Elmer Optima 5300 DV ICP-OES. Solutions of known concentration of metals had been prepared from NIST traceable multi-element solution, so that ICP-OES was calibrated prior to analysis. ICP-OES was used to determine concentrations of 14 metal elements, that is: Al, Ca, Mg, Fe, Pb, Cd, Co, Cu, Cr, Mn, Ni, Ba, Mo and Zn. After that, multivariate statistical methods were applied to find the correlation between these metals and their sources.
Data analysis
Data obtained from the ICP-OES was analysed by applying various statistical techniques, like: cluster analysis, correlation coefficient and PCA. PCA was used to identify a smaller number of uncorrelated variables, called ‘principal components’ from a larger dataset. Its goal is to provide maximum variance with the fewest possible numbers of principal components. As a technique, PCA is commonly used in social and physical sciences that require large datasets making data easy to explore and visualize.51,52 The abovementioned multivariate statistical techniques can help to assess the similarity between different elements, strength of association among variables, so sources on the basis of similarity taken from different receptor sites can be identified.46,53–56
Results and discussion
PM10 concentrations in Lahore
A high-volume air sampler was used to collect the PM10 samples at 10 different sites of Lahore, five congested (Townhall, Chaburgi, Lytton Road, Sant Nagar and Gulberg) and five non-congested (Township, Zaman Park, Canal View, DHA, and Airport) (Figure 2). The maximum 24-h PM10 concentration was 581.4 µg m−3 and was observed at the congested part of the city, whereas the minimum 24-h PM10 concentration was 229.2 µg m−3 and was observed at the non-congested part. The daily average PM10 concentrations at congested and non-congested sites were 444.7 µg m−3 and 303.4 µg m−3, respectively. The daily PM10 concentration was six times to nine times higher than the daily permissible limit as per the WHO guidelines 44 (the red dashed line in Figure 2) at the non-congested and the congested sites under study (Figure 2). The average annual PM10 concentration reported by Stone et al. 6 was equal to 340 µg m−3 (maximum reported PM10 concentration of 650 µg m−3) was close to the average daily PM10 concentration of 374 µg m−3 of all sites of Lahore. Similar PM10 concentrations were previously found in studies carried out either in Lahore or in other urban areas of Pakistan.1,2,34,35,38,45 PM10 concentrations in these studies ranged from 250 µg m−3 to 650 µg m−3, which were close to the daily minimum PM10 concentration of 229 µg m−3 at Township and the daily maximum PM10 concentration of 581 µg m−3 at Lytton Road. PM10 concentrations across Pakistan particularly in megacities like Lahore were significantly higher than those across the developed countries, where values are usually about 50 µg m−3. 57
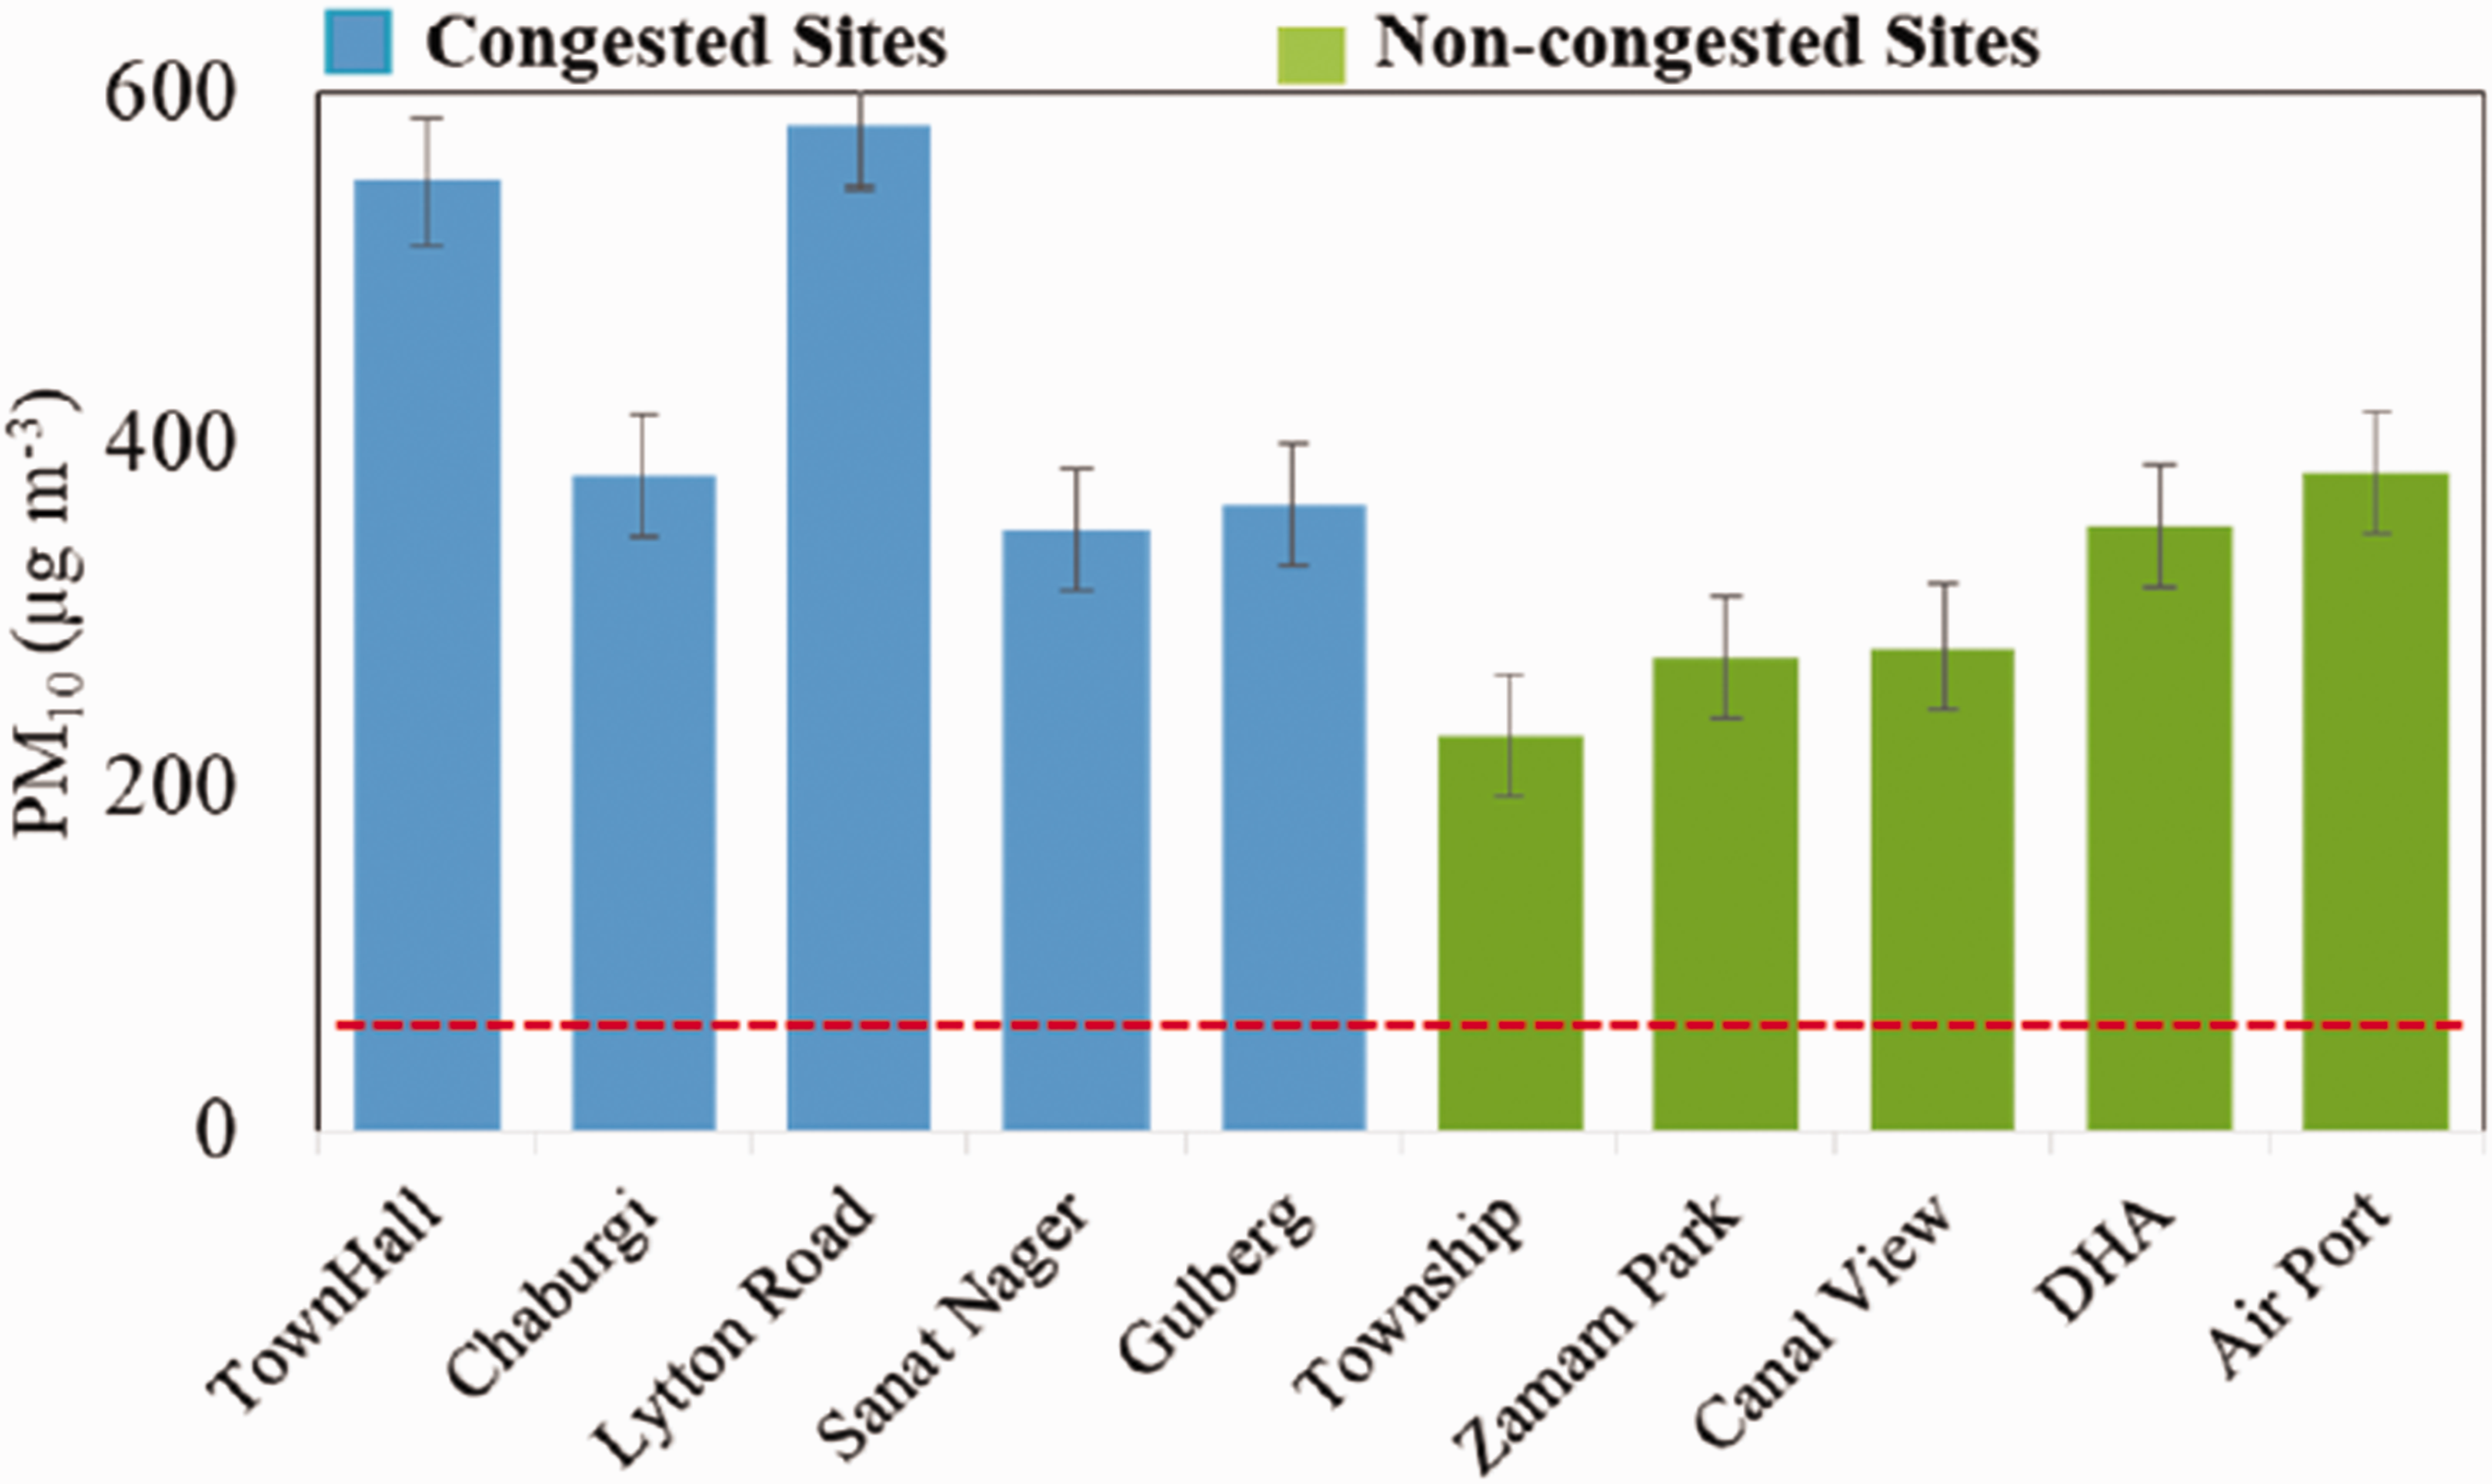
PM10 at congested and non-congested sites of Lahore.Note: Please refer to the online version of the article to view the figures in colour.
Morphological and elemental composition of PM10
The SEM/ΕDX analysis provides information about the morphology and chemical composition of particles. This information is helpful to understand the origin of particles.58–63 The majority of particles found on filter papers were smaller than 10 µm (Figure 3). These particles were of different shapes and dimensions, like tubular, spherical, platy, porous and irregular shapes. Tubular shape represents pure silica particles, club shape represents biological matter, irregular shape relates with trace minerals and platy shape indicates Ca silicate. 64 Tubular, club and irregular shapes (Figure 3) justify the high amount of silicates and the trace metals embodying organic components found in club and irregular shapes.
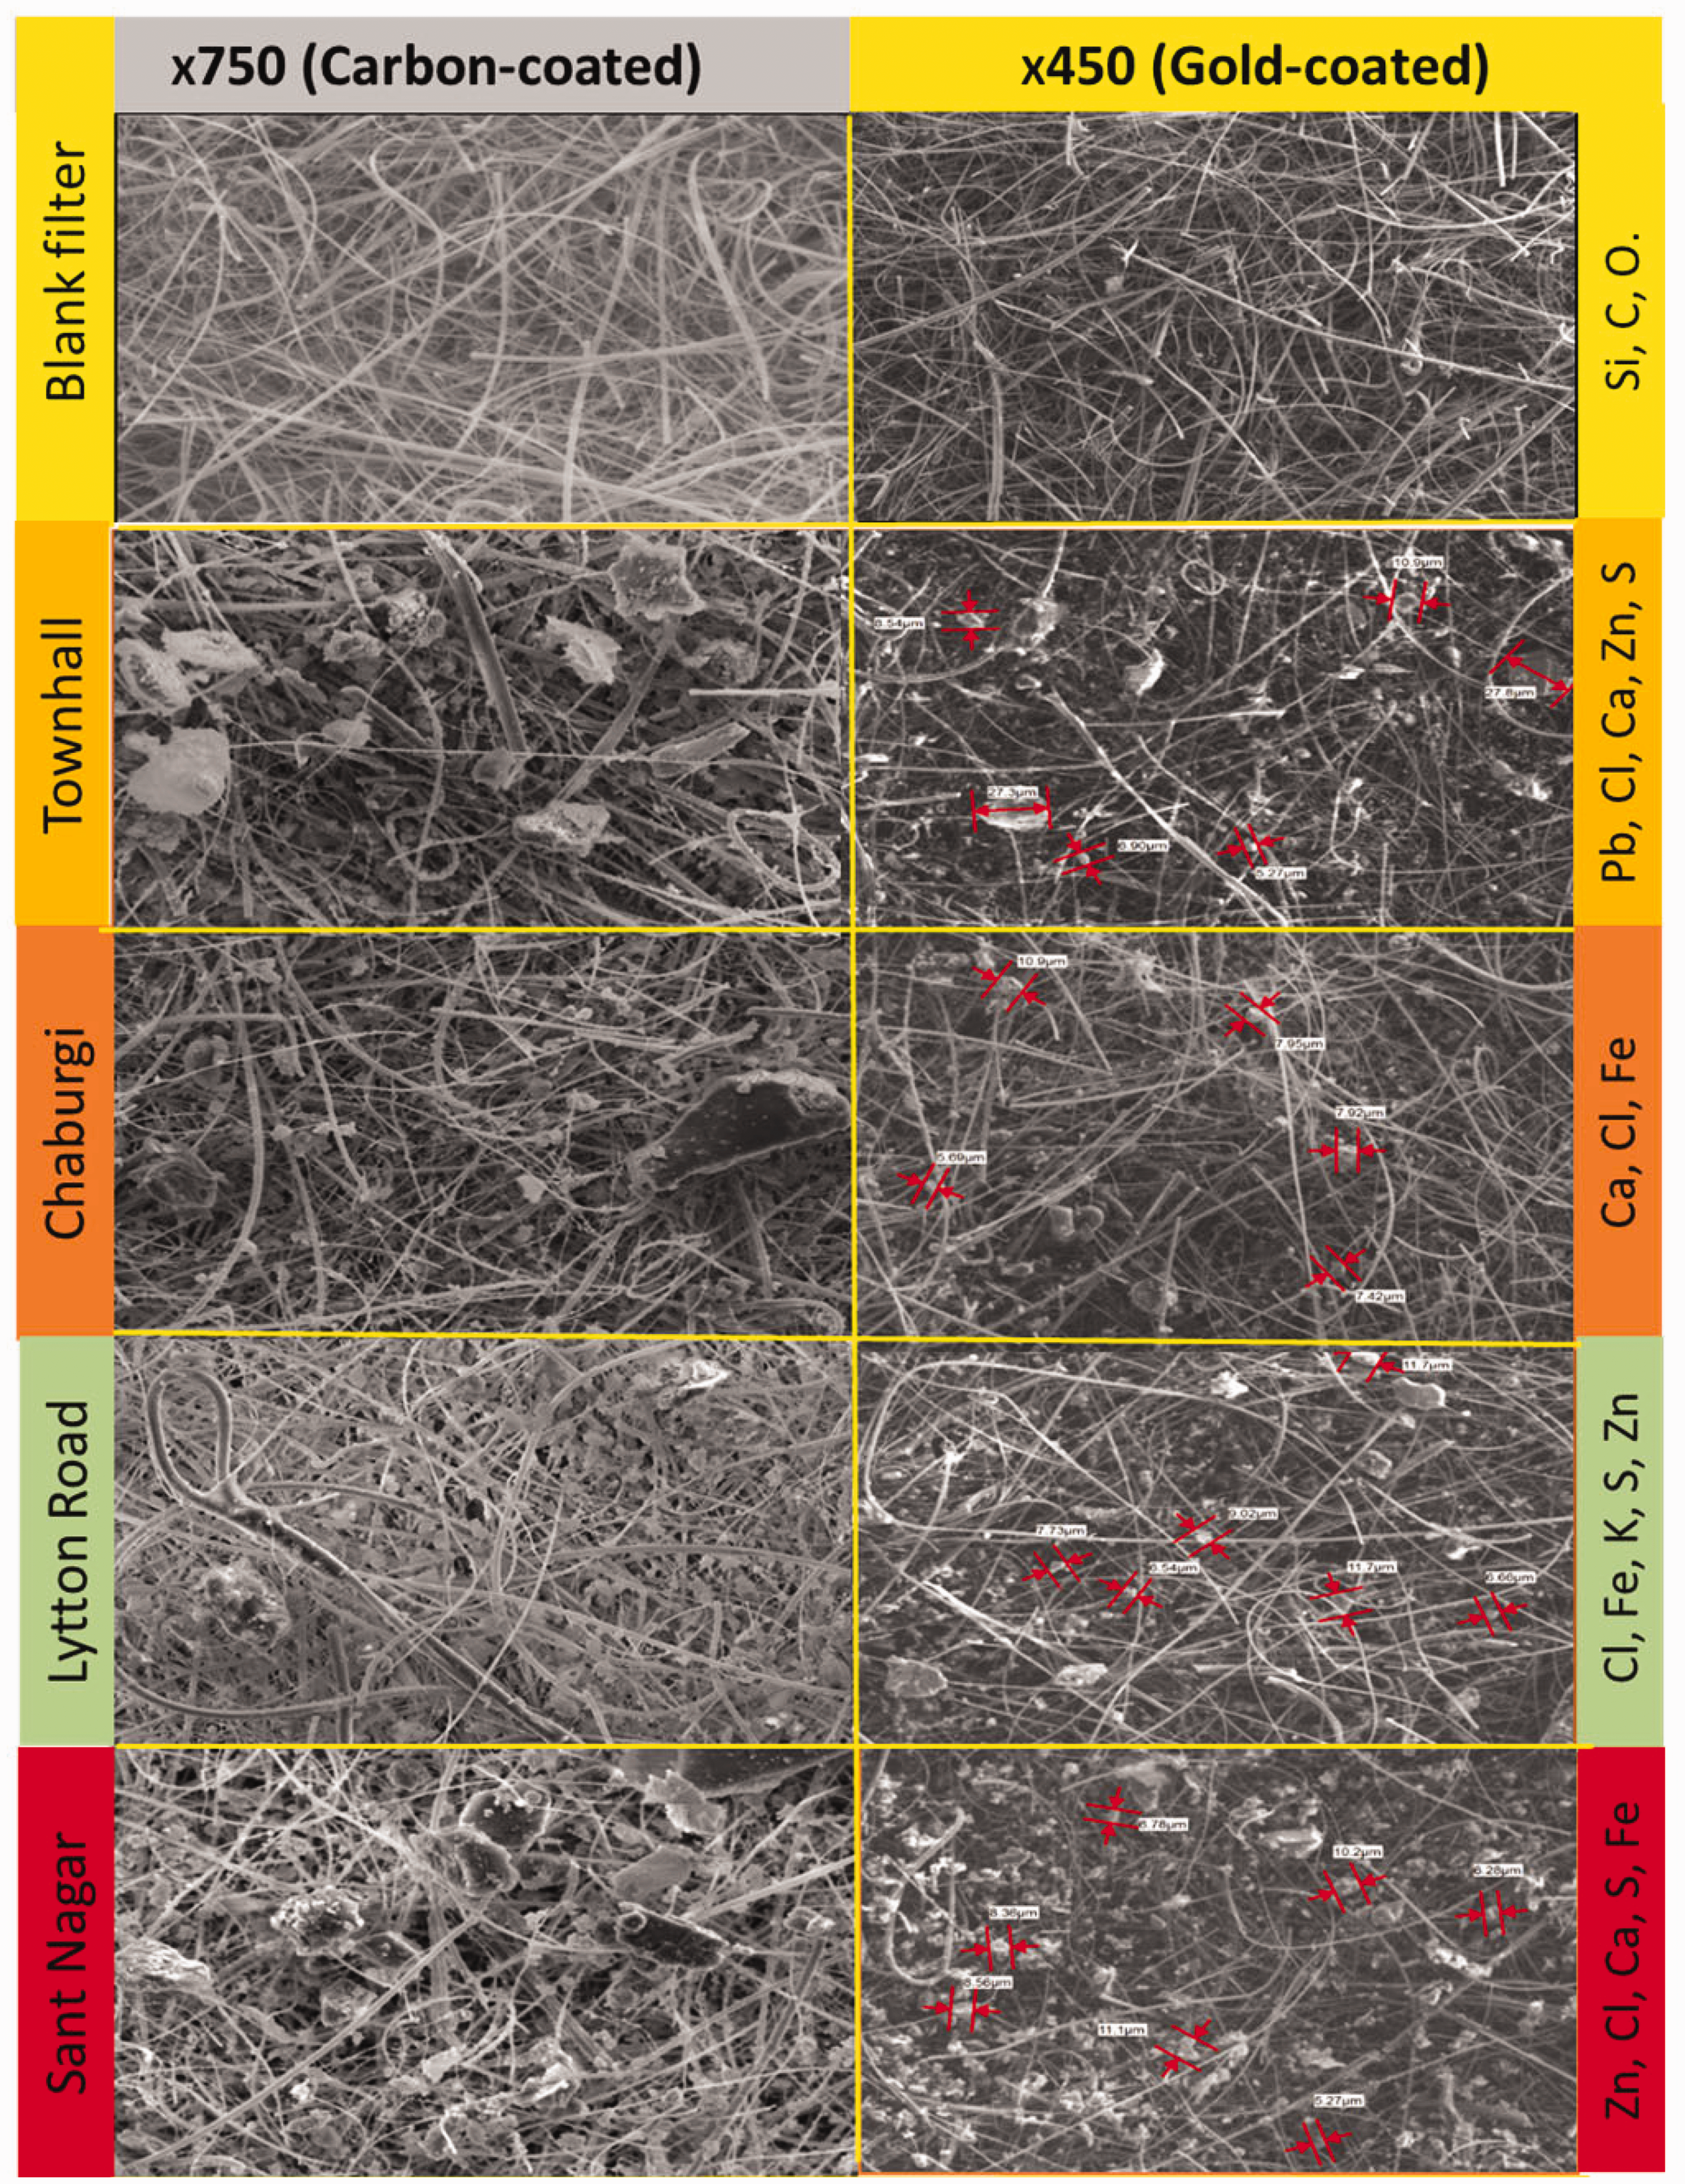
SEM images of blank filter paper and PM10 loaded filters with the main elemental contribution.Note: Please refer to the online version of the article to view the figures in colour.
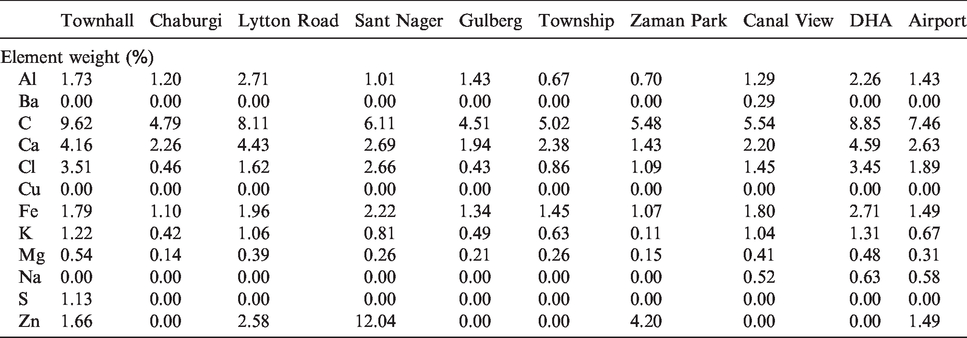
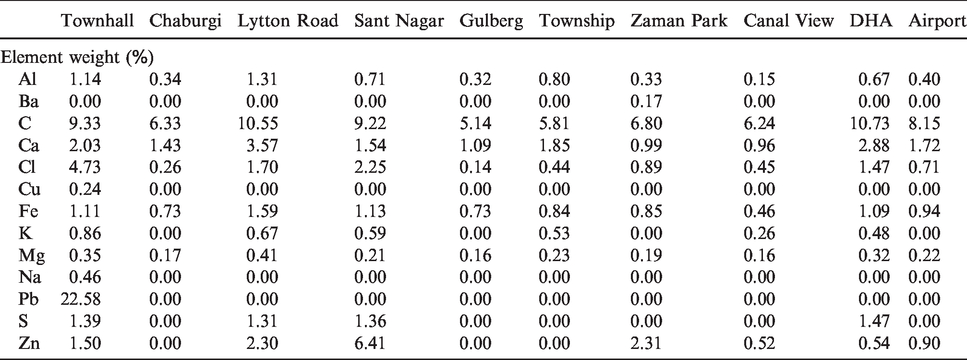
SEM/EDX analysis also provides an insight of the chemical composition of PM10 collected. First, the blank filter was analysed and the main elements that were found were: C, O and Si. These are considered as the background elements. As shown in Tables 1 and 2, 12 elements were found in gold-coated samples, whereas 10 elements in carbon-coated samples excluding the background elements mentioned above. The gold-coated samples were more conductive than carbon-coated samples, so they give better results. Al, Ca, Fe, Si, Mg and K indicate both geological sources and road dust contribution.65,66 On the other hand, Pb, Zn, Ba, S, Na and Cl represent the anthropogenic sources, that is: emissions from industries, and emissions from vehicles and fugitive emissions. 55 Small amounts of Na, Mg, K, P, Si, Fe, Cl, Al and Ca are also present in biological, either dead or alive, matter. 67 Road dust, together with soil, have also been found to be significant contributors to Asian aerosols.68,69 According to the stacked column chart, dust and other geological sources contribute to about 90% (Tables 2 and 3) of PM10 composition in Lahore, whereas vehicular and industrial emissions contribute to only about 10% (Tables 2 and 3). As shown in Figure 4, vehicular and industrial emissions appear to be rather higher in congested areas of the city.
Percentage contribution of PM10 elements at different sites of Lahore obtained by using SEM (carbon-coated samples).
Percentage contribution of PM10 elements at different sites of Lahore obtained by using SEM (gold-coated samples).
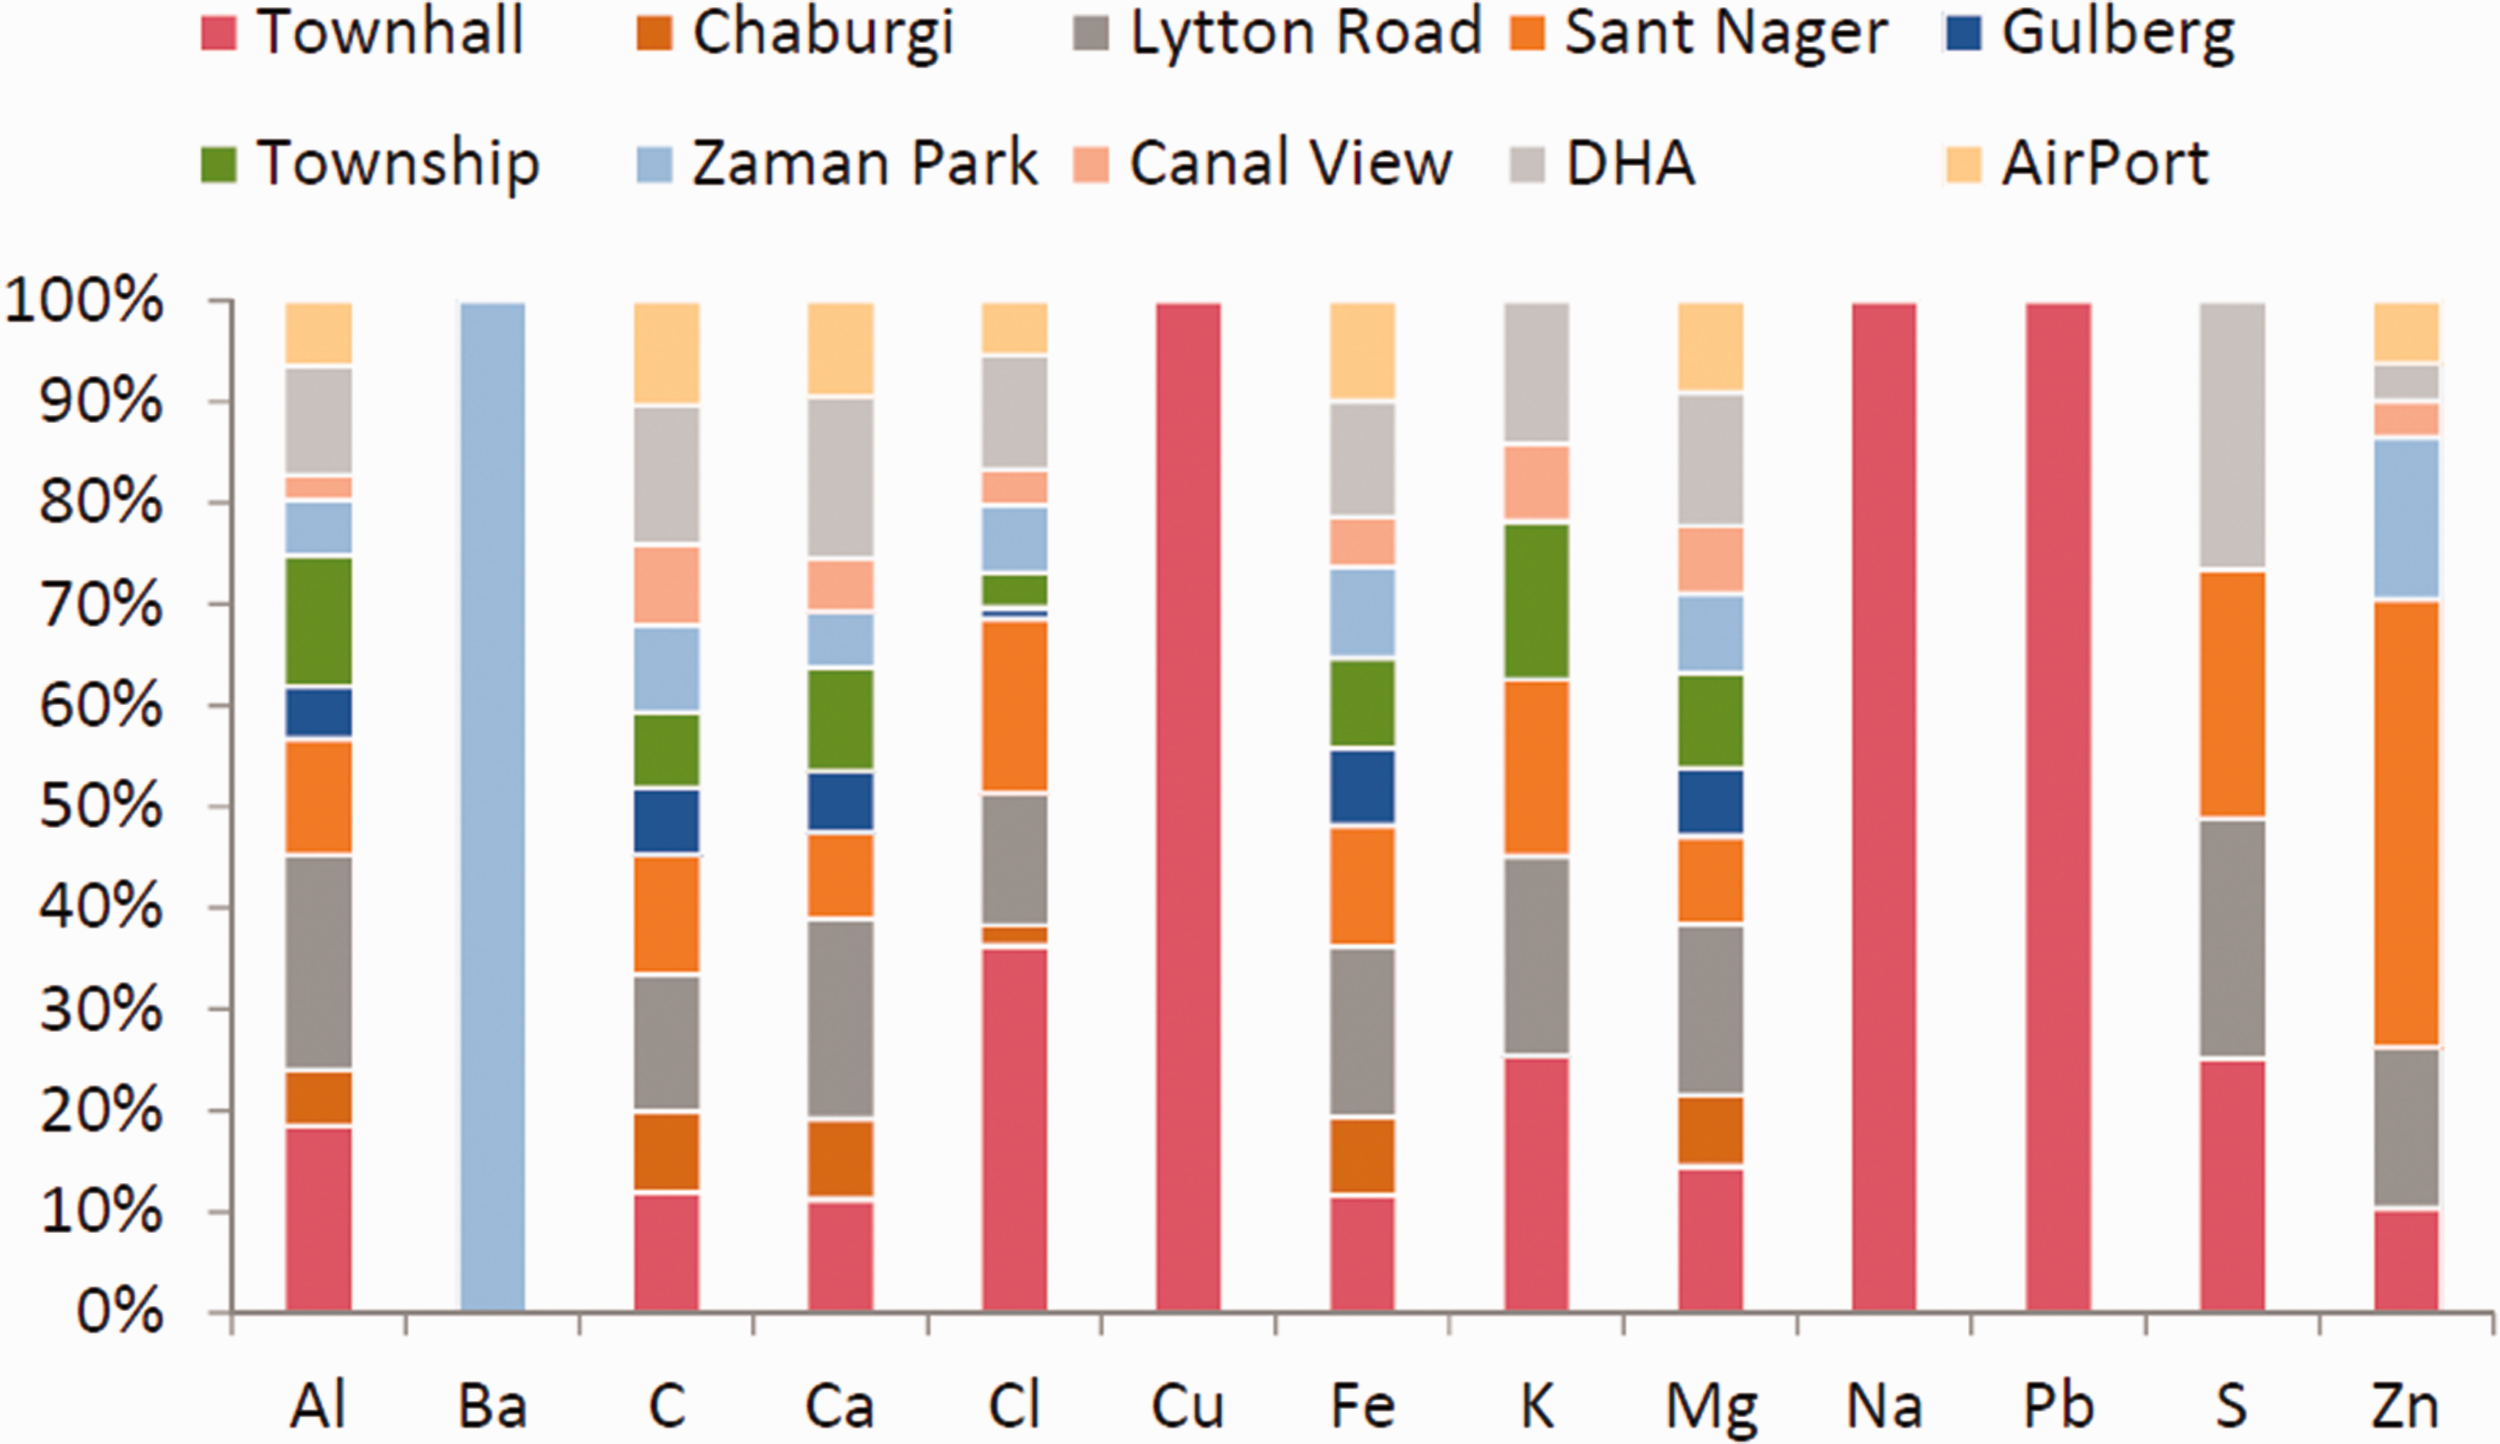
The relative percentage abundance of elements at different sampling sites of Lahore by using gold-coated SEM/EDX technique. Ba, Na and Pb show the dominance of these elements at some sites (Table 3) and hence the colour of these bars are the same.Note: Please refer to the online version of the article to view the figures in colour.
Concentration of elements
ICP-OES analysis was used to determine the concentrations of elements that were present in the PM10 samples. The concentration of crustal elements, that is: Al, Ca, Mg and Fe and trace elements, that is: Cd, Cr, Cu, Co, Mn, Ni, Pb and Zn at the congested sites of Townhall, Chaburgi, Lytton road, Sant Nagar and Gulberg and at the non-congested sites of Township, Zaman Park, Canal View, DHA and Airport are shown in Table 4 and Figure 5. The average concentration of Mg across all sites of Lahore was equal to 178.7 ng m−3 with an average minimum concentration and an average maximum concentration of 84.3 ng m−3 and 252.7 ng m−3 at the non-congested site of Zaman Park and at the congested site of Sant Nagar, respectively. Ca concentration was observed to be the highest among crustal elements with an average concentration across all sites being equal to 1294.1 ng m−3, and with an average minimum concentration and an average maximum concentration of 704.9 ng m−3 and 1974 ng m−3 at the non-congested site of Canal View and the congested site of Sant Nager, respectively. Of trace elements, the minimum concentration was shown with Co in general. The average Co concentration across all sites was equal to 0.236 ng m−3 with an average minimum concentration and an average maximum concentration of 0.043 ng m−3 and 0.554 ng m−3 at non-congested sites of Canal View and Airport, respectively. The maximum concentration was found for Zn compared with all the rest of trace elements. The average concentration of all sites was equal to 444.5 ng m−3. The average minimum concentration and the average maximum concentration of 81.7 ng m3 and 2039.7 ng m3 were found at the non-congested site of Township and the congested site of Sant Nagar, respectively.
PM10 elemental concentrations at congested and non-congested sites of Lahore.
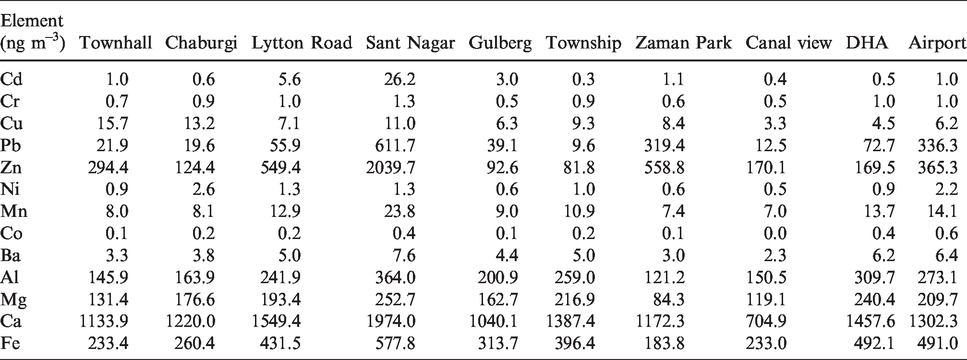
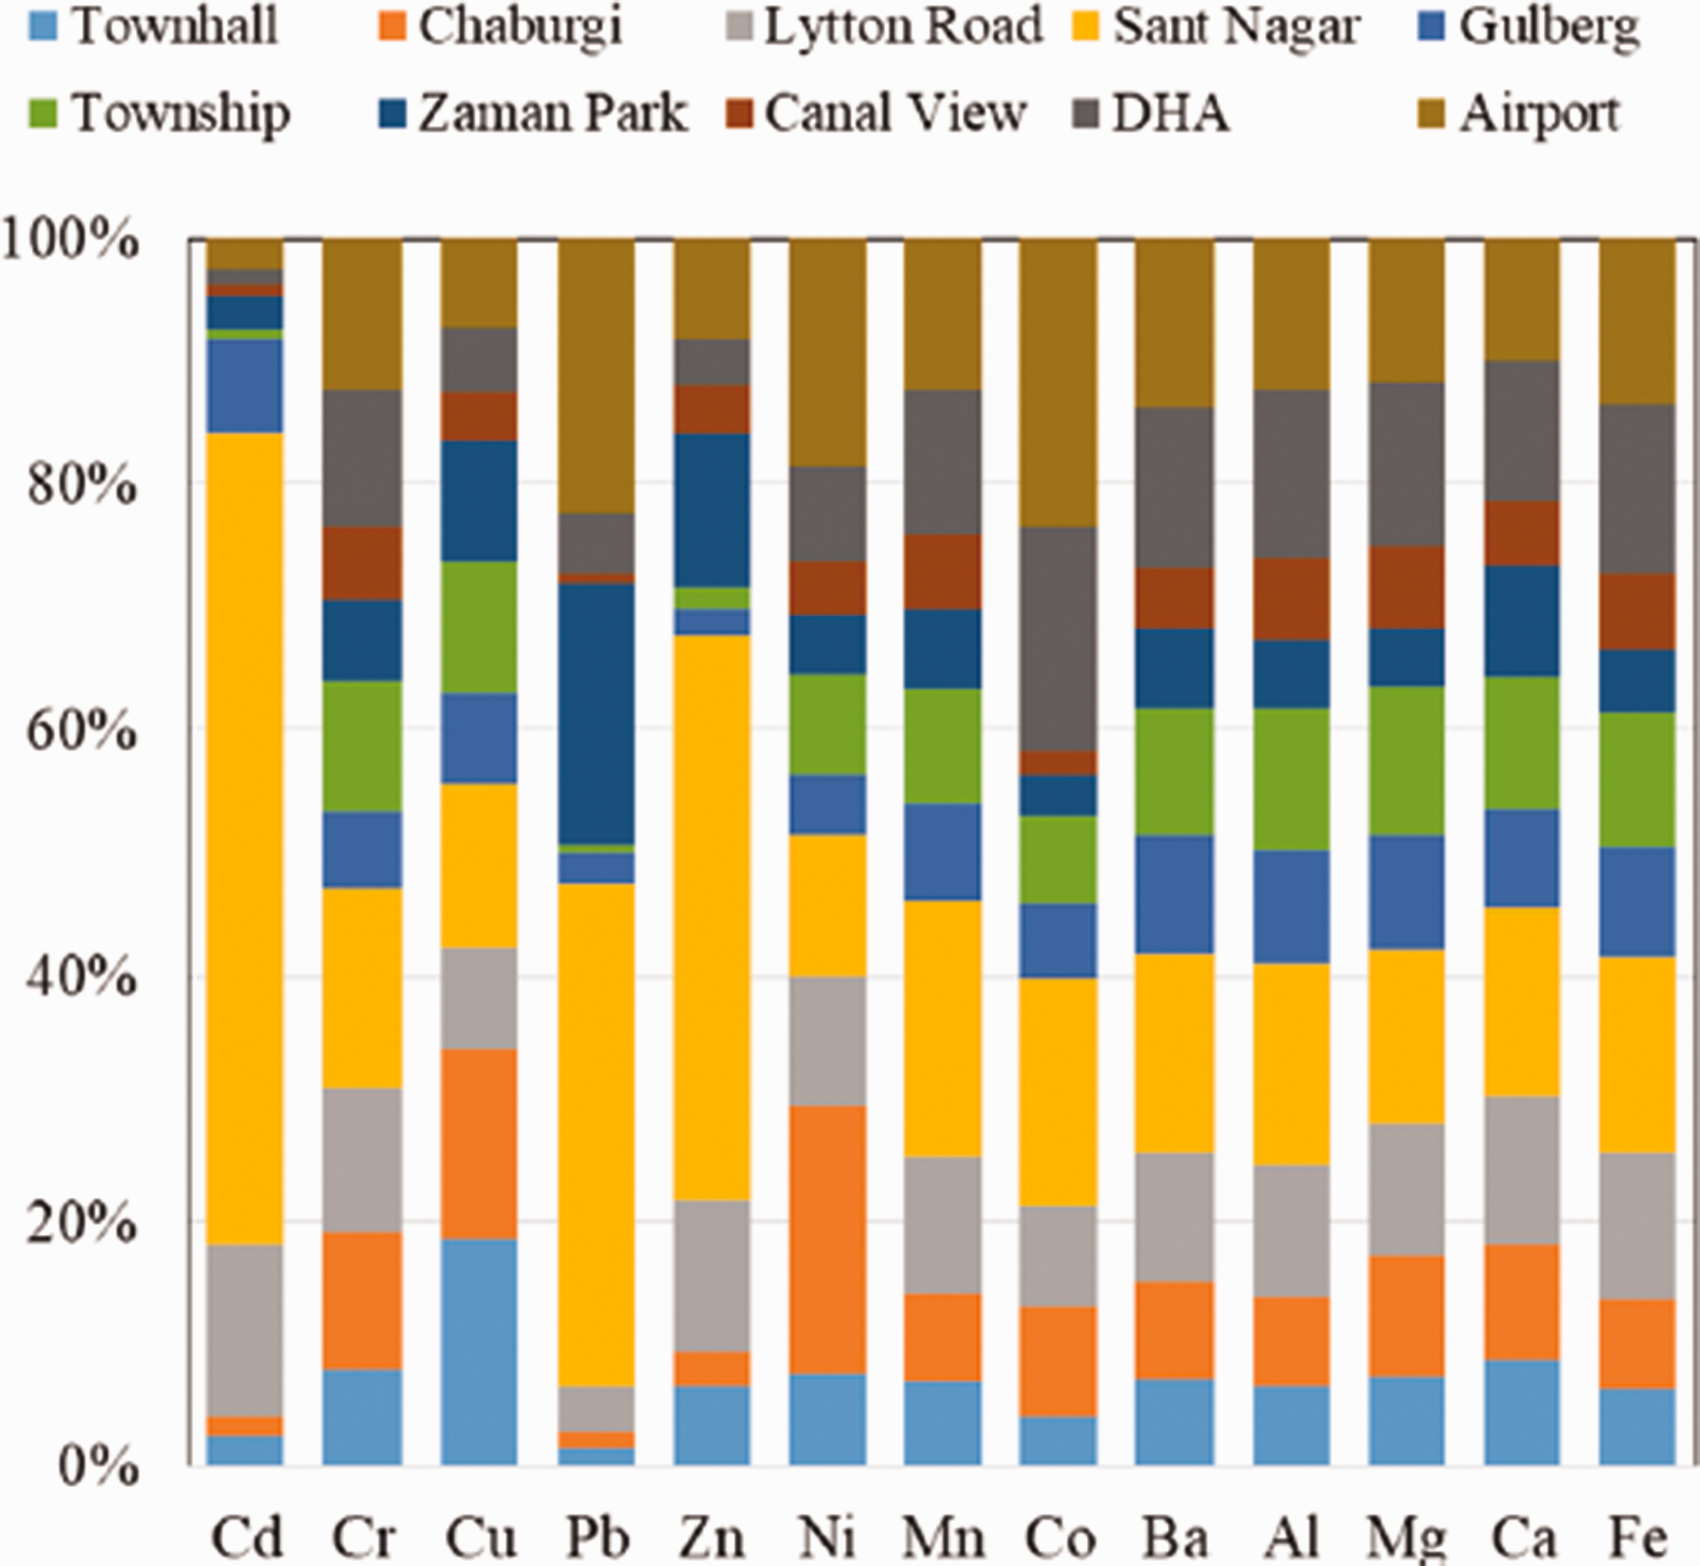
The relative percentage abundance of elements at different sampling sites of Lahore by using ICP-OES technique.Note: Please refer to the online version of the article to view the figures in colour.
The results of this study are comparable to those reported by previous studies.5,47 Schneidemesser et al. 5 and Alam et al. 47 also measured PM10 concentrations in the urban sites of Lahore and they found the maximum annual mean concentration for Ca among the crustal elements, that is: 9100 ± 2500 ng m−3 and 18,500 ± 5800 ng m−3. Of the trace elements, they reported minimum annual mean concentration for Co with annual mean concentrations of 3 ± 1 ng m−3 and 5.0 ± 3.0 ng m−3. Annual mean concentration of Zn was also reported as maximum among the trace elements with an annual mean value of 3000 ±1900 ng m−3. The percentage difference between concentrations at congested and non-congested sites was 41.8% (Cd), 35.0% (Cr), 19.7% (Zn), 12.7% (Cu), 6.2% (Ni), 3.4% (Ca), 1.2% (Ba), 1.2% (Mg), 0.07% (Al) higher at congested areas than at non-congested areas, whereas for Pb and Co, the concentration was 0.07% and 4.3% higher at non-congested areas compared to congested areas, respectively. The overall percentage difference of elements was 9.3% higher at congested areas than non-congested ones.
Similarity among elements
Cluster analysis was used to group elements found at 10 different sites in Lahore on the basis of similarity (Figure 6). The strength of cluster is indicated by the length of horizontal line and how close to the x-axis the element is. 46 Javed et al. 48 reported that the short distance among the horizontal lines indicates that there is a correlation among these elements and the source they are generated from. The extent of similarity among the crustal and trace elements was Cd > Cr > Co > Ni > Ba > Cu > Mn > Pb > Al > Mg > Fe > Zn. Based on the dendrogram cluster analysis, the elements were divided into two groups. The elements in the first group were: Cd > Cr > Co > Ni > Ba > Cu > Mn and were generated from vehicular cum industrial sources.41,43,70 The elements in the second group were: Pb > Al > Mg > Fe > Zn and were generated from geological cum road dust sources.71,72
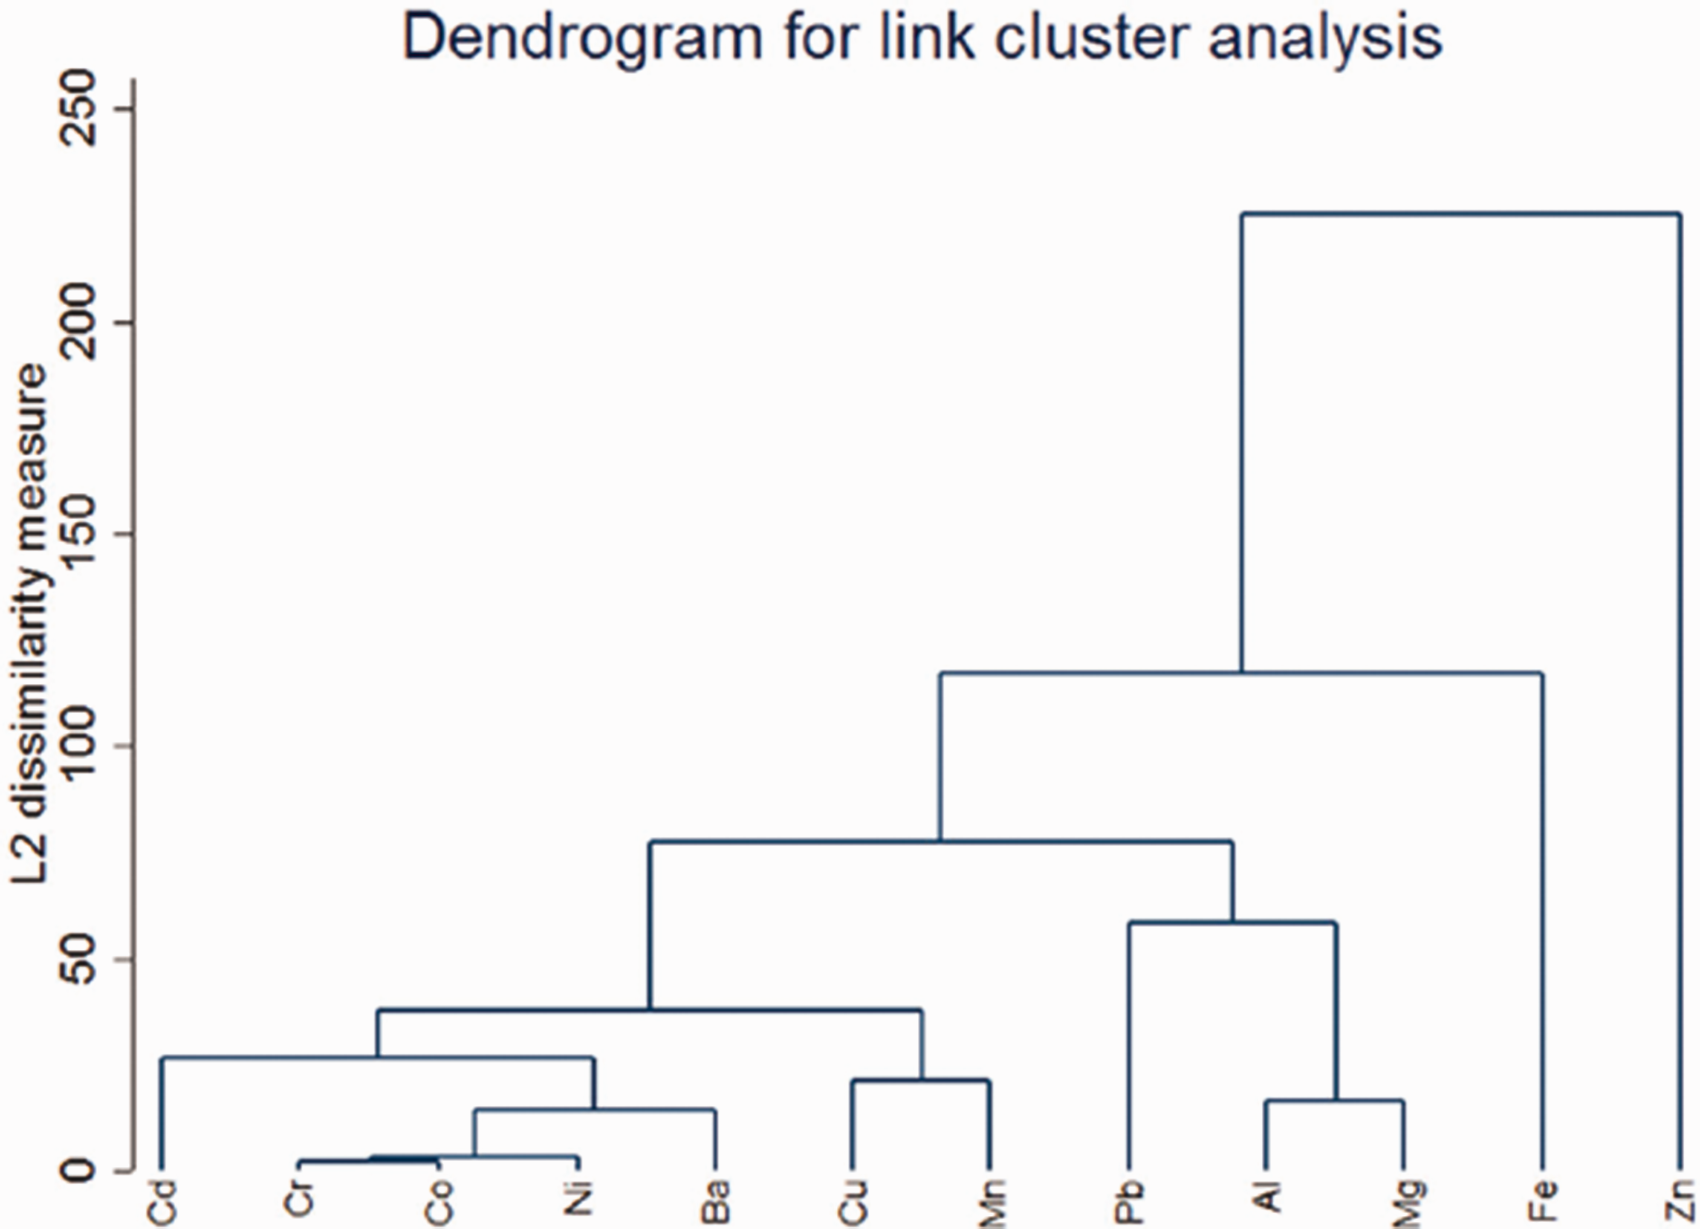
Cluster analysis of elements.
Correlation among elements
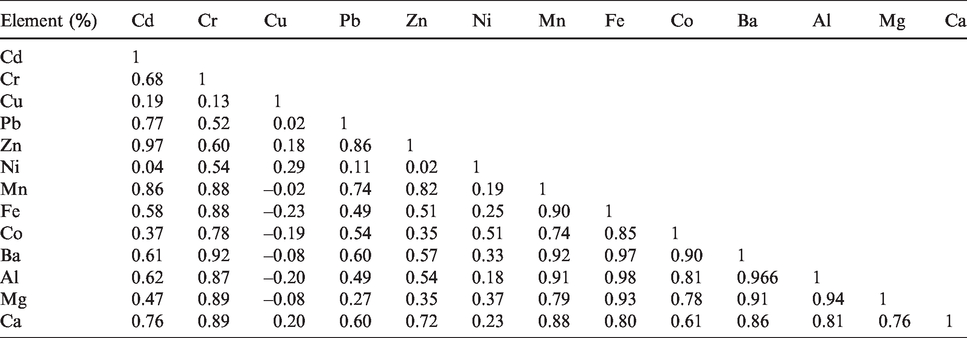
Correlation coefficient statistical technique was applied further to group elements found at urban sites of Lahore as shown in Table 5 and Figure 7. A significant correlation coefficient among elements was observed to be between 0.9 and 0.8. Also, a strong correlation was observed at 0.7 and a moderate one was observed at 0.6. A significant correlation was found among Al, Fe, Mg, Zn, Cd, Pb, Mn, Cr, Ba and among Fe, Mn, Pb, Cd, Zn, Cu, Cr mostly emitted from industrial and road dust-related sources. 48 Strong correlation was also found among Cr, Cd, Pb, Co, Mn, Zn, Mg, Ca mostly emitted from vehicles and geological sources.48,73 Finally, a moderate correlation was found among Pb, Ba, Cd, Al, Ca emitted from industrial and geological sources.47,74
Elemental correlation coefficient matrix of Lahore.
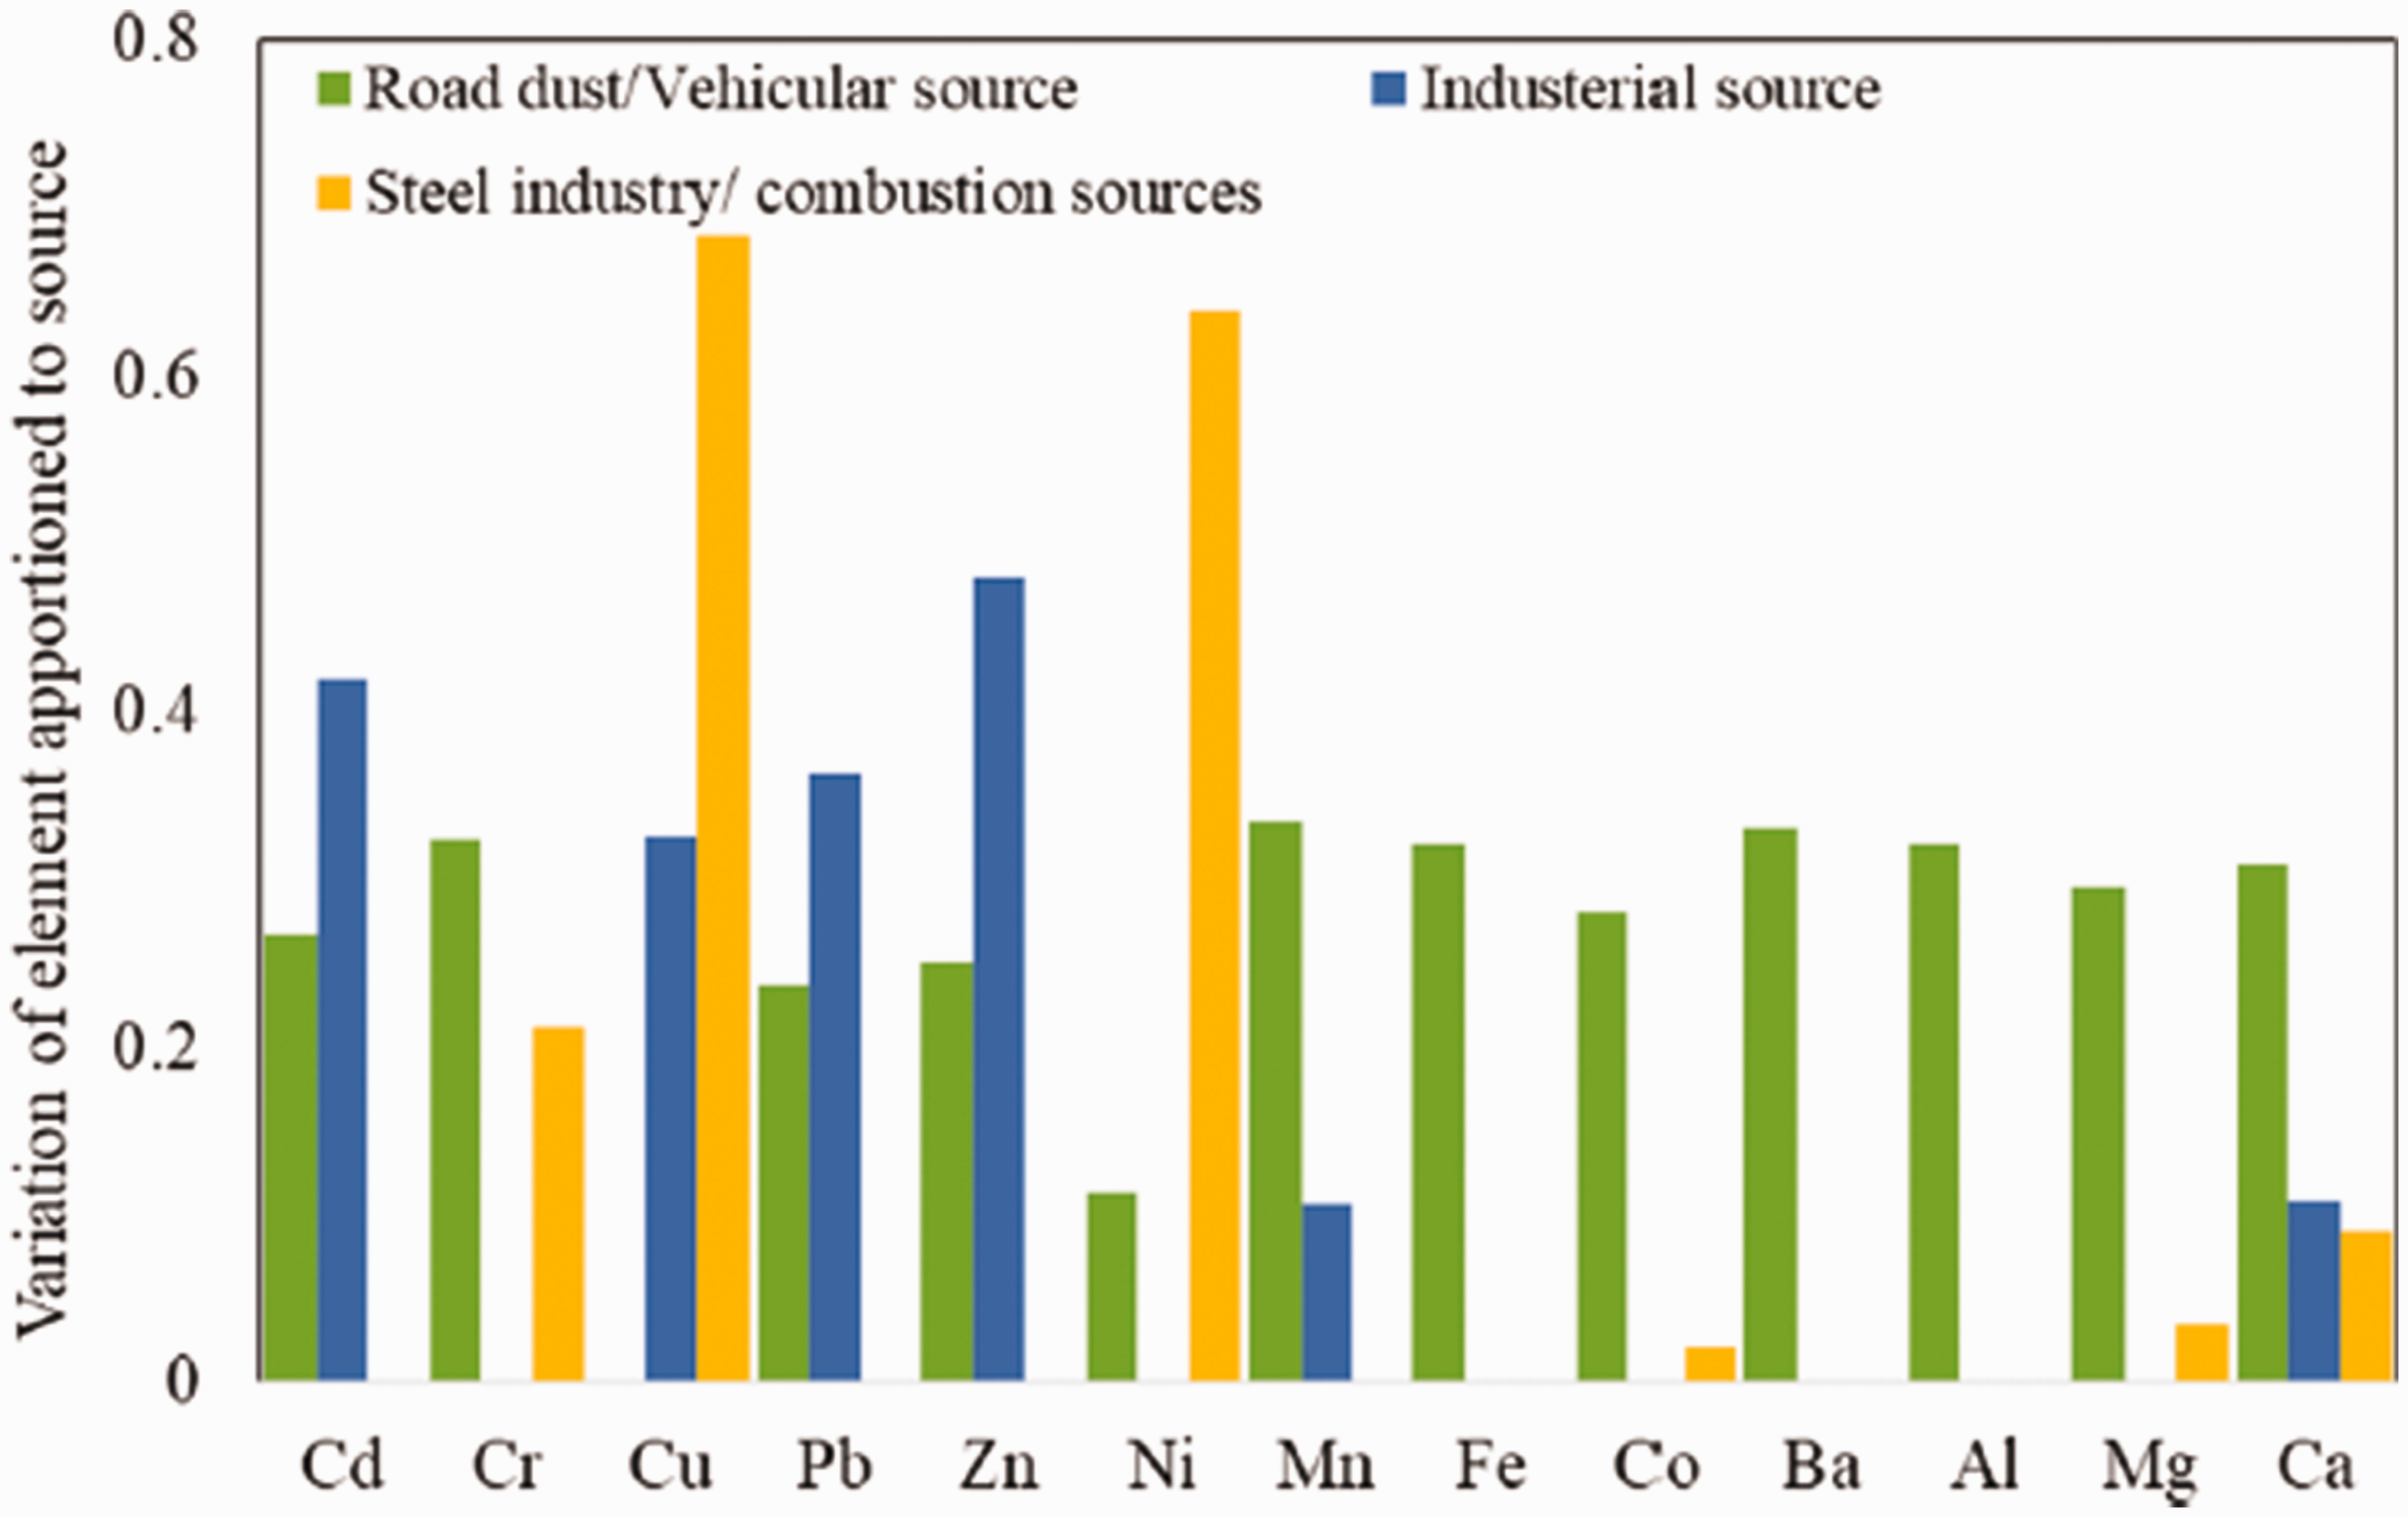
Variation of elements apportioned to different sources.Note: Please refer to the online version of the article to view the figures in colour.
Source apportionment
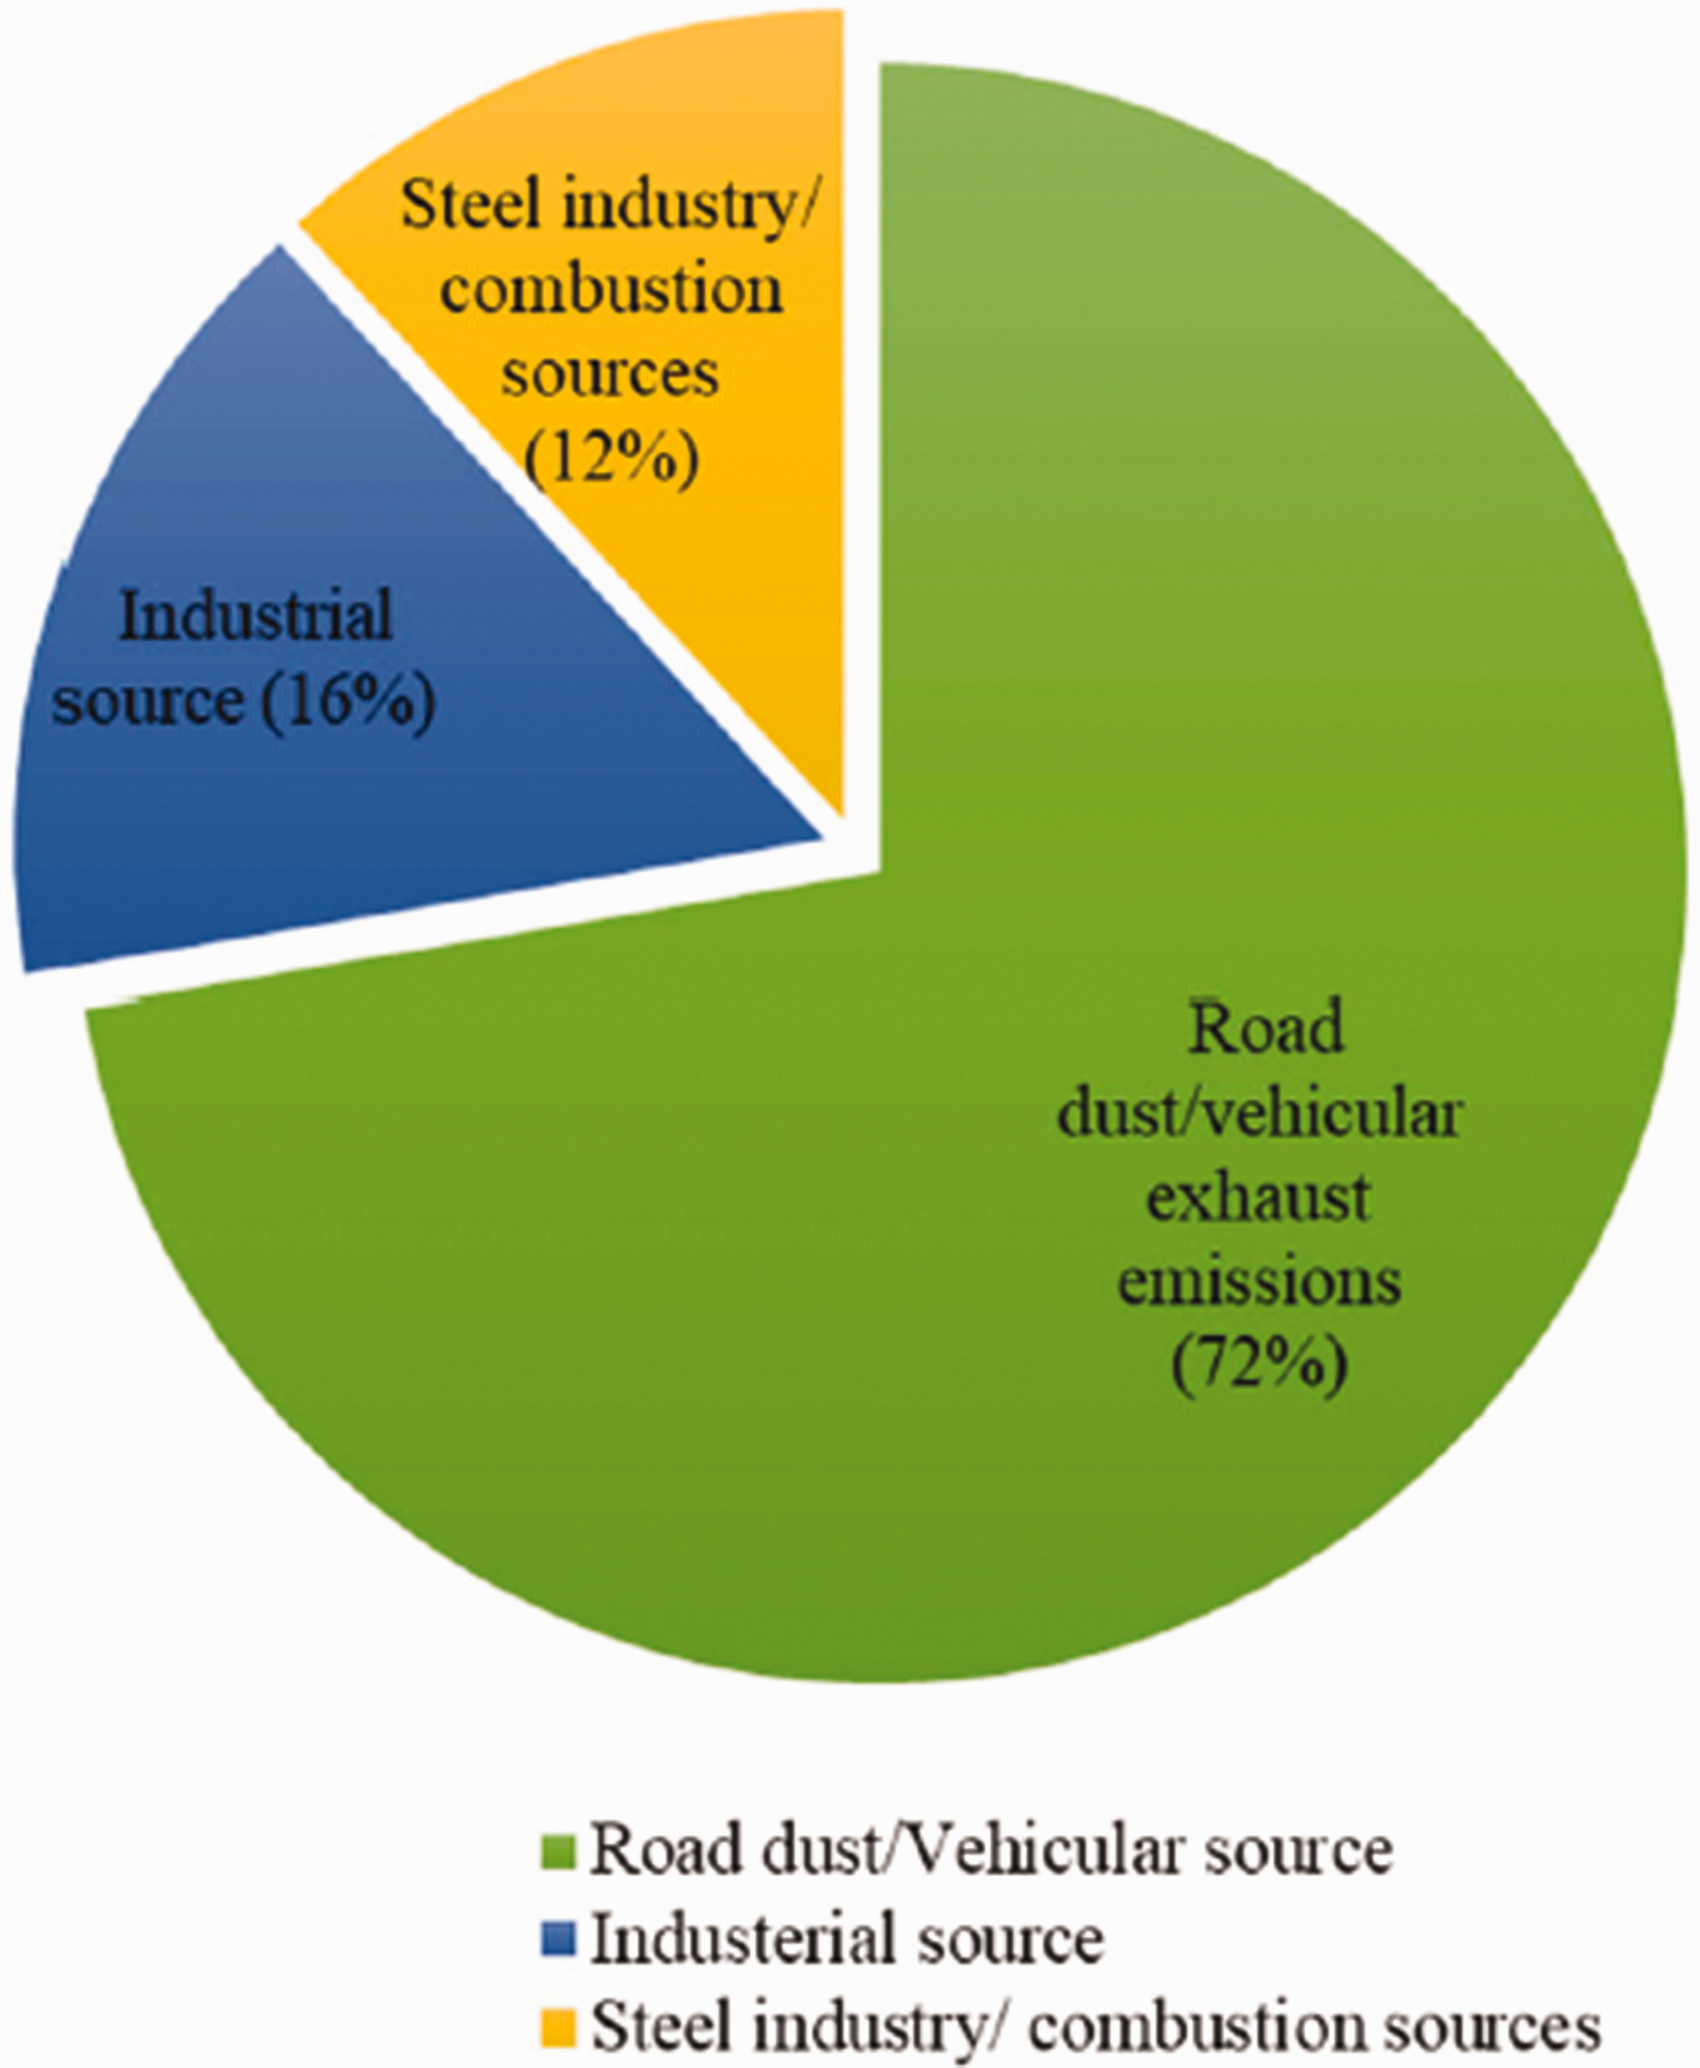
PCA was used for the identification of sources. 56 On the basis of PCA, three sources were identified with Eigen value >1. Elements present in the first most significant source are: Cd, Cr, Pb, Zn, Ni, Mn, Fe, Co, Ba, Al, Mg, Ca (Figure 8), with 72% of source contribution from road dust and vehicular emissions (Figure 8). Paved and unpaved roads were considered to be essential contributors to total PM10 concentrations in many urban and suburban areas of Lahore. Many studies have already shown that traffic inducing re-suspension was the main source of coarse particles.71,74–76 Influenced elements, e.g. Al, Mg, Ca, Co, were those that are usually associated with soil. 72 The re-suspended soil factor, which was identified by Harrison et al., 30 based on measurements of aerosols in Lahore in 1991–1992 and later by Rattigan et al. 19 and Shah et al., 77 relates with road dust and emissions from vehicles. The natural wind-blown soil factor was also identified by Shaheen et al. 78 in Islamabad. A number of elements (Pb and Zn) were found in this soil factor, and these were associated with road dust, and certain elements (Ba) associated with road dust were also identified in this factor, i.e. traffic. 70 Ba and Cu were emitted from brake wear, 70 Zn was from lubrication oil, tyres and brakes; Cd was from wear and tear of metal alloys and Pb was from two-stroke engines. 41
Sources contributing to PM10 in Lahore.Note: Please refer to the online version of the article to view the figures in colour.
The industry was found to be the second most significant source of metals in PM10 (Cd, Cu, Pb, Zn, Mn) (Figure 7) with 16% of source contribution (Figure 8). The major industry in Lahore includes manufacturing of motor cars and motorcycles, production of steel, chemicals and pharmaceuticals, engineering products and finally materials for construction purposes. 1 Previous studies had proved that vehicles are the major Pb source in Lahore.19,39 However, this is unlikely to be the case now due to a number of reasons. First, leaded gasoline in Pakistan has been phased out. That started in October 2001 and was completed by July 2002, so nowadays vehicles are no longer accepted to be the main source of Pb pollution. 79 Second, Shah and Shaheen 77 discovered that the average annual Pb concentration from samples of total suspended particulates in the area of Islamabad in Pakistan was equal to 0.144 μg m−3, approximately 30 times lower than that in the area of Lahore. 77 Even though Islamabad is less than 300 km far from Lahore, with a population exceeding five million in the Islamabad/Rawalpindi metropolitan area, Pb concentrations were lower because of fewer industrial point sources. Regarding emissions in Lahore, Zn and Cd were mainly produced by the metallurgical industry, e.g. smelting and the refuse incineration.19,30,43,80 Shaheen et al. 78 also confirmed that Zn and Cd were emitted from metallurgical activities in Islamabad. Mn, as a replacement of Pb in gasoline, was also emitted through combustion both in vehicles and in the industry. 64
Finally, the steel industry and industrial combustion processes were the third most significant source of metals in PM10 (Figure 7) with 12% source contribution (Figure 8) and with Cu, Cr, Co, Ni, Ca, Mg being the main elements emitted.41,46,47 Overall, PM10 aerosols that were derived from all urban areas of Lahore were mainly from road dust and soil, vehicular sources and industrial sources.
Summary and conclusions
This study presents a significant spatial variation in PM10 mass concentration and its chemical constituents at different sites of the city of Lahore in Pakistan. The highest PM10 concentration was observed on Lytton Road and was equal to 581 µg m−3. The mean PM10 concentration of all urban sites was 374 µg m−3. The main elements that were identified by SEM/EDS were: Si, Fe, Mg, K, Na, C, S, F and O. Those that were subsequently quantified by ICP-OES were: Fe, Al, Ca, Mg, K, Na, Cr, Ni, Pb, Cu, Zn and Mn. The dominating elements identified by SEM/EDX were: Si (48.1%), O (34.1%), C (6.5%), Ca (2.9%), Zn (2.2%), Cl (1.7%) and Fe (1.7%). Tubular, club and irregular shapes of particles were also observed through the SEM/EDX analysis. Tubular shapes indicate high amount of silicates, whereas club and irregular shapes indicate elements of biological origin and trace minerals, respectively. ICP-OES was found to be a more reliable technique for the analysis of toxic metals of interest than SEM/EDX. The elemental contribution to PM10 was found to be more from crustal origin and less from anthropogenic origin. Various statistical techniques, such as cluster, correlation coefficient and PCA were used to assess the similarity among different elemental constituents, the strength of association among different variables and for source identification. The main sources identified in the study were: road dust and vehicular sources (72% of the total), followed by industrial sources (16% of the total) and the steel industry and combustion process sources (12% of the total). For future work, there is a need for the proper air quality management of vehicular and industrial sources as well as emission factors should be calculated for the proper control and abatement of air pollution sources.
Footnotes
Acknowledgements
We are grateful to the Higher Education Commission, Pakistan and Environmental Protection Agency, Punjab, Lahore for the funding and support that enable us to carry out this work. We also thank Mr. Tauqeer Qureshi (Director, EPA) Mr. Farooq Alam (Research Officer, Air Pollution Lab at the EPA), Mr. M. Fujimura (JICA Expert), Mr. Hassan Murtaza Khan (Statistical Analyst) and Mr. David Jones (SEM/EDX Expert) from the Department of Mechanical Engineering of the University of Surrey for their valuable suggestions and contributions.
Authors’ contribution
Fatima Khanum: Formal analysis, data curation, methodology, writing - original draft; Muhammad Nawaz Chaudhry: Conceptualization, methodology, supervision, writing - review and editing; George Skouteris: Lab analysis, methodology, writing - review and editing; Devendra Saroj: Physicochemical characterisation, methodology, writing - review and editing; Prashant Kumar: Conceptualization, funding acquisition, resources, methodology, supervision, writing -- review and editing.
Declaration of conflicting interests
The author(s) declare no potential conflicts of interest with respect to the research, authorship, and/or publication of this article.
Funding
The author(s) disclosed receipt of the following financial support for the research, authorship, and/or publication of this article: The authors would like to acknowledge the funding support from Higher Education Commission of Pakistan for the fellowship to visit UK to Fatima Khanum.