
Abstract
The risk of Legionella transmission from rain water harvesting (RWH)-fed water toilet flushing was investigated. Experiments monitored RWH tanks to determine Legionella spp. presence which was successfully isolated from three of four of RWH tanks (site 1: 3600 CFU/dm3 in February and 3600 CFU/dm3 in May; site 2: not detected; site 3: <940 GU/dm3; site 4: 44,000 GU/dm3), and to determine whether toilets could generate aerosol droplets capable of harbouring bacteria. The concentrations of particles measuring 10 µm or less in diameter (PM10, capable of reaching the alveolar region of the lungs and causing disease) were monitored following flushes. Aerosols were detectable in an enclosed toilet cubicle (PM10 concentration increased in one experiment from 0.038 mg/m3 when t = 1–600 s to 0.057 mg/m3 when t = 600–800 s). Recovery of Lactobacillus plantarum (surrogate for Legionella) from a seeded toilet cistern (108 CFU ml/dm3) indicated that bacteria were expelled, as demonstrated by recovery on MRS plates placed around the toilet unit. Legionella could be dispersed via aerosols from a toilet flushed with water from an RWH system and the effect would be more pronounced in smaller, enclosed areas, but this is unlikely to pose a risk to human health.
Introduction
Global population trends, which will see the population on the planet increase drastically in the 21st century, will challenge water demands. Drought, pollution and contamination will compound this further.1,2 Water use is not limited to potable water, which accounts for a small fraction of overall usage and ranges between 7 and 300 dm3 a day. In Sweden, 20% of household water is used to flush toilets, 15% for laundry and 10% for car washing. 3 For this reason, strategies which provide water that is not intended for drinking are an attractive option to augment existing systems. Rainwater can be used for toilet flushing, watering crops and gardens because it is available free of charge and reduces the individual’s demand and thus expense for purified drinking water from drinking water companies. 4
Rain water harvesting (RWH) systems are methods whereby rainwater is collected, stored and conserved for later use for a variety of purposes. There is no accepted universal classification for RWH systems as they can be adapted for a multitude of applications. A typical system consists of a set of defined components including a tank which stores water and which is intermittently supplied with rainwater run-off from catchments. 5 Globally, disinfection may be required by a range of methods from chlorination to filtration and pasteurization.2,6,7
The government of the UK has adopted policies which maximize the efficiency of water use. To this end, policies which promote technologies which can recycle water or acquire water from previously unused sources were introduced. Building regulations (Government document ‘G2’) 8 introduced in 2010, were modified in 2015 and 2016. Subsection 17K 8 specifically called for the prevention of water wastage and described a set of requirements for demonstrable improved water efficiency in all newly constructed buildings before a certificate of completion could be issued. The desired effect from these regulations is to bring about a change in potential wholesome water usage to 125 dm3 per head per day. One way in which this might be achieved is through introducing RWH systems which act as a supply of non-wholesome water, appropriate for non-drinking water applications such as toilet flushing. 3 An incentive scheme is in place in the UK to encourage businesses to implement water efficient technologies. The guidelines for RWH systems state that such water should be used for non-drinking water applications and that only monitoring, filtering and maintenance equipment would be reimbursed. 8 As a result of these incentives as well as the legal requirements set out by revisions to building regulations, RWH systems have become more attractive.
However, there are concerns that RWH systems harbour pathogenic organisms, particularly Legionella. There is already a strong association between anthropogenic water sources and Legionella and there are fears that RWH systems could facilitate the spread of the disease in vulnerable individuals9,10 although to date there are no documented infectious diseases associated with reclaimed water (although these have focused on faecal pathogens 10 ). Water technologies such as RWH systems may also be able to facilitate the growth of Legionella, as was the case after the introduction of modern ‘non-touch’ taps (which mix hot and cold water to a set temperature) into hospitals. 11 New water technologies need to be closely monitored to ensure they do not pose a risk to the general population.
The occurrence of Legionella is tightly controlled within the UK due to its potential negative health effects. Water systems to which the general public are exposed (and their components) are required to undergo a risk assessment to determine and control Legionella presence. It is also important to consider the impact on human health of untreated water use in domestic environments where legislation does not control microbiological water quality, and which may account for a perceived under-reporting of infection. 12 It is therefore vital to determine the occurrence and dissemination of Legionella in and via RWH systems to evaluate the risk to human health and to ensure that newly introduced RWHs are safe and meet the appropriate health and safety regulations. 13
The risk or Legionella transmission is one of the most significant threats posed by any anthropogenic water system particularly those which release aerosols such as air conditioning units, cooling towers, whirlpool baths, showers and even more recently windscreen wiper reservoirs. 14 RWH systems may contain Legionella spp. as they meet a number of the environmental requirements of the organism. Studies on the frequency with which Legionella occur in RWH systems are limited though it has been suggested in some instances that it is entirely absent. 3 Studies to date on the presence of general pathogenic organisms in RWH systems, (including Legionella), and in roof run-off water have indicated that harvested rainwater was within acceptable limits as stipulated by Health and Welfare Canada guidelines (none detected in 10 ml of harvested rain water).
The work of Steege and Moore 15 focused most recently on the presence of Legionella contaminants in rainwater storage butts and the risk associated with aerosolization of such water in the context of gardening activities and a study by Schetz et al. 4 found roof collected rainwater stored in four different reservoirs in Netherlands (which was used for toilet flushing, cleaning floors and watering) contained human pathogenic microorganisms including Legionella that could be potentially associated with biofilms in the reservoirs.
RWH systems, should they harbour Legionella, may disseminate it into the indoor environment given that they are most commonly used to charge toilets which have been documented to release aerosolized water.16,17 In order to cause Legionnaires disease (LD), Legionella must be able to reach the alveoli for which they will need to be encased in a droplet no larger than 10 μm. 18
Legionella are Gram negative, non-spore forming, aerobic bacilli and are the sole members of the family Legionellaceae. Free living Legionella can grow to be 0.3 and 0.9 μm wide and 1.3 μm in length, but they can also parasitize protozoa. To date, over 50 different species of Legionella have been identified, half of which are implicated in human disease. Legionella are known to survive at temperatures between 5 and 63°C and have a pH range between 5.0 and 9.2. 19 Should the bacteria be internalized within a protozoan host, when that host enters into a cyst stage, Legionella too will be protected from unfavourable conditions such as extreme heat, biocides, osmotic stress etc.19,20 This survival mechanism most likely has a major impact on Legionella’s ability to persist in the environment, when considered along with its ability to form biofilms.
Particularly pertinent to the research presented here, biofilms have been observed to occur in toilets 21 and have a number of implications on hygiene and often occur under the rim where limescale frequently occurs. 22 While a thorough survey of such an environment has already been carried out by Egert et al. 21 which did not indicate the presence of Legionella, it might be possible that the composition of a biofilm community will differ significantly between a RWH augmented system and a more conventional setup with potable water.
One of the major difficulties associated with LD is the lack of a concise infectious dose. Animal studies 23 suggest that the infective dose for humans could be very low. Studies by Khodr et al. 24 have shown how genetic analysis has elucidated protein domains in Legionella that are also found in eukaryotic organisms suggesting co-evolution with a protozoan hosts: This may have affected pathogenicity, perhaps increasing virulence in some strains and accounting for a low infective dosage.
The most common mode of transmission for Legionella is thought to be from inhalation of airborne droplets contaminated with Legionella. Infections of Legionella due to the release of aerosols from mechanical devices such as cooling towers, air conditioners and whirlpool baths have been observed. 25 Indeed, the first recorded incident of LD in Philadelphia in 1976, implied that individuals were exposed to Legionella due to the circulation of liquid water aerosols from a contaminated air conditioning unit. 26 Hot springs and standing water puddles are perhaps the only natural water sources which have been implicated in the transmission of Legionella whilst the spread of Legionella from person to person has yet to be demonstrated.
Inhalation of contaminated droplets has been deemed necessary for the development of LD. Given the physical dimensions of the Legionella bacteria an aerosol must be at least 2 μm in diameter to support the bacteria. The upper limit for an aerosol is 10 μm in diameter, any larger and it will not reach the alveolar region, the site of LD infection. Larger aerosols are thought however, to be capable of colonizing the trachea-bronchial (diameter <20 μm) or the extra-thoracic regions (diameter <200 μm). 23 The stability of droplets may be dependent upon a number of environmental conditions particularly temperature and relative humidity.27,28
There is much research into the generation of aerosols that are capable of reaching the lungs for medicinal and therapeutic treatments.29,30 It is also known that disturbing the air above a water source, as well as agitation of water surfaces, will increase the amount of aerosols generated by it. This is precisely what is observed in a typical toilet flush though admittedly the temperature and relative humidity of the agitated water and air around the water in a toilet would likely be considerably less than in a whirlpool device scenario. 18
In the context of this work, aerosols generated from toilet flushing were of primary interest. It has already been demonstrated by Gerba et al. 16 that toilet flushing generates aerosols capable of transmitting disease. By seeding a toilet with Escherichia coli and placing nutrient agar plates in a specific layout throughout a bathroom Gerba et al. 16 demonstrated that not only were aerosols generated by toilets but that they were also capable of harbouring microorganisms which could subsequently form colonies on agar media plates. This was the first study of its kind to imply that toilets could possibly be a route which could lead to ill health in humans and also lead to the contamination of a bathroom. Another similar study carried out by Barker et al. 17 demonstrated that aerosols containing Salmonella spp. could be generated when simulating diarrhoea loaded with Serratia bacteria placed within a toilet bowl. This demonstrated that bacteria may be aerosolized under a number of different conditions and that there are areas of a toilet where an introduced organism can persist, i.e. the recess at the back rim of the toilet. These studies have focused exclusively on bacteria which cause gastroenteric diseases, because of their association with faecal-oral transmission routes and the relevance of this to bathroom hygiene. There are few in-depth studies on aerosolized bacteria from toilets which could lead to pulmonary disease. Legionella is unlikely to infect from dry surfaces, therefore, in this study, a greater focus was placed evaluating aerosol droplets, specifically aerosol droplet sized less than 10 μm in diameter, which are the upper-most sized particles which are capable of reaching the alveoli where Legionella cells can cause LD.
In contrast to previous toilet seeding studies, this study examined whether a contaminated toilet cistern rather than a toilet bowl was capable of expelling viable colony forming bacteria upon flushing. It is also notable that toilet cisterns are not often included as part of sampling procedures in some jurisdictions unless a risk assessment dictates it necessary. Cisterns are also not routinely cleaned and as such can act as reservoirs for biofilm formation that can potentially ‘seed’ flushes with organisms sloughing off from biofilms.18,26,31
The two elements of this study sought to establish: if RWH systems harbour Legionella and whether the toilets which they are linked to, are capable of generating an aerosol – of the correct droplet size range capable of encapsulating cells and potentially causing LD.
Because of the hazards associated with Legionella, the cistern water in the toilet rig experiments presented here was seeded with the dummy organism (Lactobacillus plantarum NCIMB 11974) to emulate microbial contamination of the flushing water.
This organism was chosen because it is relatively harmless in comparison with Legionella.
Materials and methods
Particulate matter detection - Instrumentation validation
A Dusttrak II (8531 model TSI Inc.) was used to detect aerosols in this study. This instrument is a portable optical device for measuring particles of various sizes. 32 The Dusttrak II instrument was fitted with the PM10 filter (according to manufacturer’s instructions) for all experiments on the basis that it would detect up to the largest sized particles which would be capable of reaching the alveoli. 29
The Dusttrak II was used to determine the concentration of aerosols under 10 μm in the environment and a Qtrak (7565 model TSI Inc.) was used to measure parameters such as temperature and humidity.
Between each run the Dusttrak II instrument was zeroed using the zero filter to ensure proper validation. The impactor plate, the inlet valve as well as the PM10 filter itself were cleaned using a cotton bud and isopropanol between each experiment and allowed to air dry.
A semi-quantitative check of the instrument’s performance was carried out by the use of a distilled water aerosol source, provided by a nebulizer unit (Omron U22, Omron Healthcare UK Limited). This unit provides an aerosol of mass median aerodynamic diameter (MMAD) 4.2 µm, at an aerosol output rate of 0.087 ml/min. The Dusttrak II and nebulizer units were both placed in a sealed Perspex enclosure of approximately 1 m3 (device power lines via sealed portals such that the nebulizer and Dusttrak II could be operated without opening the sealed system). The Dusttrak II instrument was pre-set to record at a pre-determined time, and experimental runs were carried out in the following manner: a zero calibration was carried out using the zero filter provided by the manufacturer, and the instrument was switched on to begin recording (t = 0 min). After 1 min, the nebulizer was switched on and allowed to run for 1 min. The nebulizer was then switched off and the Dusttrak II continued recording for a further minute, at which point it stopped recording automatically (t = 3 min). The tests were carried out at a chamber temperature of 21°C and relative humidity (RH) of 38.9%. At the end of the tests the temperature had fallen to 20.4°C and the RH was increased to 55.2%. Results were downloaded from the Dusttrak II instrument and transferred to a computer for further analysis. The procedure was repeated six times and the average increase was calculated.
Experimental toilet rig setup
A modern, continental style domestic toilet dual push button cistern was set up on a platform measuring 1 m × 1.68 m and raised 0.10 m off the ground, in an experimental laboratory area in Cranfield University. This experimental toilet was attached to sewerage mains, but had no mains water feed to the cistern and so was filled, manually, with deionized water. This toilet rig was used for a range of experiments in which known numbers of Lactobacilli were seeded into the cistern. The volume of water held in the cistern was 10 dm3 while the bowl could hold 4 dm3. Deionised water (9 dm3) was added to the cistern for cleaning and in each experiment. For the purposes of all experiments the larger volume flush was chosen to assess the worst-case scenario associated with maximal water movement.
Experimental toilet rig – Cleaning protocol
Before all experimental work began and between each experimental procedure, the toilet, both bowl and cistern and its components, were cleaned thoroughly with commercially available thin bleach solution (5% sodium hypochlorite left in contact with toilet cistern and bowl overnight to ensure sterilization) and rinsed with deionised water. The cistern and bowl were brushed down using a small headed washing-up brush and standard toilet brush, respectively.
Before use, the system was flushed clean with deionised water until a chlorine ion concentration of 5 ppm was reached. This was measured using Merck chlor colorimetric 0.5–20 mg/dm3 Cl2 sticks (Merck, Darmstadt). This protocol was based on a cleaning protocol set out by Barker et al. 17
Evaluation of ‘cubicle effect' with experimental toilet rig
To evaluate the effects of cubicle presence on aerosol detection, for one set of experiments, a temporary cubicle was fabricated to enclose the toilet rig. This cubicle measured 1 m × 0.9 m and was 1.8 m in height with a gap between floor and cubicle.
Organisms used in experimental toilet rig experiments
L. plantarum was chosen as the experimental organism for these experiments because of its specific ability to grow in the presence of sodium acetate which suppresses the growth of competing bacteria (thus allowing for ease of selection on solid media) and for size and relative ease of cultivation. Lactobacillus plantarum cells are generally in the size range 1–3 µm which are slightly smaller than those of Legionella pneumophila which tends to grow longer in poor nutritional media (2–4 µm or longer).
Lactobacillus plantarum was grown in batches of 100 ml on MRS (de Man, Rogosa and Sharpe 33 ) broth medium (Oxoid, Basingstoke, UK) overnight (no more than 16 h) at 20°C temperature which gave c. 108 CFU ml−1. This suspension was centrifuged at 3000 r/min for 30 min in a Sigma 3-16p centrifuge and subsequently washed and re-suspended in 200 ml of sterile 1× PBS solution (pH 7.4, Phosphate Buffered Saline, Sigma-Aldrich) which would then serve as the inoculum for seeding experiments.
Experimental toilet rig seeding experiments
The prepared L. plantarum inoculum was added into the toilet cistern and thoroughly mixed using a stirring rod to ensure even distribution throughout the water volume. The period of time for which the inoculum was left in the cistern before flushing was varied between differing experimental designs. Three different flushing regimes were implemented: immediately after inoculum addition, where (t = 0) after 1 h (t = 1 h) and after an overnight period (t = no less than 15 h and no more than 16 h). The exact concentration of L. plantarum added in each experiment was determined by using a standard serial dilution protocol which measured the CFU ml−1 in a sample of inoculated deionised water taken from the cistern immediately after seeding. Negative control experiments were also carried out in which the cistern was seeded with 200 ml of sterile PBS solution. These controls were carried out for each variation of experimental procedure.
Microbiological sampling of experimental toilet rig
Settle plates, Petri dishes containing MRS agar (Oxoid, Basingstoke) were positioned around the experimental toilet rig as shown in Figure 1. These plates were exposed for 30 min after each flush. Plate 6 was inverted and suspended over the centre of the toilet bowl using a strip of strong board and adhesive tape. To prevent contamination of plates while moving between buildings with sample plates, the Petri dishes were covered in Parafilm. All plates were incubated at 20°C for 48 h and then resultant bacterial colonies were counted.
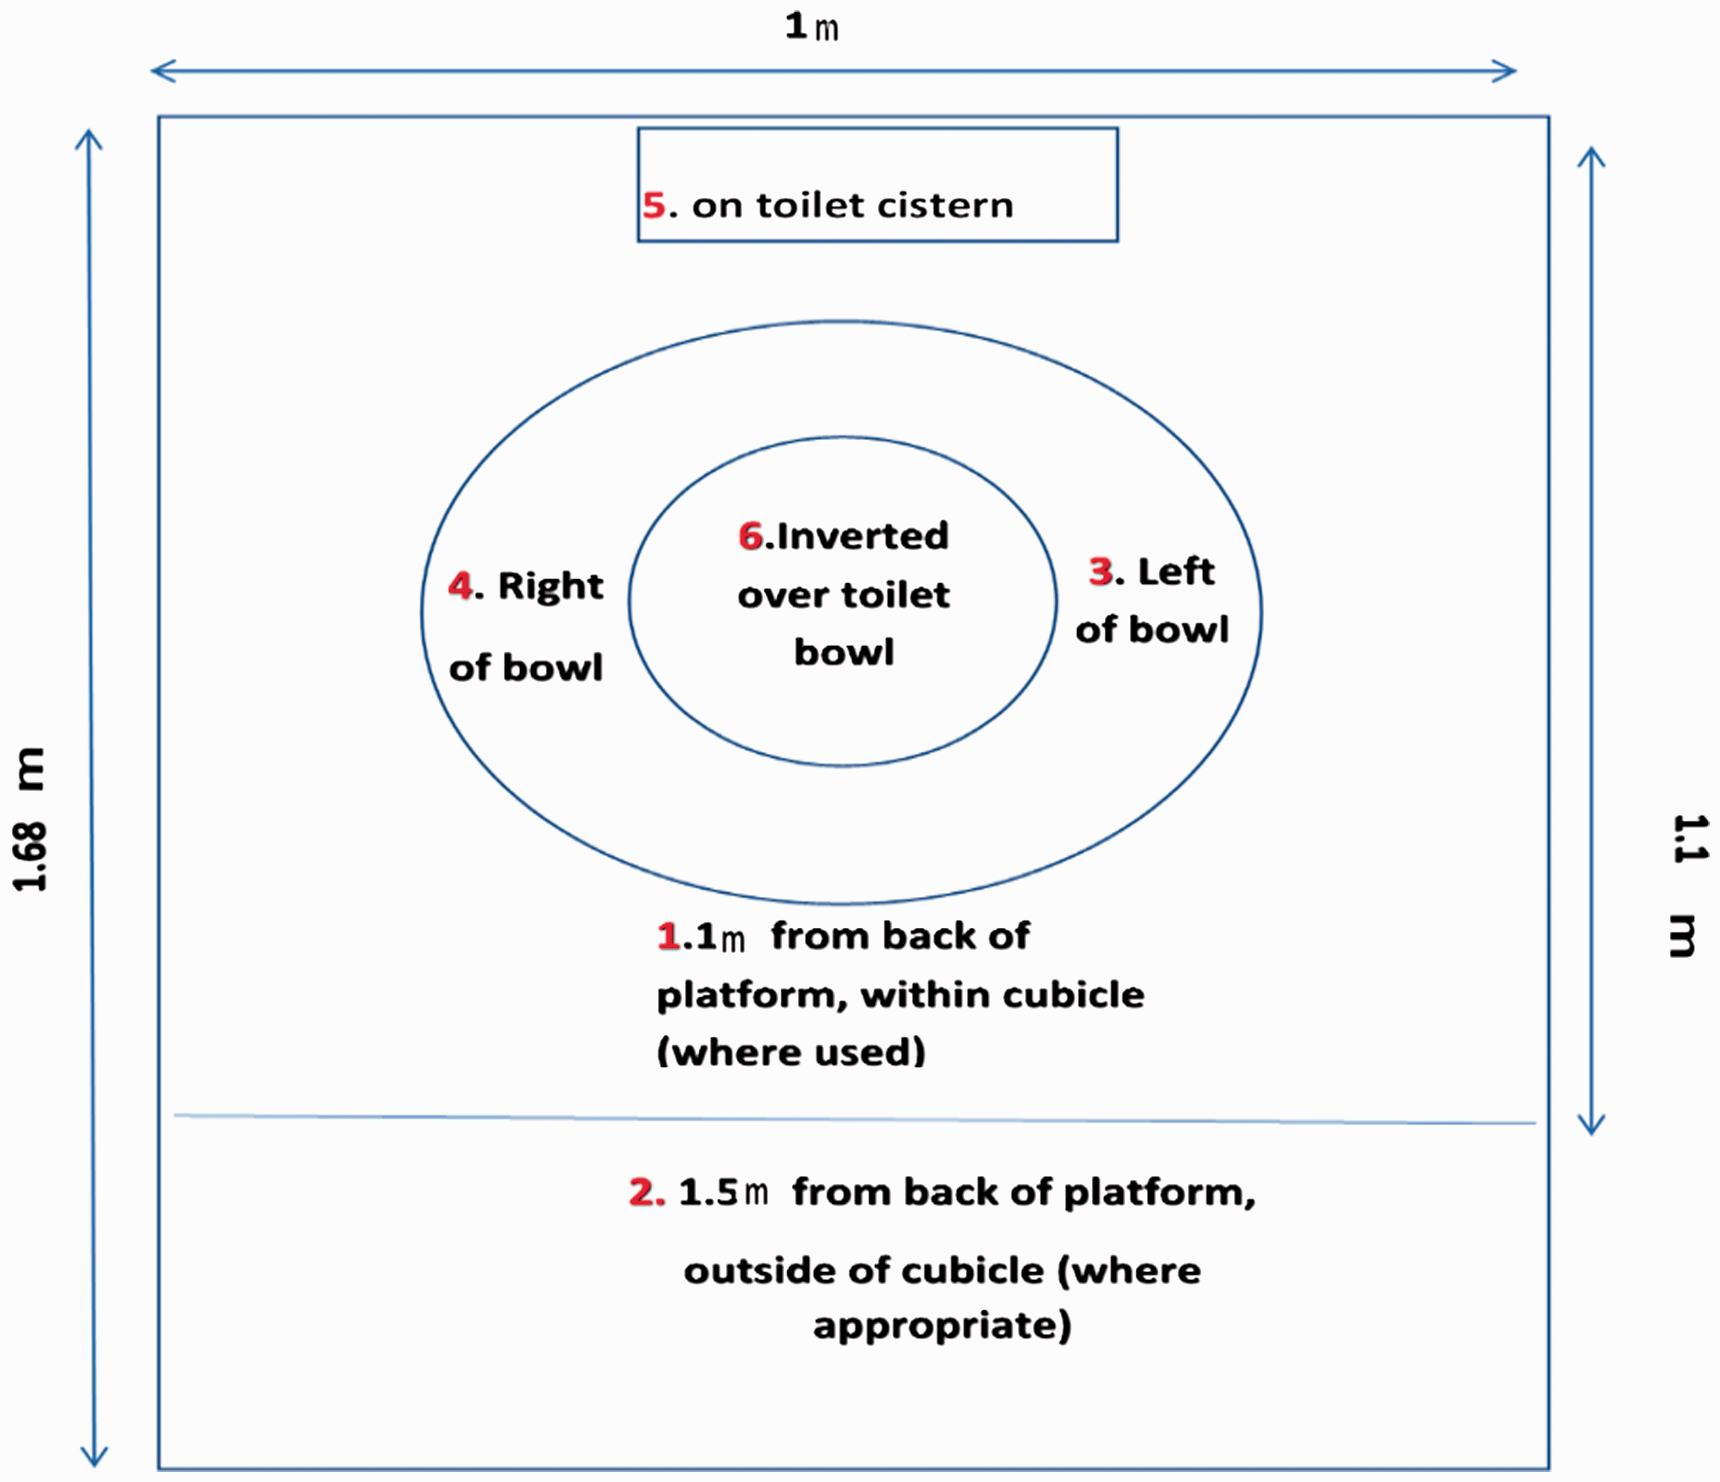
Experimental toilet rig: Plan of settle plate locations (not to scale).
Experimental rig toilet bowl sampling
During the course of the seeding experiments the toilet bowl was also checked for persisting Lactobacillus plantarum contamination. Sterile cotton swabs were swabbed across the surface of the toilet bowl. These swabs were then plated onto both MRS and Luria Bertani (LB) plates (Oxoid, Basingstoke) and incubated at 20°C for 72 h and then counted.
The overall platform size was 1 m × 1.68 m while the area of the cubicle measured 1 m × 1.1 m. Schematic shows relative positions of MRS settle plates exposed for 30 min after flushing toilet. The horizontal dividing line represents the length of the temporary cubicle (1.1 m). The platform on which the rig was placed was 0.10 m in height.
Sampling locations and parameters for departmental toilet flushing aerosol size detection experiments
Two regularly used departmental toilets in Cranfield University were chosen for toilet flushing related aerosol size detection experiments. The toilet area was closed to all users throughout the duration of all experiments. One toilet was fully enclosed by a floor to ceiling partition in a cubicle measuring 1.5 m × 1.2 m (these cubicles are typical within public toilets in the UK). Within the foyer area outside this cubicle, an air freshening system (PHS, UK) was in place which released an air freshener spray every 30 min, although no experiments were conducted whilst it was operational. The other selected toilet was smaller (1.2 m × 0.75 m) comprising of a partially enclosed cubicle with a 0.1 m gap between floor and cubicle door and 0.5 m gap between cubicle door and ceiling. This toilet had no air freshening system.
Departmental toilet experimental setup
The monitoring equipment Dusttrak II and Qtrak were placed on top of a footstool measuring 0.3 m in height and immediately in front of the toilet bowl. The door leading into the cubicle was left slightly ajar to ensure the conditions within the cubicle were consistent with the toilet lobby. The Qtrak probe was placed such that its air inlet nozzles were positioned just over the rim of the toilet bowl so far as the foot stool would allow. Both the Dusttrak II and Qtrak were set up to log data every second over a 30 min period except when dictated otherwise. Ambient PM10 concentrations were monitored and recorded for the first 10 min. After this time had elapsed, the operator entered the cubicle to flush the toilet and then immediately departed.
Departmental toilet positive control procedure
To ensure the Dusttrak II was capable of recording released aerosols and was functioning correctly, a positive control test was carried out whereby a spray bottle containing water was sprayed into the cubicle from a slight gap in the doorway. Data were collected both before and after the spray event.
Departmental toilet experimental flush measurement procedure
Total PM10 aerosol concentration measurements were logged every second over a 30 min period. PM10 levels were recorded for the first 10 min. The toilet was then flushed by an operator who entered the cubicle, flushed the toilet and departed promptly ensuring the toilet door was left ajar upon egress. Data were then collected for the remaining 20 min.
The Dusttrak II and Qtrak continued to take PM10 concentration readings following the flushes which were recorded for a further 20 min, post-flush. Negative control experiments were conducted in which the operator entered the cubicle and then left without flushing the toilet.
The detection of Legionella spp.in RWH tanks
The following tests were carried out by ALcontrol Laboratories (Now, ALS global, Cambridgeshire) a United Kingdom Accreditation Service (UKAS) accredited laboratory. The Quality in water analysis Scheme method 34 took harvested rainwater sample and plated it onto Legionella-specific buffered charcoal yeast extract agar. Any Legionella-like colonies were presumptive Legionella. These presumptive Legionella were then plated onto a more specific media containing cystein and iron which are required for Legionella growth to confirm the result. PCR (polymerase chain reaction test) was then carried out according to the Alcontrol method based on Yang et al. 35 to identify specific Legionella serotypes. Harvested rain water was collected from four sample sites identified in the UK by SMS Environmental Ltd at different times of the year 2010, specifically, February, May and July. The chosen sample sites represent RWH tanks identified by SMS Environmental and anonymized for this study
Results
Particulate matter detector (Dusttrak II) instrumentation validation
The instrument validation procedure described in this work, did not provide a definitive calibration because it was not possible to control parameters such as the heterogeneity of the aerosol ‘cloud’ or evaporation of the aerosol after formation. However, it provides assurance of the ability of the instrument to detect water aerosols that are in the size range of interest for the current study and informs the use of an uncertainty factor in the risk assessment process to account for the instrument calibration not being specific to the aerosol of interest. In addition, any discrepancy in measurement identified can be allowed for by inclusion of an additional safety factor in the risk assessment. Figure 2 shows Dusttrak II data collected before and after the nebulizer unit was switched on and allowed to run for 1 min. The ‘A’ value is the mean of all readings up to and including t = 120 s (before the nebulizer was turned on) and shows a mean value of 0.0094 mg/m3, the ‘B’ value is the maximum reading during the nebulizer test event (25 mg/m3), and the difference between these values B – A = maximal size of the nebulizer aerosol event. The maximal value calculated for six experimental runs of this protocol varied between 12.29 and 24.9 mg/m3. Table 1 shows the data from five experimental runs where the water aerosol nebulizer was turned on and Dusttrak II data was recorded.
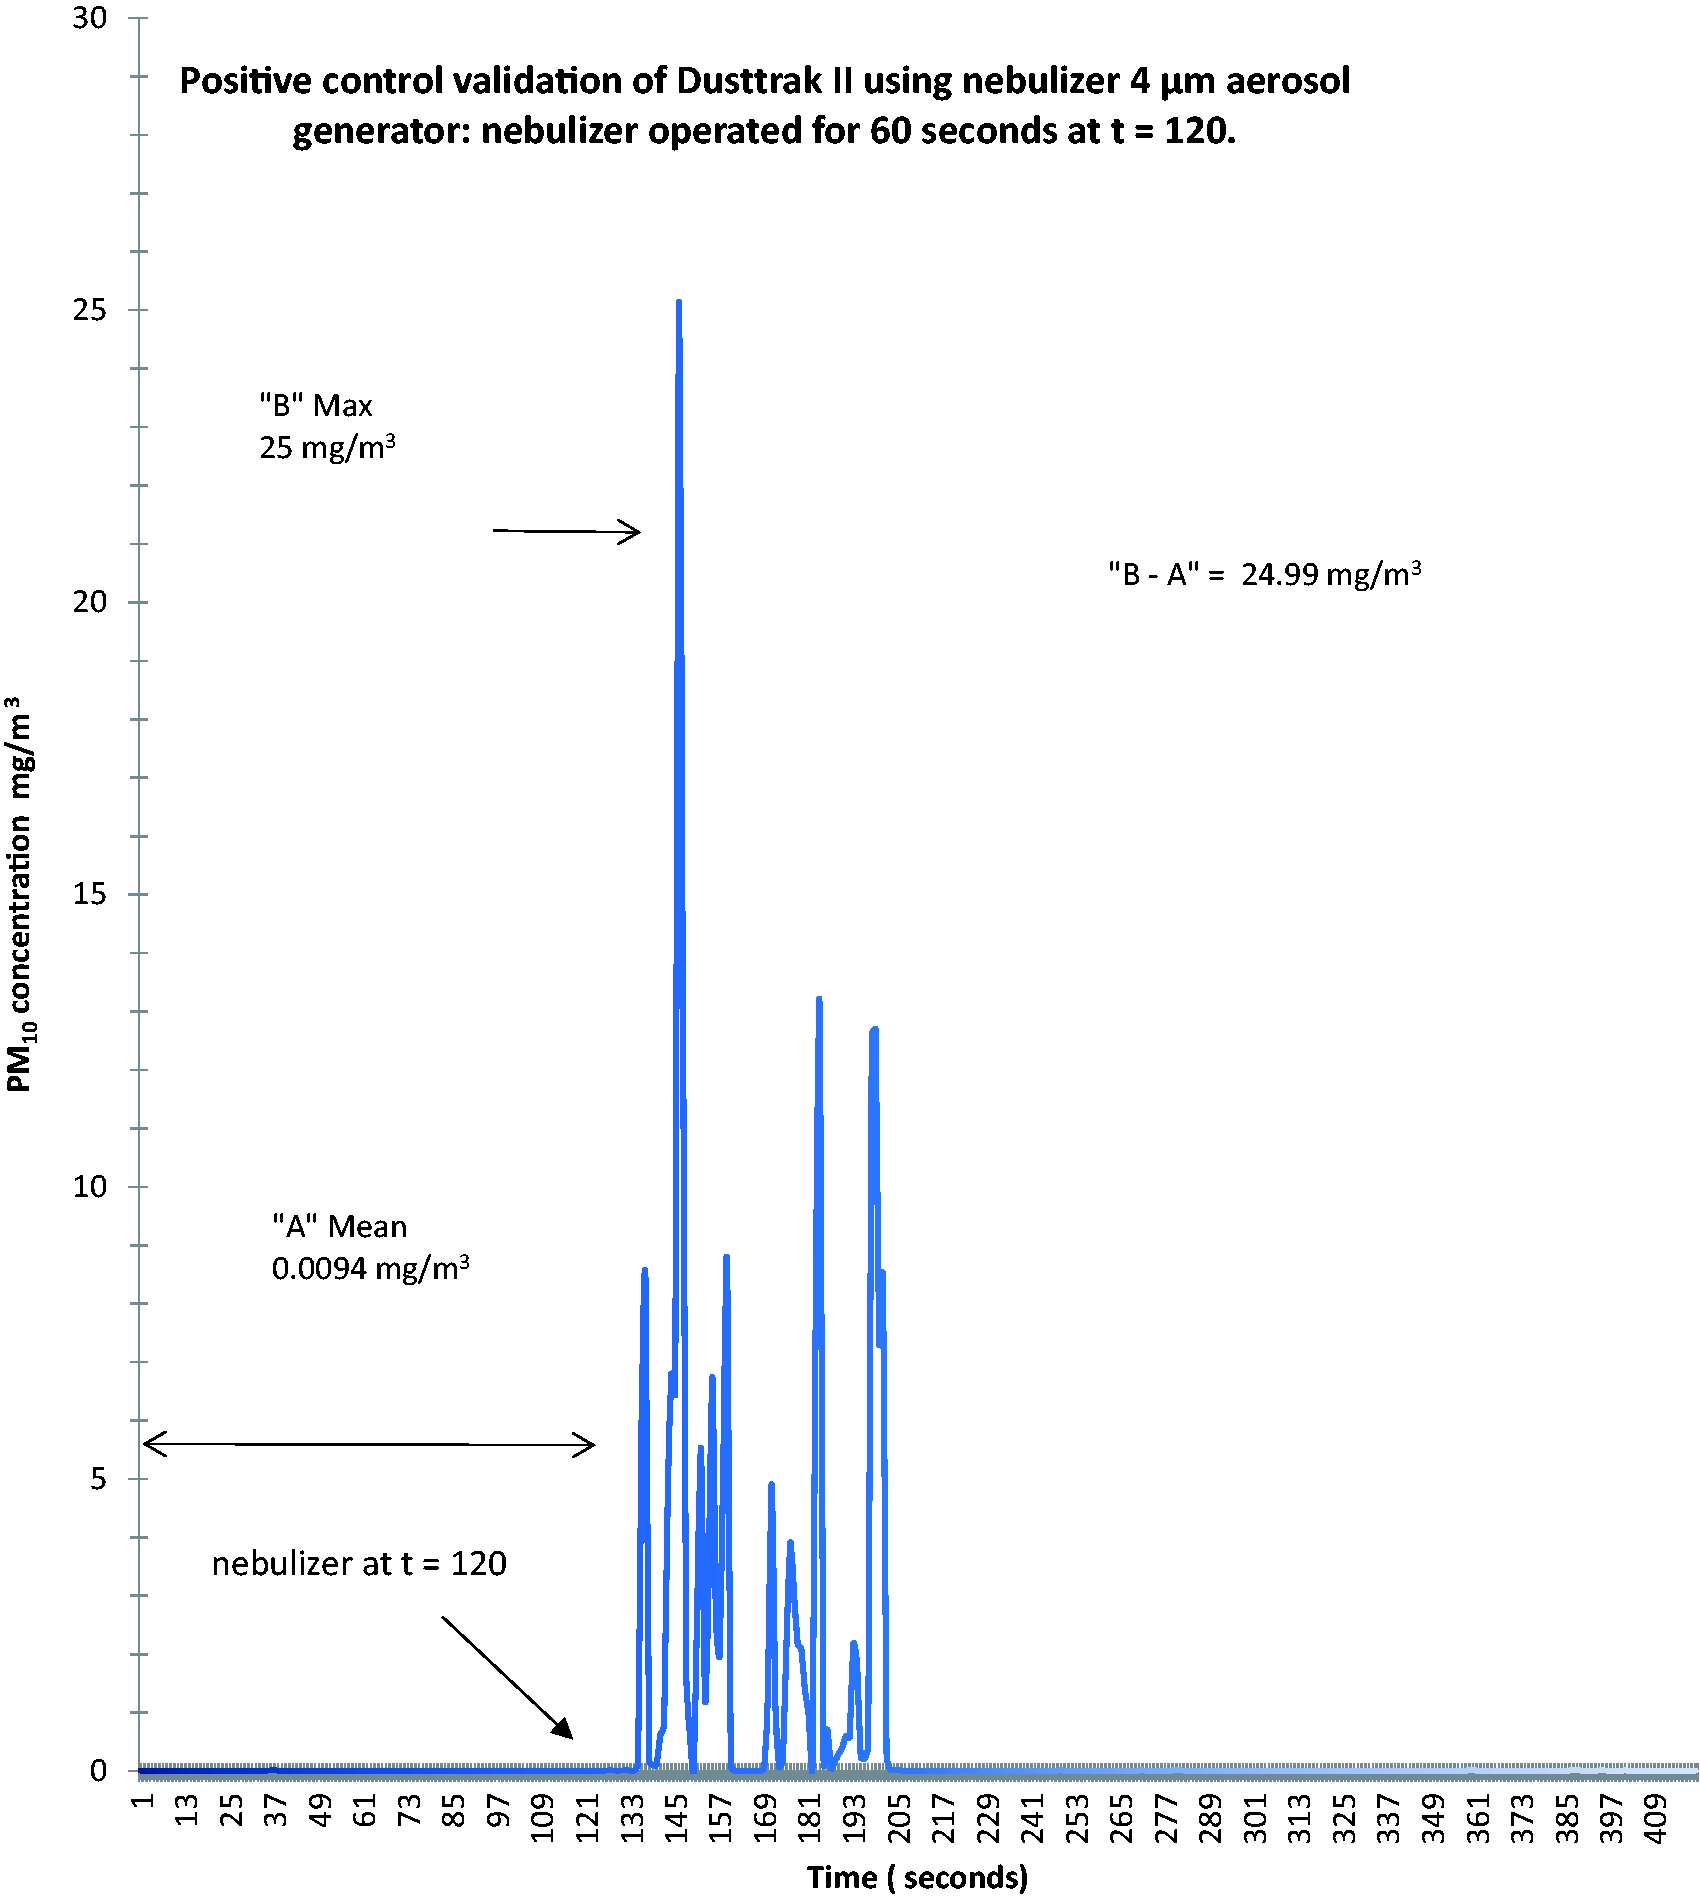
Positive test event detected using the Dusttrak II 8530 laser photometer using an Omicron nebulizer which provides an aerosol of mass median aerodynamic diameter (MMAD) 4.2 µm, at an aerosol output rate of 0.087 ml/min (‘A’ value is the mean of all readings up to and including t = 120 s, ‘B’ value is the maximum reading during the test event, B – A = maximal size of aerosol event. Ordinate indicates aerosol concentration in mg/m3, the abscissa, time in seconds.
Instrumentation validation data for five experimental runs where Dusttrak-II was run alongside a nebulizer unit generating a water aerosol within a sealed Perspex enclosure of approximately 1 m3.
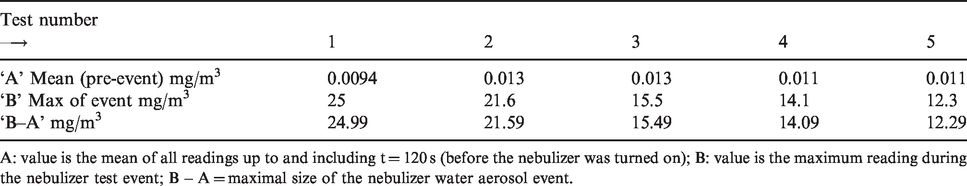
A: value is the mean of all readings up to and including t = 120 s (before the nebulizer was turned on); B: value is the maximum reading during the nebulizer test event; B – A = maximal size of the nebulizer water aerosol event.
Experimental toilet rig seeding experiments
The microbiological experiments that involved seeding a test rig toilet cistern with water spiked with Lacobacilli are presented below. Initial control experiments that aimed to evaluate the background levels of microbes (as CFU) were taken prior to seeding the toilet rig and are shown in Table 2. Only colonies which displayed L. plantarum-like colony morphology were counted in this table although other colony morphologies such as large round fungal colonies could be seen in some instances. Each of these control ‘blank’ experiments yielded consistently low counts as evidenced not only by settle plate results but also by serial dilution experiments which sampled water in the cistern (data not shown). L. plantarum-like colonies observed were most likely due to ambient Lactobacilli organisms naturally present in the environment. The background readings were higher for ‘cubicle’ experiments than those seen in ‘non- cubicle’ experiments. In the t = 0 experiments, 9 CFU/per plate were found in the ‘cubicle’ experiment for the ‘right of toilet seat’ location, whereas only 3 CFU/per plate were found in the ‘no cubicle’ experiment. Under all circumstances no growth was seen on the plate inverted over the toilet bowl, plate 6.
Control ‘blank’ experimental data showing average L. plantarum colony forming unit (CFU) numbers on MRS settle plates following flushing of toilet rig after cistern water incubation for various times with a volume of 200 ml PBS (counts taken 30 min after flush, n = 3).
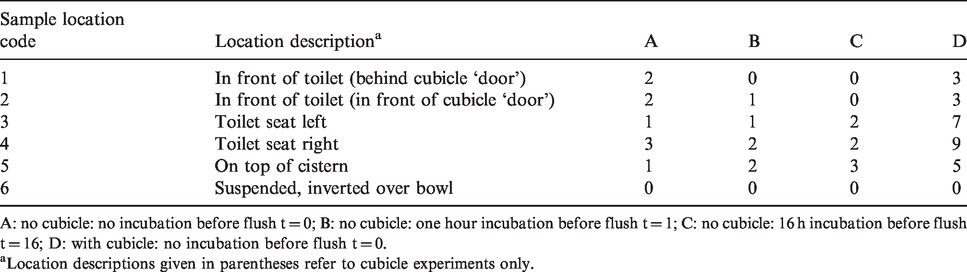
A: no cubicle: no incubation before flush t = 0; B: no cubicle: one hour incubation before flush t = 1; C: no cubicle: 16 h incubation before flush t = 16; D: with cubicle: no incubation before flush t = 0.
Location descriptions given in parentheses refer to cubicle experiments only.
Table 3 shows the number of colony forming units (CFUs) of presumptive L. plantarum on settle plates placed around a toilet after 30 min of exposure subsequent to flushing the toilet which had been previously inoculated with c.108 CFU ml−1 Lactobacilli. There was great variation among the three replicate experiments. In general, most locations sampled showed CFU counts that were above those recorded in the control experiment where no Lactobacilli were inoculated into the toilet cistern.
Test experimental data showing average L. plantarum colony forming unit (CFU) numbers on MRS sèttle plates following flushing of toilet rig after cistern water incubation for various times with a 200 ml volume of PBS containing L. plantarum (c. 108 CFU ml−1) counts taken 30 min after flush (n = 3).
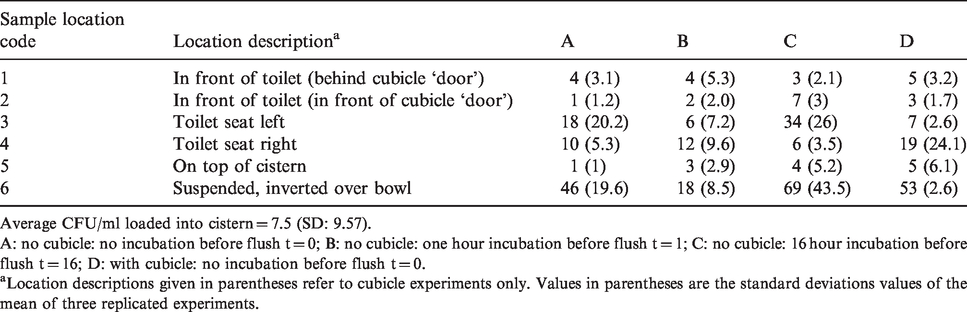
Average CFU/ml loaded into cistern = 7.5 (SD: 9.57).
A: no cubicle: no incubation before flush t = 0; B: no cubicle: one hour incubation before flush t = 1; C: no cubicle: 16 hour incubation before flush t = 16; D: with cubicle: no incubation before flush t = 0.
Location descriptions given in parentheses refer to cubicle experiments only. Values in parentheses are the standard deviations values of the mean of three replicated experiments.
Overall however, settle plates from location 6 (suspended over the toilet bowl) consistently yielded the greatest number of colonies, when compared with other locations around the toilet and the control experiments (Table 2). There was no obvious difference in numbers found inside/outside of the cubicle (within a range of 1–2 m from the front of the toilet bowl).
The counts were higher for ‘cubicle’ experiments than those recorded for ‘no cubicle’ experiments. In the t = 0 experiments, 19 CFU per plate were found in the ‘cubicle’ experiment for the ‘right of toilet seat’ location, whereas only 10 CFU per plate were found in the ‘no cubicle’ experiment.
Varying sized streaks resembling an L. plantarum lawn were seen on sample plate 6. These streaks represent innumerable amounts of bacteria and were not included as part of the count as they likely represent splashing of water onto the sample plate rather than an aerosolised Lactobacillus.
After 2 weeks of Lactobacilli experiments with the toilet rig system, a faint brown streak was noticed in the toilet bowl which proved to be difficult to remove using the cleaning protocol. To ensure that this was not indicative of contamination of the toilet bowl with L. plantarum which may have persisted from previous experiments, a swab sample was taken and plated onto MRS and LB media using a sterile cotton bud. No growth was seen on either medium even after an extended incubation period of 72 h (data not shown).
Departmental toilet positive control procedure
Qtrak and Dusttrak II monitoring of PM10 concentrations in a fully enclosed Departmental toilet cubicle under a range of experimental conditions yielded traces which are shown in Figures 3 to 5.
Initially, positive control experiments were conducted to evaluate the efficacy of the Dusttrak II at detecting ‘positive control’ water aerosols. The results of three such 1800 s experiments described earlier in an enclosed toilet cubicle are shown in Figure 3. There is a clearly evident increase step in PM10 concentration (in all three replicate experiments at the 600 s point), which coincided with the spraying of the water aerosol into the cubicle. The size of this increase varied between the three positive control experiments shown below as 1, 2 and 3.
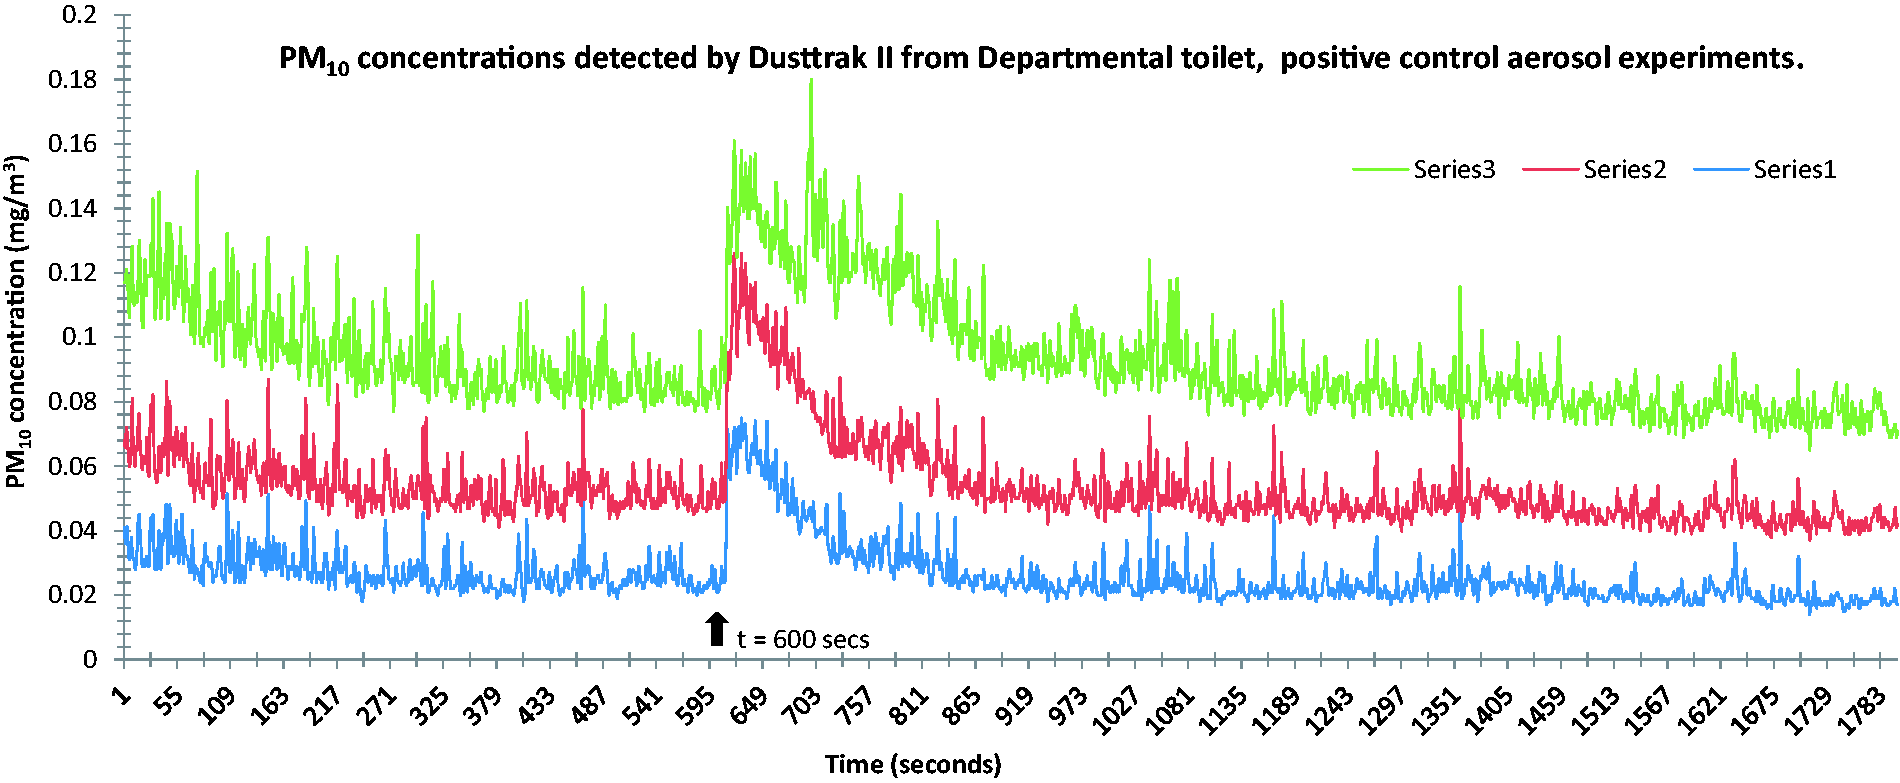
Graph showing PM10 (mg/m3) plotted against time (seconds) for three 30 min experimental runs (series 1, 2 and 3) of Dusttrak II (8531 model TSI Inc.) in which a positive control water aerosol spray was introduced into the (enclosed) test cubicle at t = 600 s (arrow). Ordinate indicates PM10 concentration in mg/m3, the abscissa, time in seconds.
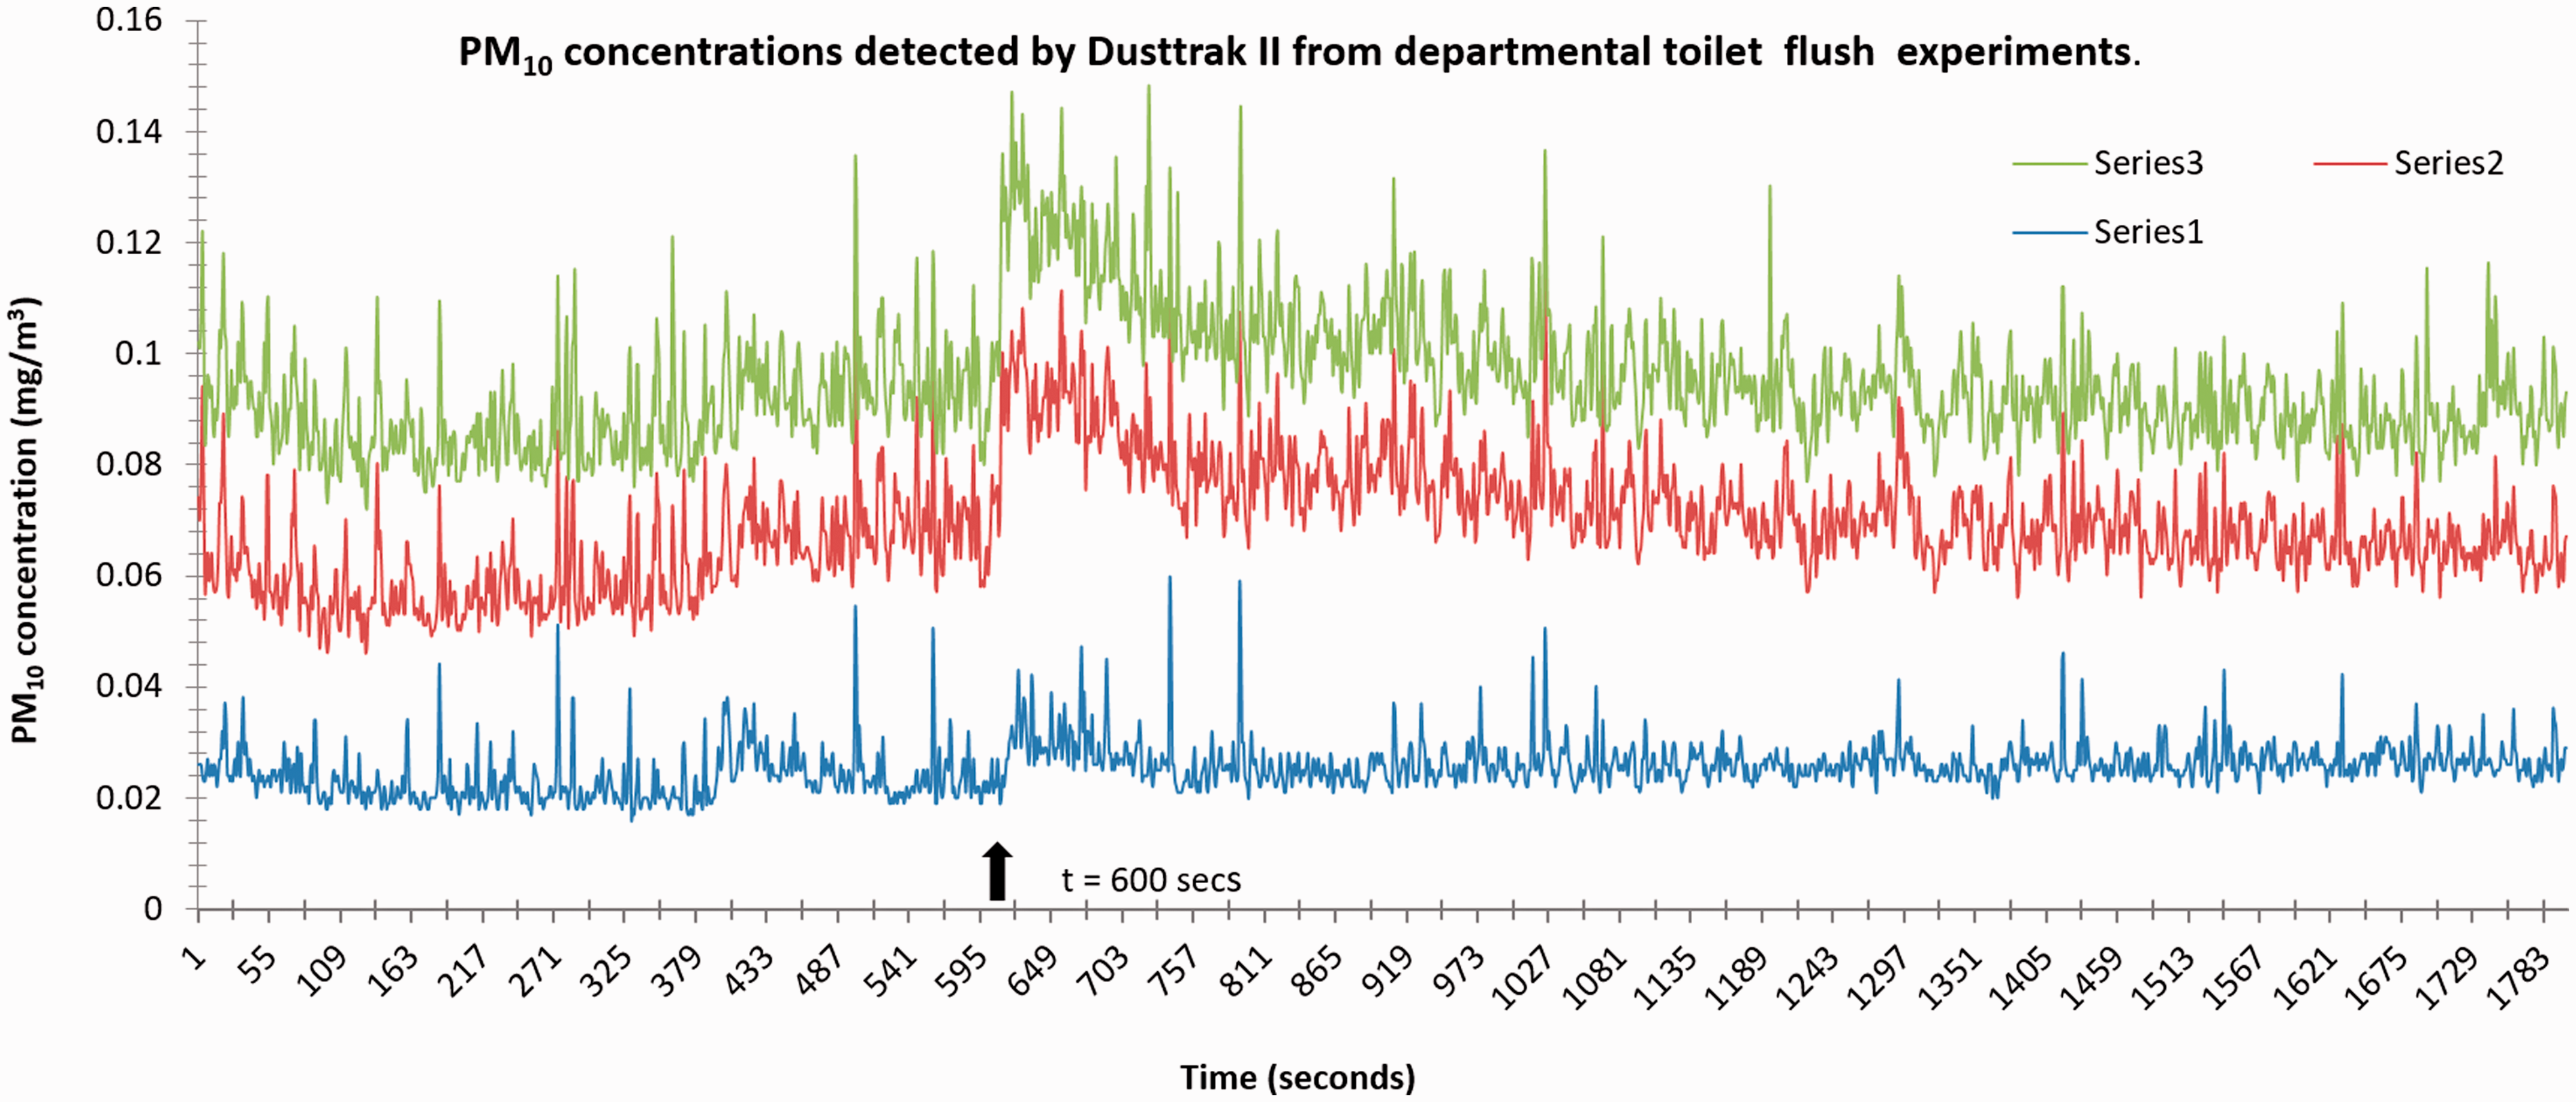
Graph showing PM10 (mg/m3) plotted against time (seconds) for three 30 min experimental runs of (series 1, 2 and 3) Dusttrak II (8531 model TSI Inc.) in which the toilet (enclosed cubicle) was flushed at t = 600 s (arrow). Ordinate indicates PM10 concentration in mg/m3, the abscissa, time in seconds.
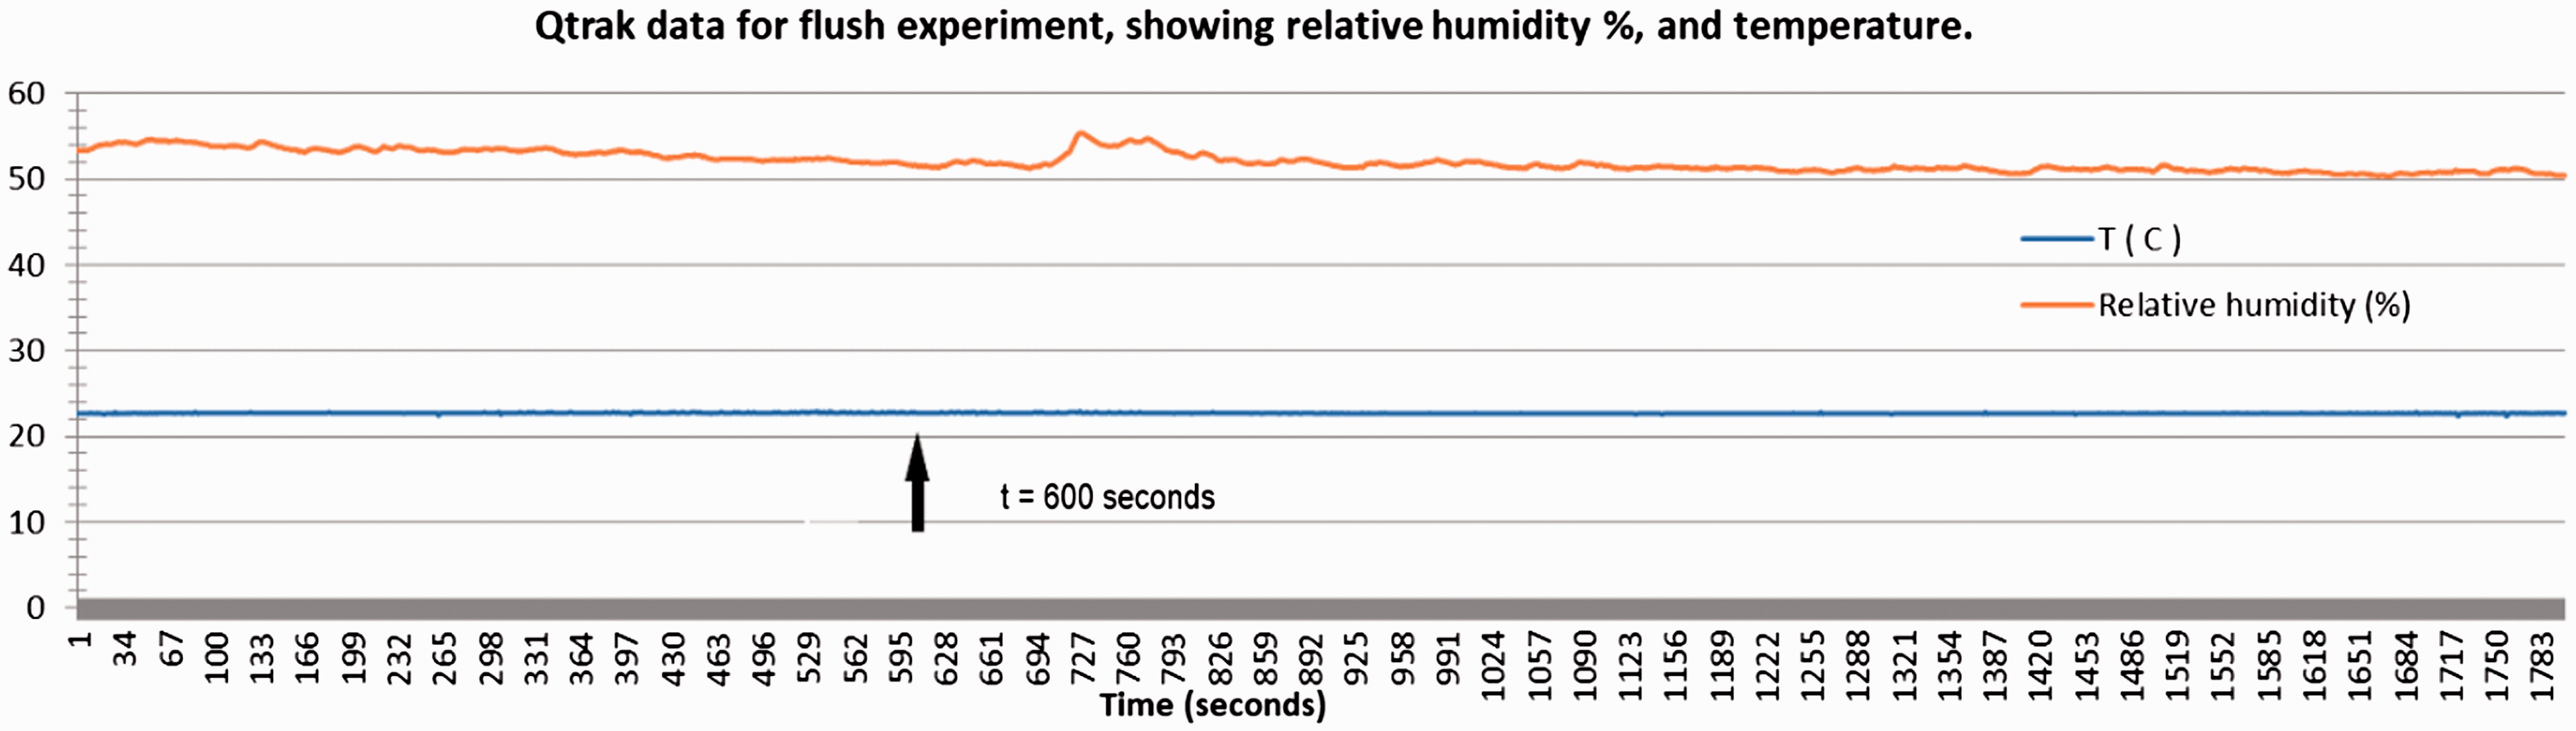
Graph showing relative humidity and temperature plotted against time (seconds) for experimental run of Qtrak (7565 model TSI Inc.) in which the toilet (enclosed cubicle) was flushed at t = 600 s (arrow). Ordinate indicates temperature in degree Celsius and % relative humidly, the abscissa. Time in seconds.
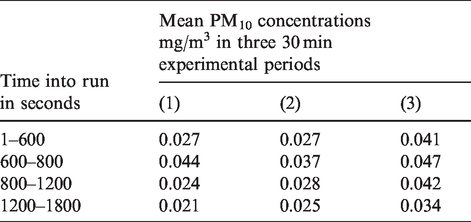
Table 4 shows how for all three experimental run periods (series 1, 2 and 3), there was an increase in mean PM10 concentrations of c.0.01 mg/m3 in the 200 s immediately ‘post spray’.
Departmental toilet, Positive control experiments showing mean PM10 concentrations at various times over three 30 min periods. Aerosol spray event was at t = 600 s.
Having shown the efficacy of Dusttrak II’s ability to detect aerosol droplets in the required size range with this ‘positive control’, experiments were continued to evaluate if a similar trace could be achieved which would indicate the detection of a departmental toilet flush event.
Departmental toilet experimental flush measurement procedures
This commonplace activity, obviously involves the voiding at force of up to 10 dm3 of water from a contained cistern down to and around the edges of a toilet bowl.
Figure 4 shows a fairly constant trace for an enclosed cubicle over a period of 1800 s, with average PM10 counts of 0.0165 mg/m3 (where replicate experiment number was 3).
Values of 0.0135 mg/m3 were collected before the flush was made and apparently, at the flush-point (at 600 s) there was a steep increase to just under 0.0225 mg/m3. This represents an increase in PM10 levels of c. 0.01 mg/m3. Spikes such as this were recorded for four out of five flush experiments conducted in this study.
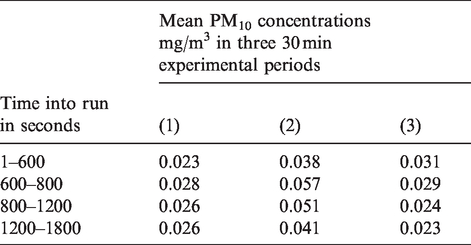
Table 5 shows mean increases in PM10 concentrations in two out of the three runs recorded with the departmental flush event experiments.
Departmental toilet flush event experiments showing mean PM10 concentrations at various times over three 30 min periods. Flush event was at t = 600 s.
The Qtrak data collected throughout this experiment (Figure 5) also showed fairly constant values for temperature and relative humidity, with relative humidity varying from 50 to 60% over the monitoring period, and with the main increase in this decade occurring around 700 s (thus occurring just after the flush-point at which it would be logical to perceive an increase).
Data for un-enclosed cubicles are not shown as no ‘flush-associated’ PM10 increases were observed in these experiments. Entry and egress of the operator (negative control experiments) throughout all the experiments conducted did not have any effect on PM10 levels in either enclosed or non-enclosed cubicles (data not shown).
The detection of Legionella spp. in rainwater harvesting tanks
Legionella were successfully isolated from three of four sample locations (Table 6). In late winter, Test site 1 yielded positive results upon plating on specific media indicating an average of 3933 CFU/dm3. A similar result was recorded again for test site 1 in late spring where 3600 CFU/dm3 Legionella spp. were identified. Samples taken from test site 2 showed no Legionella whereas Legionella was identified at sites 3 and 4 and when PCR protocols were implemented (Table 7), these were identified as species of Legionella pneumophilia.
Presumptive and confirmed Legionella counts detected according to method a LBP50.9 in 1 dm3 of water sampled from four RWH tank test sites between 17 February 2010 and 19 June 2010.
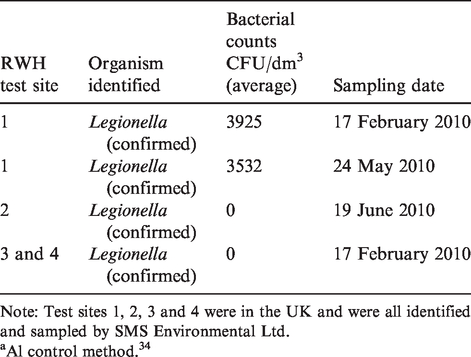
Note: Test sites 1, 2, 3 and 4 were in the UK and were all identified and sampled by SMS Environmental Ltd.
Al control method. 34
Legionella detected according to PCR method a BP50.24.1 in 1 dm3 of water sampled from RWH tank test sites 3 and 4 on 17 February 2010.
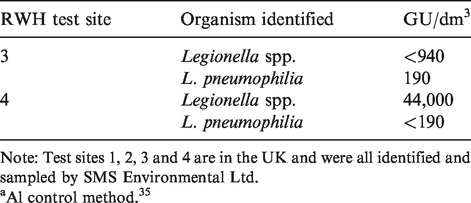
Note: Test sites 1, 2, 3 and 4 are in the UK and were all identified and sampled by SMS Environmental Ltd.
Al control method. 35
Risk assessment calculations for departmental toilet positive control and flush experiments
Aerosol formation was shown to be highest in the departmental toilet positive control experiments and with a range of 0.046–0.059 mg/h for an ‘average’ individual, where an average adult breathing rate is assumed to be 1.25/m3/h 36 (calculated thus with data from Table 4 t = 600; 0.037 × 1.25 = 0.046 and 0.047 × 1.25 = 0.059).
Aerosol formation in departmental toilet flush experiments were measured and calculated to be within the range 0.035–0.071 mg/h according to similar calculations (calculated with data from Table 5 t = 600; 0.028 × 1.25 = 0.035 and 0.057 × 1.25 = 0.071).
Given that the highest level of Legionella bacteria detected from RWHs during the project was 3925 CFU/L (3.925 CFU/ml) and considering the largest aerosol measured from a toilet flush in the experiments measured here, this would equate to a ‘worst case’ estimated inhalation of 0.0003 CFU/h for an ‘average’ individual. (0.071 mg/h equates to 0.000071 ml/h ×3.925 CFU/ml = 0.0003 CFU/h and for the lower aerosol measurement 0.035 mg/h equates to 0.000035 ml/h × 3.925 CFU/ml = 0.00014 CFU/h).
Allowing an additional safety factor of 10 to account for any discrepancy in estimates due to the Dusttrak II instrument (Dusttrak II Instrument validation section), this would mean that the individual would need to inhale aerosols for around 300–1000 h to take in one CFU of Legionella bacteria (0.003 CFU/h × 300 h = 0.9 CFU and 0.0014 CFU/h ×1000 h = 1.4 CFU).
Discussion
This study sought to establish: if RWH systems harbour Legionella and whether the toilets to which they could be linked, are capable of generating an aerosol – of the correct droplet size range capable of encapsulating cells and potentially causing LD.
Particulate matter detection (Dusttrak II) detection of PM10 water aerosols
The initial results shown in Figures 3 and 4 and Tables 4 and 5 provide a clear indication that the Dusttrak II instrument employed in this study was capable of detecting PM10 concentrations generated in the form of water aerosol droplets from both a water spray and a toilet flush event in an enclosed cubicle. Even though the magnitude of the ‘spikes’ shown for each type of event differed, the average PM10 concentrations immediately after the spray or flush showed increases of c. 0.01 mg/m3 (aerosols were seldom detected in partially exposed cubicles (data not shown)). These results clearly demonstrate that particle matter detectors such as the Dusttrak II are capable of detecting water aerosols in the PM
Experimental toilet rig cistern inoculation experiments
The detection of Lactobacillus around the experimental toilet rig toilet attests to the journey the microbes have taken from the cistern to the experimental toilet rig cubicle and verifies that cistern-loaded microbes are ejected via toilet flushing. The rationale for inoculating the cistern rather than the toilet bowl in the experiments presented here was that it would more closely resemble a toilet system charged with Legionella-contaminated rainwater. The various timings observed in these experiments (t = 0, t = 1 and t = 16 h) between inoculating the toilets and the flush were chosen to reflect actual use whereby a toilet could be flushed as soon as it is charged or left for an hour or left overnight before flushing. The low levels of detection shown throughout these experiments may reflect the relatively low number of organisms present in the water discharged from the cistern where the average loading was only 7.5 CFU/ml. Alternatively it may be attributable to inconsistent distribution of the L. plantarum inoculum upon flushing or the varied hydrodynamics of each flush (as demonstrated by Barker and Jones 17 in a similar set of experiments).
In each L. plantarum test experiment a large number of CFUs were seen on the plate 6, which was suspended inverted over the toilet bowl. This plate (6) was always seen to be void of CFUs in control experiments, where PBS was the only inoculum.
Perhaps non-test ‘contaminant organisms’ which may be capable of growing on the MRS media were unable to reach this awkwardly placed plate and therefore could not colonise it by normal settling action.
Another peculiarity observed on these plates was the variation of CFU morphology throughout the experiments. On all the other plates evaluated in this study, in both serial dilution experiments (data not shown) and settle plates, the L. plantarum colonies observed were small round shiny and white. Colony morphology on sample plate 6 however sometimes appeared as a white streak of what was presumably a lawn of L. plantarum from which individual colonies could not be distinguished. These streaks might have arisen due to splashing of the plate as the cistern water was discharged into the bowl. The pattern and shape of these splashes were largely inconsistent and might be attributable to the inconsistencies of the toilet flush in general as was observed in the Dusttrak II experiments. Alternatively, it may be attributable to a minute change in the position of the plate location between experiments despite strict efforts to keep this position consistent throughout. The appearance of these lawns which would contain an innumerable amount of CFUs, has led to colony count estimates which are likely to be underestimated. This may be especially true for plates where these streaks frequently occurred.
Non-Lactobacilli contaminants?
Fungal and bacterial co-contamination of plates was observed on a number of settle plates throughout these experiments. While these fungal colonies were not included in the counts, their presence may have inhibited the growth of L. plantarum colonies. Perhaps the addition of a suitable fungicide such as dichlofluanid (which L. plantarum has been noted to completely degrade 37 ) may reduce or even eliminate the occurrence of fungal contamination and allow for greater recovery of L. plantarum or other indicator organisms and therefore provide a more accurate representation of L. plantarum levels post-flush.
The occurrence of a brown stain on the toilet bowl during the course of experiments was evaluated. Swab tests indicated that the stain was more likely to be a chemical effect rather than an indication of L. plantarum persistence, as no colonies were seen when a swab of the stain was plated onto MRS or non-selective media.
Legionella detection in RWH tanks
Legionella were successfully detected in one of RWH tank sites sampled in both February and May (site 1). While it may be expected that Legionella would be more likely obtained in the warmer summer months, the RWH tank was noted to have a low sampling temperature of 16°C. Legionella are known to survive at this temperature however it is not within the favourable range of the organism and therefore may not have been able to thrive in the conditions of this particular tank. Unfortunately the temperature of sample water from sample site 1 is unavailable so a meaningful comparison cannot be made between it and the other sample sites. It might be possible however, that samples taken from sample sites 1, 3 and 4 were representative of RWH systems which had yet to come online and thus were not undergoing stringent maintenance, while the RWH tank at sample site 2 underwent proper maintenance and monitoring. 3 If this was the case then it would highlight the significance and importance of proper maintenance on tanks to reduce the risk of human infection.
The two methods of determining Legionella numbers presented in this study illustrated differing sensitivities. Legionella was only detected in tanks 3 and 4 using the more sensitive PCR methodology. A MALDI-TOF mass spectrometry approach to Legionella identification has become more generally available since this study was completed and could be useful for determinations in future studies. It would be beneficial in future studies to increase the number of sampling sites tested and to increase the frequency of sampling.
Future studies
A number of variations of the experiments may also be carried out in future. For example, the effects of sequential flushing were not explored in these experiments as they were in previous studies.17,22 Barker et al. 17 demonstrated that sequential flushes lead to an exponential decrease in the number of bacteria expelled after each flush whilst the length of time they persist in the air is prolonged. In toilets continuously charged with harvested rain water, it stands to reason that this exponential decrease of bacteria numbers might not be observed and it is also possible that sequential flushes will allow greater numbers of bacteria (be they Legionella or otherwise) to persist in the air.
The height at which the Dusttrak II was operated could also be investigated in future experiments. In this study the instrument was 0.3 m above the toilet bowl which is perhaps more representative of a child’s height than that of an adult. This may have baring on the risk assessment calculations in future experiments. It may be useful to measure aerosols at various heights and positions around a toilet cubicle and remodel risk assessments accordingly.
A variation of the cistern loading experiments involving inoculating both the cistern and toilet bowl with a test organism may be useful in order to better represent a toilet which has been routinely used. It is possible that following a flush, bacteria not expelled into the air might be retained or settle back into the bowl and affect subsequent bacterial counts.
Another aspect which should also be considered is the ability of Legionella to incorporate itself into a biofilm community. One study investigated the composition of biofilm communities under the rims of toilets where biofilms are known to frequently occur was examined. 22 While Legionella were not found in that particular study it was indicated that the number and type of toilet sampled was limited and thus not representative of all toilets. Perhaps were another similar study extended to toilets supplied with harvested rainwater Legionella biofilms which include Legionella as part of their community might be found, particularly within cisterns. This could provide yet another niche for the organisms to persist within a toilet system.
It may be more appropriate to use the PM2.5 filter for future experiments however, as aerosols up to 2.5 µm are more likely to permeate into the lungs. A smaller filter may also have eliminated/reduced the background ‘noise’ seen in these experiments.
Risk assessment for contracting Legionnaire's disease from a toilet fed by an RWH
A risk assessment considering the data collected in this study for a cubicle toilet fed by a RWH system could be as follows:
The cohort of toilet users is largely undefined as to its susceptibility for acquiring LD. In addition, the risk factors for developing community acquired LD are as yet undefined. As a ‘worst-case’ scenario, it has therefore been assumed that the cohort of users will contain some susceptible individuals.
Although no definitive threshold infective dose for Legionella bacteria in humans has been determined to date38,39 in the EU it has been suggested that a threshold concentration of 103 CFU/L should be considered for minimal risk of infection, with levels of 104–105 CFU/dm3 being associated with a higher risk. 31
The highest level of Legionella determined in a RWH system was 3925 CFU/dm3, giving a margin of safety of 2.5 times for the lowest and 255 times for the highest threshold concentration currently being proposed.
Conclusion
The experiments presented here have demonstrated the variable presence of Legionella in RWH tanks. The methodology for Legionella detection may account for this variability with a PCR method giving increased sensitivity and thus inferring higher contamination rates than the culture method, but the frequency with which RWH tanks are cleaned and maintained could also, logically, influence the Legionella concentrations found.
The Dusttrak II Particle detection equipment used in this study is routinely deployed for the detection of particulates, but both positive control spray experiments and toilet cubicle experiments presented here have shown the instrument capable of the detection of sprayed water aerosols. This research has also demonstrated the capability of a particle matter detector (Dusttrak II) to detect water aerosols (PM10) associated with toilet flushes. It has also been shown that these toilet flush associated aerosols may harbour viable bacteria as demonstrated by the experimental toilet rig experiments where Lactobacillus plantarum cells inoculated into the toilet cistern were detected on culture plates placed around the toilet cubicle. As Legionella is also a bacterium, by inference, there must be a risk associated with toilets fed with water from RWH tanks infected with Legionella.
While there are a number of parameters and variations of this study which are yet to be explored, current data suggest that the risk of infection from RWH-fed toilets is very low but could be further improved with regular RWH tank maintenance.
Footnotes
Author's’ contribution
The experimental work and first draft of this article was completed by Rory McLoughlin, as part of MSc studies at Cranfield University under the supervision of Judith Taylor and David Aldred. Risk assessments were calculated by Ruth Bevan. All modifications and subsequent drafts were completed by the corresponding author with the support of The Open University Graduate School.
Declaration of conflicting interests
The author(s) declared no potential conflicts of interest with respect to the research, authorship, and/or publication of this article.
Funding
The author(s) disclosed receipt of the following financial support for the research, authorship, and/or publication of this article: The authors gratefully acknowledge the financial support of Cranfield University and SMS Environmental Ltd for the completion of this experimental work.