
Abstract
The promotion of ‘Green Transport’ has increased the importance of urban rail transit in China. Increased passenger flow and longer travel time have led to increased attention to in-carriage air quality in trains. In this study, CO2 and PM2.5 monitoring were conducted in subway train carriages in a city in northern China. The study accounts for a variety of factors both inside and outside of the train carriages, such as passenger volume and exterior environment. The results reveal that good air quality outside of the train, an above ground location and the use of platform screen doors could aid in the attainment of acceptable PM2.5 concentrations. In addition, linear models of CO2 and PM2.5 concentrations were established based on passenger density. The nonlinear recursive models were constructed using time-series analysis to reflect the cumulative effects of the amounts of CO2 and PM2.5. The spatial and temporal distributions show that, given a constant passenger density, the PM2.5 concentration is higher near the door area than in the seating area. CO2 concentrations varied in three stages, consistent with the change of local passenger load. Finally, a real-time optimized control method for fresh air volume and some suggestions are proposed to improve the in-carriage air quality of subway trains.
Introduction
Under continued growth and development, urban rail transit becomes the backbone of urban transportation. 1 With average subway travel time exceeding 70 min, 2 passengers spend considerable amounts of time inside train carriages and maintaining good in-carriage air quality in trains is therefore important. Characterized by a lack of natural ventilation, significant passenger loads and a failure to dilute air pollutants, the subway environment has the capacity to easily distribute disease vectors. Thus, compared with other transport modes, subways may severely affect passenger health. 3 Therefore, understanding variability in and factors influencing pollutant concentrations in carriages is crucial to develop mitigation measures that could protect passengers.
The carbon dioxide (CO2) concentration is often used as a determinant of indoor air quality (IAQ). 4 CO2 concentration is also used as an evaluation index for harmful substances inside of train carriages. 5 PM2.5 was not considered in early studies, but it is receiving more attention. Especially in China, the concentration of PM2.5 often exceeds the standard value, and it has become a routine monitoring index. At present, PM2.5 pollution is a serious and widespread problem in many Chinese cities. Excessive exposure to elevated PM2.5 concentrations may contribute to cardiovascular and respiratory diseases and even death. 6 Significant concentrations of PM2.5 and CO2 have been found in station halls, platforms and train carriages,7,8 where fresh air is limited. Pollution in train carriages, and its effect on health, should be of worldwide concern.9–11
Current research on air quality in urban rail transit focuses on two aspects: (1) the sources and chemical components of pollution and (2) platform pollutant concentrations. Air conditioning-related substances, secondary pollution and train pistons have been found to affect air quality on subway platforms. 12 When the subway is in service, large volumes of metal particles are produced. Subway particles are approximately eight times more genotoxic and four times more likely to cause oxidative stress in the lung cells than particles from a busy urban street. 13 Subway commuters inhale elevated amounts of iron (200%), manganese (60%) and copper (40%) in PM2.5 in comparison to commuters immersed in road traffic. 14 This in-carriage pollution is a significant problem and should be addressed.
Regarding the second aspect of urban rail transit research, platform pollutant concentrations, recent research has reported that PM2.5 variations on platforms are strongly governed by passing trains, tunnel ventilation, the train piston effect, platform screen doors (PSDs) and the type of underground platform. Other studies have compared PM2.5 concentrations between platforms in ground-level and below-ground stations 15 and between bus and metro microenvironments (as measured at the platform). 16 However, few studies have been conducted on in-train pollution, and those studies that do exist feature evident inadequacies. For instance, Xu et al. 17 investigated PM2.5 and CO2 levels in subway carriages as the trains travelled from below to above ground and from urban to suburban areas but lacked systematic analysis of the distribution and factors influencing pollutants in the carriages. Furthermore, current codes and standards, such as the Code for the Design of Metros, 18 specify concentration limits for CO2 and PM10 only in station halls and platforms and do not mention CO2 or PM2.5 inside the train carriages.
This study addresses the current knowledge gaps regarding the distribution and factors influencing in-carriage pollution, providing a rigorous basis for pollutant control and air quality improvement.
Data collection
Sampling equipment
The standards/specifications always consider the limit of a pollutant in terms of the average concentration for a long time. Such continuous long-term sampling may not reflect real-time concentration fluctuations. For example, the Ambient Air Quality Standards 19 stipulates that the 24 h mean concentration of PM2.5 in residential areas and public transport remains at or below 75 μg/m3, and the Indoor Air Quality Standard 20 prescribes a 24 h mean CO2 concentration at or below 0.1% for acceptable air quality. Fortunately, rapid technological developments in portable air pollution monitors can help to resolve this lack of temporal resolution. Portable monitors, which can provide real-time data, enable the measurement of concentrations closer to or at the point of human contact with pollution, and, therefore, produce more information relevant to exposure assessment. In this study, we used two portable monitors to examine short-term fluctuations in PM2.5 and CO2 concentrations. The PM2.5 concentration was measured with a portable particle detector (Model DT-9881M, CEM Instruments, India; Figure 1(a)). In this instrument, particles in the sampled air produce scattered light corresponding to their physical sizes, which is received by a photoelectric converter and converted into an electrical signal. Then, a data processor separates the particles from the electrical signals and calculates the mass concentration by a microprocessor. This particle detector can measure particle concentrations of 0–2000 μg/m3, with a resolution of 1 μg/m3 and a measurement error of 5%. The default flow rate, which is controlled by a built-in sensor, is 0.1698 m3/h (2.83 L/min).
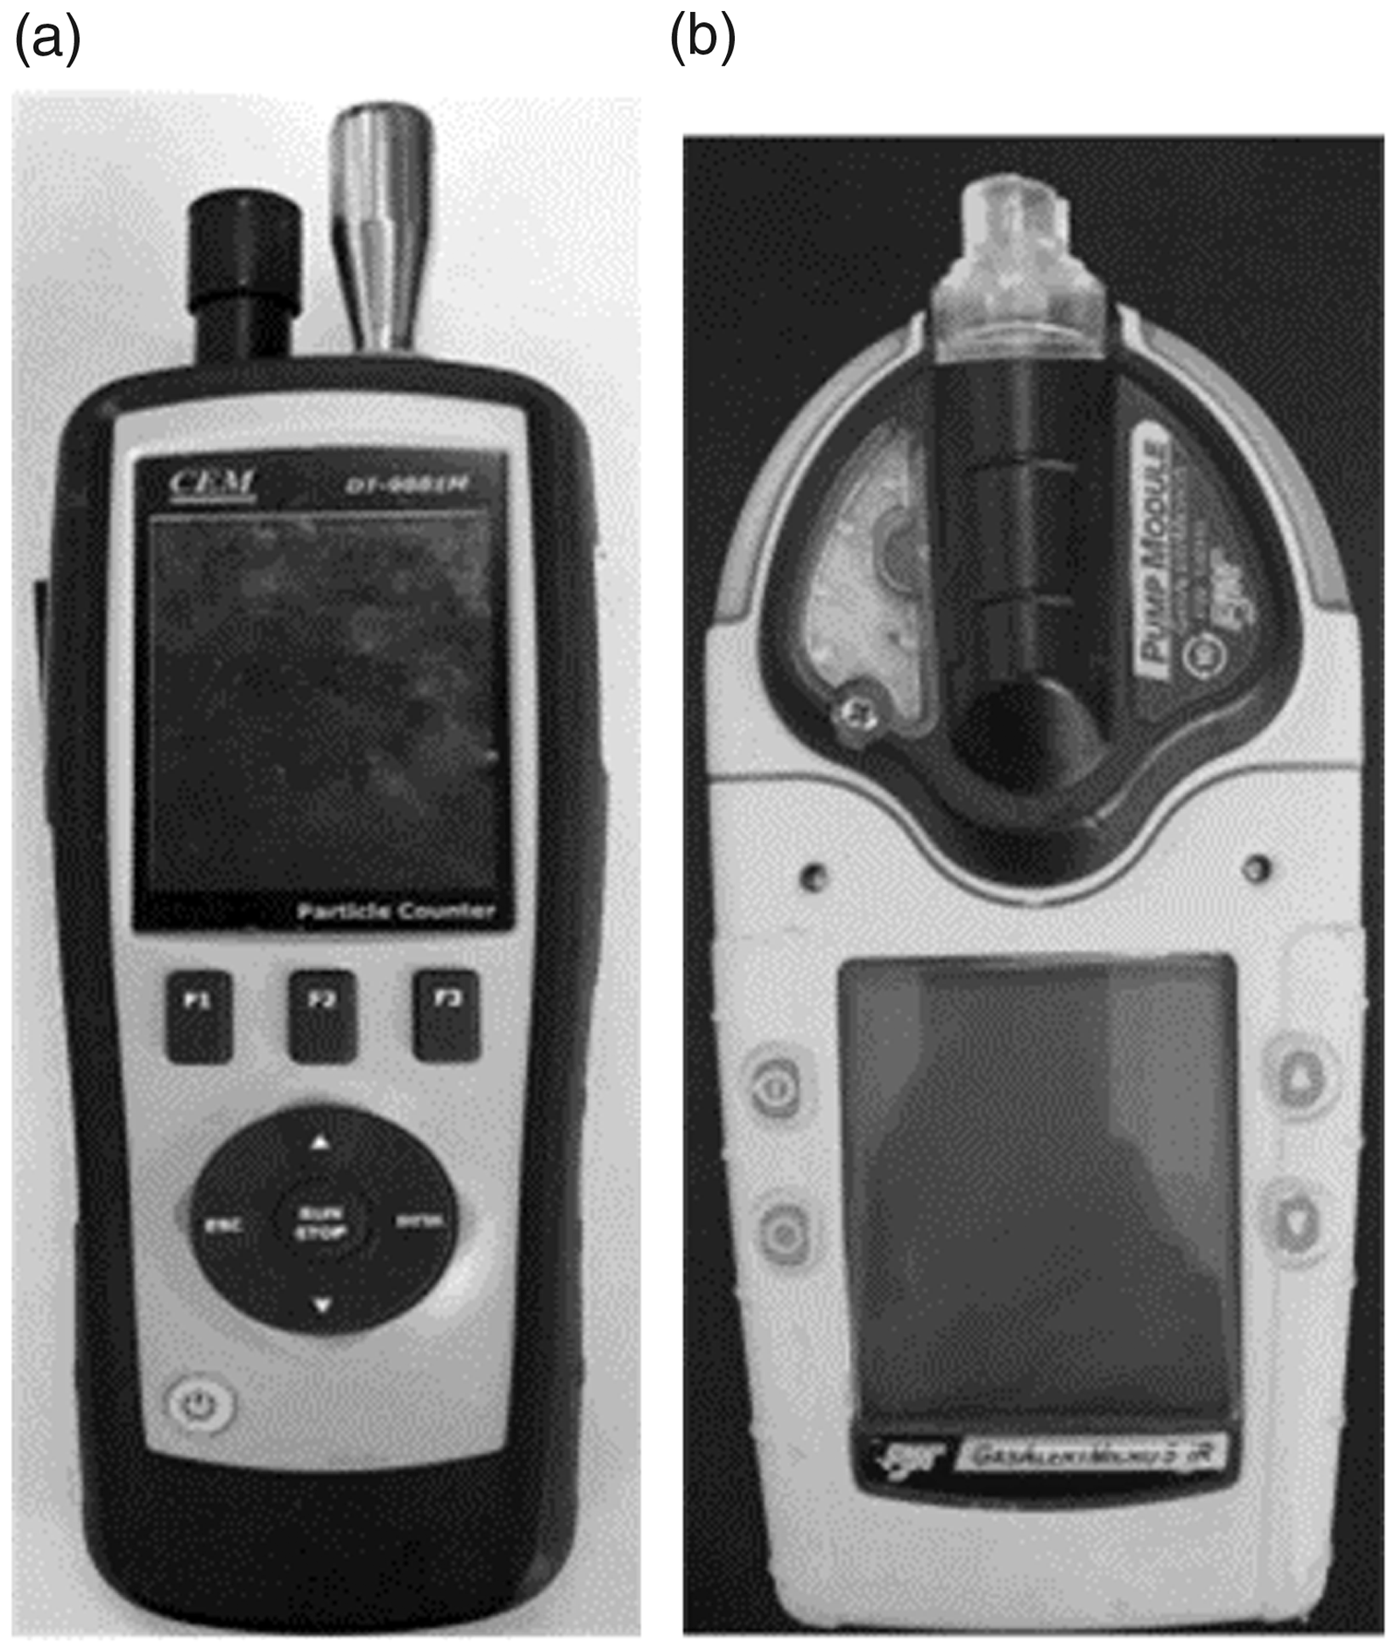
(a) DT-9881M particle detector; (b) portable composite gas detector (type M5).
CO2 measurements were conducted with a composite gas detector (Model Gas Alert Micro 5 IR, BW Technologies, Canada; Figure 1(b)), which features a measurement range of 0–5000 ppm and a detection limit of 150 ppm. This instrument can measure and display real-time concentrations of CO2, CO, O2 and H2S, as well as temperature and humidity. This instrument measures CO2 by infrared detection using the Beer-Lambert Law and the selective absorption of infrared radiation by CO2. Both instruments were calibrated prior to use, undergoing self-correction, zero calibration and the gas detectors were terminally calibrated by gas cylinders.
Measurement procedures
CO2 and PM2.5 concentrations are generally higher during the morning and evening rush hours because of the increased passenger flow. 21 The in-train environment is of greater concern during rush hour than at other times. Therefore, all the samples were therefore collected on weekdays during peak hours (7:00–9:00 and 17:00–19:00).
Due to locations of staircases and elevators, passengers were distributed unevenly in the train. Generally, there were fewer passengers in the first and last carriages, and a large passenger density in several carriages in the middle of the train. In order to make the measurement results as representative as possible, the researchers boarded the train at the second entrance of the third carriage in the direction of travel, where there is always a large passenger density. The researchers stood in a carriage as passengers, travelling from the first station to the terminal station. Samples were taken in areas designated in Figure 2. Researchers A and C recorded CO2 concentrations and researchers B and D recorded PM2.5 concentrations. Measurements were taken while the train was stopped at the station (Phase I) and during travel through the sections (Phase II). The sampling time was set as 30 s and the average value would be recorded for every 30 s. The number of readings would be determined on the duration of the phases. In most cases, there would be two or three readings for Phase I and four to six readings for Phase II. Data recorded within the same phase compose a sample group. The instruments were positioned within the breathing zone at a height of 1.2–1.5 m from the carriage floor. There was no obvious air movement in the carriage. During the measurement, the researchers would count and record the number of passengers in each area. The passenger density would be calculated by the number of passengers and the area of effective standing regions in the trains. Relevant information, such as temperature, humidity and vehicle size were recorded concurrently.
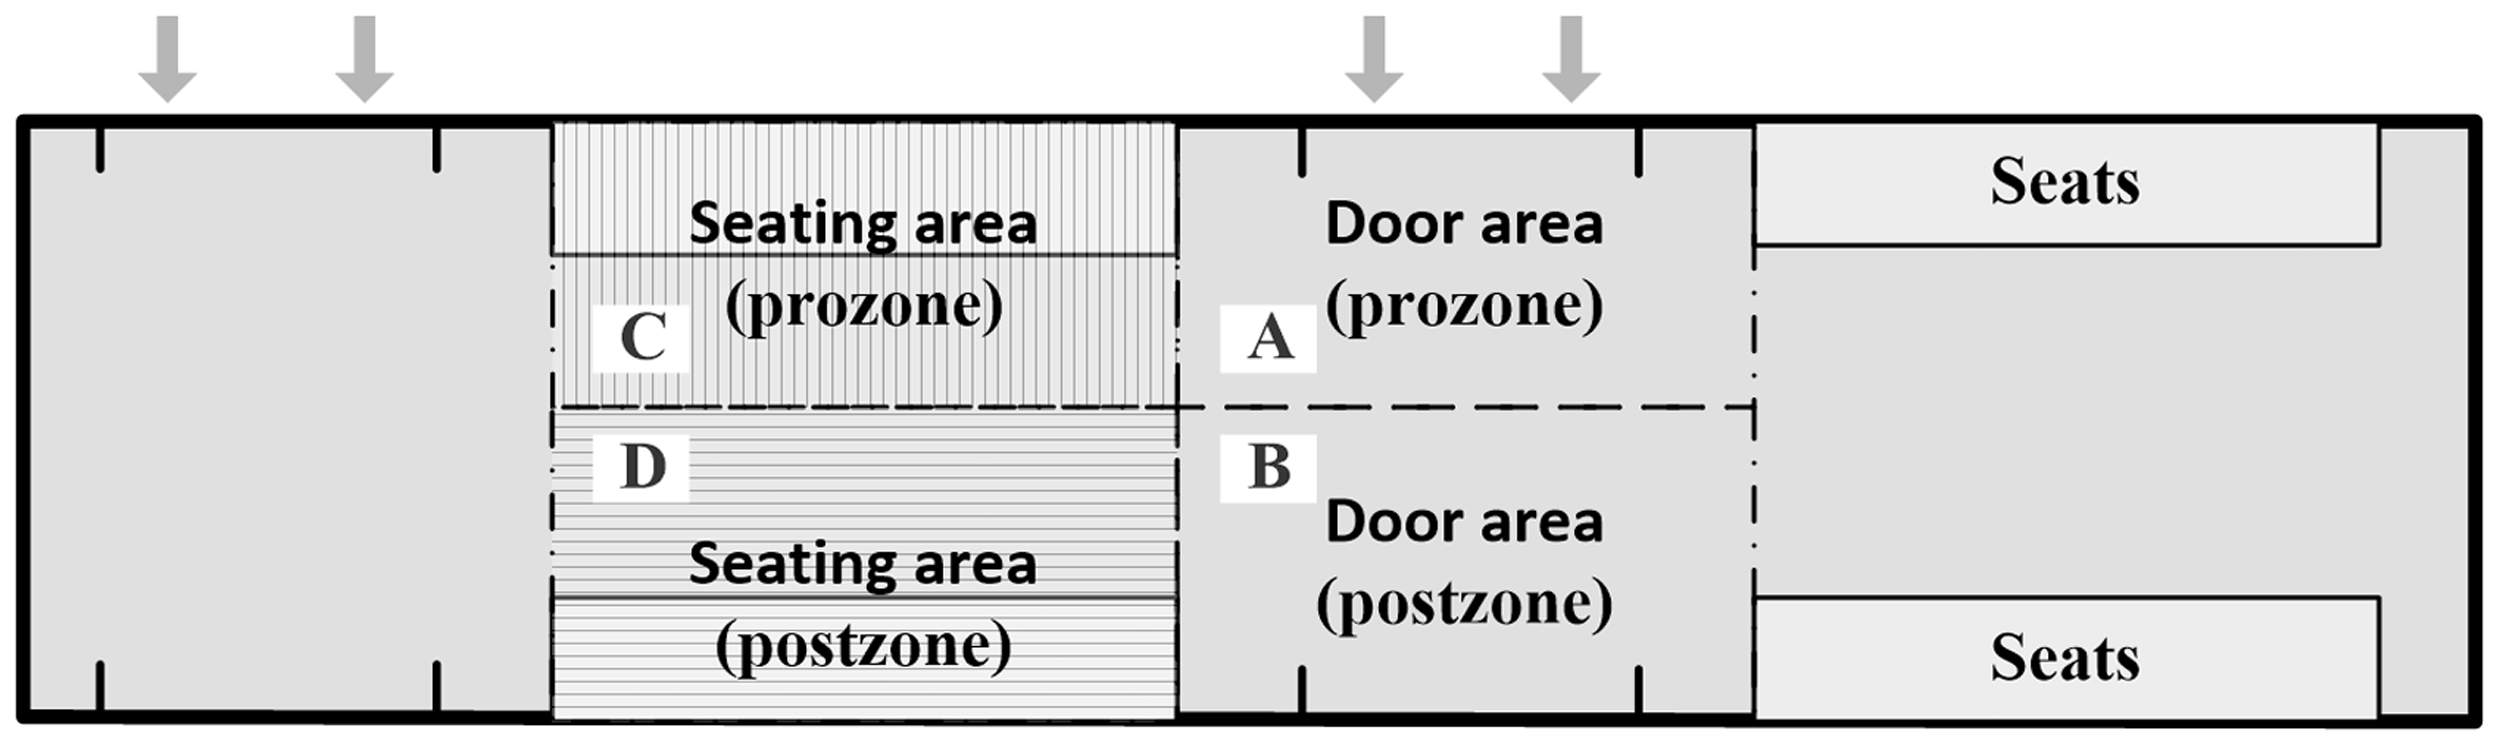
The division of the carriage area and the distribution of the researchers within the carriage.
The dependent variables include the in-carriage CO2 and PM2.5 concentrations, while the independent variables include the in-carriage passenger density, temperature, humidity, air quality outside of the train, route placement (i.e. above ground or underground) and presence of a PSD. The spatial and temporal factors include the area within the carriage, position of the train, peak hour and travel direction.
Study locations
The measurements were carried out in a subway system in a city in northern China. There are 10 subway lines in the metropolitan zone. We took measurements on four routes (Red, Orange, Blue and Yellow lines) from 23 June to 11 July 2014. These four routes play important roles in the wider network and feature high traffic during rush hours (carrying 54% of the network passenger traffic). The measurements covered 110 stations (44% of the 251 stations) and 172 km of the route (46% of the 379 km network). The Yellow Line is above ground, while the other three lines are underground.
Results
Descriptive analysis
We collected 3528 sample groups of in-carriage CO2 and PM2.5 concentrations. The concentration of CO2 ranged between 650 and 5525 ppm. The PM2.5 concentration varied between 10 and 563 μg/m3. Figure 3 shows Kernel density plots of in-carriage CO2 and PM2.5 concentrations. In most cases, the concentrations of pollutant represent the positively skew distribution. The CO2 concentration of Orange Line is the lowest and the Red Line is the highest. The PM2.5 concentration of the Yellow Line is obviously smaller than that of the other lines.
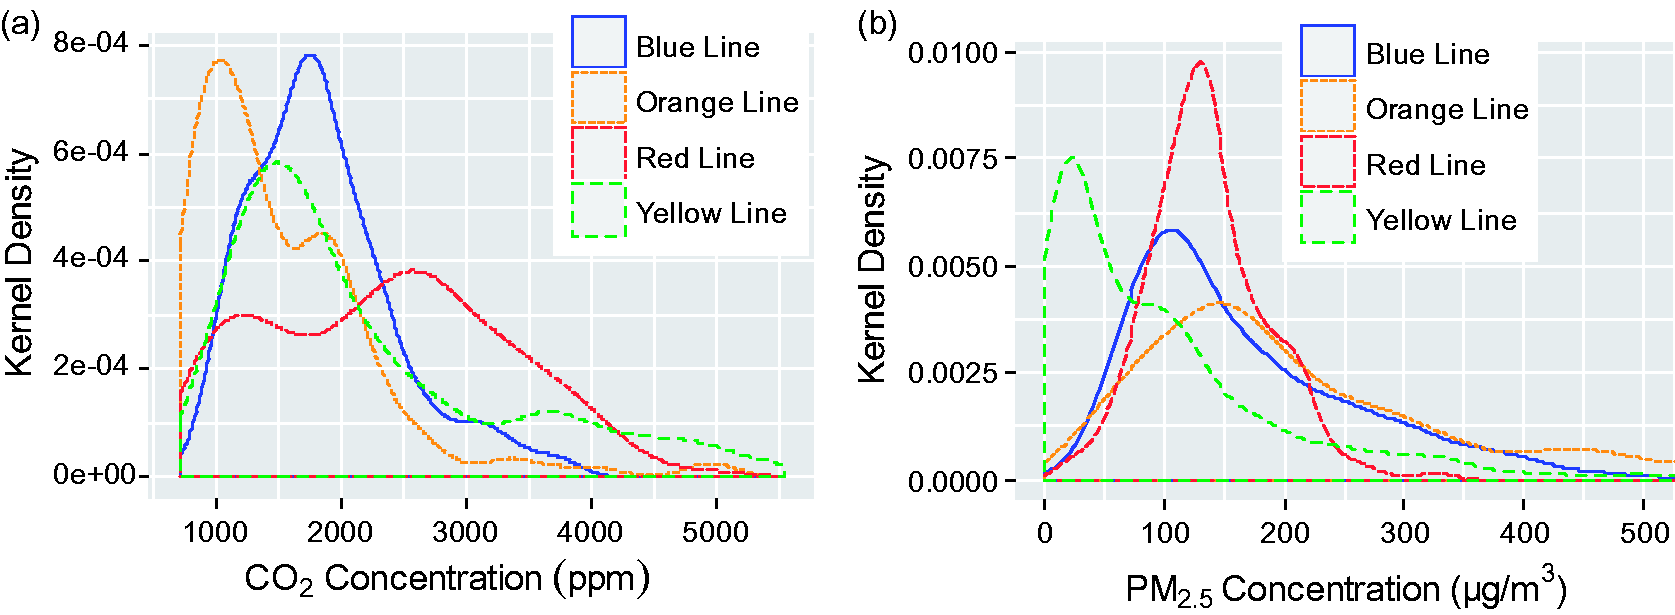
Measurement results of in-carriage (a) CO2 and (b) PM2.5 concentrations.
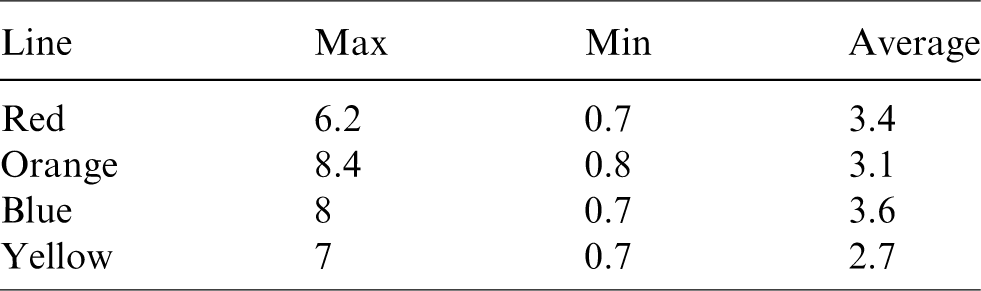
The passenger densities measured in the carriages are shown in Table 1. The subway had heavy traffic during peak hours. The maximum density observed was 8.4 person/m2.
Passenger density statistics (p/m2).
Because the mass concentration of particulate matter is related to humidity and the thermal motion of particulate matter is affected by temperature, humidity and temperature were measured inside the train carriage. The average temperature was 26.3°C and the average humidity was 57.5%. The results indicate that these two variables were quite stable, fluctuating over a narrow range around the average value. Thus, these two variables were excluded from the subsequent analyses.
Air quality
In environmental monitoring in China, PM2.5 is divided into six levels according to the 24 h mean concentration. 22 The air pollution threshold is 75 μg/m3, which was derived from the 24 h mean of Interim Target 1, as proposed by the World Health Organization (WHO). 23 When the PM2.5 concentration is less than this value, there is less pollution and the air quality is good to excellent, while concentrations above this threshold indicate mild, moderate, heavy or severe pollution, as shown in Table 2. To keep a consistence, we divide CO2 concentrations into six levels as well. The ideal long-term indoor exposure threshold for humans is 1800 mg/m3 (916 ppm), 24 while ideal thresholds include 2160 mg/m3 (1100 ppm) for short-term exposure, 2700 mg/m3 (1375 ppm) for indoor public places, 25 4356 mg/m3 (2218 ppm) for asthma patients 26 and 6300 mg/m3 (3207 ppm) for long-term exposure. 27
Air quality levels in terms of PM2.5 and CO2.
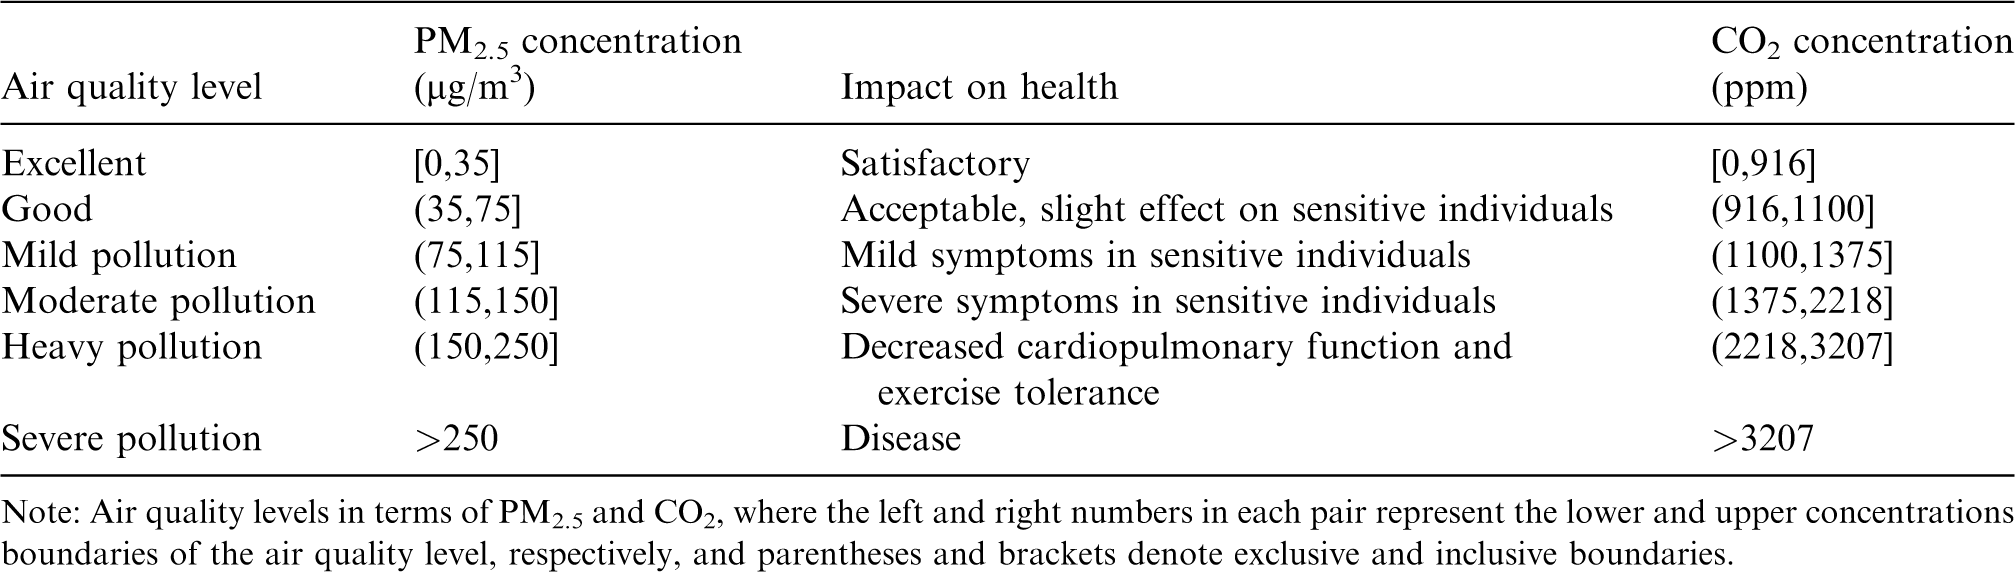
Note: Air quality levels in terms of PM2.5 and CO2, where the left and right numbers in each pair represent the lower and upper concentrations boundaries of the air quality level, respectively, and parentheses and brackets denote exclusive and inclusive boundaries.
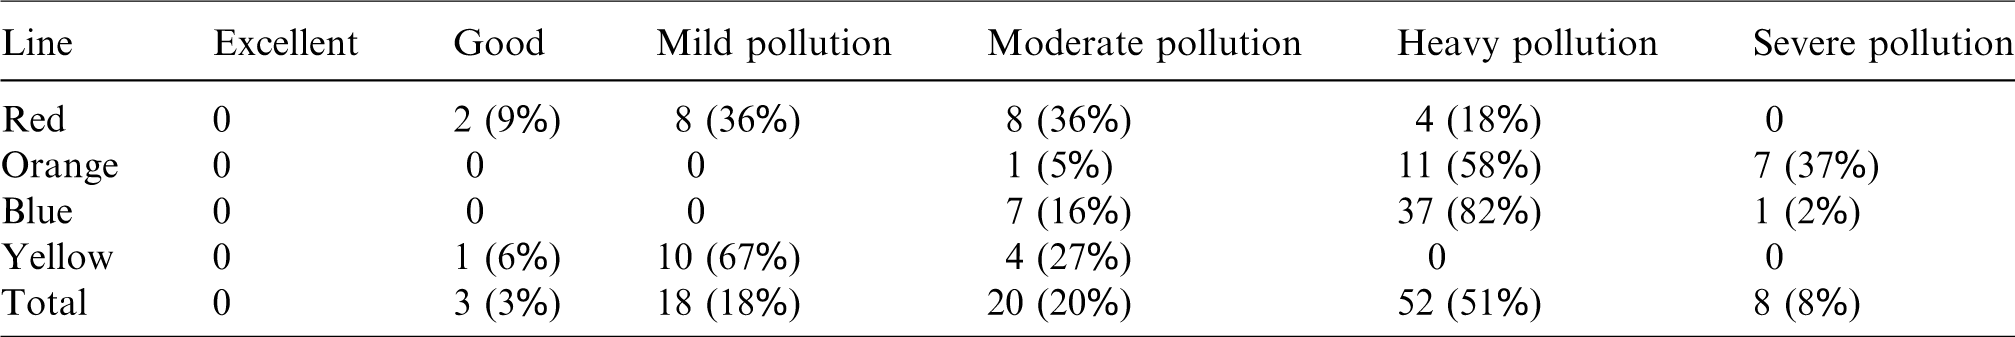
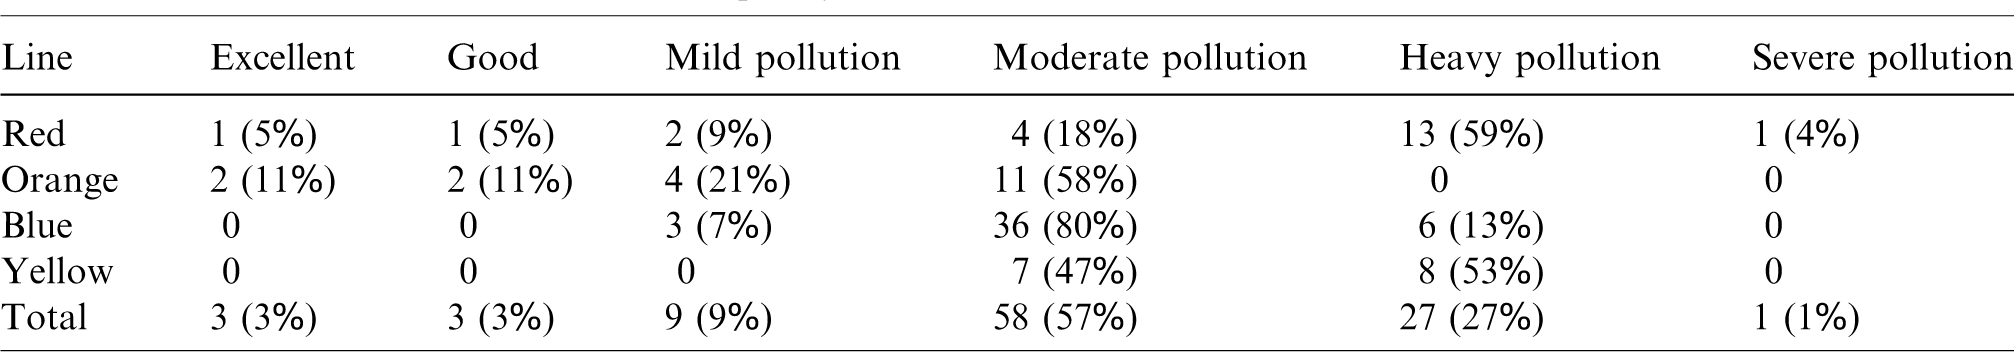
Average concentrations of in-carriage PM2.5 and CO2 are shown in Figure 4. PM2.5 pollution existed in almost all areas, 59% of which suffered from heavy or severe pollution; pollution was especially serious on the Orange and Blue Lines. Fortunately, CO2 concentrations were a somewhat lower. The Orange Line had the lowest CO2 levels, but some sections of the Red and Yellow Lines were moderately or heavily polluted. Air quality data are shown for each line in Tables 3 and 4.
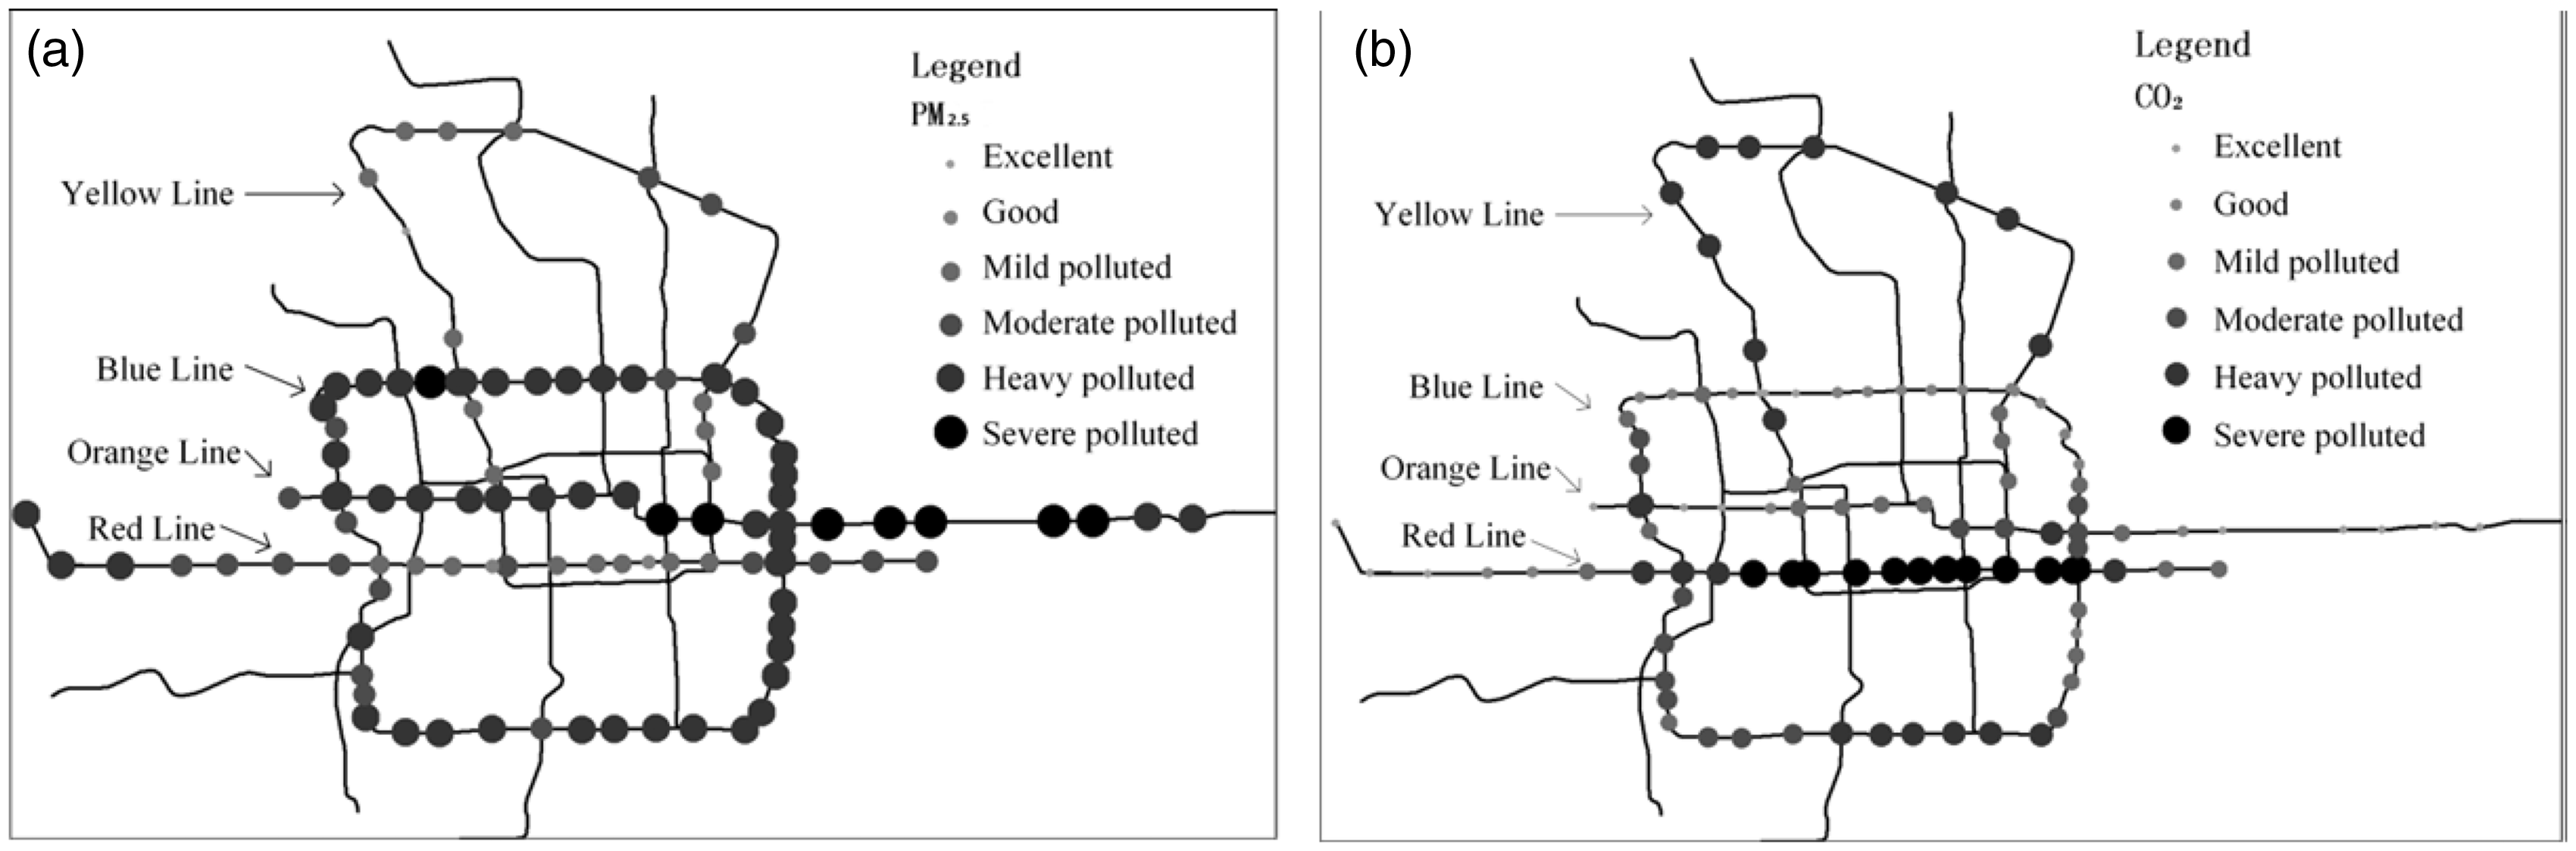
Air quality level for in-carriage (a) PM2.5 and (b) CO2 concentrations in trains.
PM2.5 measurements at various air quality levels.
CO2 measurements at various air quality levels.
Spatial and temporal distributions of PM2.5 and CO2 concentration
Effect of route placement on PM2.5
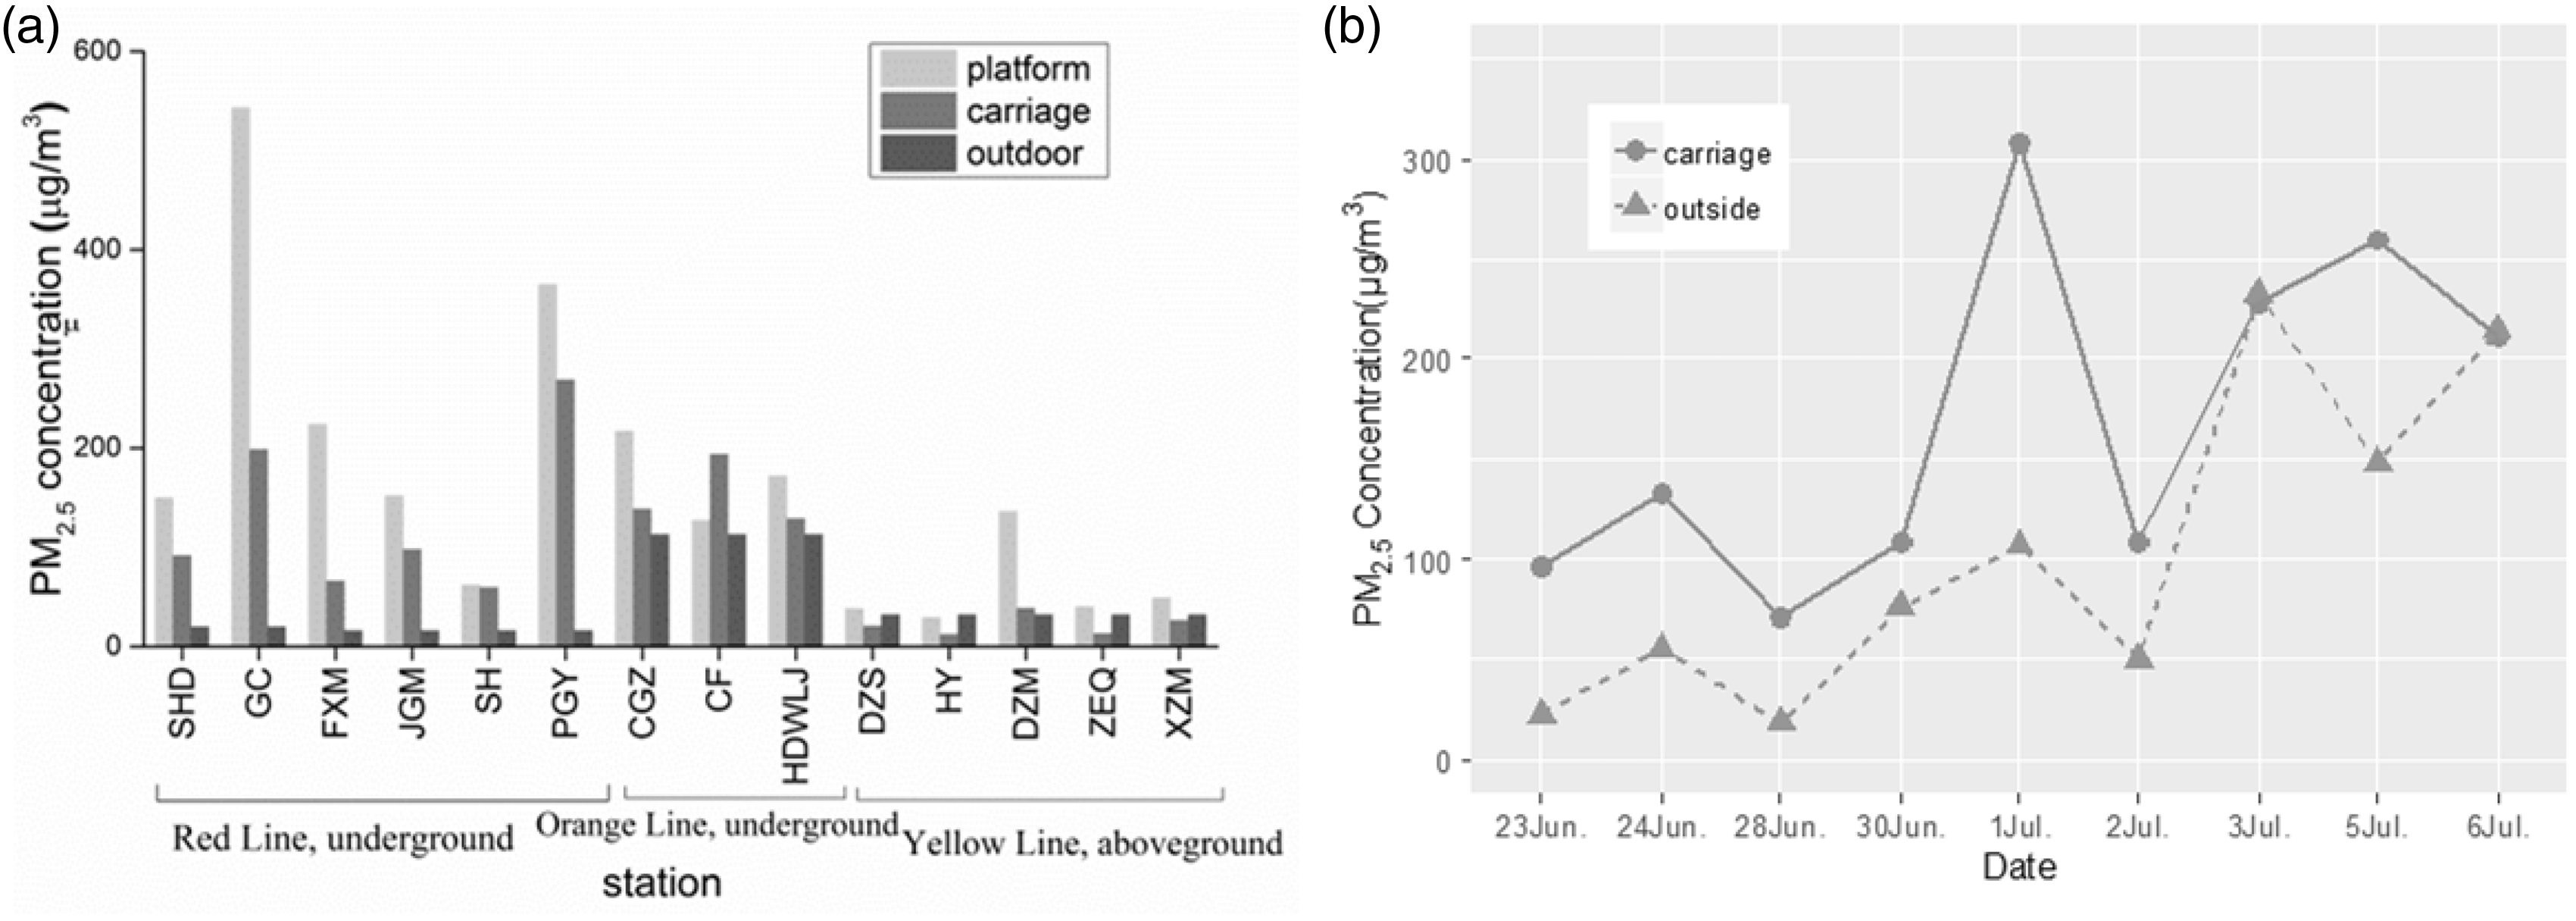
Field measurements indicate that in-carriage PM2.5 concentrations are higher in underground subway trains than in above ground trains. Although all trains and metro stations studied in this study are equipped with air conditionings and mechanical ventilations. Due to the enclosure of the underground lines, there is limited fresh air and low ventilation rate. While the aboveground lines are exposed to ample fresh ambient air. 28 A low ventilation rate may be the main reason for the higher in-carriage PM2.5 concentrations in underground trains than in above ground trains. In Figure 5(a), the bars give information of in-carriage PM2.5 concentrations measured in above ground and underground trains. All four samples were carried out under pleasant outdoor PM2.5 conditions and heavy traffic. The PM2.5 concentrations in ambient atmosphere were 16–49 μg/m3, marked under the bar chart in Figure 5(a). The in-carriage PM2.5 levels were excellent in almost all the above ground trains, much better than those of the underground trains. More than 80% sections of trains in the underground lines were polluted. Previous studies have found that PM2.5 concentrations in underground trains are approximately three times those in aboveground trains.29,30 Accordingly, more effort should be expended to monitor and ameliorate PM2.5 in underground trains.
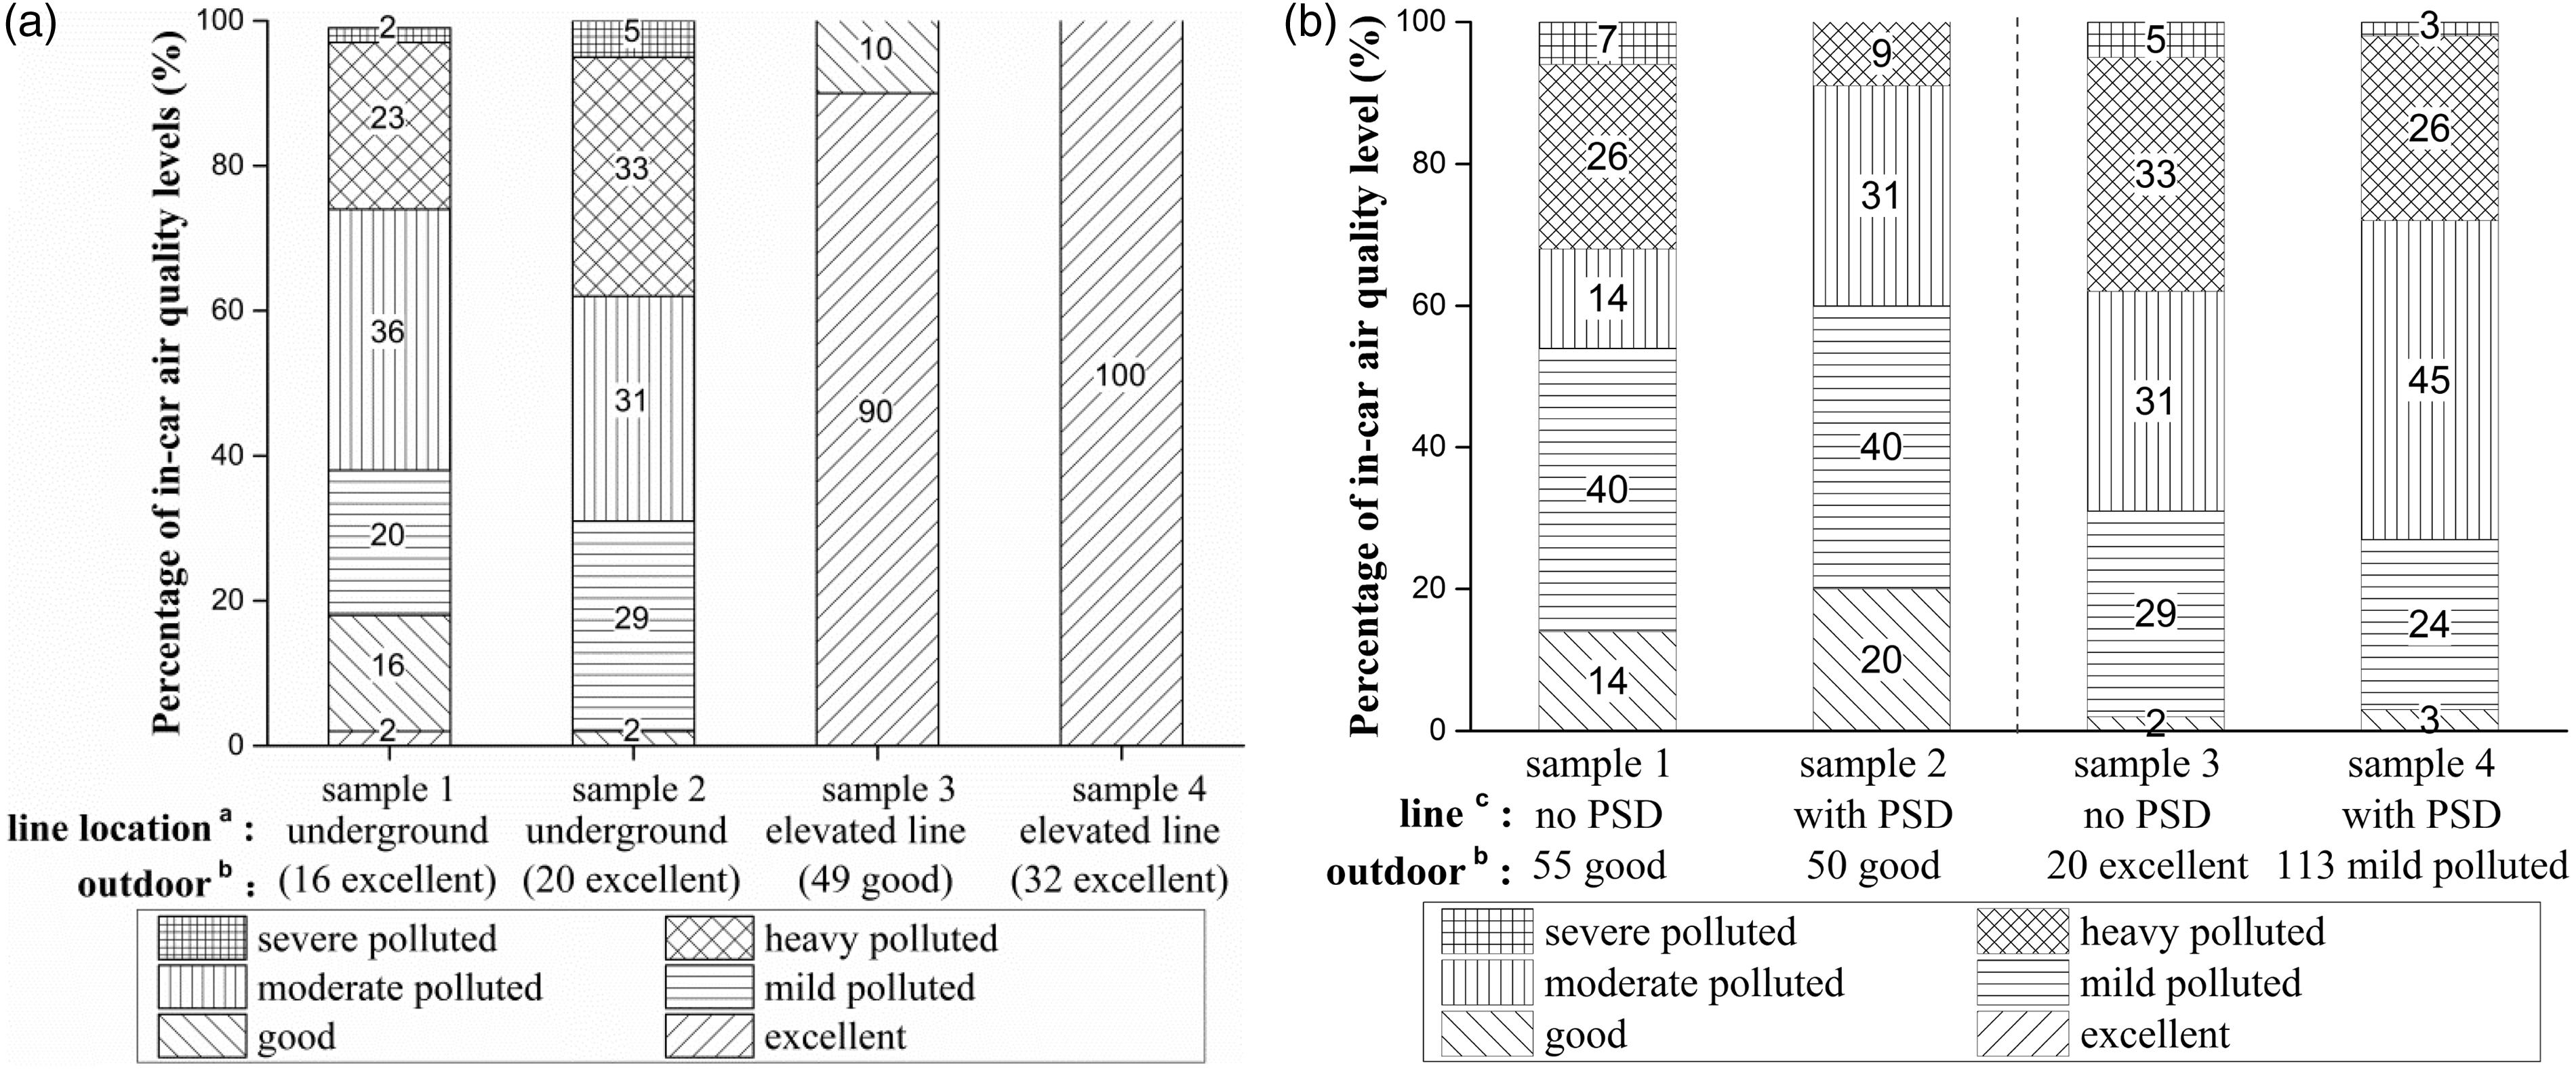
Comparison of in-carriage PM2.5 pollutant concentrations between (a) various route placements and (b) lines with and without PSDs.
Effect of PSDs on PM2.5
The use of PSDs can significantly reduce PM10 levels on the platform. 31 To explore whether such a system could contribute to in-carriage PM2.5 reductions, we compared the concentrations in subway lines equipped with PSDs to lines without. The results suggest that PSDs contribute significantly to reduce in-carriage PM2.5 concentrations and to provide a comfortable travel environment. PSDs may contribute to these reductions by limiting air exchange between the carriage and platform by weakening the wind piston effect. For example, Figure 5(b) shows some results of in-carriage PM2.5 concentrations measured in underground lines. Samples 1 and 2 were taken with similar outdoor PM2.5 concentration (55 μg/m3 and 50 μg/m3, respectively, marked under the horizontal-axis in Figure 5(b)), but the line equipped with PSDs had better air quality. For the same reason, due to the PSDs, even sample 4 was carried out with mildly polluted outdoor air with PM2.5; the in-carriage PM2.5 concentration was better than sample 3, which was measured with excellent atmospheric air quality.
Effect of PSDs on CO2
The measurements show that the CO2 concentration is much higher on the Red Line than on the other lines. This may be a result due to the lack of PSDs on the Red Line. The Orange and Blue Lines are both equipped with enclosed PSDs, and the Yellow Line is equipped with half-height PSDs, while the Red Line has no PSD system. Thus, we can conjecture that PSDs could reduce the in-carriage CO2 concentration. Large volumes of CO2 are exhaled during peak hours, when many passengers occupy the platform. In a subway line without PSDs, piston winds drive more air exchange between the platform and the carriage. Thus, CO2 on the platform enters easily into the carriage and increases the in-carriage CO2 concentration. Such airflow exchange is significantly reduced in subway lines equipped with PSDs, and the in-carriage environment is less affected by platform air. Besides, the absence of PSD system induces also a larger volume of air to be renewed by the ventilation by increasing virtually the volume of the platform. The ventilation is thus probably less efficient and leads to a higher CO2 concentration on the platform. Figure 6 shows measurements obtained under excellent and good outdoor air quality. The line lacking PSDs had the highest proportion of heavy and serious pollution measurements. The level of pollution was only slightly more serious in the line with half-height PSDs than in the lines with enclosed PSDs. Therefore, PSDs, even those of half-height, could significantly benefit in-carriage air quality.
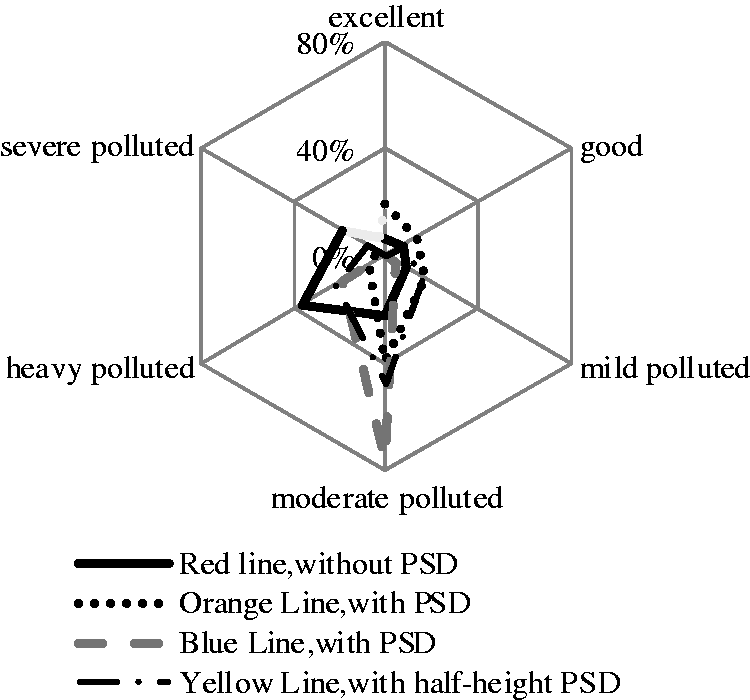
Comparison of CO2 concentrations between lines with and without PSDs.
Differences between platform and tunnel
The in-carriage PM2.5 concentrations change as trains stop at platforms and travel in tunnels, as shown in Figure 7. When the doors open at a station, air from outside of the carriage flows into and disperses within the carriage. 15 As a result, the in-carriage PM2.5 increases rapidly, and then decreases after the doors close and the train enters a tunnel due to the ventilation and air conditioning systems. These results are consistent with results measured in the Seoul subway system. 32 Our measurements indicate that, during a given trip, the PM2.5 concentrations were lower on average and less variable during travel than at the stations.
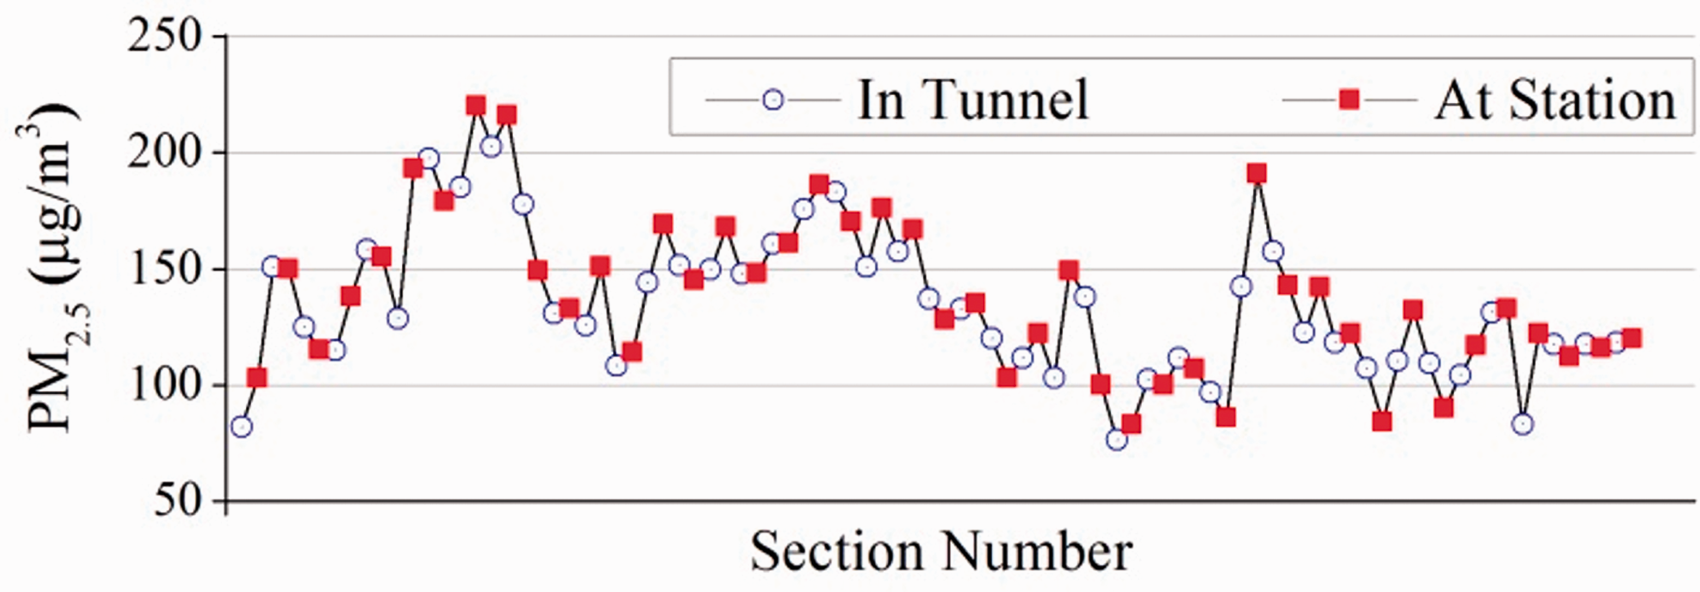
In-carriage PM2.5 concentrations as the train travelled through stations and tunnels in turn.
Discussion
Platform and ambient outdoor air are two sources of in-carriage PM2.5. Fine particles on the platform, which are produced by friction between the wheels and the rails during operation and block braking, enter the carriage. Fine particles from outdoor air, which are derived from roadway vehicle exhaust and coal combustion, may enter via the subway ventilation system. 33 Therefore, preventing external particulate matter from entering the carriages, using PSDs or other methods, could improve the in-carriage air quality. Underground rail systems have relatively poor ventilation compared to aboveground lines, and fine particles accumulate easily, leading to more PM2.5 on platforms and in carriages. However, PM2.5 concentrations in carriages may be reduced by in-carriage air-conditioning cleaning systems and human respiration. Factors related to the in-carriage PM2.5 concentration and distribution are shown in Figure 8(a). Previously, we analysed effects of route placement, PSDs and train locations (at the station or travelling).
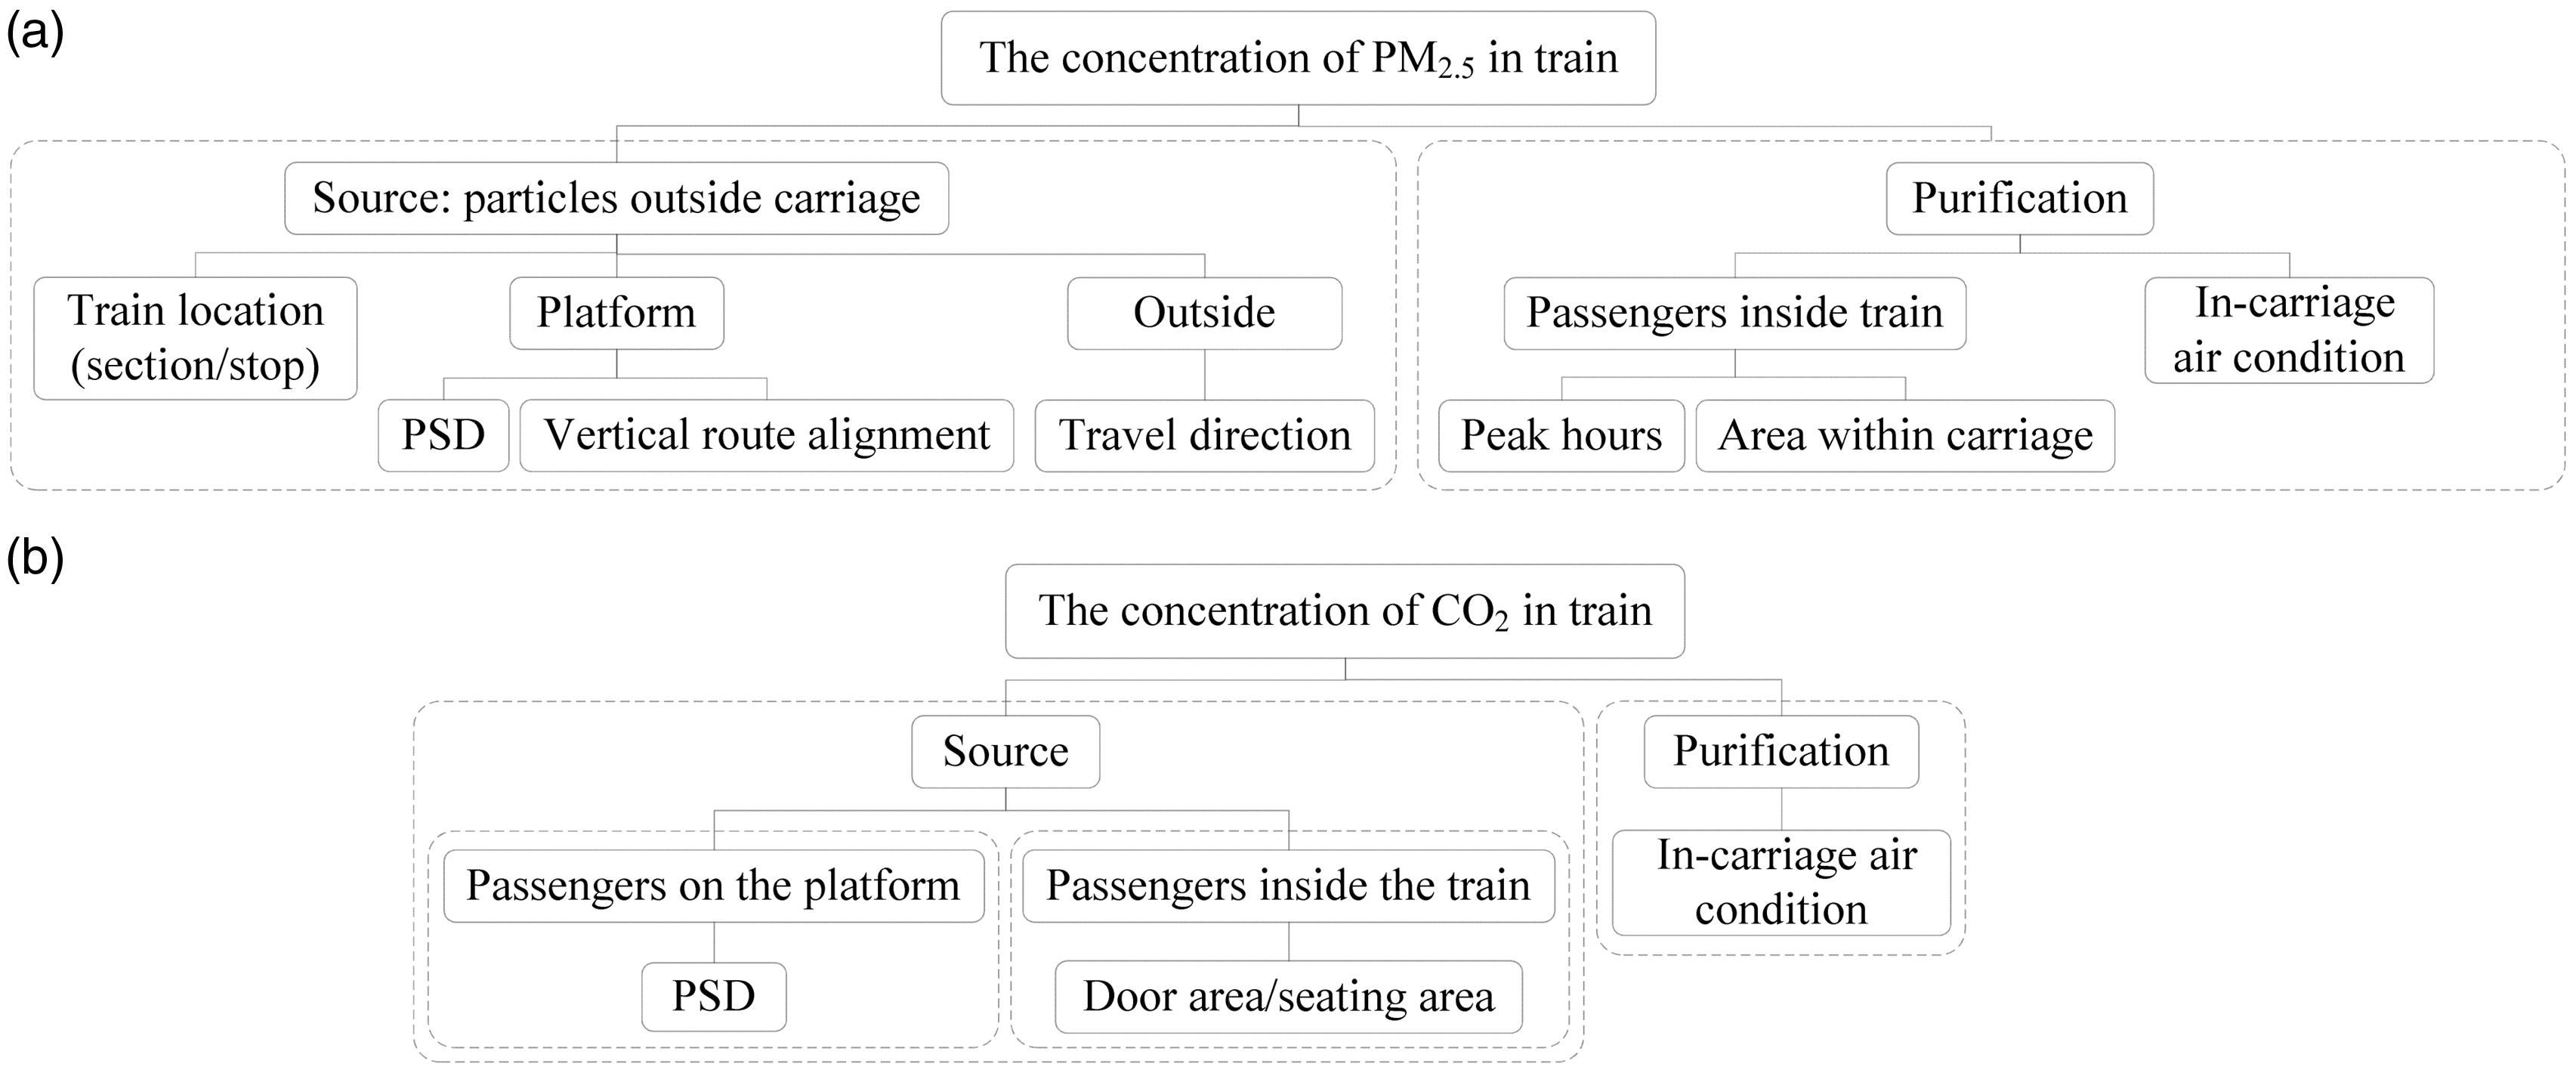
Factors influencing (a) PM2.5 and (b) CO2.
The factors influencing the in-carriage CO2 concentrations are similar to those influencing the PM2.5 concentration, but much simpler. The CO2 concentration within the subway system, which arises primarily from passenger respiration, is much higher than the outside of the station. 34 CO2 exhaled by passengers accumulates in the enclosed environment, and the increased in-carriage CO2 concentration is directly related to the passenger load. The measurement herein revealed no significant differences in CO2 distribution between various route types. Therefore, the list of potential factors influencing the concentrations and distributions of in-carriage CO2 can be simplified, as shown in Figure 8(b), to focus on the effect of passenger number and distribution.
Discussion of PM2.5 concentrations
Effect of the exterior environment
Previous studies have reported that the platform is the main source of in-carriage particulate matter (contributing 64%) 7 and that outdoor PM2.5 concentrations have a linear relationship with in-carriage concentrations. 27 That is to say, the in-carriage PM2.5 concentration may be affected by both the platform and outdoor environments. To clarify these relationships, we measured PM2.5 concentrations both inside the train carriages and on the platform and consulted the Municipal Environmental Monitoring Centre for outdoor concentrations of PM2.5. The data show that, (1) for the underground and above ground lines, respectively, PM2.5 concentrations can be ranked from the highest to the lowest: platform > carriage > outdoors and platform >outdoor > carriage. (2) No matter the route placement (i.e. aboveground or underground). The highest PM2.5 concentrations were found on the platform, which is consistent with previous studies. 35 Adams et al. 36 also found that the mean PM2.5 exposure on the London Underground was three to eight times higher than that experienced when using surface transportation modes. 36 (3) Passengers in aboveground trains are exposed to much better in-carriage air quality in terms of PM2.5 concentration than passengers in underground lines. Relevant data are shown in Figure 9(a).
Relationships between in-carriage PM2.5 concentrations and the outdoor environment. (a) PM2.5 concentrations of carriages, platform and outdoor; (b) synchronous changes in carriage and outdoor PM2.5 concentrations.
Bivariate correlation analysis indicates strong correlations (equation (1)) between the in-carriage PM2.5 concentration (Fcar) and those on the platforms and outside (Fplat, Fout), with correlation coefficients of 0.78 and 0.73, respectively. In-carriage PM2.5 concentrations increase with increasing platform and outdoor PM2.5 concentrations. Therefore, in-train air quality can be promoted by purifying the air outside of the train or by restricting gas exchange between the carriage and outer environment. Figure 9(b) shows measurements in the trains of underground lines.

Effect of passenger density on PM2.5
The in-carriage PM2.5 concentration varies with passenger activities, such as boarding and exiting the train and breathing. To focus on the influence of passengers on in-carriage PM2.5 concentration, we defined the minimum concentration of a trip as the ‘baseline concentration’
37
and estimated the ‘net concentration’ 
Passenger density is used instead of passenger number to prevent differences in carriage size from affecting the analysis and thus more appropriately represent passenger load. To investigate the relationship between the net PM2.5 concentration and passenger density, the sample data were grouped according to passenger density with group intervals of 1 p/m2. The passenger density and average net concentration of group j are denoted 
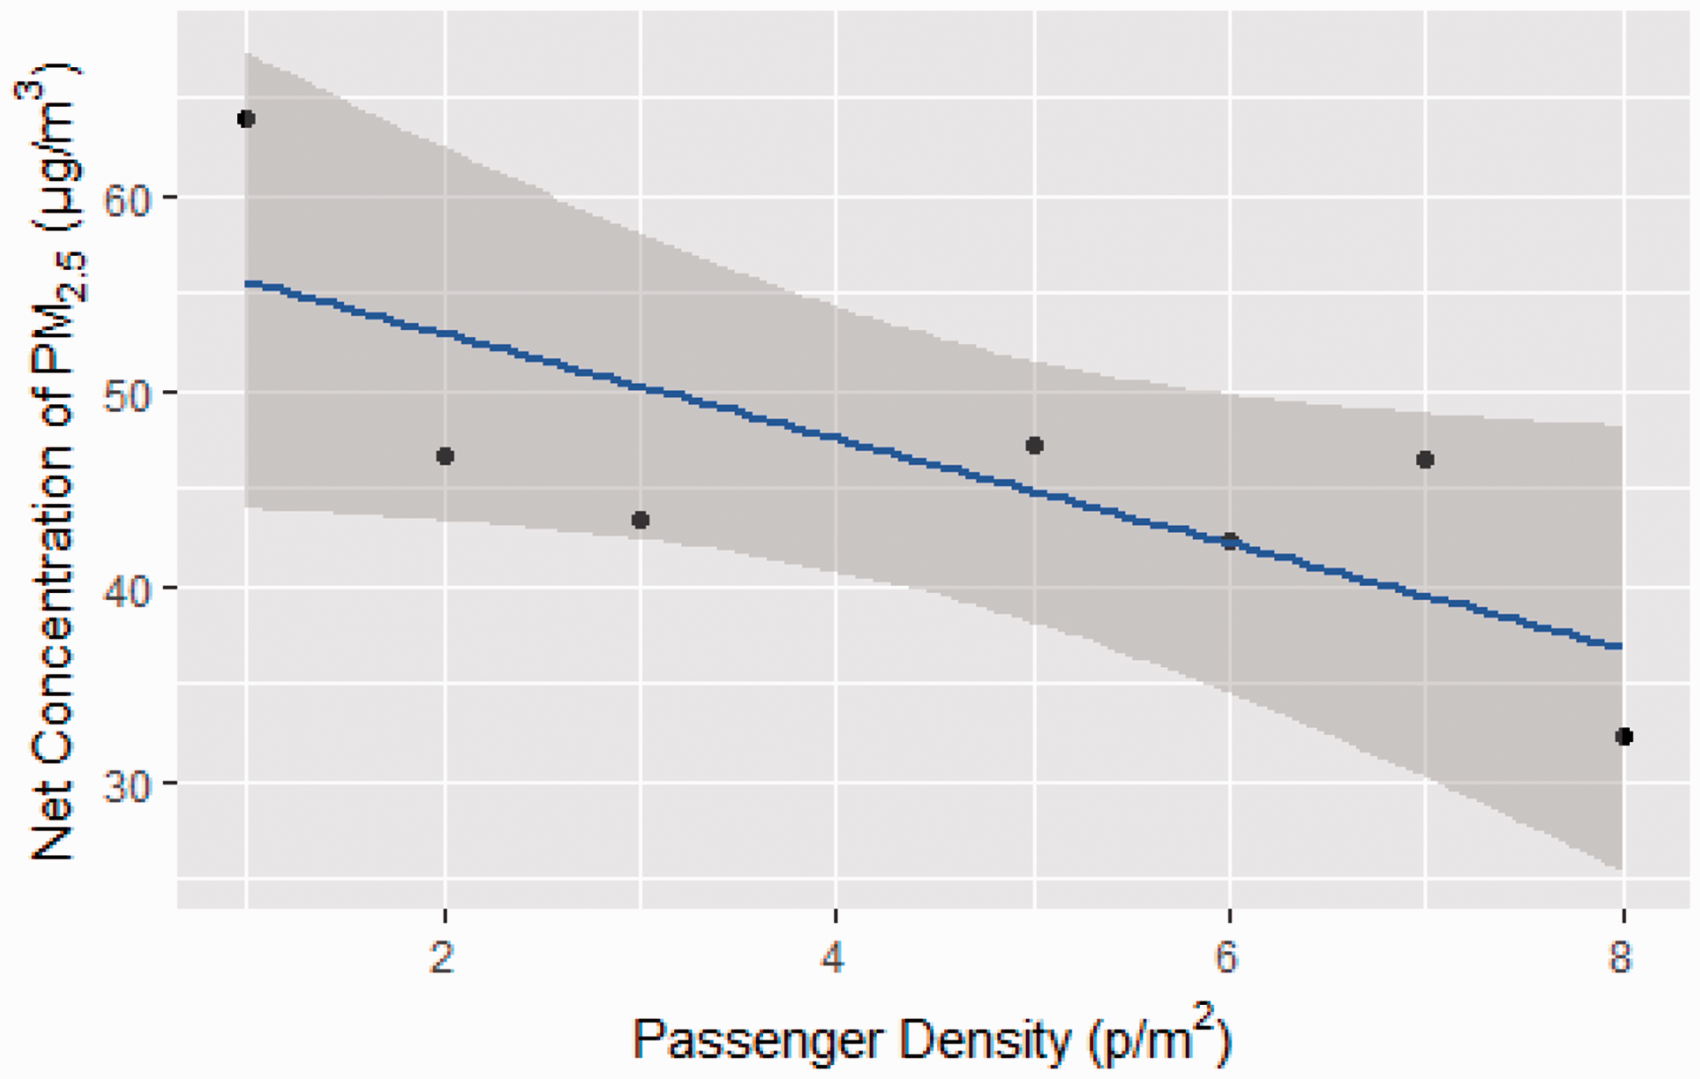
Linear fitting of passenger density and net concentration of PM2.5.
The in-carriage PM2.5 concentration can be estimated by a recursive formula that considers the cumulative effects of passenger load and the outer environment (equation (4)), in which Fi is the PM2.5 concentration of the carriage at station i, b reflects the efficiency of the onboard air-conditioning system, Pi–1 is the number of passengers during the last section, a is the PM2.5 inhaled by a passenger, Fplat and Fout indicate the PM2.5 concentrations of platform and outside, and c and d reflect the air exchange between the carriages, platform and outside.

Temporal and directional variability
Because the in-carriage PM2.5 concentration is significantly related to the outside air quality, in-carriage PM2.5 concentrations should be similar during train trips through the same external environment. In a subway line, trains run in two opposite directions in turn. Time-series correlation analyses were performed on the sample data to explore two aspects of the PM2.5 concentration relationships.
Two peak periods on the same day: For trains running in the same direction, variations in in-carriage PM2.5 concentrations during the morning peak are consistent with those during the evening peak. The correlation coefficients range from 0.6 to 0.9. The in-carriage PM2.5 concentrations are similar when trains passing by specific locations, which emphasizes that the external environment has a definite effect on in-carriage PM2.5 concentration.
Opposite metro line travel directions: During the same peak hour (morning or evening), PM2.5 concentrations in train carriages running in opposite directions are not necessarily significantly correlated. This can be ascribed to the exposure to different sequences of external environments and different directions of passenger flow. This outcome serves as evidence that in-carriage PM2.5 concentrations would be affected by accumulation and hysteresis.
Differences in PM2.5 between the seating and door areas
While average pollutant concentrations are useful for approximate ventilation design, exposure concentrations and the quality of inhaled air are highly dependent on local concentration distributions around human body surfaces. Thus, sophisticated indoor environmental design requires detailed analysis of the surrounding microclimate.
38
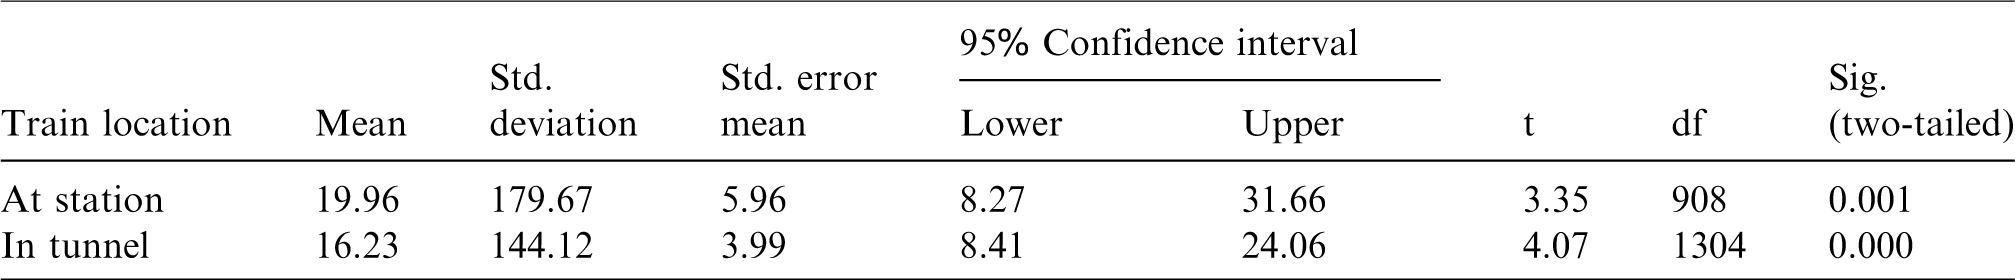
The carriage area can be divided into seating areas and door areas (Figure 2) according to passenger behaviour and the layout of the carriage facilities. As the doors open and passengers continuously embark and disembark, gas exchange takes place more readily in the door area than in the seating area. Paired sample t-tests of PM2.5 concentrations in the two areas were conducted for data taken while travelling and stopped at stations, as shown in Table 5. The significance levels are both <0.05. Thus, there are significant differences between the two areas. During travel, the average concentration near the door is much higher than that in the seating area. Under the same local passenger density, the door area has much higher PM2.5 concentrations, as shown in Figure 11 and equation (5).


Paired sample t-tests of the differences between Fseat and Fdoor.
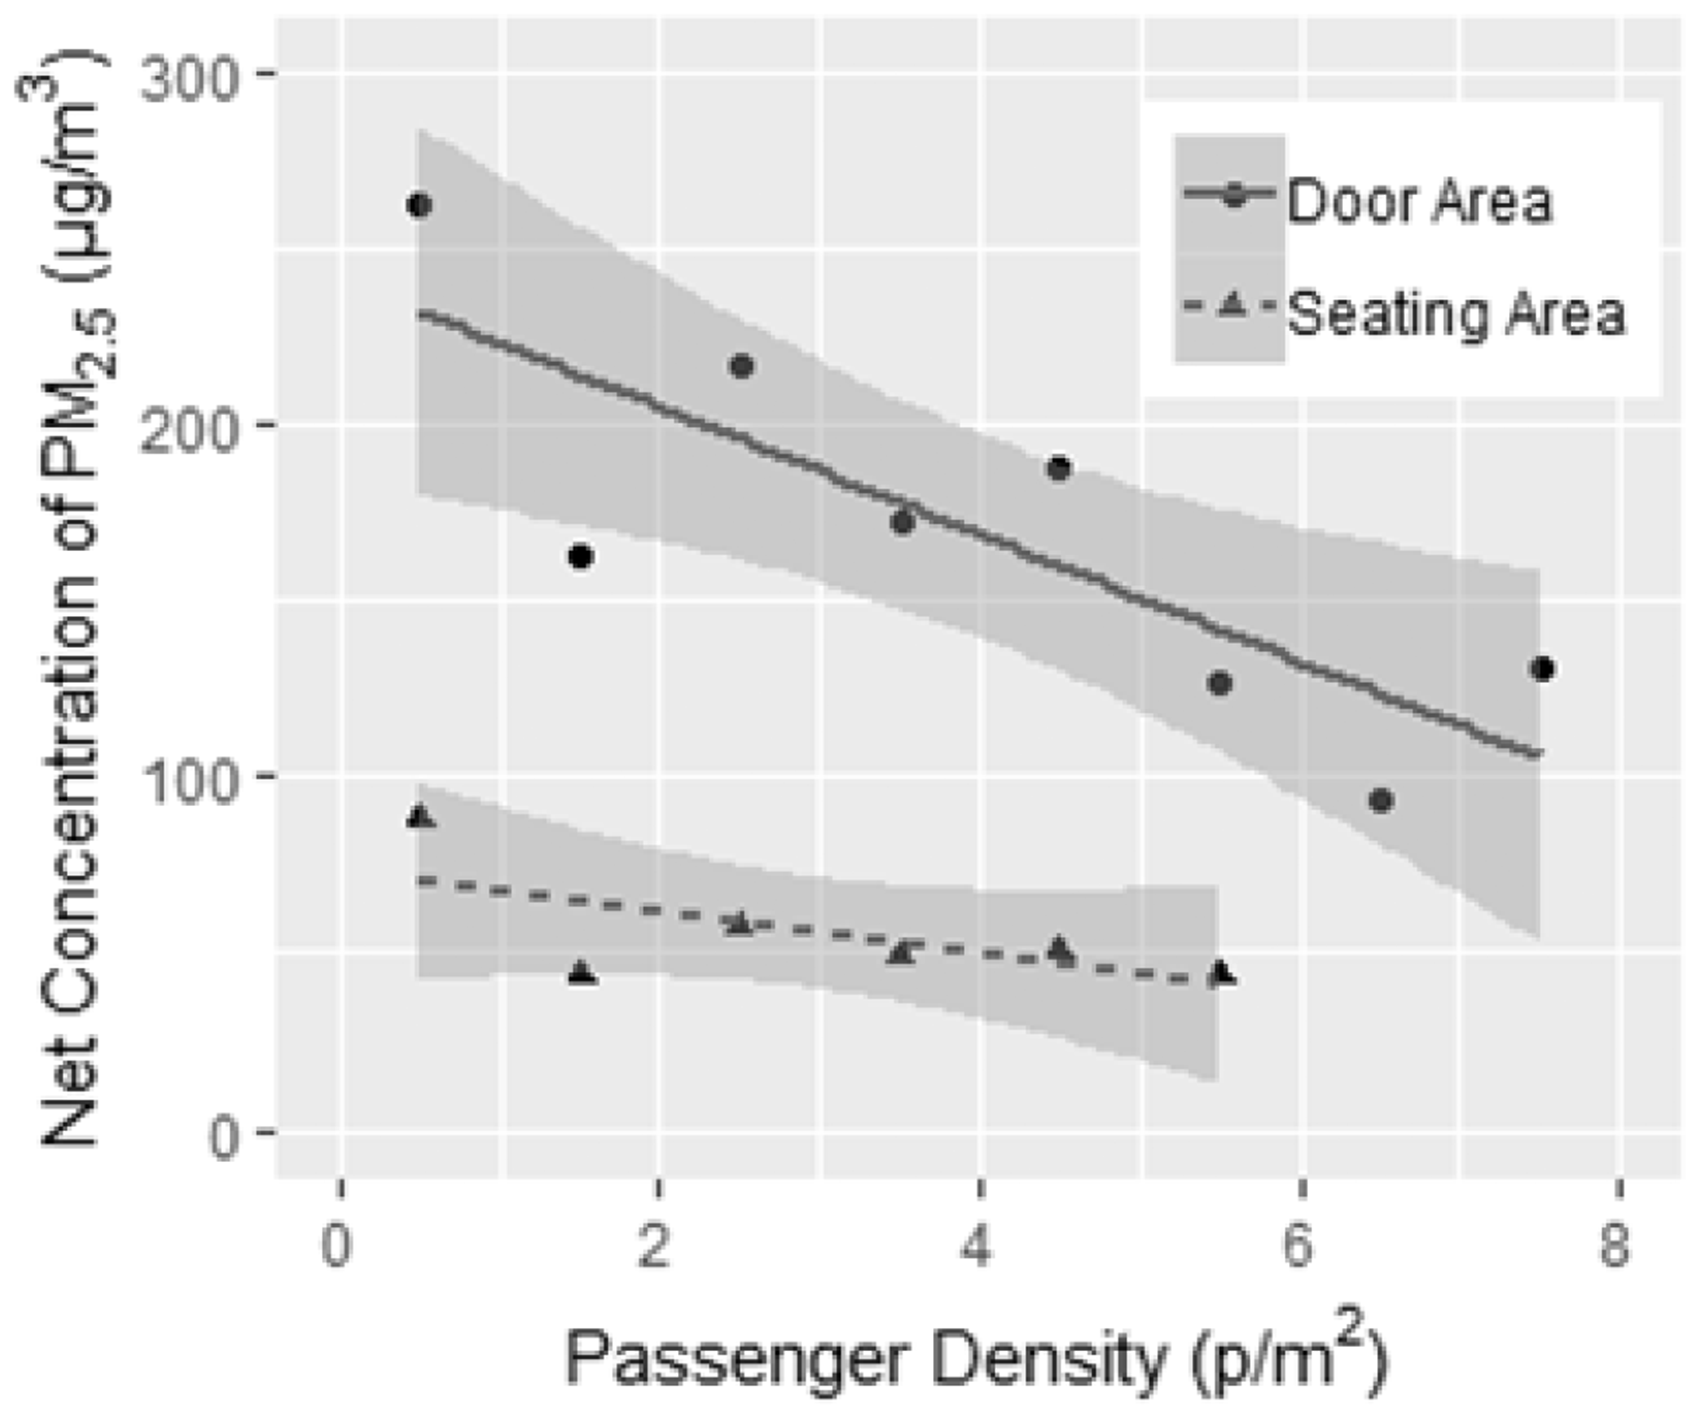
PM2.5 concentrations in the door area and seating area within the train carriage.
Discussion of in-carriage CO2 concentrations
Effect of passenger density on CO2
Clear links were found between the amount of CO2 volume and the number of passengers.
5
A linear fitting of our data is shown in equation (6), for which the p-value is < 0.05. The number of passengers explains 97% of the variation in CO2 concentration. Passenger metabolism seems to be the main source of in-carriage CO2.

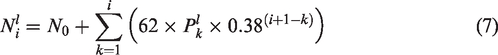
To some extent, the CO2 concentrations in each section of the train are not independent. Due to poor ventilation and insufficient fresh air, CO2 exhaled by passengers accumulates easily, especially when the carriage is crowded. To consider the cumulative effect of this accumulation, the sample data were subjected to time-series analysis, as modelled by equation (7). The CO2 concentration in section i is affected by the concentrations in sections from 1 to i−1, which is related to the passenger loads.
The recursive model (equation (7)) predicts the CO2 concentration more accurately than the linear model (equation (6)) because the linear model considers only passenger density and is sometimes too sensitive to reflect actual changes in concentration. Figure 12 shows the results calculated by the two models in comparison to measured data for one subway line sample; because the R2 of the recursive model is closer to 1, the recursive model is superior to the linear model.
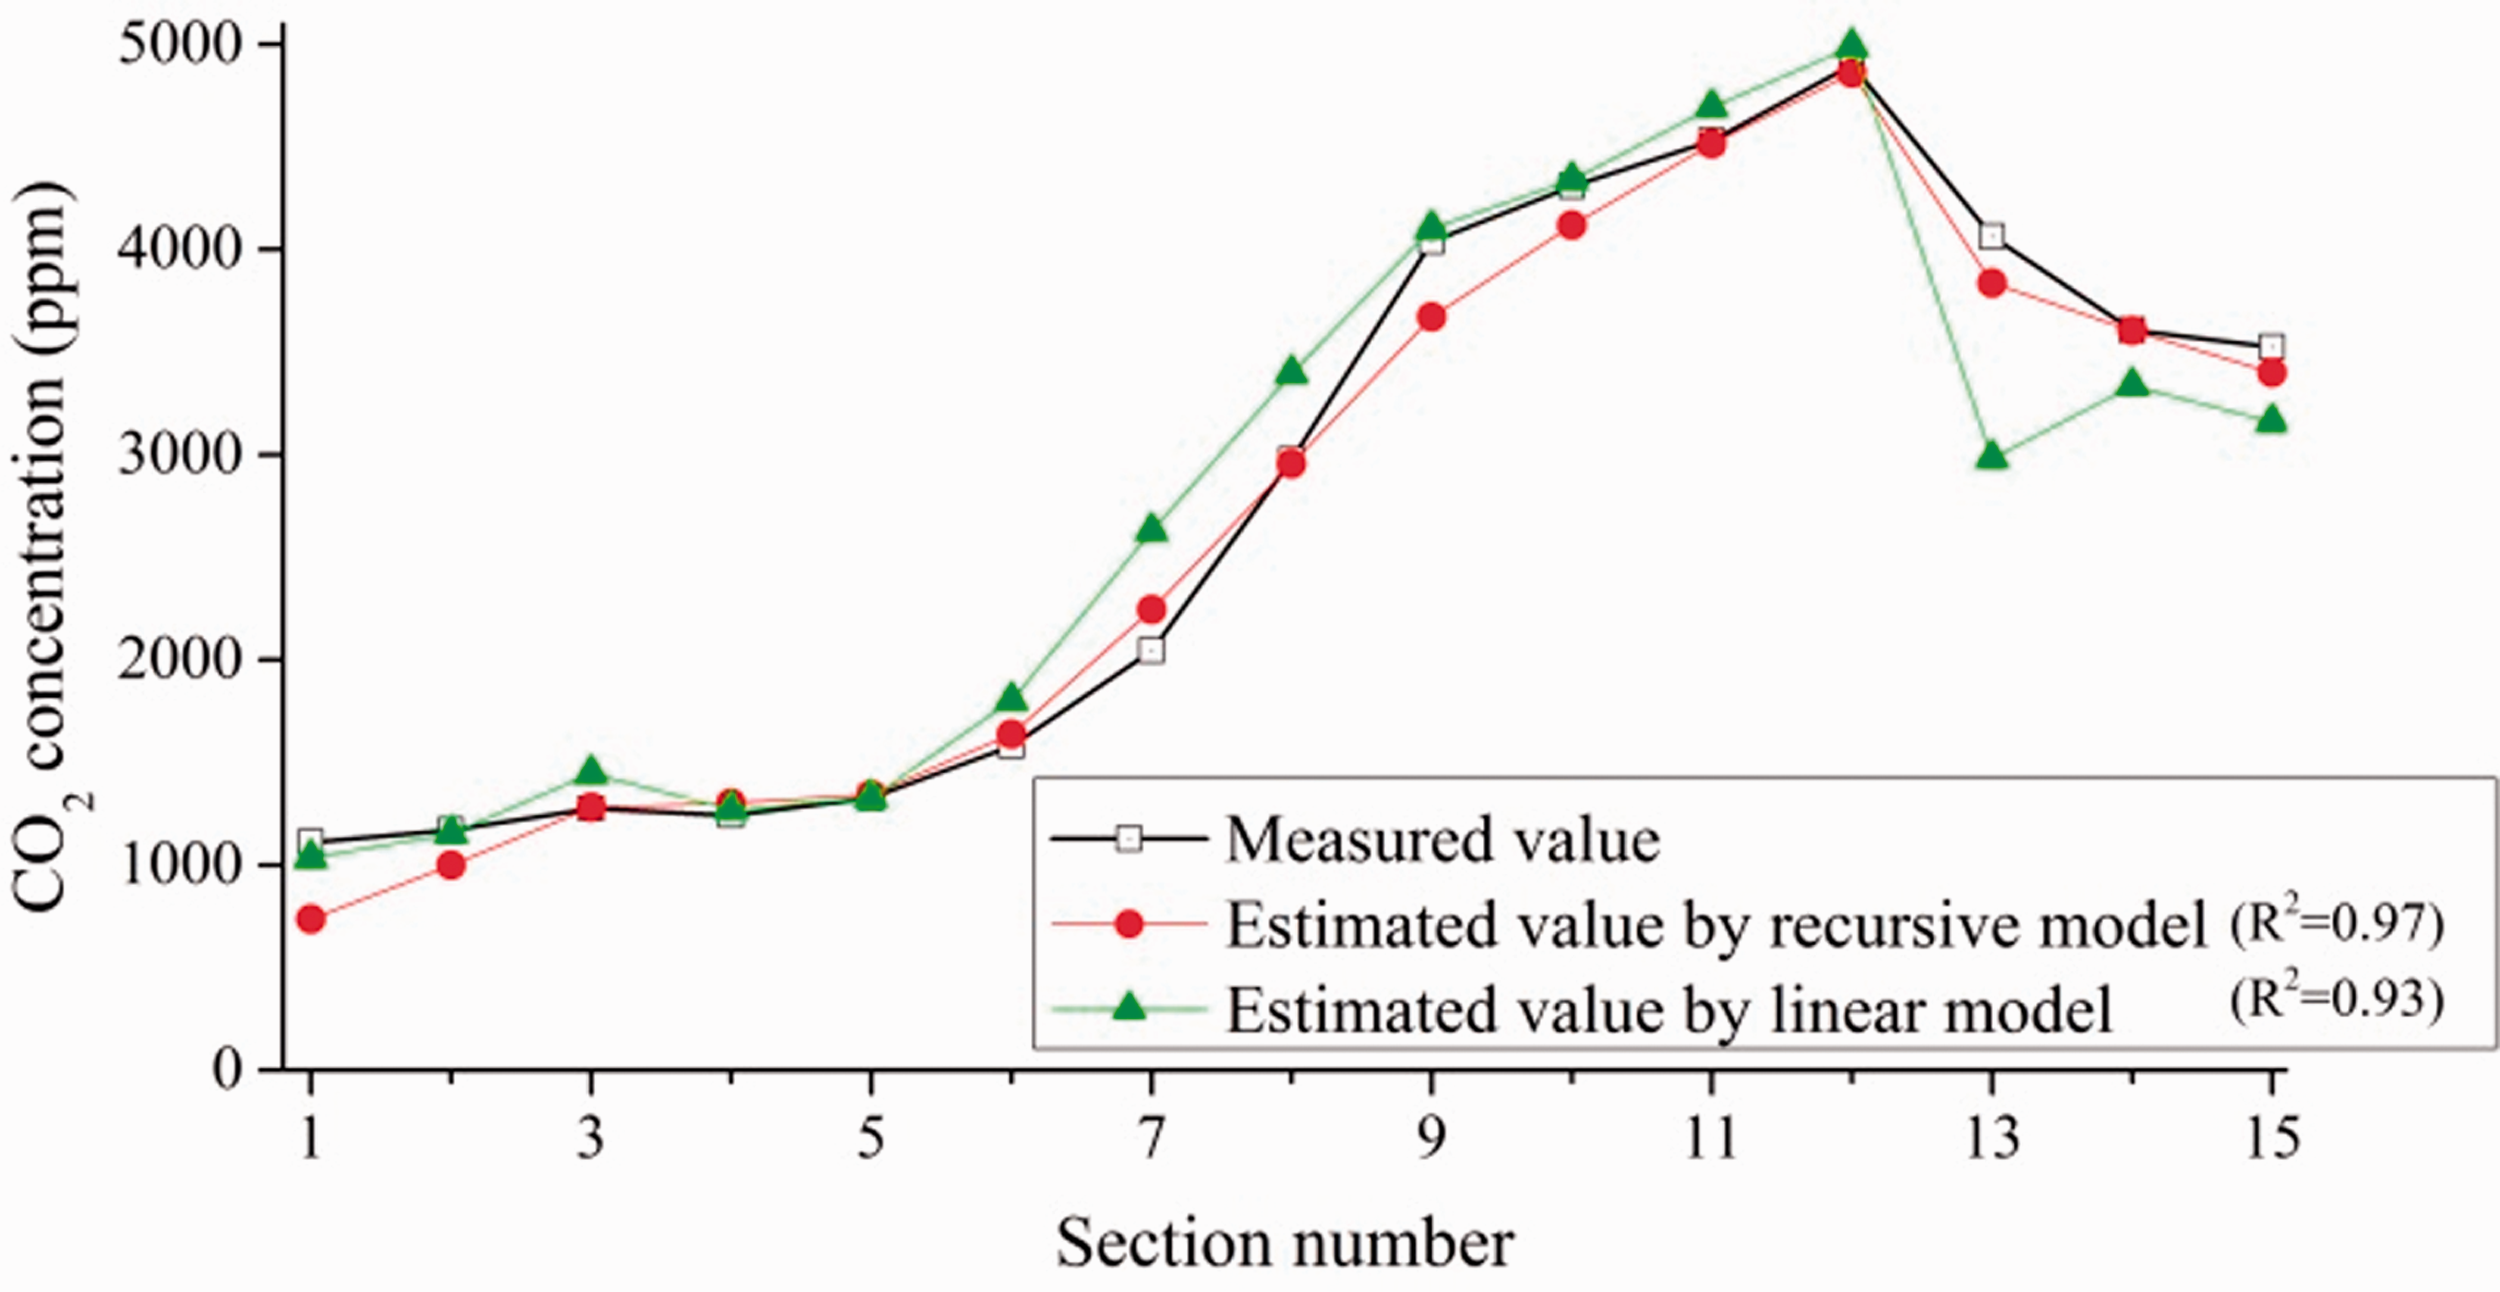
Comparison of measured and calculated CO2 concentrations.
Differences in CO2 between the seating and door areas
Local CO2 concentrations differ due to the uneven passenger distribution in carriages. The variations in CO2 concentration between the seating and door areas feature three stages: when CO2 concentrations are low, Ndoor (CO2 concentration in the door area) < Nseat (CO2 concentration in the seating area); as the CO2 concentration increases, the relative concentrations in the two areas fluctuate randomly, and finally, when the CO2 concentrations are high, Ndoor > Nseat. The variations in local passenger density in the two areas feature three similar stages, implying that the CO2 concentration is influenced significantly by passenger density.
Equation (8) expresses the linear fitting results between local passenger density and CO2 concentration; both p-values are < 0.05. Because the slope of the linear equation for the seating area is larger, the CO2 concentration is more sensitive to changes in passenger density in the seating area than in the door area.


Considerations for subway design and operation
Ensuring acceptable air quality in subway train carriages can have a positive effect on the quality of subway service. In the subway system evaluated herein, both the CO2 and PM2.5 concentrations exceeded the recommended values. Therefore, measures must be taken to improve the in-train air quality. Most of the in-carriage PM2.5 concentration is derived from platform and outside air. Therefore, to minimize the effects of outdoor pollution, it is important, first, to locate the station entrance in an area with clean air and set fresh-air pavilions in the upwind direction. Second, to improve ventilation and reduce the amount of secondary pollution caused by recirculating air with high PM2.5 from the platform and tunnel, the functional air supply–exhaust design should be considered. Furthermore, the installation of PSDs is an optimal method for promoting in-train air quality in carriages, as it isolates the tunnel from platform, especially in underground lines.
In-carriage CO2 concentrations can be used to evaluate whether the volume of fresh air is adequate. The increase in concentrations during measurements herein reveals that the air conditioning system did not introduce enough fresh air to adapt to changing passenger volumes. Therefore, it would be beneficial to increase the fresh air volume and facilitate automatic feedback adjustment in the environmental monitoring systems. The use of different air conditioning operation modes during peak and off-peak hours has been suggested in consideration of the large variations in passenger load. 39 A fresh-air volume-assessment approach was proposed based on the vehicle capacity. 40 However, this approach may not be practical under continual, high-amplitude variations in passenger volume.
Because (1) pollutants are derived from various sources, (2) their concentrations are complicated by various factors and (3) passengers are exposed to different pollutants simultaneously, integrated system assessment is necessary. The fresh air volume can be calculated using equation (9). Real-time monitoring can be used to obtain 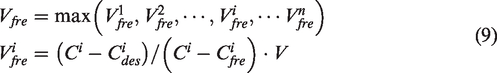
Conclusions
This study examined in-carriage PM2.5 and CO2 concentrations in trains of an urban rail transit system. The outside environment and in-carriage passenger density were found as main factors influencing in-carriage PM2.5 concentrations. The latter is also the dominant factors controlling the in-carriage CO2 concentration. The in-carriage air quality was superior in aboveground train systems in comparison to underground systems. Lines equipped with PSDs had better air quality than those without. In addition, PM2.5 and CO2 concentrations were compared between various in-carriage areas, train locations, peak hours and travel directions. Finally, in view of the operational problems outlined herein, various suggestions were made to improve in-train air quality, such as designing functional ventilation systems and installing PSDs. Furthermore, we proposed a mathematical model to quantify the fresh air volume required to ameliorate the health risks associated with ever-changing pollutant loads.
Our findings reported above are based on field measurement in a certain subway system, and that much remains to be explored. For instance, some suppositions about ventilation efficiency are captured based on field data, such as the comparison between different line types and local areas. However, as the effect of the ventilation system is a very complex issue, these suppositions may be the comprehensive effect of several factors, such as the construction age of a line, the materials of building and track, the maintenance mode. These factors should be more strictly controlled and more samples should be analysed in future research in order to arrive at more universal conclusions.
Footnotes
Authors’ contribution
Gao conceived and designed the study. Chen and Wang coordinated and conducted the fieldwork. Chen and Gao conducted the analyses. All authors contributed to the interpretation of findings. Gao and Wang wrote the first draft of the article. All authors contributed to subsequent drafts and approved the final version of the draft.
Declaration of conflicting interests
The author(s) declared no potential conflicts of interest with respect to the research, authorship, and/or publication of this article.
Funding
The author(s) disclosed receipt of the following financial support for the research, authorship, and/or publication of this article: This work was supported by National Natural Science Foundation of China (Award Number: 71871027).