
Abstract
Aim:
Identifying disability among children in surveys is important for improving public health initiatives. However, this process is challenging, as different measurement approaches and cut-offs impact prevalence rates. This study aims to assess disability using non-relational and relational models with different cut-offs to reveal the differences in prevalence, and to examine differences in life satisfaction between children with and without disabilities based on the varying measures.
Method:
This cross-sectional study used data from 6049 Norwegian children (10–13 years). We assessed non-relational disability using Washington Group questions about functional limitations. We additionally measured perceived barriers in school and leisure for those who reported functional limitations, to assess disability according to the relational model. Different cut-offs were applied for both measures. Linear regression analysis was used to investigate differences in life satisfaction between children with and without disabilities for all measures.
Results:
Disability prevalence rates were lower under the relational model compared to the non-relational model across all cut-offs, indicating that many children who were identified as disabled in the non-relational model do not experience hindrances in school or leisure. For example, with the ‘often or more’ cut-off, the non-relational model showed a 27.6% prevalence, while the relational model showed 8.2%. Life satisfaction was significantly lower among children with disabilities compared to their peers without disabilities, with larger differences observed when using the relational model.
Conclusions:
Keywords
Introduction
Self-report surveys among children are an established source of information for public health initiatives [1] as they can capture children’s experiences in essential aspects of life and ensure that their voices are heard in matters affecting them. Children with disabilities (CWD) face greater challenges than their peers without disabilities in various areas, including education, leisure, and subjective well-being [2,3], which can adversely affect key determinants of quality of life, such as future educational and employment opportunities [4]. Therefore, it is crucial to recognise CWD as a vulnerable group when planning, implementing and evaluating public health initiatives [1,5,6]. However, children are rarely asked directly about disability in population-based surveys, leaving important aspects of their lived experiences underexplored.
Disability is a complex phenomenon that is challenging to assess through surveys [7,8]. Disability is traditionally defined through a medical or a social model [9]. According to the medical model, disability is a result of an individual’s limitations caused by disease or health conditions. In contrast, the social model views disability as a result of societal barriers alone, not individual limitations [1,5,9]. In the Nordic countries, the relational model is often used [10]. This hybrid model sees disability as a phenomenon arising from the gap that occurs between individual impairments and societal barriers, rather than being located solely in the individual or society [11]. Hence, it is closely related to the framework of the United Nations Convention on the Rights of Persons with Disabilities (UNCRPD) [12].
There is no agreed-upon measure to assess disability through self-reported surveys among children [6–8], and several measures exist (for a review see [9,13,14]). Widely used and well-recognised measures that assess self-reported disability in line with the UNCRPD [12] are from the Washington Group on Disability Statistics (WG) [15,16]. Both the Short-Set (WG-SS) [15] and the Child Functioning Module (WG-CFM) [16] capture disability through domain-specific questions that cover physical (seeing, hearing, moving) and cognitive (self-care, concentration, communication) limitations through questions such as, ‘Do you have difficulty seeing, even if wearing glasses?’. Respondents indicate their difficulty level through the categories: ‘No difficulty’, ‘Some difficulty’, ‘A lot of difficulty’, and ‘Cannot do at all’. The WG proposes different cut-offs for the identification of disability, depending on the purpose of the study [9,15–17]. Three commonly used cut-offs are as follows [17]: ‘Some difficulty or worse’ for identifying those who may benefit from universal accessibility, ‘A lot of difficulty or worse’ for generating comparisons of disability prevalence across countries and for research, and ‘Cannot do at all’ for identifying those who may require assistance currently or in the future. The recommendation of using the cut-off ‘A lot of difficulty or worse’ for international comparisons and research is based on research that finds this cut-off to be the most accurate for the identification of individuals with disabilities [9,15,17]. The ‘Some difficulty or worse’ may lead to an overestimation [7,8,18], while the ‘Cannot do at all’ captures only those with severe disability, leading to a possible underestimation [7,9].
Although the WG measures are well-recognised, they do not assess disability according to the relational model, as they do not measure barriers to participation in activities and society among those who experience functional limitations [6,9]. Identifying children’s disabilities through the relational model could provide a more nuanced measure, as it also reveals the discrepancy between the individual and the demands within the environment: – an important aspect of how disability is understood today.
Aim
This study aims to examine self-reported disability in a large, population-based sample of Norwegian children (ages 10–13), using the WG measure alone (hereafter referred to as non-relational) and in combination with additional measures to identify disability according to the relational model. We also explore how different thresholds (cut-offs) affect these disability estimates. To explore the implications of applying different disability measurement approaches, we assess well-being differences between children with and without disabilities across the various measurement methods. While life satisfaction is not the primary focus of this study, previous research identifying well-being disparities between these groups [3] suggests that it is a relevant indicator for evaluating the effectiveness of the different approaches. To the best of our knowledge, this is the first quantitative study to assess disability according to the relational model of disability in a child population.
Methods
Study design, data collection and sample
This cross-sectional study was based on data from the Ungdata Pluss project, conducted in two counties in south-eastern Norway [19]. Data were collected through an electronic survey during school hours. A total of 7240 of the 11,848 children, aged 10–13, who were invited to participate, had parents/guardians who consented to their participation. Of these, 6049 children completed the survey, constituting 51% of the total population [19].
Measures
Disability
The measures for disability were inspired by both the WG-SS [15] and WG-CFM [16], and the Swedish Health Behaviour in School-Aged Children study [20]. Prior to the Ungdata Pluss study, the measures’ wording and response categories were adjusted to fit the Norwegian context and age group, and were tested in a population of children in primary and special educational settings [19,21].
The non-relational model followed the approach recommended by the WG. This measure consisted of six core domains of functional limitation: three physical (vision, hearing and movement) and three cognitive (reading or writing, concentration and understanding) (see Figure 1, frames 1 and 2 for questions). Children were classified as ‘having a disability’ based on the responses to these six questions. We applied three cut-offs recommended by the WG [15–17]: ‘Sometimes+’, ‘Often+’ and ‘All the time’. For instance, under the ‘Often+’ cut-off, children who responded ‘Yes, often’ or ‘All the time’ to at least one of the six questions were classified as ‘having a disability’. Those who responded ‘Yes, sometimes’ or ‘No, never’ to all items were classified as ‘not having a disability’.
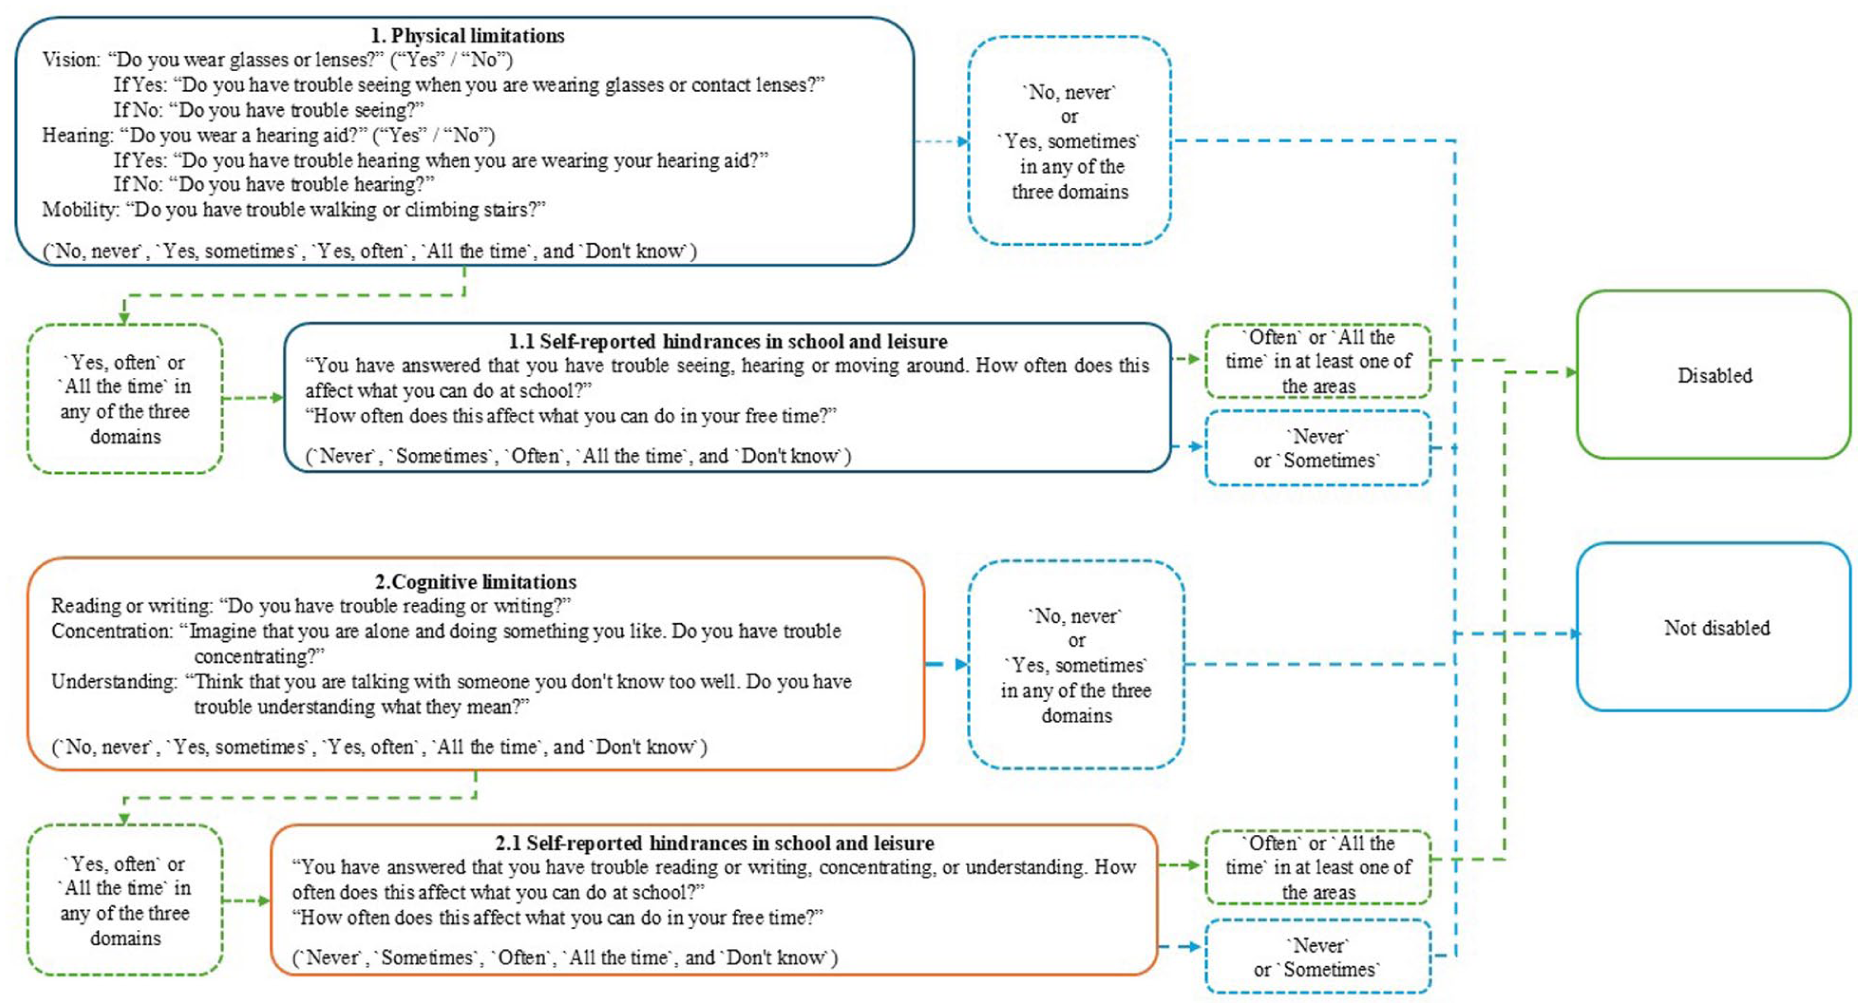
Conceptual model for the assessment of disability according to the relational model, exemplified through the ‘Often+’ cut-off.
The relational model had an additional focus on how physical and cognitive limitations affect children’s daily lives, particularly in school and leisure activities. As illustrated in Figure 1, the process of constructing this measure involved two steps. For instance, when applying the ‘Often+’ cut-off to the physical limitation domains:
Step 1: Children reported whether they experienced physical limitations (‘Yes, often’ or ‘All the time’).
Step 2: If a limitation was reported in at least one of the three physical domains, the responses to the two additional questions (See Figure 1, frame 1.1 for questions), whether these limitations hindered them in school or leisure activities, were included in the classification.
Consequently, to be classified as ‘having a disability’ under the relational model according to the ‘Often+’ cut-off, children were required to report both a limitation (‘Yes, often’ or ‘All the time’) and a hindrance in school or leisure (‘Often’ or ‘All the time’). If children responded ‘Never’ or ‘Sometimes’ to the hindrance questions, they were classified as not having a disability according to this cut-off. Similar steps were applied to the questions on cognitive limitations.
Life satisfaction
We used the following widely recognised measure to assess life satisfaction [22]: ‘Overall, how satisfied are you with your life at the moment? Rate your answer on a scale from 0–10, where 0 means not happy at all and 10 means very happy’.
Sociodemographic background
Grade was used to represent age (e.g. 5th graders are 10 years old), and sex was categorised as either ‘Boy’ or ‘Girl’. Place of living was classified as ‘Urban’ or ‘Rural’. Language spoken at home was used to assess immigrant background: ‘Only Norwegian’ or ‘Norwegian+’ (included ‘Norwegian and another language’ and ‘Only a language other than Norwegian’). Socioeconomic status was measured using the Family Affluence Scale [19,23], which includes four questions: family car ownership, having one’s own bedroom, number of holidays abroad last year, and number of computers/tablets at home. Answers were coded 0–3, and a mean score (0 = lowest, 3 = highest) represented total resources.
Ethics
The Regional Committee for Medical and Health Research Ethics Norway (2024/721601) and the Norwegian Agency for Shared Services in Education and Research (372074) approved this study. Prior to the survey, all participants were informed that participation was voluntary. Given the participants’ age, written consent was obtained from their guardians.
Analysis
Analyses were conducted using R version 2023.03.1. We used descriptive statistics to assess participant characteristics and the prevalence rates of functional limitations, perceived hindrances in school and leisure activities, and disability. Means and standard deviations were reported for continuous variables, while frequencies and percentages were reported for categorical variables. Differences in life satisfaction between CWD and peers without disabilities were analysed using multivariate linear regression, with life satisfaction as the dependent variable and disability as the independent variable, controlling for sociodemographic factors. This analysis was conducted for all three cut-offs in both the non-relational and relational models. Results are reported as unstandardised regression coefficients (B), with p-values and 95% confidence intervals. Missing data were below 5%, making imputation unnecessary.
Results
Sample characteristics
The sample had an equal distribution in terms of sex (51% boys and 49% girls) and grade level (33% in 5th grade, 34% in 6th grade, and 33% in 7th grade). Most children (84%) lived in urban areas. The majority spoke only Norwegian at home (79%), indicating a non-immigrant background. The socioeconomic status was relatively high in the sample (M = 2.45, SD = 0.42, scale 0–3).
Domain-specific functional limitation
As shown in Table I, cognitive functional limitations were more prevalent than physical limitations across all cut-offs. For example, using the ‘Often+’ cut-off, a lower percentage of children experienced limitations in vision (1.8%), hearing (2.1%) and moving (1.2%) compared to reading or writing (10%), concentration (9.8%) and understanding (13.9%). The prevalence rate for all six domains decreased notably when using the ‘All the time’ cut-off, as fewer than 3% of children experienced difficulties all the time in any of the domains. Similarly, the prevalence rate increased when using the ‘Sometime+’ cut-off.
Prevalence of domain-specific functional limitations, sorted by the three cut-offs.
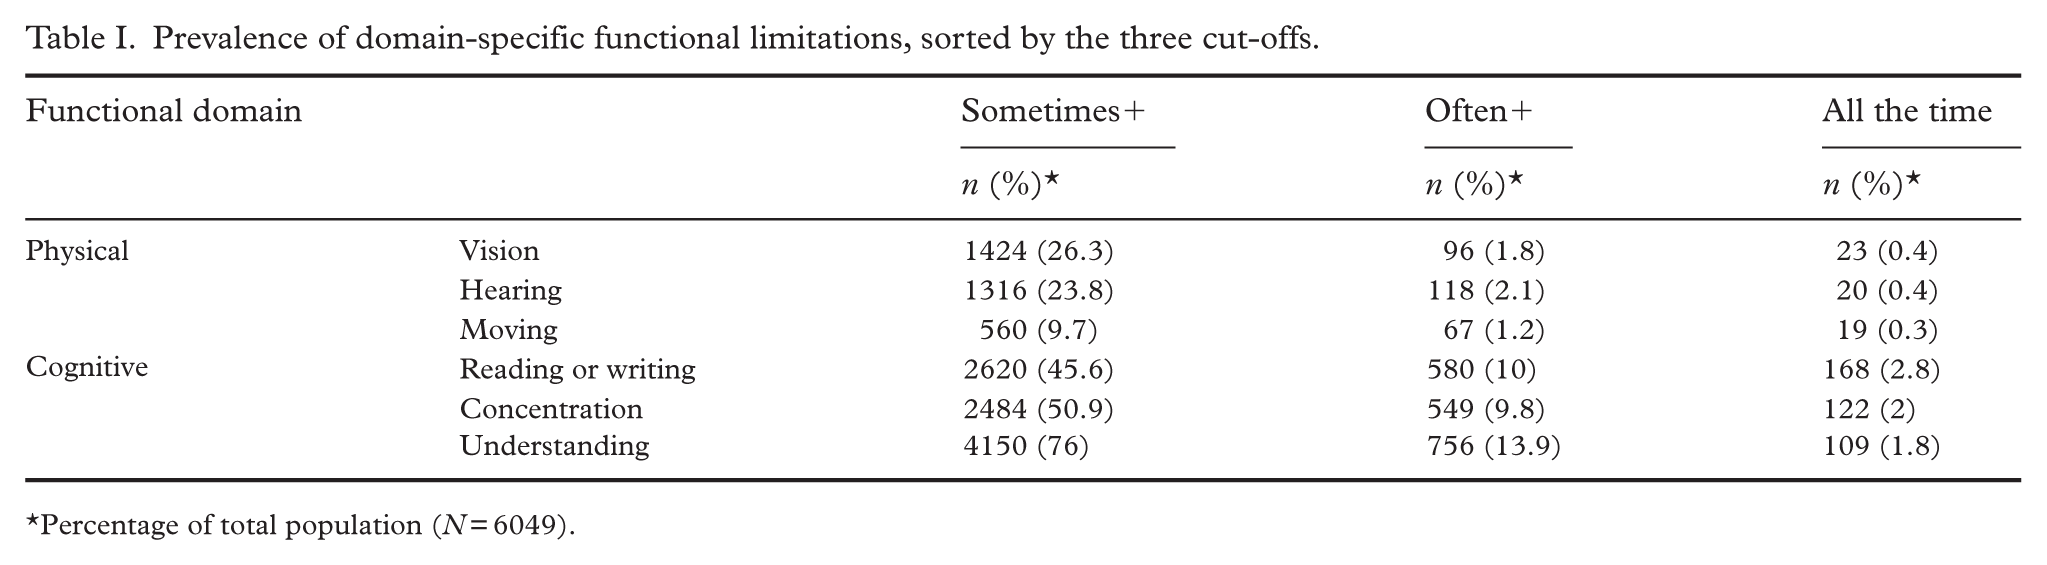
Percentage of total population (N = 6049).
Hindrance in school and leisure
Table II shows the prevalence of perceived hindrances in the school and leisure settings among children who reported functional limitations for each of the three cut-offs. For example, among children who experienced functional limitations using the cut-off ‘Sometimes+’, about 50% or fewer reported hindrances in school or leisure. The proportion who perceived hindrances increased with each of the two other cut-offs: ‘Often+’ and ‘All the time’.
Prevalence of self-reported hindrances in school and leisure for children identified with physical and cognitive functional limitations according to each of the three cut-offs.
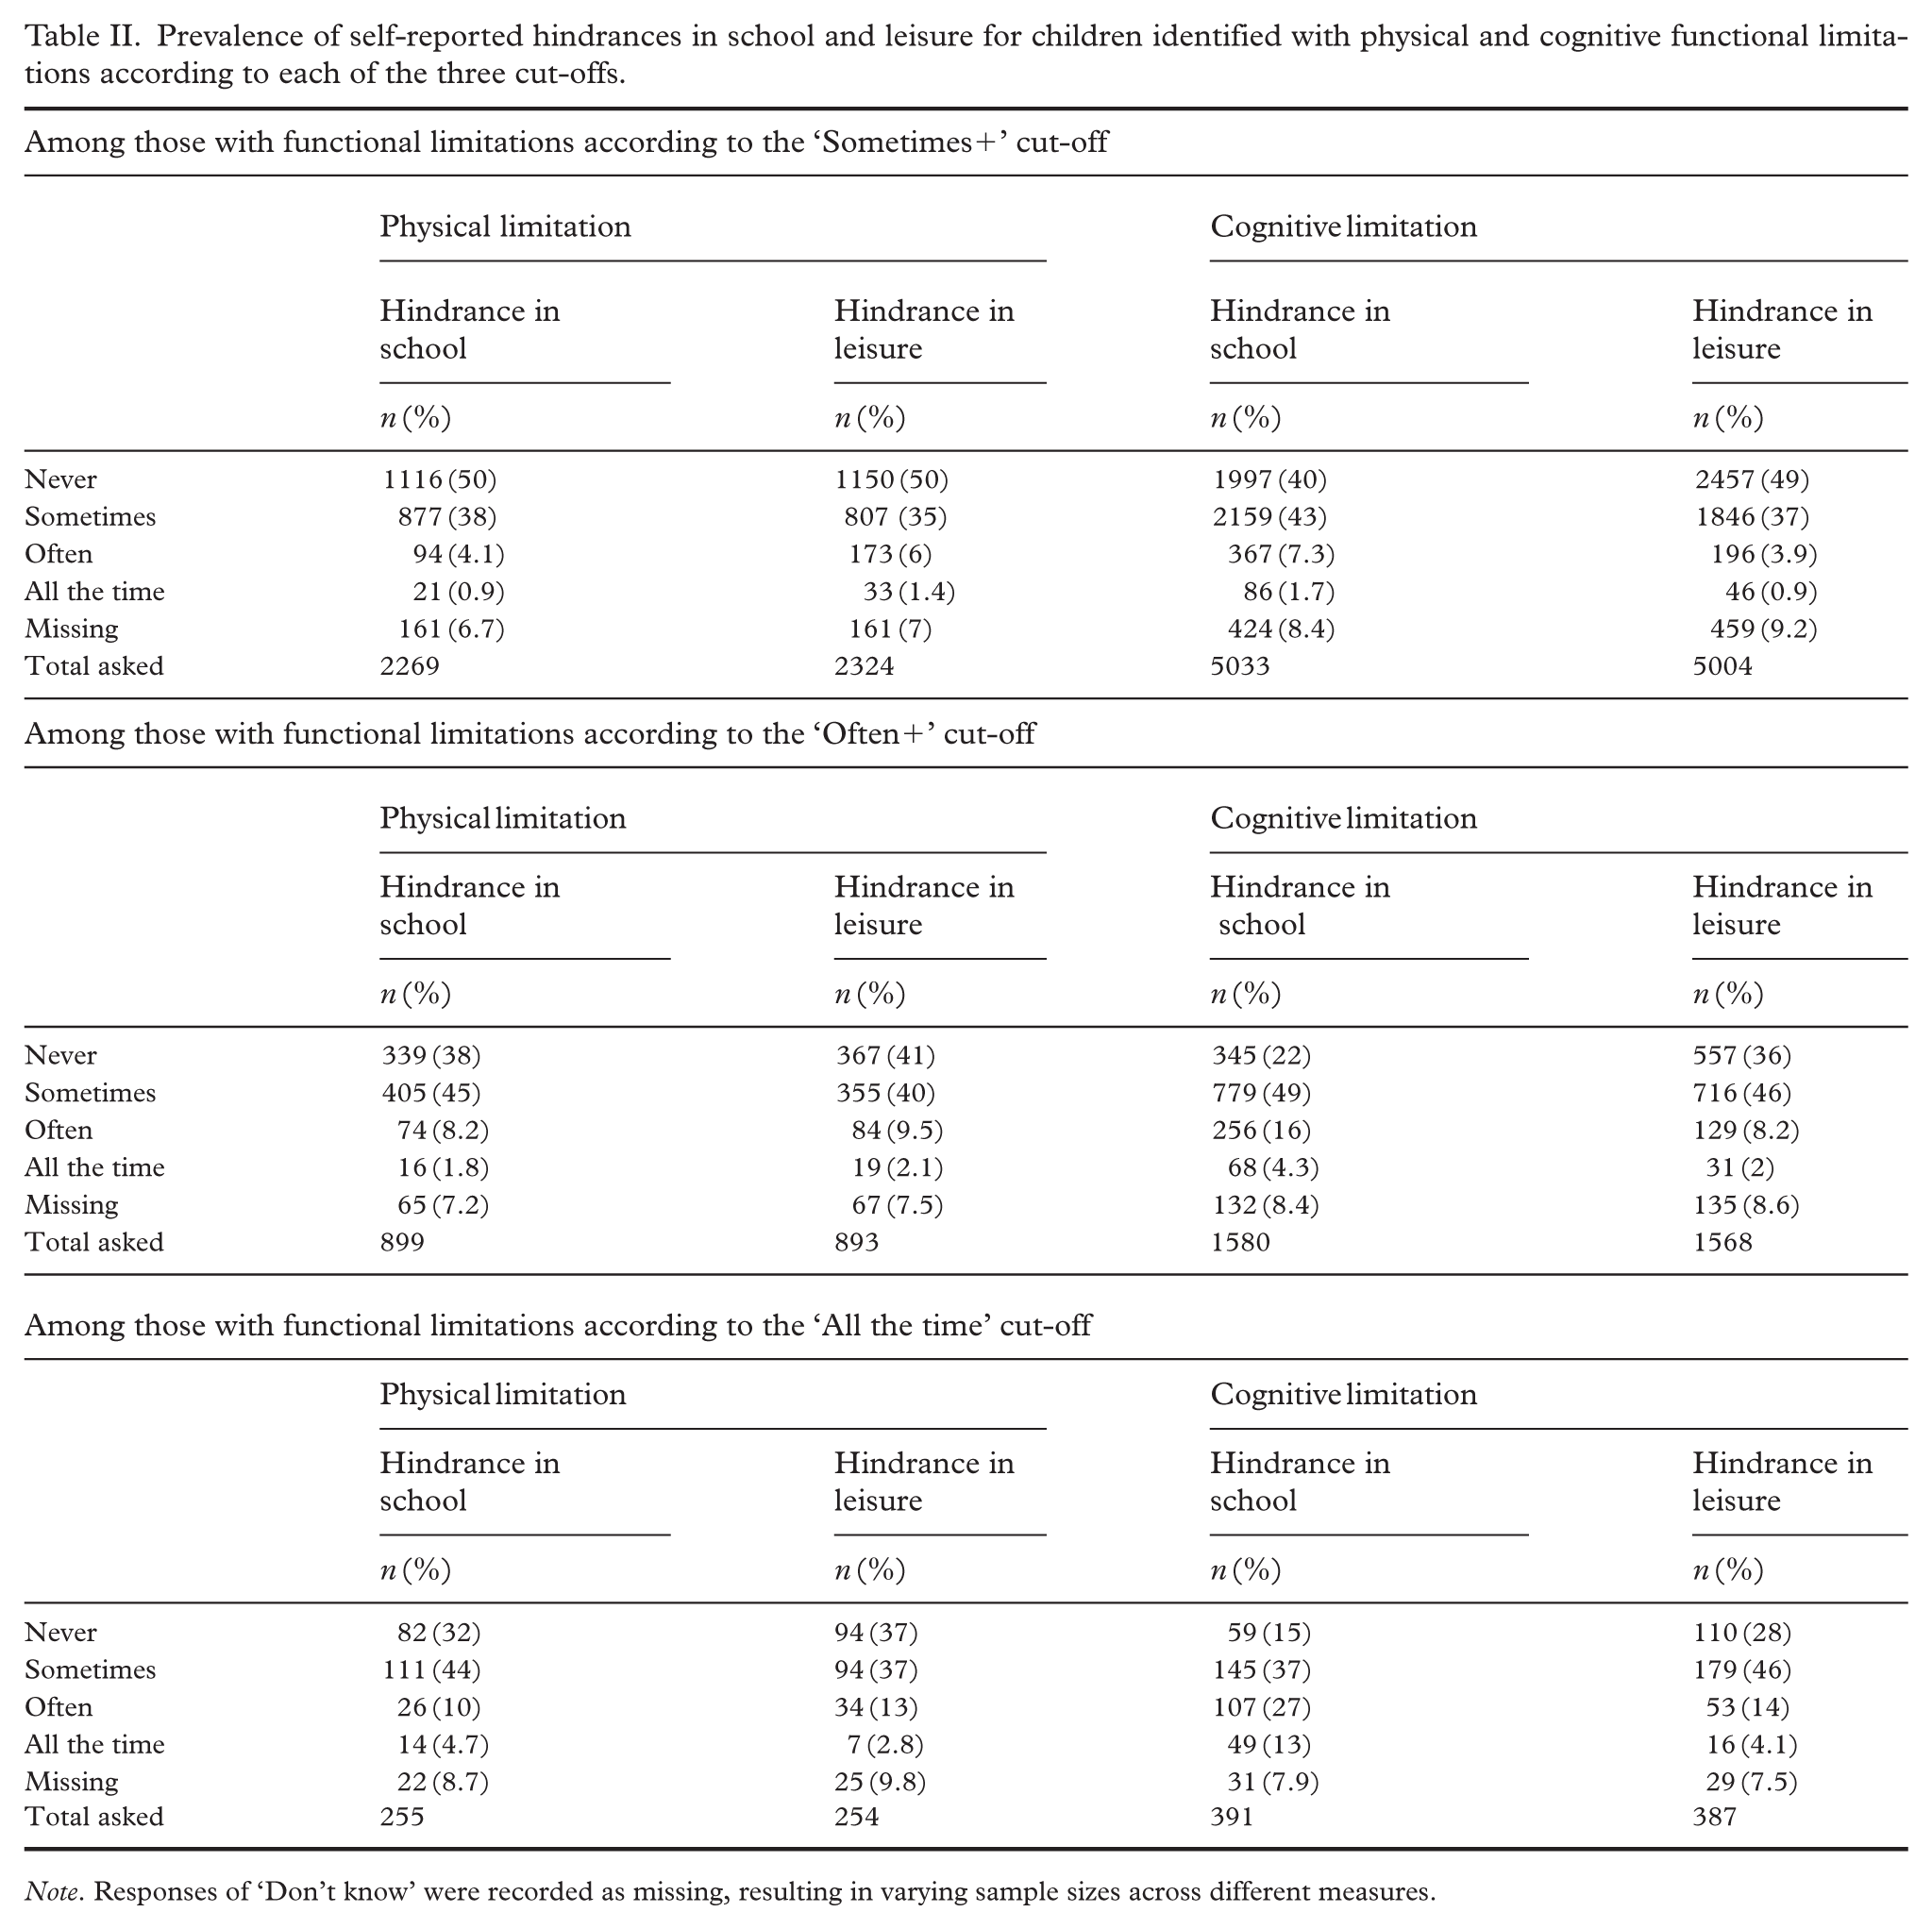
Note. Responses of ‘Don’t know’ were recorded as missing, resulting in varying sample sizes across different measures.
Prevalence of disability according to non-relational and relational models
Table III presents disability prevalences according to the non-relational and relational approaches for each of the three cut-offs. The prevalence rates were substantially lower across all cut-offs when using the relational model compared to the non-relational model. Further, for both measures, the prevalence rates reduced vastly from cut-off ‘Sometimes+’ (91%/61.2%), to ‘Often+’ (27.6%/8.2%), to ‘All the time’ (6.9%/1.2%). In accordance with domain-specific functional limitation results, cognitive disabilities were more common than physical disabilities across different measures and cut-offs.
Prevalence of disability according to non-relational and relational models for each of the three cut-offs.
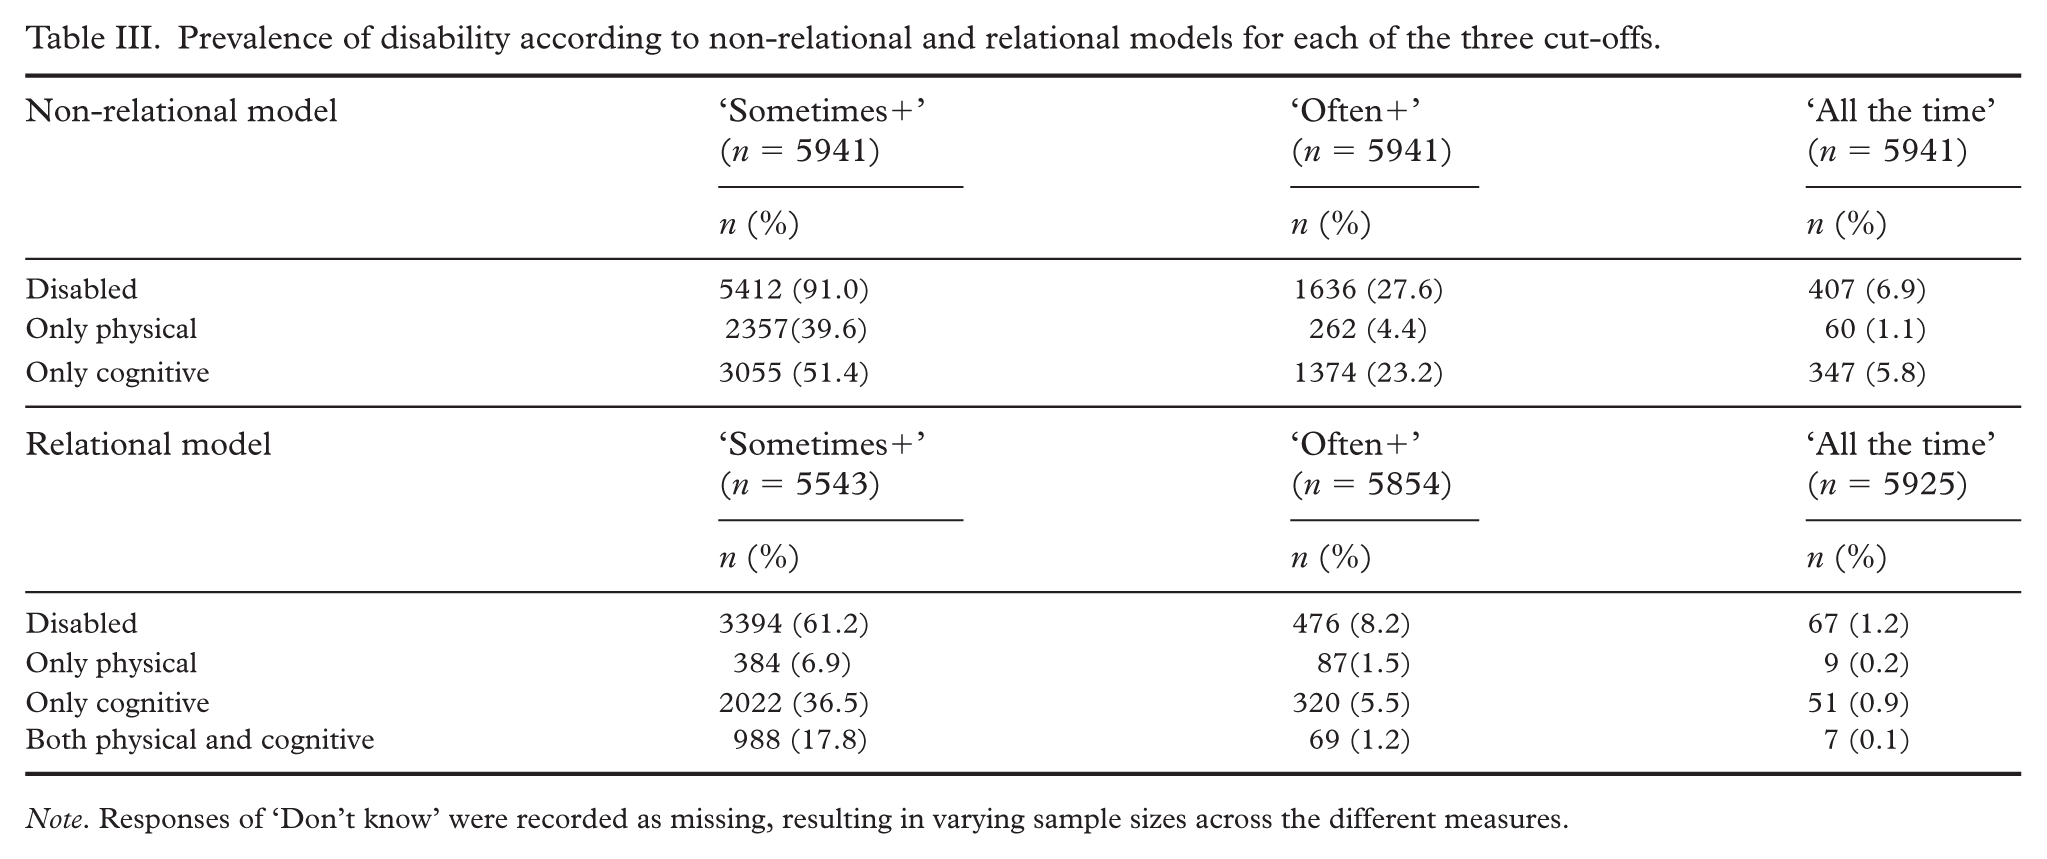
Note. Responses of ‘Don’t know’ were recorded as missing, resulting in varying sample sizes across the different measures.
Disability and life satisfaction
We used life satisfaction to illustrate the consequences that arise from applying different approaches to measure disability. As Figure 2 shows, across all measures and cut-offs, CWD reported significantly (p < .001) lower life satisfaction than their peers without disabilities with differences ranging from −0.9 to −2.28 on a 0 to 10 scale. The R² values indicated that disability status explained between 1% and 7% of the variation in life satisfaction across the different measures. However, differences were generally more pronounced when using the relational compared to the non-relational model.
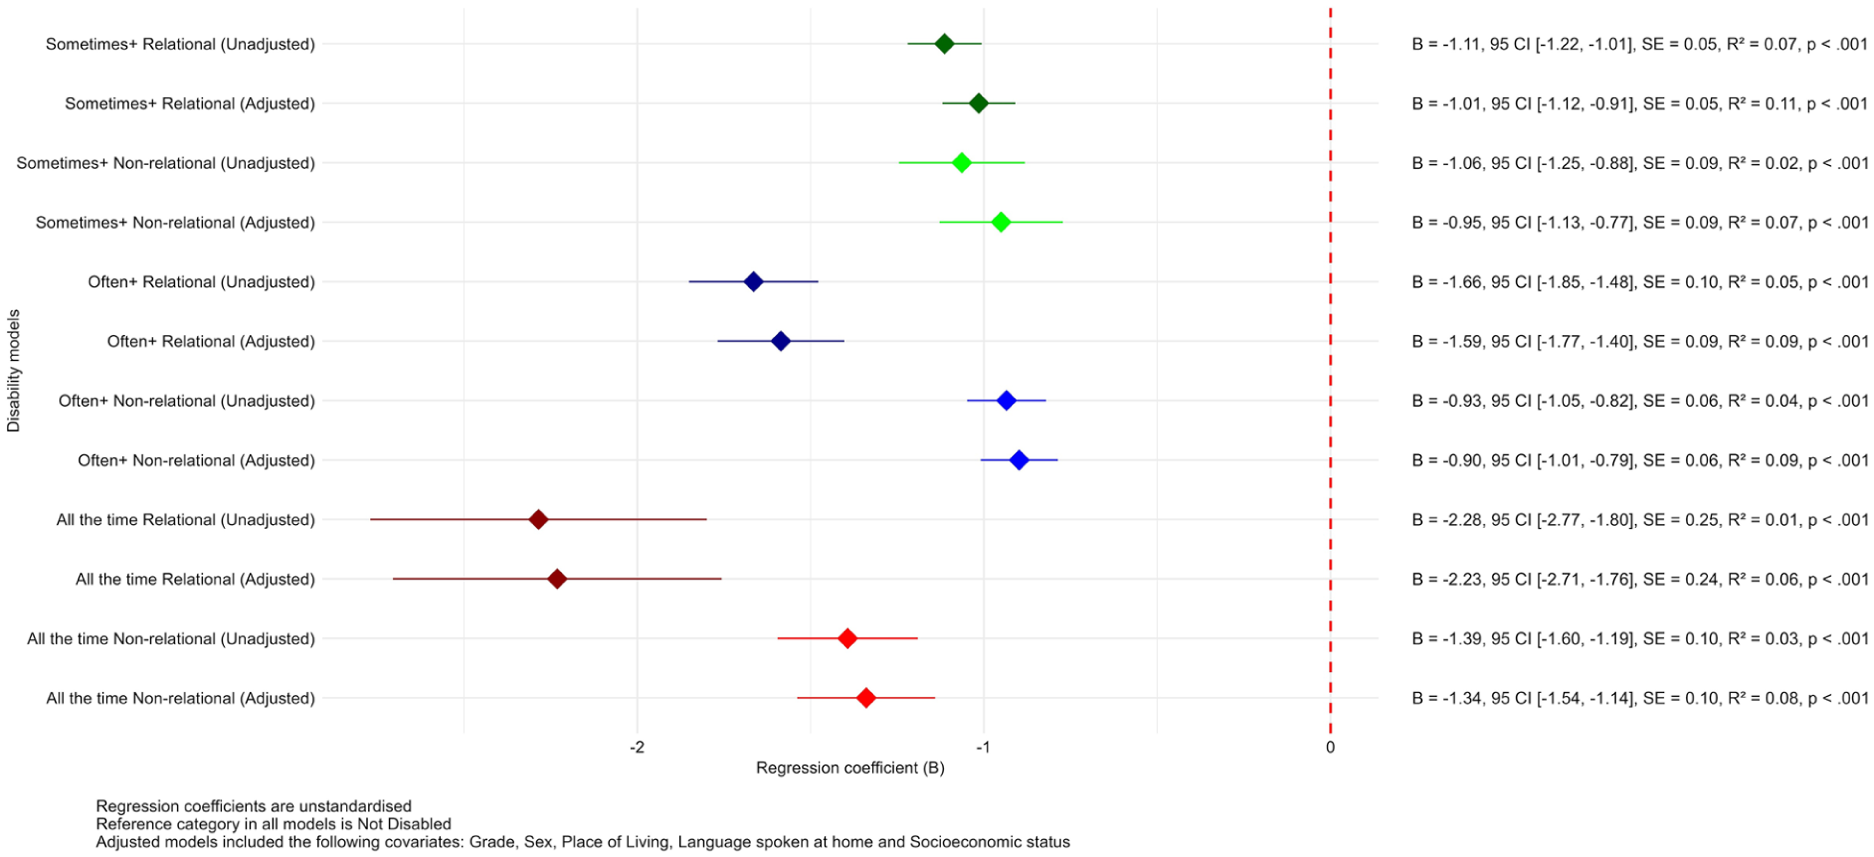
Forest plot illustrating the results of multivariate regression analyses showing the effects of disability status, measured through different approaches, on life satisfaction.
Discussion
To the best of the authors’ knowledge, our study is the first to assess disability prevalence within the framework of the relational model in a child population. Across all cut-offs, we found substantially lower disability prevalence rates in our sample of children when using a measure based on this approach compared to a non-relational one. For instance, with the ‘Often+’ cut-off, the prevalence dropped from 27.6% under the non-relational approach, which considers only functional limitations, to 8.2% under the relational model, where hindrances in school and leisure were also accounted for. This difference in prevalence suggests that having a functional limitation does not necessarily equate to having a disability, particularly when those limitations are not experienced as barriers in daily life. These findings align with other studies showing that children identified as disabled under a non-relational model may not always perceive their limitations as obstacles in their everyday life [20,24]. One could argue that the two-step operational definition of disability under the relational model, first asking about domain-specific functional limitations and then about hindrances, may, in itself, lead to a lower prevalence rate compared to the single-stage approach of the non-relational model. However, this intentional design reflects the fundamental concept of the relational model, which emphasises individuals who encounter societal barriers in addition to functional limitations [10,11]. This distinction is one of the key strengths of the relational model, as it shifts the perspective from impairment alone to the interaction between personal difficulties and societal factors. Therefore, the reduction in disability prevalence rates observed under the relational model should not be seen merely as an artefact of its operational definitions but rather as a meaningful finding. Furthermore, these results highlight how different theoretical frameworks for defining and measuring disability can lead to substantially different outcomes, which should be taken into account when comparing results across studies [7,9,13].
Furthermore, we observed significantly lower life satisfaction among CWD compared to their peers without disabilities across all cut-offs and measures. This finding aligns with a Canadian study by Daley et al. [3]. The larger differences in life satisfaction when applying the relational model, as opposed to the non-relational model, further support the relational framework’s idea that disability is not solely defined by functional limitations but also by the experiences of being hindered by societal barriers [10,11]. Accordingly, children may not experience or perceive themselves as having a disability because of their functional limitations alone – it is when they encounter hindrances in their daily lives that disability becomes a lived experience [10,11,25], which can negatively impact their life satisfaction.
Overall, the findings suggest that combining the identification of functional limitations with resulting hindrances in key life areas is essential for more accurately identifying CWD in surveys. This relational approach not only provides a more nuanced understanding of disability but also reflects children’s perspectives [26], offering valuable insights for researchers and policymakers in public health.
Furthermore, our study revealed significant discrepancies in disability prevalence rates across different cut-offs for both non-relational and relational measures. For example, the prevalence using the non-relational model decreased from 91% with the ‘Sometimes+’ cut-off to 27.6% with the ‘Often+’ cut-off. Similarly, the relational model’s prevalence dropped from 61.2% to 8.2% across the same cut-offs. The worryingly high prevalence rates under the ‘Sometimes+’ cut-off are particularly interesting. It is very likely that these, to a large degree, reflect temporal challenges in functional abilities rather than actual disabilities [27], thereby overestimating prevalence [28]. This interpretation aligns with prior research that has raised concerns about such middle response categories as they may be interpreted inconsistently [27–29]. These findings reinforce that cut-off choice strongly influences disability prevalence [8,9,18], emphasising the need for selecting cut-offs based on study goals [8].
To identify CWD through surveys using the relational model for the purpose of public health research and efforts, we do not recommend using the ‘Sometimes+’ cut-off. As discussed, the observed prevalence of 61.2% in this study would arguably overestimate the true population of CWD. Conversely, using the ‘All the time’ cut-off, indicating a prevalence rate of 1.2%, is likely to underestimate it. The ‘Often+’ cut-off, yielding a prevalence of 8.2%, appears to provide the most appropriate balance for reliably identifying CWD in this context. However, further research is needed to refine cut-offs and validate relational measures, as no single approach can fully capture a prevalence that includes all experienced disability, as noted by Molden and Tøssebro [7].
Limitations
This study has limitations. Firstly, while the relational model offers a more context-sensitive approach to identifying CWD, the operationalisation used, particularly concerning the questions on perceived hindrances in school and leisure, has certain constraints. Some children may underreport barriers due to a normalisation of exclusion from activities [30] or because they wish to be perceived as ‘ordinary’ and not to be different from their peers [25]. These dynamics may have led to an underestimation of experienced hindrances. Additionally, despite efforts to ensure the clarity of questions, some children may have struggled to fully understand the intended meaning of the disability questions, particularly those related to hindrances, due to their conceptual and linguistic challenges.
Moreover, the relational measure used school and leisure as markers for where children experienced being hindered, and we recognise that children may experience limitations in several other areas of life not covered by the measure. Overall, these potential limitations of the study indicate that the findings on the prevalence of disability should be interpreted with caution. Future research should therefore explore more nuanced and developmentally appropriate methods to assess the interaction between functional limitations and environmental barriers.
Additionally, this study’s cross-sectional design limits the ability to draw conclusions about the direction or causality of the relationship between disability status and life satisfaction. It is plausible that children with lower life satisfaction are more likely to perceive or report obstacles in daily life, including in school and during leisure activities. This potential for reverse causality should be considered when interpreting the results. Future longitudinal research is needed to understand the temporal and reciprocal relationship between disability experiences and subjective well-being. Finally, although the Ungdata Pluss project prioritised accessibility and inclusion during data collection [19,21], children with moderate to severe cognitive disabilities were likely to have been underrepresented in the sample. This may have led to an underestimation of disability prevalence.
Conclusion
This study underscores the complexity of measuring self-reported disability among children. Our findings indicated that the relational model offers a multidimensional understanding of disability by capturing both functional limitations and how these limitations hinder participation in two essential aspects of children’s lives. Additionally, this approach advocates for the children’s voices and provides valuable insights for public health initiatives and policy development. However, there is a need for further research that assesses disability within the framework of the relational model in diverse cultural and socioeconomic settings to evaluate its generalisability.
Footnotes
Declaration of conflicting interests
The authors declared no potential conflicts of interest with respect to the research, authorship, and/or publication of this article.
Funding
The authors received no financial support for the research, authorship, and/or publication of this article.