
Abstract
Aim:
A worry regarding young people’s physical activity engagement relates to a potentially competing development: the role of screen-based media (SBM) in their everyday lives. The present study aimed to assess time spent on different types of SBM, self-reported moderate-to-vigorous physical activity (MVPA) and physical activity in different domains and their interrelations.
Methods:
The study is based on data from 3737 participants aged 11, 13 and 15 years from Norway collected in 2021/2022 as part of the Health Behaviour in School-aged Children collaborative cross-national survey.
Results:
The findings revealed high amounts of total SBM time. There were age and gender differences in physical activity, especially with lower levels of active transport during leisure time among girls than among boys. A series of binary logistic regression analyses with adjustment for age, gender and socioeconomic status showed that high levels of total SBM time were negatively associated with involvement in club sports, active school transport, active travel to friends and leisure activities, and 60 min MVPA 5 days/week. Gaming and social media use were also negatively associated with most of the physical activity indicators. All SBM variables were negatively associated with involvement in club sports and 60 min MVPA 5 days/week.
Conclusions:
Keywords
Background
A physically active lifestyle has been associated with numerous health benefits for children and adolescents [1]. The alarmingly high prevalence of young people with insufficient physical activity levels globally [2] is therefore recognised as a major public health challenge [2]. To reduce the prevalence of physical inactivity, the importance of integrating structured physical activity into daily routines, especially among children and adolescents, has been highlighted [3]. More recently, there have been strong claims for the potential synergies between physical activity-promoting strategies and the United Nations Sustainable Development Goals (SDGs) for saving the planet and enhancing the quality of life [3–5]. The connections are supported by scientific evidence suggesting the strongest potential of physical activity strategies involves transport policies, urban design infrastructure and community-based programmes [4,5]. In line with this reasoning, the concept of sustainable physical activity has been introduced [6] and defined as ‘those activities that are conducted with sufficient duration, intensity, and frequency for promoting health, yet without excessive expenditure of energy for food, transportation, training facilities or equipment’ [6]. In other words, activities that have a low environmental impact and are therefore culturally and economically acceptable and accessible [6]. For children and youth, sustainable physical activity typically relates to active commuting, but it is also emphasised that leisure activities conducted locally and in sports clubs in the neighbourhood, allowing children and adolescents to walk or bicycle to their activities, could be advantageous [6].
However, the high prevalence of youth with insufficient physical activity levels suggests that the existing investments in policies and actions to promote walking, cycling, sport and active recreation are inadequate. With Norway as an example, accelerometer data from the national physical activity surveillance demonstrate stable high levels of 15-year-olds and a rising proportion of nine-year-olds not meeting the recommendations of moderate-to-vigorous physical activity (MVPA) over the last two decades [7]. Furthermore, active school transport has decreased worldwide, even if this decline seems to be levelling off in some European countries [8]. Nevertheless, the low prevalence of active school transport, especially among older adolescents, indicates significant room for improvement [8]. On a related note, visiting friends seems to have become less common among youth, making active transport to friends a less relevant contributor to daily physical activity. For instance, national trend data of adolescent Danes’ participation in the Health Behaviour in School-aged Children survey (HBSC) [9] showed that the proportion that spends time together with friends most weekdays after school had fallen steadily over the last 30 years from nearly 60% to 10–20%, depending on age and gender [10].
An increasing worry with regard to physical activity engagement among youth relates to a possibly competing development that screen-based media (SBM) has become central in their everyday life [11]. Screen media has been defined as ‘any media that is produced for or distributed via the screen, including the entire spectrum of what constitutes “the screen”: the cinematic screen, the television screen, the computer screen, and the small screens accessed on smartphones and other handheld devices’ [12]. According to the displacement hypothesis, the amount of time youth devote to screen activities can potentially displace the time they spend participating in physical activity [13].
The balance between SBM time and physical activity among youth has been recognised as a public health concern [14] and even more so during the COVID-19 pandemic, with limited opportunities for physical activity imposed on the youth population [15]. In the revised 2020 World Health Organization (WHO) guidelines on physical activity and sedentary behaviour for children and adolescents aged 5–17 years, it is recommended that ‘Children and adolescents limit the amount of time spent being sedentary, particularly the amount of recreational screen time’ [16]. The recommendation is based on evidence suggesting that higher amounts of sedentary behaviour, especially during recreational screen time, are associated with several adverse health outcomes [1]. The link is assumed to be the result of either direct effects of sedentary behaviour, displacement of time spent in more physically active behaviours, or both [1].
A meta-analysis of studies by Pearson and colleagues (2014) found a negative but small association between sedentary behaviours and physical activity among youth [17]. Such a relationship has also been supported by more recent studies of accelerometer-measured physical activity, with a modest inverse association between screen time and MVPA found among national samples of Norwegian children and youth [18]. Also, using 2 h a day of total screen time as a cut-off, which has been a national recommendation across several countries, a study of adolescents from 39 countries found negative relationships with both daily 60-min MVPA and, for girls, vigorous physical activity during leisure time [19]. Thus, previous findings suggest negative associations but also indicate that these behaviours do not directly displace one another.
Nevertheless, time on SBM among children and adolescents continues to increase [11,20], with the potential to displace more of the time that could have been used being physically active in different domains. Also, the type, function and format of SBM have evolved rapidly in recent years and are increasingly accessed through platforms and devices which are portable and multifunctional [12]. In this landscape, a nuanced assessment of SBM and physical activity behaviours could enable a more detailed understanding of these patterns and how they interact. Such information could contribute to the development of effective public health strategies to increase physical activity. Thus, the aim of the present study was, therefore, to examine time spent on different types of SBM, self-reported MVPA and physical activity on different domains and their interrelations.
Methods
Design and data collection procedures
The present study is based on data from the Norwegian sample of the HBSC study, a WHO study conducted in more than 50 countries and regions every four years [9]. The data were collected in 2021/2022 among a national sample of 11-, 13-, 15- and 16-year-olds with school classes as the sampling unit. Most of the data were collected in April and May 2022, with supplementary data collected at the secondary school level in October and November 2022. A total of 1264 primary and lower secondary schools, as well as 300 upper secondary schools, were contacted, with classes from 10% and 23% of the selected schools completing the survey, respectively. Among those who responded to reasons for not participating, a large proportion indicated that they did not have the time or capacity to carry it out. By comparing the geographical spread of the total student population with the respondents, one out of the 12 counties in Norway was substantially over-represented. At the class level, the participation rate among primary and lower secondary school students was around 80%, while 74% at upper secondary school.
The Norwegian Western Regional Ethical Com-mittee (REK) approved the study and the use of passive parental consent (id no: 346737). All participants were informed that participation was voluntary and that they could withdraw their consent at any point. The survey was completed digitally during school in a 45 min session after receiving standardised instructions from the teacher. The current study did not involve the 16-year-olds as some data on the study variables were unavailable for this group.
Measures
Mode of travel to school was assessed with the question: ‘On a typical day is the main part of your journey to school made by . . . ?’. Response options were ‘Walking’, ‘Bicycle’, ‘Bus, train, tram, underground or boat’, ‘Car, motorcycle or moped’ or ‘Other means’. A slightly different version of this item has shown acceptable reliability and significant correlation with the total accelerometer measured weekday physical activity, detailed elsewhere [8]. Those who responded ‘Other means’ in the current study were asked whether they travelled by scooter (yes/no) or electric scooter (yes/no). Walking and bicycle and scooter were categorised as active transport in the dichotomised variable. Mode of travel during leisure time was assessed with the question ‘How is MOST of your travel to leisure activities and friends?’ Response options were by ‘Walking’, ‘Bicycle’, ‘Scooter’, ‘Electric scooter’, ‘Car’, ‘Bus/tram’ and ‘Other’. Walking, bicycle and scooter were categorised as active transport in the dichotomised variable.
Participation in organised sports clubs was measured using a single question: ‘Are you a member of a sports club?’ with response categories ‘No’, ‘Yes, I train in a sports club’ and ‘Yes, but I don’t attend training sessions’. The measure has been used in several HBSC survey cycles [21]. Those responding ‘Yes, I train in a sports club’ were defined as active in the dichotomised variable. Data were not available for the 11-year-olds. For comparison with previous studies [21], descriptive data are presented both with and without those responding ‘Yes, but I don’t attend training sessions’ (3.2%) included in the sample.
MVPA was measured with a single item introduced by the following definition of physical activity intensity levels: ‘Physical activity is any activity that increases your heart rate and makes you get out of breath some of the time’. Examples were provided with the statement, ‘Physical activity can be done in sports, school activities, playing with friends, or walking to school’ before asking the following question: ‘Over the past 7 days, on how many days were you physically active for a total of at least 60 minutes per day? Please add up all the time you spent in physical activity each day’, with possible responses ranging from zero to seven days. The item has excellent test–retest reliability and reasonable validity [9]. In the analysis, >5 days/week was used as a cut-off, as initial findings showed that only a small proportion (17%) of the adolescents performed at least 60 min of MVPA daily. This number is substantially lower than the proportion of adolescents reaching an average of 60 min of MVPA daily in the national accelerometer study [7], reflecting the current global physical activity recommendations [13].
The SBM items were developed for the 2021/2022 HBSC study based on previous HBSC survey items, with the questions restructured and modified to capture current screen-time domains. Screen-time use was measured with the question: ‘In your free time: how many hours a day do you spend. . .1) Playing games on a computer, game console, tablet, smartphone, or smart TV, 2) Using computer and other electronic devices for social networks for example Instagram, Facebook, Twitter, Snapchat etc., 3) Watching TV, DVDs, or videos including internet videos on websites like YouTube etc. 4) Looking up for information on the internet, browsing the internet.’ The response categories were ‘None at all’, ‘About half an hour a day’, ‘About 1 hour a day’, ‘About 2 hours a day’, ‘About 3 hours a day’, ‘About 4 hours a day’, ‘About 5 hours a day’, ‘About 6 hours a day’ and ‘About 7 or more hours a day’ [22]. A test–retest study has shown a substantial correlation (intraclass correlation coefficient 0.61–0.79) for all items, and the item structure seems to reduce the overestimation identified in previous HBSC items on screen-time use [22]. A summary score for total screen time was computed, and the variable was categorised into three groups (⩽ 2 h/day, 3–5 h/day and ⩾6 h/day). This categorisation was also used for each of the other SBM indicators.
Socioeconomic status (SES) was measured by a summary score of ‘The Family Affluence Scale’ (FAS-IV), which is considered to be a valid SES indicator [23]. FAS-IV consists of six items measuring indicators of family affluence derived from the characteristics of the family’s household (family car, number of computers, own bedroom, family holidays, number of bathrooms, dishwasher in home) [9]. In addition, two items have been included in the Norwegian survey, specifically tapping affluence relevant to the Norwegian context (cottage or holiday home/apartment in Norway, cottage or holiday home/apartment abroad). The summary score ranged from 0 to 19, with FAS included as a continuous variable in the analysis.
Statistics
All analyses were conducted using IBM SPSS statistics, version 29. Summary statistics were estimated, and χ2 statistics and independent sample t-tests were used to examine gender differences in the variables studied. Next, to account for the clustered sampling design, the associations between and the sustainable physical activity variables were estimated using robust generalised linear mixed models with a random intercept for class ID. Binary logistic regression analysis for each physical activity indicator with adjustment for age, gender and SES was conducted.
Results
A total of 3737 participants were eligible for analyses. Within each age group, more boys than girls reported 60 min MVPA 5 days/week and used active transport during leisure time (Table 1). More 13-year-old boys than girls were active in sports clubs. With respect to SBM, boys reported more time gaming within each age group than girls. For social media use, the picture was the opposite. Gender differences were also observed for some of the age groups for TV, DVDs, videos, internet videos and for time spent searching for information/browsing on the internet, with higher levels among boys. The vast majority exceeded < 2 h of total screen time. Overall, the younger participants were generally more active in the various physical activity domains and tended to be less active on the screens compared with the older ones.
Summary of study variables across gender and age (N = 3737).
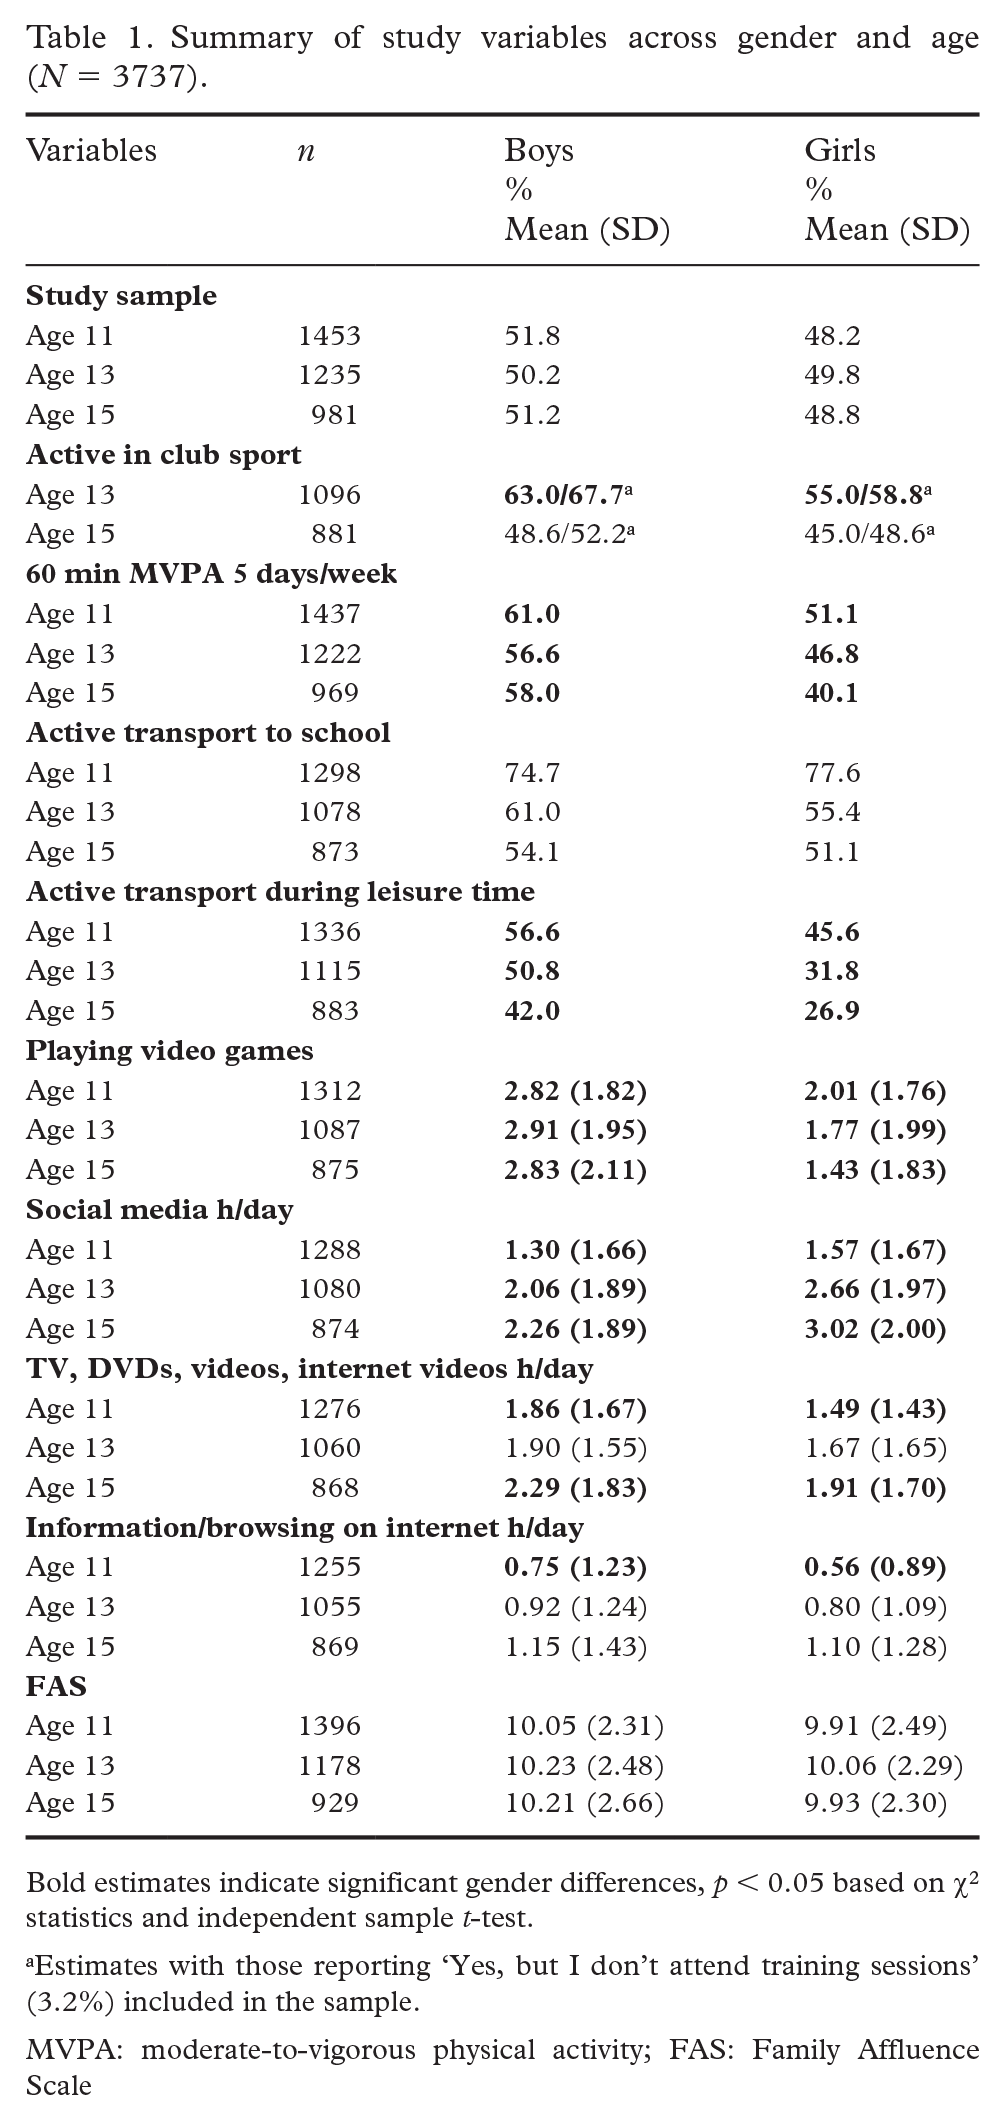
Bold estimates indicate significant gender differences, p < 0.05 based on χ2 statistics and independent sample t-test.
Estimates with those reporting ‘Yes, but I don’t attend training sessions’ (3.2%) included in the sample.
MVPA: moderate-to-vigorous physical activity; FAS: Family Affluence Scale
Figure 1 shows the modes of travel to school. Walking was the most common way of travelling. A substantially higher proportion of girls reported walking than cycling to school. For boys, the difference was marginal, resulting in large gender differences. Following active modes of travel, public transportation was most frequently reported, followed by private transportation (car, motorcycle, moped), which was less common. For those reporting other means, scooters contributed to a very small proportion (0.4%), whereas electric scooters contributed somewhat more (2.9%) to the total mode of travel to school. In regard to the mode of travel to leisure activities and to friends (Figure 2), large gender differences were observed. Biking was most common for boys (29.4%), followed by travel by car. For girls, travel by car was the predominant mode of travel (42.7%). About one-fifth of the participants walked to leisure activities and friends. Among boys, electric scooters were as common as public transport.
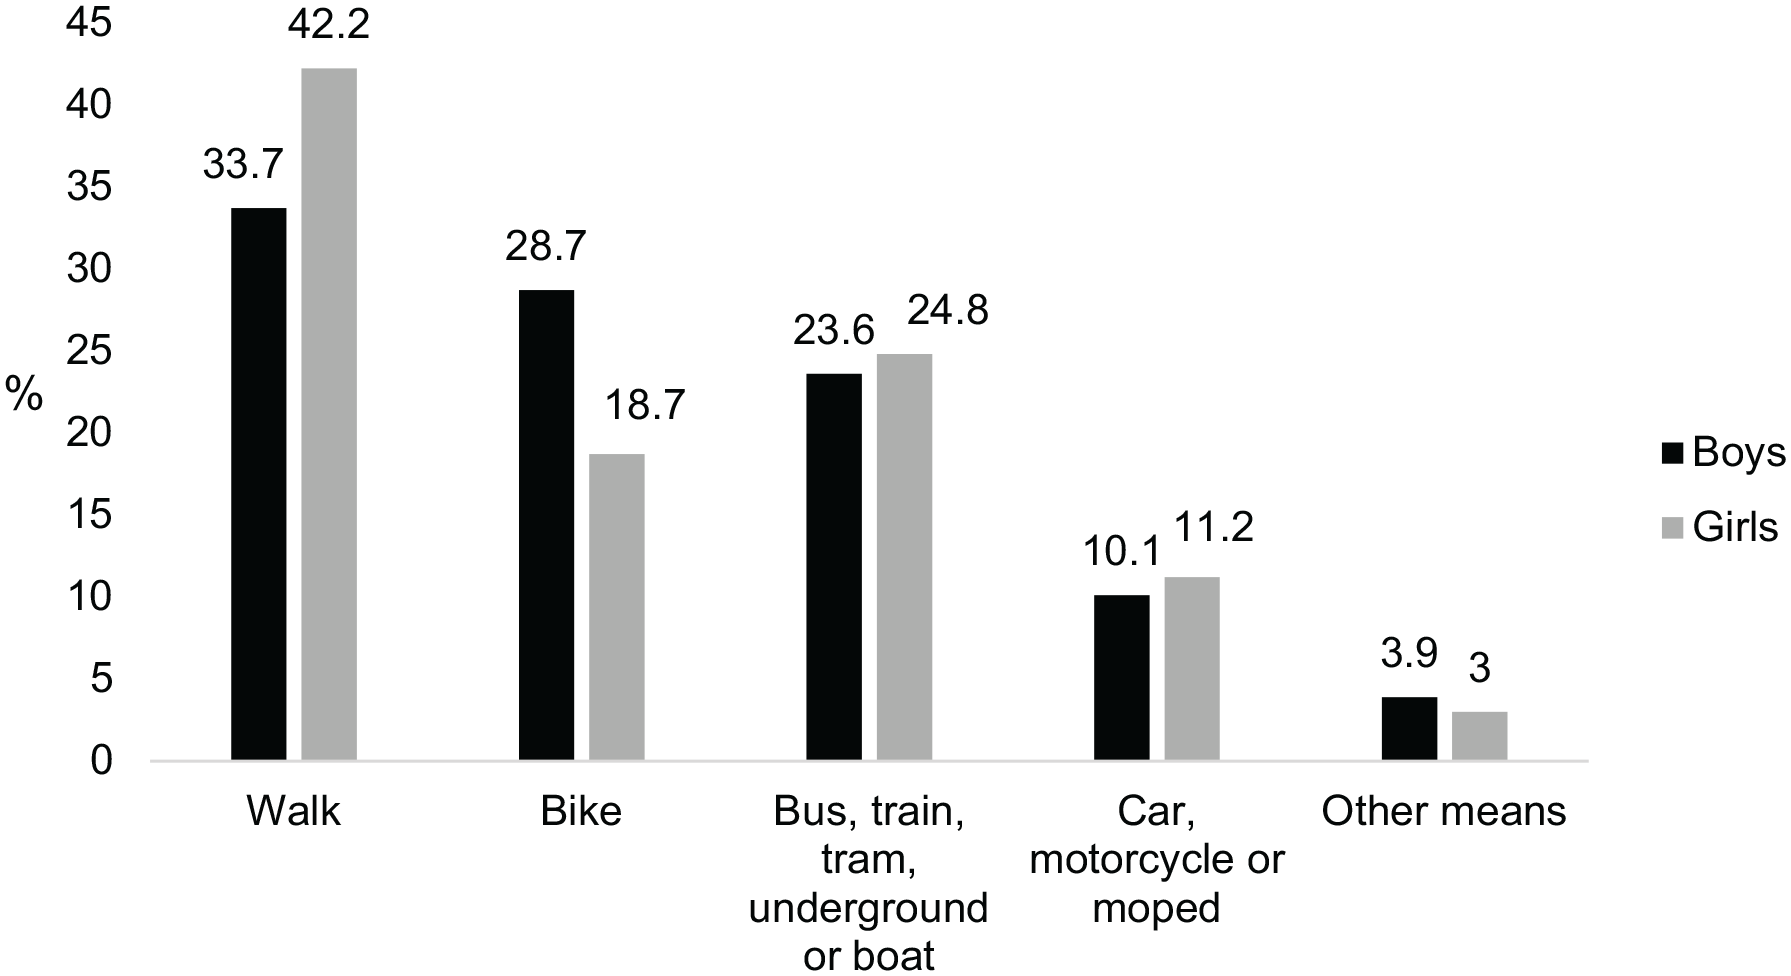
Main mode of travel to school for boys and girls.
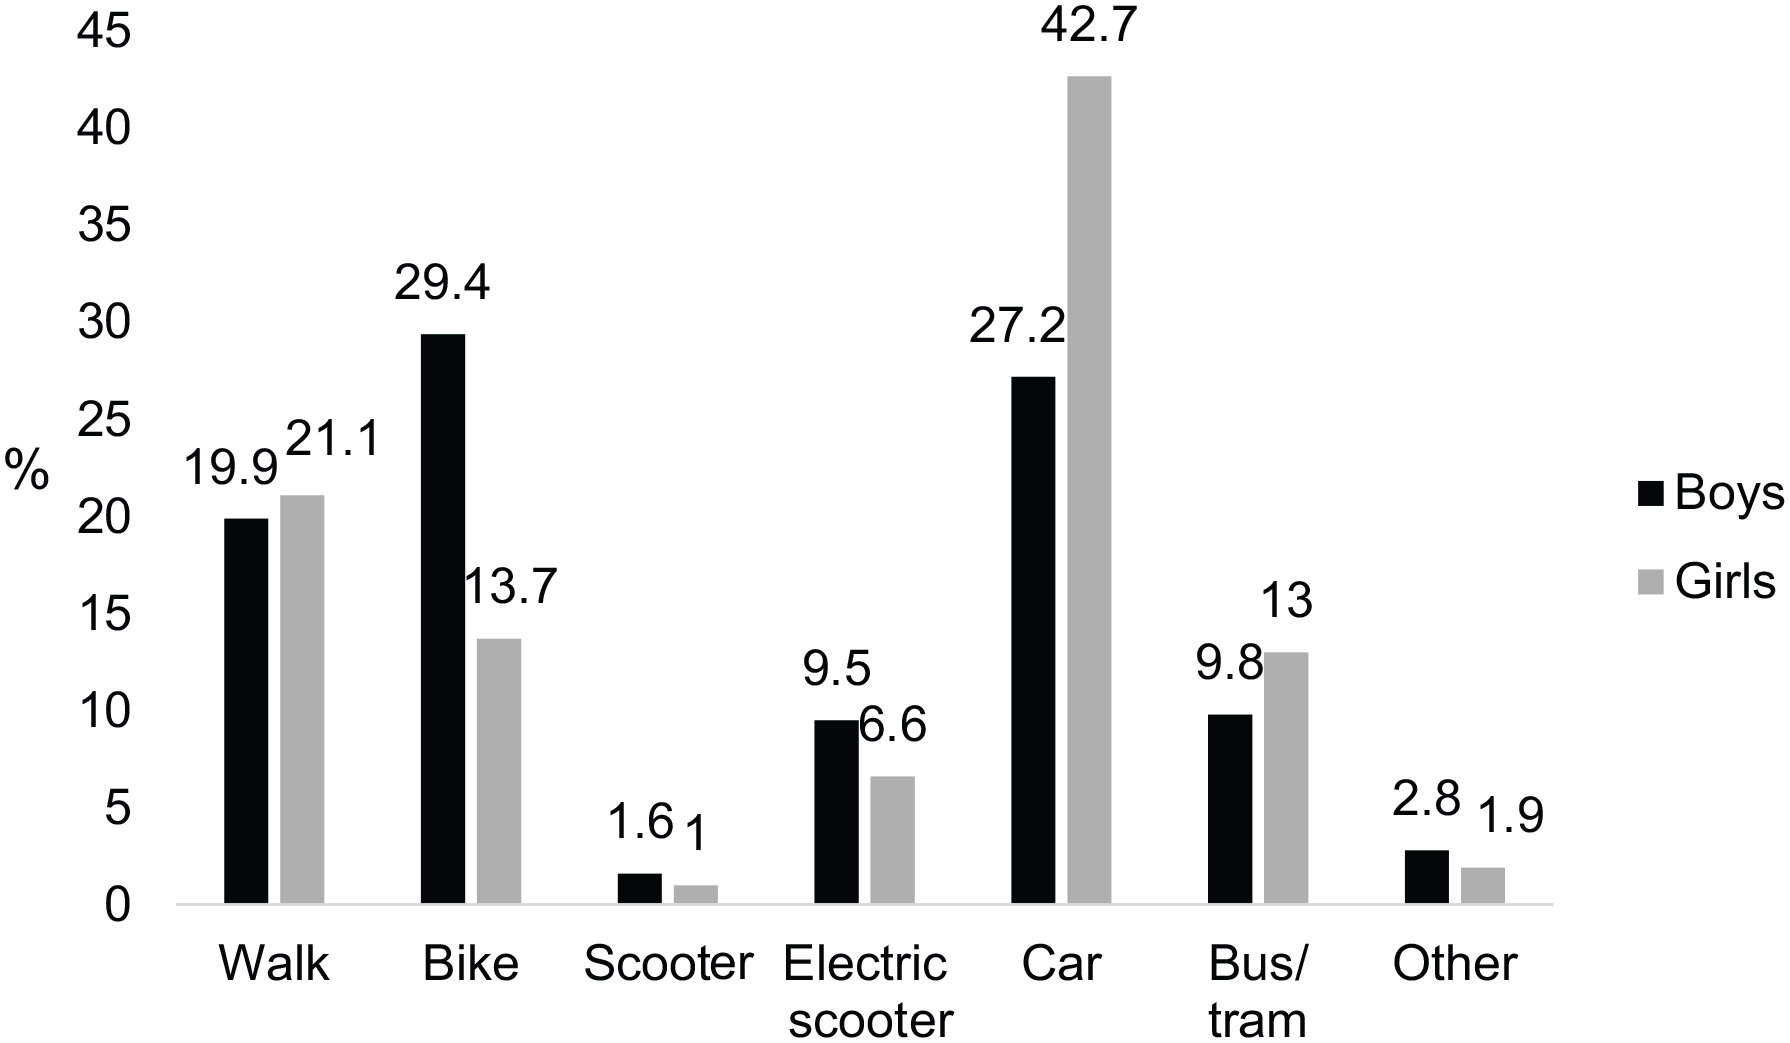
Main mode of travel to leisure activities and friends.
Figure 3 displays the daily time spent on various screen activities for the whole sample, including overall screen time that exceeded 7 h for boys, significantly higher than for girls (6.6 h/day). Gender differences were observed for all variables, the most pronounced for gaming.
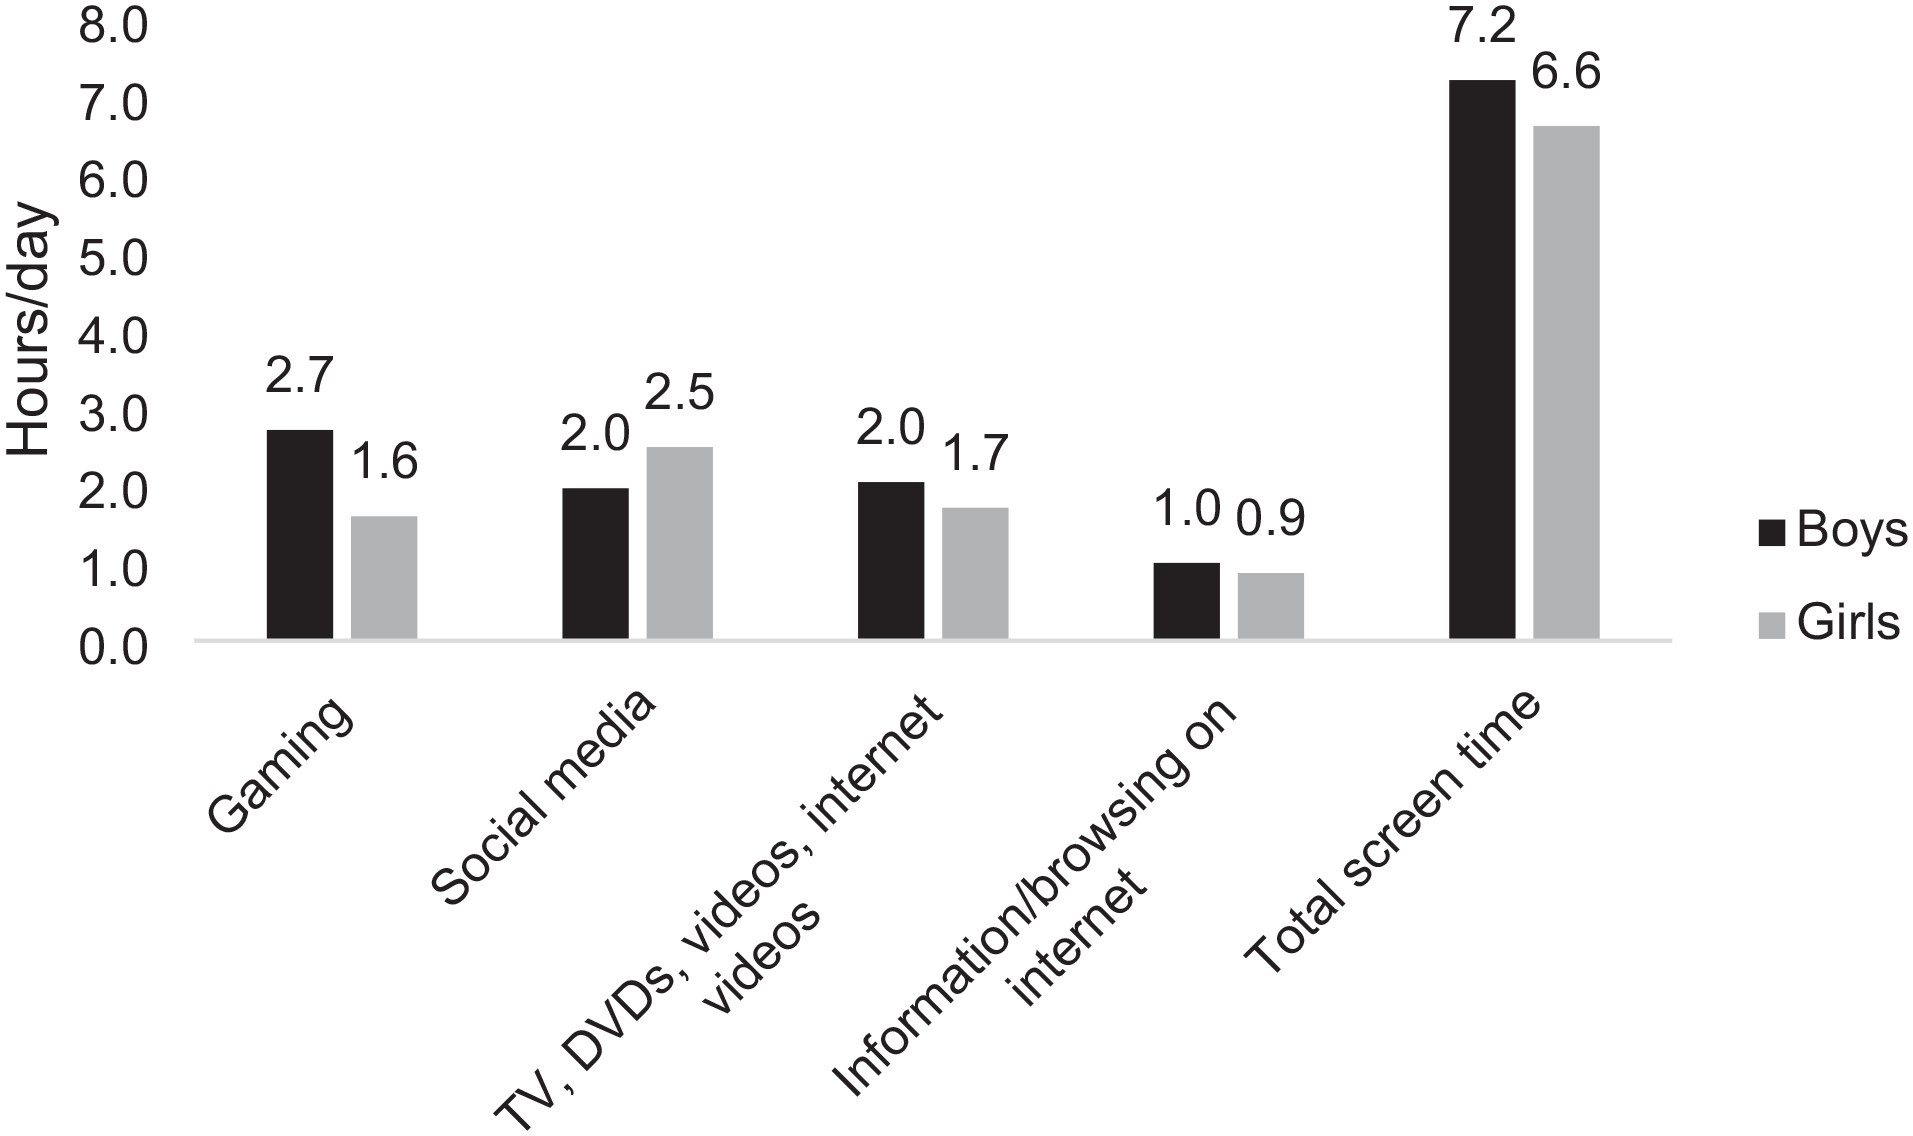
Hours per day of total screen time use among boys and girls.
As shown in Table 2, spending more than 2 h per day for each screen time behaviour was significantly associated with substantially lower odds of being active in a sports club and of achieving 60 min MVPA 5 days/week. The exception was those reporting a total screen time of 3–5 h/day. For each indicator, the odds were lowest for the groups that spent the most time on screen (⩾ 6 h), except for browsing on the internet. This group is, however, very small (2%), making the estimations less accurate. Gaming (⩾ 3 h/day), total screen time (⩾ 6 h/day) and social media use (3–5 h/day) were also significantly associated with lower odds of active school transport compared with the reference groups. The report of high total screen time use (⩾ 6 h/day) also reduced the odds of active transport to friends and leisure activities.
Associations between screen use and physical activity indicators were estimated by binary logistic regression, adjusted for age, gender and socioeconomic status.

⩽ 2 h set as reference category. Estimates in bold indicate significant at p< 0.05 level, logistic regression. Significant at: *p < 0.05, **p < 0.01, ***p < 0.001.
MVPA: moderate-to-vigorous physical activity; OR: odds ratio; CI: confidence interval
Discussion
The purpose of this study was to provide up-to-date knowledge on adolescents’ time spent on different SBM, physical activity involvement in various domains, and their interrelations. Data from the Norwegian 2021/2022 survey of the cross-national HBSC study revealed high amounts of total SBM time, with gaming being the strongest contributor for boys and social media use for girls. More than half of the participants were active in club sports. There were fairly high levels of active school transport for both genders and of active travel to leisure activities and friends among boys. After adjusting for age, gender and SES, the results showed that high levels of total SBM time (⩾ 6 h/day ) were negatively associated with each of the physical activity measures. Increased time on all of the SBM domains was negatively associated with being active in club sports and 60 min of MVPA daily 5 days/week.
The study indicates that young people spend much of their free time on screens. When summarising the reported time on the different SBM devices, about 90% of the youth reported more than 2 h of screen use per day, which is the contemporary paediatric guidelines related to SBM use in many countries [6]. The average of about 7 h/day in total SBM use exceeds or is similar to what has been reported in previous studies [11]. However, it is common for this age group to engage in multiple forms of screen-viewing at the same time, which should be taken into account [24,25]. Nevertheless, evidence suggests that higher amounts of sedentary behaviour, especially recreational screen time, are associated with several adverse health outcomes [26].
It has been suggested that because of the pervasive integration of SBM into the daily lives of children and adolescents, a reevaluation of recommended SBM use and exposure should consider the nuanced variations in screen-based patterns across specific screen activities, gender and age groups [11]. The study findings add to the field by documenting that, overall, older adolescents were generally more active on screens than younger ones. While boys devoted more time to gaming, girls exhibited another trend by allocating more time to social media usage. Within some age groups, gender differences were also observed for time spent on TV, DVD videos and internet videos, and searching for information/browsing on the internet, with higher levels among boys.
With regard to physical activity in the different domains, participation in sports in the Nordic countries is mainly linked to local sports clubs, with very little or no opportunity for school sports [27,28]. In this study, 65% of the 13-year-old boys and 56% of the girls reported being active participants in a sports club. For the 15-year-olds, the proportions were about 10% lower. The numbers are similar to those observed in the 2014 survey of the Norwegian HBSC study using the same measure [21]. One concern put forward during the pandemic was a ‘generation lost’ to sports [29]; however, our data do not indicate that. Participation in organised sports clubs has, over time, been high in Norway compared with other countries [21]. Previous research has pointed toward the high availability of sporting facilities, a well-established voluntary sports club sector, high levels of parental involvement, and growth in individual and social prosperity as reasons for the high levels [21,30].
The findings further suggest that Norwegian 11-year-olds are close to achieving the National Norwegian recommendation of 80% walking or biking to school [31]. These results are promising and document a long-lasting trend of high levels of active school transport [8], also observed in other Nordic countries such as Denmark and Finland [32]. This could relate to high rates of cycling in the Nordic countries [33]. However, active school transport falls substantially among students who have transitioned to secondary school, and this is also evident in other Nordic countries, such as Finland [32]. This may relate to a system with fewer and more centralised secondary schools, resulting in longer distances and a potentially less physical activity-friendly journey. A large body of research has identified the distance or time to travel between home and school as the strongest predictor of active school transport [8]. As the literature points towards an increase in the distance to school over time [8], school siting policies that take into account the proximity between schools and children’s homes could be one useful strategy to address one of the most important underlying drivers of active school transport [32].
Active transport to arenas other than school has received considerably less attention. In addition to being an important setting for physical activity, such independent travel can also provide access to destinations important for well-being and create opportunities for exploration and socialisation, supporting young people’s social and cognitive needs [34]. In this sample of adolescents, about half of the boys and one-third of the girls actively commuted to friends and leisure activities. The findings contrast with those of a large cross-national comparison, finding no significant gender differences in levels of independent mobility [35]. Our findings could be explained by the fact that more boys cycled, which was the predominant way of travelling. For girls, car use was by far the most common way to travel to friends and leisure activities. The gender differences in active leisure commuting increased with age, with a stronger reduction among girls. This is interesting, as previous literature has speculated on gender differences as a result of boys being granted greater independent mobility at an earlier age [35]. The findings may suggest different preferences and/or opportunities between boys and girls. Interestingly, electric scooters were as common as public transport for boys. More research on children’s and adolescents’ active or independent travel to non-school destinations can assist in moving the policy focus on young people’s transport planning beyond school-based travel [36], supporting the shift to a more sustainable world in accordance with the SDGs [3,5].
Not surprisingly, and in accordance with previous survey waves [37], there were clear gender differences in reporting 60 min MVPA 5 days/week, with substantially higher numbers among boys than girls within each age group. In comparison with data from the Norwegian 2014 HBSC survey, the proportion with at least 60 min MVPA 5 days/week has decreased among the 11-year-old boys and increased among the 13- and 15-year-olds. The decrease in MVPA among 11-year-old boys adds to a concerning trend of increased inactivity among younger children in Norway [7].
When examining the associations between SBM use and physical activity, high levels of total SBM (⩾ 6 h/day) use were negatively associated with each of the physical activity indicators, and 60% of the sample fell within this group. Negative associations with the physical activity indicators were also observed for time spent gaming and for social media use, except for active travel to leisure activities and friends. The negative associations with active school transport are interesting. It may be that shorter time spent getting to school is linked to motorised transport, which can free up time to be on screens. However, it is also likely that youth are on screens when spending time on motorised transport as most platforms are accessible on portable devices such as mobile phones. However, the cross-sectional nature of the data does not allow for examining whether SBM use is the reason for a lower likelihood of engaging in physical activity in line with the displacement hypothesis or whether less time spent on physical activity provides windows for more SBM activities. Longitudinal studies related to gaming, a behaviour that has been increasingly examined, may suggest both. Hygen and colleagues (2022) found a reciprocal relationship for boys with gaming at age 10 predicting reduced MVPA at age 12, upheld at age 14, and MVPA at age 10 predicting reduced gaming at age 12, upheld at age 14 [38]. A small reciprocal negative temporal association between physical activity and problematic gaming behaviour was also observed among university students during the pandemic when sociodemographic variables were adjusted for [39].
Extended time spent on each of the SBM was negatively associated with active participation in club sport and also with 60 min daily MVPA 5 days/week. The latter measure constitutes all physical activity of at least moderate intensity, including unorganised recreational activities. These findings are worrying, independent of the directionality. To the extent that the sports clubs are within acceptable walking or cycling distance, this leisure activity can be an important arena for sustainable physical activity [6]. Organised sports provide structures for social interaction, the development of skills, improved physical, psychological and social health, and also increased likelihood of meeting physical activity recommendations and levels of vigorous physical activity [21]. Further, youth sports participation also predicts higher levels of leisure-time physical activity in adulthood [40,41].
So far, interventions aimed at reducing SBM use in youth have shown only small overall effects [42]. Nevertheless, physical activity-promoting strategies in this digital age should continue to be supported as they hold the potential for both promoting health and reducing our environmental footprint, offering a better future for our youth in line with the United Nations SDGs [5]. Engaging, listening to and co-creating with youth seems like a promising way forward to create attractive arenas that can facilitate sustained physical activity [43].
Methodological considerations
The sample was based on a relatively large national study and represented different age groups with sufficient statistical power to categorise them into different screen-time use groups. A strength is also the use of well-established measures based on comprehensive methodological data collection procedures. However, the study has limitations. Although the study was based on data from a national Norwegian sample, the participation rate was low at the school level, and one out of Norway’s 12 counties was overrepresented, which potentially could have an impact on the representativeness. All data were self-reported and known to have recall and reporting bias [44]. However, most items have been documented to have satisfying validity and reliability [45]. It would have been relevant to also include settings for unorganised leisure-time activities, such as commercial gyms. Unfortunately, we did not have data on this. Finally, the study had a cross-sectional design, which makes it difficult to propose any causality.
Conclusion
The study suggests that the majority of adolescents are spending large amounts of their free time on SBM, a pattern that increases with age. Older adolescents are generally less active in the various physical activity domains, and there seems to be a large potential for active transport during leisure time, especially among girls. High levels of total SBM time and several of the SBM behaviours were negatively associated with all or most of the physical activity indicators. This latter finding adds new knowledge to the field, suggesting that a multifaceted approach is necessary to better understand the correlates of physical activity in different domains in the digital age. Additional studies with nuanced data on physical activity and SBM and longitudinal research designs allowing for the examination of interrelations of these behaviours over time are needed to understand more of the directionality.
Footnotes
Acknowledgements
I wish to thank Oddrun Samdal, the Principal Inves-tigator of the Norwegian HBSC study for use of data, and the schools and school children who participated. The data used in the current study can be requested from the corresponding author.
Declaration of conflicting interests
The author has no conflicts of interest to declare.
Funding
The author(s) disclosed receipt of the following financial support for the research, authorship, and/or publication of this article: FORTE (grant number: 2022-01357) and the Swedish Research Council for Sport Science (grant number: 2020/3, P2021-0065).