
Abstract
Aims:
This study aimed to identify subgroups of Norwegian retirees with similar trajectories of subjective well-being (SWB) across the retirement transition and to explore how various factors influence these SWB trajectories.
Methods:
The study employed growth mixture modelling to analyze longitudinal data, exploring the trajectories of life satisfaction, positive affect and negative affect in retirement transition. It also examined the influence of factors such as demographic, living arrangement, pre-retirement work conditions, individual characteristics and available resources on these SWB trajectories.
Results:
Contrary to the hypothesised three distinct SWB trajectories in retirement, the results more strongly support a single group solution for life satisfaction and positive affect. For negative affect, a two-group solution, consisting of one group with stable low and another with stable high negative affect, was preferred. The study identified several predictors of SWB trajectories.
Conclusions:
Keywords
Introduction
In response to concerns about the sustainability of welfare schemes with fewer workers per retiree, most European governments have implemented reforms to extend working life, such as increasing the retirement age or incentivising individuals to work beyond their retirement age [1]. Alongside these efforts, initiatives to promote healthy aging and increase older individuals’ participation in society have been launched globally, such as the United Nations Decade of Healthy Ageing (2021–2030) [2].
Subjective well-being (SWB) is an important measure of the success of public policy [3] and has a significant role in societies actions towards an aging population, as several studies demonstrate a relationship between health, longevity and SWB [4], underscoring its significance in the context of aging and retirement. SWB is a multicomponent construct, encompassing life satisfaction (LS) or how content individuals are with their lives and the extent of their experience of positive (PA) and negative affect (NA) [5].
Retirement can be considered as the time of leaving adulthood and entering old age, and argued as a fruitful period for public health efforts [6]. The majority of research on retirement transition indicate that there does not appear to be a uniform way it affects SWB [7,8]. Although retirement is associated with little SWB change for most, some studies suggest variability in how retirement transition impacts SWB [9]. Wang and Shi [10] describe that 70%–75% of retirees experience small or no changes, 9%–25% experience a decline and 5%–15% experience improvement in their SWB. Several factors influence retirement transition, including household factors, attachment to local area, physical health, financial status, personality traits, marital status and marriage quality, which have all been linked to retirement SWB [11–17].
Using latent class growth analysis (LCGA) and growth mixture modelling (GMM), studies in USA [14], Australia [18,19], Germany [13], Poland [20] and Sweden [21] have found primarily three SWB trajectories in retirement; stable, declining or improving. While these findings have given valuable insight into the heterogeneity of the retirement experience, studies exploring different growth curves remains sparse, particularly in the Nordic context. Notably, within the Swedish context, similar approaches exploring other phenomena or other approaches modelling SWB do exist [12,21,22]. Using GMM to investigate PA and NA trajectories in retirement has not previously been explored, but trajectories have been investigated more broadly in relation to healthy aging, revealing different numbers and shapes of trajectories for LS, NA and PA [23].
The present study investigates variations in how retirees experience the transition to retirement, using three common components of SWB (LS, PA and NA) as indicators of adjustment to retirement. This article examines two research questions:
Is it possible to identify subgroups of Norwegian retirees with distinct SWB (LA, PA and NA) trajectories across the retirement transition? Based on previous research, it is hypothesised that three groups will emerge: a majority experiencing little change in SWB, a group experiencing positive changes and a group experiencing negative changes in SWB during retirement.
To what degree does previously related factors for retirement SWB influence these trajectories? Higher education level and cohabitation are predicted to be associated with more stable SWB trajectories. Work-related stress before retirement is expected to correlate with lower initial SWB but a positive trend during retirement. Good physical health, financial satisfaction and social relationships are anticipated to align with stable SWB in retirement. Lastly, it is hypothesised that high levels of neuroticism and depression will be associated with negative SWB trajectories, whereas high extraversion will be associated with stable SWB trajectories.
Methods
Data
To answer the research questions, data from the Norwegian Life-course, Ageing and Generation (NorLAG) study [24] were used. NorLAG is a population-based sample of adults born between 1922 and 1966 in Norway that is representative of the age and gender distribution of the Norwegian population [25]. However, there is an under-representation of individuals with basic education in the sample, which gives some caution when generalising findings from this study, especially to individuals with basic education. The NorLAG data consist of three waves of survey data (2002, 2007 and 2017) as well as annual data from public registers (e.g. income, work, pensions, education and marital status). Data from all three waves are used.
Sample
The sample consisted of individuals transitioning from work to retirement during the survey period. Retirement year was determined using work-related income register data, following Hellevik et al.’s approach [26]. A control variable of health-related retirement was created by identifying participants receiving health-related benefits around the year of their retirement. The register-based method was chosen to ensure an consistent operationalisation across participants. Hellevik et al. [26] noted that Norway’s 2011 retirement reform gave individuals more flexibility to combine work and pension withdrawal from the national scheme, creating some conceptual challenges in Norwegian retirement research. Some individuals may report retirement as when they started withdrawing their pension, while others report it as the year they left their main job [26]. However, Hellevik et al. [26] found a high correspondence between subjective and register-based approaches.
To ensure that participants had retired during the survey period and ideally having data before and after retirement, participants who had retired between 2003 (first year after wave 1) and 2016 (last year before wave 3) were included. Participants who reported at the last wave that they considered themselves as working were omitted (n=86). This resulted in 1439 potential participants. As the main aim of this study was to explore trajectories of SWB, participants without any data points on SWB were omitted (n=96). On average, the participants had 2.16 data points in the well-being measures.
The final sample consisted of 1343 participants. Among these, 658 (49%) participated in all three data waves, 66 (5%) took part in the first and third waves and 619 (46%) were involved in the second and third waves.
Given that the data in NorLAG were collected at unequal intervals, with a five-year gap between the first and second waves and a 10-year gap between the second and third waves, a time variable was constructed that was centred at year of retirement (see Supplemental Table SI).
Measures
The Satisfaction With Life Scale [27] was used to measure LS. The measure consists of five items. Two changes were made in the NorLAG study: reduction of the rating scale from seven points to five points, and removal of one item in the third wave. Based on the four consistent items across all data waves, a mean LS score was computed. Reliability for the measure was satisfactory (α=0.79–0.81 between wave 1 and wave 3).
The short version of the Positive and Negative Affect Schedule [28] was used to measure emotional experiences. Mean scores for both PA (α=0.83–0.84) and NA (α=0.79–0.82) were used.
Health was measured using the physical components of the Short Form Health Survey [29]. The physical component score is based on six questions on physical health and standardised on a scale from 0 to 100, with a mean of 50 and a standard deviation of 10.
Depressive symptoms were measured using the Center for Epidemiologic Studies Depression Scale. The measure consists of 20 items that are summed to give a total depression score (α=0.79–0.83).
As a proxy for social relations, three items from the Loneliness Scale [30] were used. The three items were: ‘There are many people I can trust completely’, ‘I miss having a really close friend’ and ‘I find my circle of friends and acquaintances too limited’. The items are rated on a five-point scale and summed to give a total loneliness score (α=0.57–0.62).
Personality was measured using the Norwegian short form of the Big Five Inventory-20 [31]. The measure has 20 items, with four items measuring each of the five personality factors. The subscales of extraversion (α=0.74) and neuroticism (α=0.71) were used, as they are considered some of the strongest and consistent predictors of SWB [32].
Satisfaction with economic status was measured with a single item: ‘On a scale from 0 to 10, where 0 means “not satisfied at all” and 10 means “very satisfied”, how satisfied are you with your economic situation these days?’.
Attachment to the local areas was measured using a single item: ‘I feel that I belong where I live’. This was rated on a scale from 1=‘do not agree at all’ to 5=‘agree completely’.
Work-related stress was measured using a single item: ‘To what extent is your work characterised by a hectic and stressful work situation?’. This was rated on a scale from 1=‘to a large extent’ to 4=‘not at all’.
Where applicable, the variables were treated as time invariant and based on the first wave after retirement had occurred. In those cases where data were missing the first wave after retirement, data from the first observed wave after retirement were used. An exception to this was work-related stress, which was based on the last wave before retirement. Descriptives and correlations can be found in Supplemental Table SII.
Statistical analysis
To investigate if there are qualitatively different SWB trajectories in the retirement transitional process, this study uses GMM. This is often described as a person-centred analysis which focuses on the relationship among participants and aims to distinguish qualitatively different groups based on their response patterns [33]. This is different from variable-centred approaches that focus on describing the relationship between variables. Person-centred approaches are particularly useful for longitudinal studies, as they can “capture information about interindividual differences in intraindividual change over time” (Nesselroade (1991), as cited in Jung and Wickrama [33]). The procedure for GMM outlined by Ram and Grimm [34] was used. First, hypotheses were formulated about the expected number of different groups and their anticipated differences, as outlined in the literature review and specified in research question 1. Second, a baseline growth curve model was obtained using standard growth curve modelling procedures. Several models (no growth, linear or curvilinear) were fitted to the data to determine the best single-group representation of the data. With three time points available in NorLAG, only linear growth was modelled. Once a baseline model of growth was obtained for each SWB outcome, GMMs with two to four latent groups were specified, progressively increasing the number of parameters. Up to four latent classes were investigated, following recommendations to specify models with at least one more group than expected [34]. For all outcomes, models with fixed intercepts and fixed slopes (LCGA), random intercept and fixed slope (GMM1) and random intercept and random slope (GMM2) were considered. The fit statistics for all models are presented in Supplemental Tables SIII–SV. Several fit indices were used to evaluate the optimal number of classes. Models were compared using Bayesian and Akaike information criteria, with lower values indicating better fit [34]. Additionally, entropy statistics were used to assess the classification efficiency of the models and class separation [34]. Models with classes consisting of <5% of the sample were rejected [33]. A combination of these statistics were used in the final model selection. The last step involved introducing covariates and regressing them on the intercept and slope (for single class solution) and class membership (for multiple class solutions), with predictors standardised for simpler interpretation. There are different approaches for how and when to introduce covariates in GMM, and in this study, the conventional approach of assigning participants according to their highest posterior class membership probabilities followed by post hoc comparison of covariates’ association with covariates and class membership was used. Although there are more complex approaches that include covariates in class enumeration, we followed Ram and Grim’s procedure [34] as well as Grim et al.’s recommendation that class enumeration should be done without covariates, as this assures ‘that the classes are based on longitudinal trajectories and not the covariates’ [35].
All analyses were done using R (R Foundation for Statistical Computing, Vienna, Austria). For GMM, lcmm [36] was used. Lcmm handles missing data on the dependent variables through maximum likelihood estimation and assumes that the data are missing at random. Information about missingness for each variable can be found in Supplemental Table SII.
Ethics
The data used in this study are from a population sample in Norway where participation was voluntary and based on informed consent. The data collection conforms to the regulations of official statistics in Norway, and data were anonymised to ensure the confidentiality and privacy of the individual participants [25]. NorLAG data are available to researchers from approved research institutions.
Results
Life satisfaction
Fit indices suggested a one-class solution with random intercept and slope (Supplemental Table SIII), signifying that the optimal description of LS changes over time allowed individual differences in both initial values and rate of change.
Additional analyses explored conditional growth in LS with predictors included (Table I). While LS slightly increased over time, the effect was negligible. Health-related retirement was initially associated with lower LS, but this association became non-significant once the other predictors were included. Living arrangement had the strongest effect, where cohabitation having substantially higher initial LS compared to living alone. Higher levels of extraversion, physical health, income satisfaction and local area attachment were associated with higher initial LS. Conversely, higher neuroticism, depressive symptoms and feelings of loneliness were associated with lower initial LS.
Associations between predictors and LS and PA from the growth curve model.

p<0.05; **p<0.01; ***p<0.001.
LS: life satisfaction; PA, positive affect; SE: standard error; AIC: Akaike information criterion; BIC: Bayesian information criterion.
Positive affect
Fit indices suggested the one-class solution with random intercept and fixed slope (Supplemental Table SIV), signifying the best description of PA over time was a model allowing individual differences in initial PA but fixed to a similar rate of change.
Additional analyses explored conditional growth in PA with predictors included (Table I). A slight, but significant, negative slope of PA was observed. In the adjusted model, higher education was linked with higher initial PA, and health-related retirement with lower initial PA, although the latter was non-significant upon entering predictors. Initial PA was positively associated with extraversion, and negatively with depressive symptoms, neuroticism, loneliness and work-related stress. Physical health, income satisfaction, living arrangement and local area attachment were unrelated to LS.
Negative affect
The best fit indices indicated a two-class solution with random intercepts and fixed slopes (Supplemental Table SV), suggesting two distinct retiree groups with similar NA trajectories. In this two-class solution, 7% were likely to belong to a group with a stable high trajectory of NA (class 1), whereas 93% was likely to belong to a trajectory with stable low NA (class 2). Class 1 had higher initial NA (3.0) and a stable trajectory, whereas class 2 had lower initial NA (1.7) and a slight decreasing trend over time (Est=−0.01, SE=0.001). The trajectories are plotted in Figure 1.
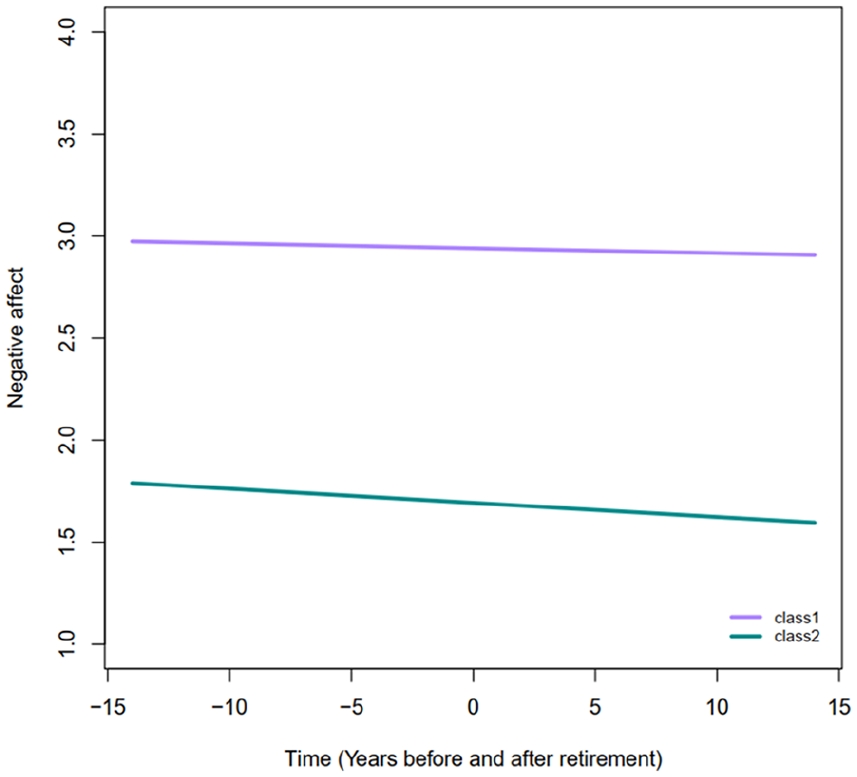
Predicted trajectories for negative affect in retirement.
Predictors of negative affect trajectories
Table II shows the logistic regression results identifying predictors of class membership. Neuroticism, depressive symptoms and work-related stress were significant predictors of membership in the stable high NA trajectory class.
Results from logistic regression predicting NA latent class.

The dependent variable is latent class, coded so that 0=‘stable low negative affect’ and 1=‘stable high negative affect’. The model has substantial explanatory power (Tjur’s R2=0.30).
NA: negative affect; OR: odds ratio; CI: confidence interval.
The potential impact of missing predictor data was assessed using multiple imputations, creating five imputed datasets. Logistic regression models were fitted to these datasets to predict NA trajectory class membership. Both the imputed and the original analysis yielded similar overall patterns, with slight differences in the estimates and no changes in statistical significance (Supplemental Table SVI), indicating the robustness of the original results despite missing data.
Discussion
Based on research suggesting discernible SWB trajectories in other contexts, similar trajectories were hypothesised for Norway, with demographic, work-related and individual factors, and available resources would be related to these trajectories. However, few hypothesised relations were supported, as discussed below for each SWB construct.
Negative affect
Different trajectories in SWB were only observed for NA. However, the number of groups and pattern of change differed from expectations. The majority of participants had stable low NA, aligning with other studies that found that most participants maintain high SWB in retirement [13,14,18–20]. The other identified class also demonstrated a stable trajectory but with considerably worse NA. Moreno-Agostino et al. [23] found similar trajectories for NA among Spanish participants in retirement age and that depression was associated with NA trajectory. This aligns with the findings in this study where an association was observed between depressive symptoms and membership in the worse NA trajectory. Consistent with previous research [16], work-related stress increased the probability of worse NA trajectory.
Neuroticism was the strongest predictor of belonging to the worse NA class, with higher neuroticism nearly tripling the likelihood. Hansson et al. [12] found personality traits indirectly associated with initial values and LS trajectory during retirement transition, with the strongest effects seen for extraversion and neuroticism. They concluded that retirees with higher neuroticism are most vulnerable to retirement adjustment. This study supports neuroticism’s importance for NA but not the link between extraversion and NA. Personality traits have not been investigated in relation to qualitatively different trajectories of SWB in retirement, and this study adds to the literature in this sense.
Life satisfaction and positive affect
No evidence was found to support the hypothesis of different SWB trajectories for either LS or PA. This is in contrast to previous research that identified heterogeneity in LS development during retirement [13,14,18,19]. However, the one-class solution showed variability in both intercept and slope. Conditional growth analysis revealed that neuroticism and extraversion were significantly associated with initial LS and PA values, with neuroticism showing similar effects for both outcomes and extraversion being stronger for PA. Extraversion’s positive relation with SWB in retirement may be due to more positive attitudes towards retirement and fewer adjustment problems [37]. Hansson et al. [12] argue that extraverted individuals are more likely to be active in the process, engaging in more social activities and finding new social relations in retirement. On the other hand, higher neuroticism levels have been associated with a more negative retirement evaluation [38] as well as more indirectly through its negative effect on self-esteem, autonomy and social support [12].
In this study, neuroticism was a significant predictor of all three SWB outcomes, aligning with research showing a common genetic factor influencing both neuroticism and SWB [39]. This common factor has also been linked with depression [39], which was a significant predictor of all SWB outcomes in this study. Given the importance of neuroticism on all three SWB outcomes, strategies to reduce or manage this personality trait could be worth considering in public health efforts. Although a common assumption is that personality does not change in adulthood, there are indications that personality traits change throughout the lifespan and also can be targeted in interventions [40,41].
Living arrangements and loneliness showed different associations with LS and PA. Cohabiting retirees had significantly higher initial LS compared to those living alone, in line with previous research [13,14,18]. Loneliness was negatively associated with initial LS and PA, aligning with previous findings that satisfaction with social relationships is a significant predictor of retirement PA [42] as well as a determinant for older adults’ PA and LS more generally [23]. Local area attachment after retirement significantly predicted initial LS, highlighting the role of community for retirement LS [17], especially as it becomes retirees’ primary setting [43]. Community is therefore an important setting in which retirees find social relations, purpose and structure [44]. Lastly, while higher income satisfaction was associated with initial LS, it was not associated with PA, reflecting the consistently shown positive relationship between economic position and SWB, particularly for LS [45].
Overall discussion
This study supports previous research suggesting retirement as a neutral life event that is not associated with overall changes in SWB [8,9]. While previous studies identified SWB variability in retirement [13,14,18,19], this study primarily found stable SWB for LS, PA and NA, with some variability in initial NA values. These divergent findings could be due to dataset characteristics, cohort differences and the Norwegian context. With only three waves of data collected, modelling was limited to linear growth, whereas studies with more data points could model more complex, curvilinear or piecewise growth [13,14,18]. Additionally, the long and unequal intervals (5 and 10 years) between time points may not lend itself to discovering short-term SWB changes in retirement. Nonetheless, the finding of relatively stable SWB in retirement is consistent with a body of research [8,12,46].
Participants in this study, retiring between 2003 and 2016, belonged to a different age cohort than those in Wang’s [14] and Pinquart and Schindler’s [13] studies. Changes in well-being related to age and retirement could be associated with comparable processes across cohorts, but cohort-specific experiences [47] could also contribute to differences. The divergent findings of this study may partly stem from the possibility that older cohorts, as examined in the aforementioned studies, exhibit more variability in their SWB trajectories. The unique experiences and challenges faced by these older cohorts could have led to a wider range of responses to retirement, resulting in greater variability in SWB over time.
Finally, the diverging results could be attributed to the context of the data and the welfare system in Norway. The observed stable SWB in retirement may be a result of the Nordic welfare system. Norway and its Nordic counterparts are known for their comprehensive and generous welfare system [48] and have consistently been among the top 10 in global SWB surveys [49]. This so-called Nordic exceptionalism in SWB is described by Martela et al. [49] as a positive spiral involving many factors, where generous and effective social welfare benefits are one important component.
Limitations
This study has several limitations. First, the three waves of data collection and their long and uneven intervals have already been discussed. Second, participant involvement varied, with approximately 50% participating in all three waves and 50% in two. However, the analysis methods used, GMM and LGCM, effectively handles missing outcome variable data using maximum likelihood estimation. Third, the study’s determination of retirement time did not account for gradual retirement, potentially limiting the findings’ comprehensiveness. Lastly, some SWB predictors were based on single items, which may not fully capture their complexity.
Conclusions
Despite these limitations, this study provides valuable insight into SWB trajectories during retirement transition, exploring multiple SWB aspects (LS, PA and NA). Further, all SWB outcomes were based on established multi-item scales, in contrast to comparable research primarily relying on single-item measures of LS. The study updates knowledge on SWB trajectories for younger cohorts and different contexts, suggesting retirement as a neutral life event with stable SWB trajectories and not something that most prospective retirees need to fear.
Factors identified as associated with initial LS and PA and with being in the stable high NA class provide valuable insights for researchers and policymakers aiming to improve retirees’ SWB. From a practical standpoint, the results of this study underscore the importance of considering a broad spectrum of individual characteristics and circumstances when developing interventions or policies intended to support well-being in retirement. Based on this study, interventions targeting several aspects, such as promotion of attachment to local area, extraversion and income satisfaction, as well as the reduction of neuroticism, depressive symptoms and work-related stress prior to retirement, could be beneficial.
Supplemental Material
sj-docx-1-sjp-10.1177_14034948241291091 – Supplemental material for Exploring variations in subjective well-being among Norwegian retirees: A growth mixture modelling approach
Supplemental material, sj-docx-1-sjp-10.1177_14034948241291091 for Exploring variations in subjective well-being among Norwegian retirees: A growth mixture modelling approach by Lars Bauger in Scandinavian Journal of Public Health
Footnotes
Acknowledgements
Valuable input and discussion on early work on this manuscript were provided by Tale Hellevik and Katharina Herlofson from NOVA at OsloMet. The syntax for operationalising retirement time, generously contributed by them, proved instrumental to the success of the manuscript.
Declaration of conflicting interests
The author declared no potential conflicts of interest with respect to the research, authorship and/or publication of this article.
Funding
The author(s) disclosed receipt of the following financial support for the research, authorship, and/or publication of this article: FORTE (grant number: 2022-01357) and the Swedish Research Council for Sport Science (grant number: 2020/3, P2021-0065).
References
Supplementary Material
Please find the following supplemental material available below.
For Open Access articles published under a Creative Commons License, all supplemental material carries the same license as the article it is associated with.
For non-Open Access articles published, all supplemental material carries a non-exclusive license, and permission requests for re-use of supplemental material or any part of supplemental material shall be sent directly to the copyright owner as specified in the copyright notice associated with the article.