
Abstract
Aims:
We provide an overview of nationwide environmental data available for Denmark and its linkage potentials to individual-level records with the aim of promoting research on the potential impact of the local surrounding environment on human health.
Background:
Researchers in Denmark have unique opportunities for conducting large population-based studies treating the entire Danish population as one big, open and dynamic cohort based on nationally complete population and health registries. So far, most research in this area has utilised individual- and family-level information to study the clustering of disease in families, comorbidities, risk of, and prognosis after, disease onset, and social gradients in disease risk. Linking environmental data in time and space to individuals enables novel possibilities for studying the health effects of the social, built and physical environment.
Methods:
We describe the possible linkage between individuals and their local surrounding environment to establish the exposome – that is, the total environmental exposure of an individual over their life course.
Conclusions:
Introduction
Denmark has a long history of collecting information on various aspects of life for each resident for administrative purposes. These rich Danish population-based registries [1] hold detailed digital information for the entire Danish population going back to the 1970s, distributed in more than 2600 different databases linkable at the levels of individuals, families, residential addresses, workplaces, schools and day care institutions. Uniquely linked data can be accessed for research purposes through the secure IT platforms of – for example, Statistics Denmark and the Danish Health Data Authority. This provides unique opportunities for the (re-)construction of life and health trajectories for individuals and their family members, treating the entire Danish population as one big, open and dynamic cohort with complete long-term follow-up [2,3].
Although most research has utilised individual- and family-level information, nationwide studies exploring the potential impact of the exposome [4,5] (the totality of human environmental exposure from the cradle to the grave) on health outcomes are rarer. Here, we outline this unmet research potential in Denmark by describing current linkage possibilities between individuals and the social, built and physical environmental factors accessible for research usage. This paper aims to provide a concise overview of the different types of Danish environmental data at a national level to promote research unravelling the impact of the exposome on human health.
Data and data linkage
The Danish Civil Registration System [3] has electronically recorded longitudinal information on all Danish residents since 1968. The information recorded on individuals include their sex, date of birth, current and historical complete addresses, date of emigration and immigration from and to Denmark (if appropriate), links to family members and spouse, and date of death. Each Danish resident is assigned a unique 10-digit personal identifier at birth or immigration, which is used in all Danish registries and databases, enabling an unambiguous linkage between individual-level data. Hence information on health (primary health care, hospital admissions, emergency room visits, prescribed medicine and cause of death), places of residence, socioeconomic status (educational attainment, employment status and income), families, workplaces, schools and day care institutions can be linked.
We established a nationwide database of longitudinal geographical coordinates for all residential addresses of all Danish residents since 1971. This was achieved by allocating the geographical coordinates from The Danish Address Register [6] to residential addresses in the Danish Civil Registration System [3]. Of more than 55 million residential address histories, 99.41% were successfully geocoded with nearly complete information onwards since the late 1970s. Details are described in the Supplementary Material. Likewise, within Statistics Denmark, geocoded information also exists for workplaces, schools and day care institutions. Combining the longitudinal geocoding of residential addresses with the longitudinal geocoding of workplaces, schools and day care institutions provides the possibility of obtaining the physical whereabouts of all Danish residents, which is instrumental in estimating the exposome.
Different nationwide built, physical and socioenvironmental data were measured or modelled. These data, when linked to individuals in time and space, provide unprecedented options to explore the health impacts of the local surrounding environment. These environmental data constitute an important and rare asset for large population-based environmental health research. Data sources and linkage possibilities are illustrated in Figure 1.
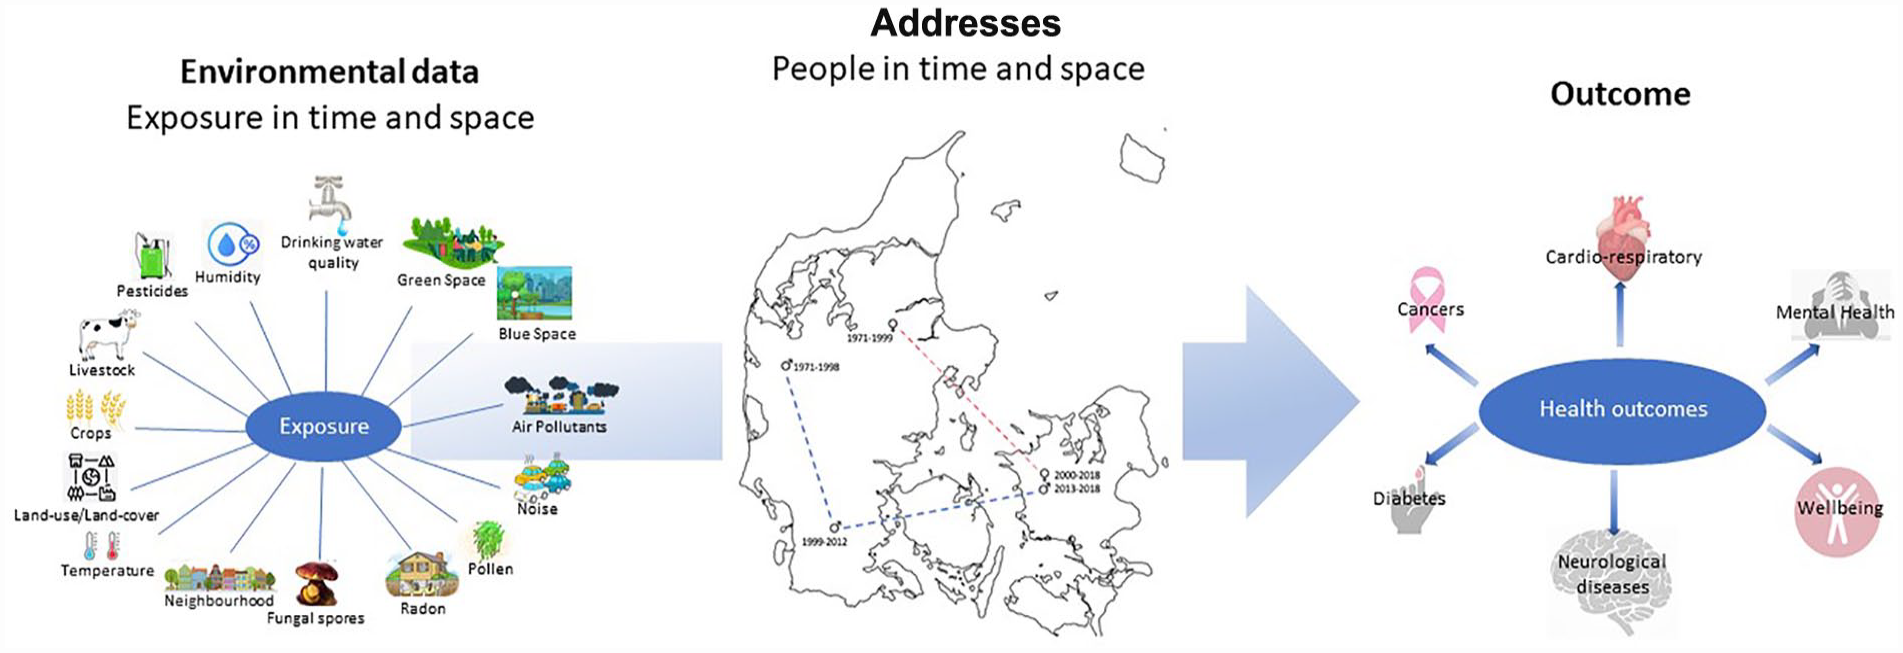
Data sources and linkage possibilities.
Environmental data
We describe here the different types of accessible nationwide environmental data, focusing on their origin and curation and their temporal and spatial resolution. The resolution varies from hourly to every six years at or within 50 km of the addresses.
Air pollution
Atmospheric gases and particles covering the entire country longitudinally have been modelled using integrated Danish air pollution modelling systems based on multiscale chemistry–transport models [7–10]. This modelling includes contributions from regional and local sources of pollutants and their precursors, their transport and chemistry in the atmosphere, and their removal processes. Concentrations of air pollution gases and particles have been modelled as contributions on three spatial scales: (1) the regional scale based on the Danish Eulerian Hemispheric Model (DEHM) [11], which handles long-range atmospheric transport and chemical transformations over Denmark at a resolution of 5.6 km × 5.6 km; (2) the local scale based on a high-resolution emission inventory covering all emission sectors (e.g. traffic, industry, residential heating and agriculture) [12,13] and the Urban Background Model (UBM) [14] at a 1 km × 1 km resolution; and (3) the street scale, taking into account the influence of emissions from the street next to the address location using a GIS-based air pollution modelling and exposure estimation system (AirGIS) [15] in conjunction with the Operational Street Pollution Model (OSPM) [16,17]. The modelling system was also driven by meteorological data – including wind, temperature and humidity – calculated with the Weather Research and Forecasting Model [18]. This model was set up and applied to the same domains and resolution as the DEHM.
For each address location in Denmark, air pollution levels were calculated at an hourly resolution from 1979. The OSPM model was only used for addresses with significant local traffic (>500 vehicles per day). Evaluation against observations from the Danish monitoring network showed that the modelling system was capable of capturing the overall levels, variability and trends of the main air pollutants [15,19]. The application of low-cost air pollution measurement devices has become increasingly common. These low-cost, sensor-based devices may be useful as personal exposure monitoring devices.
Noise
The prescribed method for noise modelling in Denmark is Nord2000 [20], which is implemented in the leading commercial software SoundPLAN Nordic (www.soundplan.dk/). Several sources and propagation characteristics are accounted for while modelling noise using the Nord2000 method [21] – for example, in the estimation of road noise, a detailed geodatabase is created containing 3D building polygons (buildings with building heights), a digital ground model containing surface elevation information and the road network. The road network contains information about the number of light and heavy vehicles and traffic speeds. In addition, several sound-propagation corrections are applied in the noise estimation process – for example, road surface correction. The Nord2000 model also contains comprehensive weather classes reflecting varying weather conditions throughout the whole year. Using these inputs, the estimated noise (hourly average) is produced for any location of interest (e.g. address location with current and/or historical exposure).
Outdoor aeroallergens (pollen grains and fungal spores)
Danish national routine monitoring of outdoor aeroallergens has been performed by Asthma Allergy Denmark since 1977 (www.astma-allergi.dk). Measurements are run at two monitoring stations in Copenhagen and Viborg using seven-day recordings from the Burkard Volumetric Spore Trap (Hirst-type traps) [22,23]. Data from an aerobiological station based on a Hirst-type trap are assumed to reflect the number of aerobiological particles released from sources located within 30–50 km radius [24,25]. In the first few years, pollen and fungal spore monitoring was mainly performed during early spring to late autumn. However, from 2010 monitoring of pollen has been executed continuously throughout the year with a short break around Christmas. For fungal spores, monitoring before 2022 was only performed from late spring to mid-autumn. Asthma Allergy Denmark records and stores bi-hourly data on 23 types of pollen at both stations and on two fungal spore genera at one station in Copenhagen.
Daily pollen and fungal spore concentrations vary across the country [26] due to a number of climatic and geographical parameters affecting the characteristics of their emission and dispersion pathways. This, in return, leads to differences in regional exposure levels. In 2020, a national campaign measured concentrations of birch and grass pollen and two fungal spores (Cladosporium and Alternaria) at six regional sites with the aim of achieving a better understanding of local exposure levels within the country.
The spatial distribution of pollen concentrations has also been estimated for the domain of Europe and northern Europe by several models [27,28] and an ensemble of European models (including the DEHM) now provides forecasts of the main pollen types across Europe (www.regional.atmosphere.copernicus.eu/). However, despite a rapid increase in the number of models and increasing precision [29], data measured by traditional routine monitoring methods are preferred.
Crops and pesticides
Data about agricultural land use in Denmark are obtained from Danish farmers by the Danish Agricultural Agency and updated annually. For all Danish fields (about 600,000 fields in 2022), the register contains information on crop type, crop code, geographical location and size. From 1998 to 2010, the geographical location of crops has been known at the field block level. A typical field block has fixed boundaries in the landscape, such as roads, streams and hedges. On average, there are three to four fields/different crops within a typical field block. From 2010, the precision has been improved to include the exact geographical location of all Danish fields with cropping information (https://landbrugsgeodata.fvm.dk/). The data on Danish fields has been available as WebGIS data since 2010.
It has been mandatory since 2010 for farmers to annually report pesticides used professionally on fields in Denmark. The electronically submitted reports are individual to each crop during a planning year spanning from 1 August to 31 July [30]. In addition to information on crops, the pesticide report includes information on the commercial pesticide name, the pesticide registration number, the total consumption (e.g. litres or kilograms used) and the size of the area (ha) over which the pesticides were applied. Organic production is included and reported as not being treated with pesticides. A database was established in 2011 with merged crop and pesticide data. This database holds information on the pesticide use in 100 m × 100 m grids, including the active ingredient levels per hectare and their most likely distribution patterns in months throughout the year.
Livestock
The Central Husbandry Register [31] was established in 1992 by the Danish Ministry of Food, Agriculture and Fisheries. The register contains complete data on livestock in Denmark from 1997 onwards. The registration of livestock and other herds is required by law for the authorities to detect, control and prevent potential animal diseases. Data on cattle are updated daily, whereas other livestock from Danish farms are updated annually and consist of detailed information on animal count, type of animal (e.g. cattle, dairy cows and poultry), its purpose (e.g., meat, dairy and eggs) and the geographical location. In addition, the animal-specific nitrogen excretion (kg/year) is estimated for each farm. The likely annual emission of total suspended particles and particulate matter with a diameter <2.5 µm (PM2.5) and <10 µm (PM10) are estimated for each farm. Particulate matter emissions from field operations are not included.
Radon
A national survey on radon concentrations in Danish houses was performed in 1985–1986 [32] and again in 1995–2000 [33,34]. A random sample of houses in each municipality was included (a total of 498 houses in the first survey and 3120 houses in the second survey). Information includes the annual average of the measured radon concentrations and information on conditions influencing the radon concentration (e.g. the type and age of the dwelling, building materials and ventilation conditions). Since 2015, additional radon measurements have been ordered and paid for by home-owners through the Radon-free Home Initiative and collected in a database at the Bolius Knowledge Center.
A regression model has been developed for predicting indoor radon concentrations in Danish houses for inclusion of radon levels in Danish epidemiological studies. This model uses nine different explanatory variables (all available from Danish national databases), of which the most important ones are house type and geology [35].
Green space
Vegetation (or green space in mental health research) is calculated using the Normalized Difference Vegetation Index (NDVI) from remotely sensed 30 m resolution Landsat satellite images (https://earthexplorer.usgs.gov/), available from 1985 onwards on a 16-day repeat cycle using the mean NDVI during the peak growing season (June–August). The NDVI is an indicator of live, photosynthetically active vegetation and captures all vegetation from grasses to trees. The NDVI is calculated as the difference between absorbed (red) and reflected (near-infrared) light by vegetation: NDVI = (NIR − RED)/(NIR + RED), where NIR is the near-infrared and RED is the red band (https://earthobservatory.nasa.gov/features/MeasuringVegetation) [36]. The NDVI therefore ranges from −1 to 1, with low values indicating sparse vegetation and high values indicating dense, healthy vegetation. In addition to the Landsat images, the European Space Agency’s Sentinel-2 satellites have provided freely available remote sensing data since 2015, allowing the computation of the NDVI and other vegetation indices at a spatial resolution of 10–20 m at sub-weekly intervals [37] with precomputed datasets available at coarser resolutions (https://land.copernicus.eu/global/products/ndvi).
Blue space
Blue space is calculated using land cover information based on 44 land and vegetation classes on 100 m × 100 m raster maps from the European Union programme Coordination of Information on the Environment (https://land.copernicus.eu/pan-european/corine-land-cover), initiated in 1985 (reference year 1990) and updated in 2000, 2006, 2012 and 2018. Relevant land cover classes are reclassified and blue space consists of areas containing freshwater and saltwater bodies, such as water courses, beaches and oceans.
Land use/land cover
Land use refers to the use of a specific area of land (e.g. agriculture or recreation), whereas land cover refers to the biophysical characteristics of a specific area of land (e.g. sand or water). Aarhus University is produces Basemap, a detailed land use/land cover map for Denmark. Basemap combines existing publicly available spatial information into one map with a resolution of 10 m × 10 m. The first version was created in 2011 and the map was updated in 2016, 2018 and 2021 [38]. The original land use categories of the input data are retained and the latest version contains 1610 possible combinations of land use and land cover categories, which can be aggregated with different focuses, such as recreational or green–blue space or building type. Basemap also contains information about transport infrastructure, such as roads and trails, allowing analyses of accessibility to, for example, recreational spaces.
A highly detailed national dataset of vegetation structure and terrain has been developed based on the national airborne laser imaging, detection and ranging scanning dataset for 2014–2015 and the associated elevation model [39]. It currently provides 70 rasterised environmental descriptors at a 10 m grain covering vegetation measures (e.g. vegetation height, structure and density) and topographic descriptors (e.g. elevation, aspect, slope and wetness).
Drinking water quality
Danish drinking water is sourced from groundwater and the supply infrastructure is highly decentralised, with more than 2500 public waterworks with a high geographical contrast in drinking water quality. Danish drinking water is regulated through the national implementation of the EU Drinking Water Directive [40] in the Water Supply Law [41] and the Ministerial Order on Water Quality and Monitoring of Water Supply Facilities [42], which specifies the drinking water standards and monitoring regimes. Drinking water quality in public waterworks is routinely regulated and monitored. Monitoring of drinking water is performed by certified laboratories and has been registered in the publicly available geodatabase JUPITER for decades, covering the entire country.
Data coverage depends on the chemical compound and longest time series exist for the most common compounds. The list of parameters measured has also changed over time depending on legislation. The frequency of measurements varies depending on the extraction volume of the waterworks, varying from at least every second year to several samples per month. In the JUPITER database, each drinking water sample is linked to a waterworks. An open access spatiotemporal model linking waterworks to their water supply areas has been created, allowing direct linkage to geocoded addresses [43]. Addresses supplied by largely unmonitored private wells can also be identified. Because monitoring only focuses on the parameters required by legislation, specific sampling campaigns were carried out in Denmark in 2013 and 2016. They included monitoring of trace elements in about 200 of the largest waterworks distributed across Denmark and supplying nearly half of the total Danish population [44].
Area-level sociodemographic and socioeconomic factors (neighbourhood)
Danish researchers have implemented different socioeconomic constructs based on the rich individual-level information available for each Danish resident, e.g., the Danish Deprivation Index [45], subdividing information by one of the existing administrative boundaries. However, none of these administrative boundaries is longitudinally consistent over recent decades (see details in Pedersen et al. [46], Supplementary Information). Pedersen et al. [46] introduced two alternative longitudinally consistent geographical boundaries based on geocoding all residents from 1978 onwards and assigning these longitudinally to a longitudinally consistent geographical classification of clustered parishes and data zones [46]. Parishes with a small population were clustered with neighbouring parishes to obtain a minimum of 750 residents in each parish, giving a total of 1045 clustered parishes. Because the parishes vary considerably in population size, which may bias geospatial analyses [47], an alternative zone design was proposed. This was based on a homogeneous population-sized small-area division of Denmark using the geographical coordinates combined with a Voronoi tessellation clustering procedure [48] and resulted in 1885 delineated geographical areas called data zones [46]. For each clustered parish and each data zone, 18 annual constructs describing the elements of area-level socioeconomic status from Statistics Denmark [49,50], the Danish Civil Registration System [3] and the Danish National Patient Register [51] have been calculated since 1981 (www.ncrr.au.dk/data_zones).
Discussion
It would not be logistically feasible to compile large, full population-based samples in most countries. However, Denmark provides a unique research platform due to the universal, free of charge public health care system and many national longitudinal registers containing health and administrative data. Combining these with environmental data provides novel research opportunities related to the aetiology and the possible prevention of human diseases. Local environmental factors have already been associated with mortality [52–54], suicide [55], asthma [56], cancer [57–63], cardiovascular disease [64–69], type 2 diabetes [70–72], adverse birth outcomes [73–76], mental health [77–89] (primarily schizophrenia [77,78,80,83,84] and attention deficit hyperactivity disorder [86–88]) and socioeconomic status [90]. However, only few of these studies considered more than one environmental factor [67,72]. The impact of a mixture of environmental exposures therefore remains unclear.
The strength of these environmental and contextual data is their population-based nature and their possible linkages to national registers in Denmark. The prospective and repeatedly measured information makes them useful in estimating exposure at any given time and space for all Danish residents. The nationwide spatial coverage and often detailed time series data are important strengths that allow spatiotemporal exposure assessments at high resolution. Using nationwide data with prospectively collected/modelled data, established for different purposes (often monitoring), minimises the risk of both selection and information bias.
Exposure assessments vary in resolution and accuracy. Exposure estimates for the residence are often calculated, but when more detailed data are needed and available (place of work, school or even paths based on GPS monitoring), this can be incorporated. The exterior exposure dose can be estimated using these data. A natural limitation is that this may not correlate with the, often unknown, interior dose.
Like any other observational study, researchers should, for each research question, evaluate whether the environmental data are representative of the relevant exposure period, whether the spatial and temporal resolution is sufficient for the research question and whether any breaks in the data or changes in the monitoring regime need to be addressed.
Despite our effort to describe existing environmental data, we acknowledge that other data sources on environmental exposures exist (e.g. soil type, biodiversity and mobility trends). We will update Table I with descriptions of environmental data in Denmark as they become available (https://osf.io/mgbrn/).
Environmental Data in Denmark.
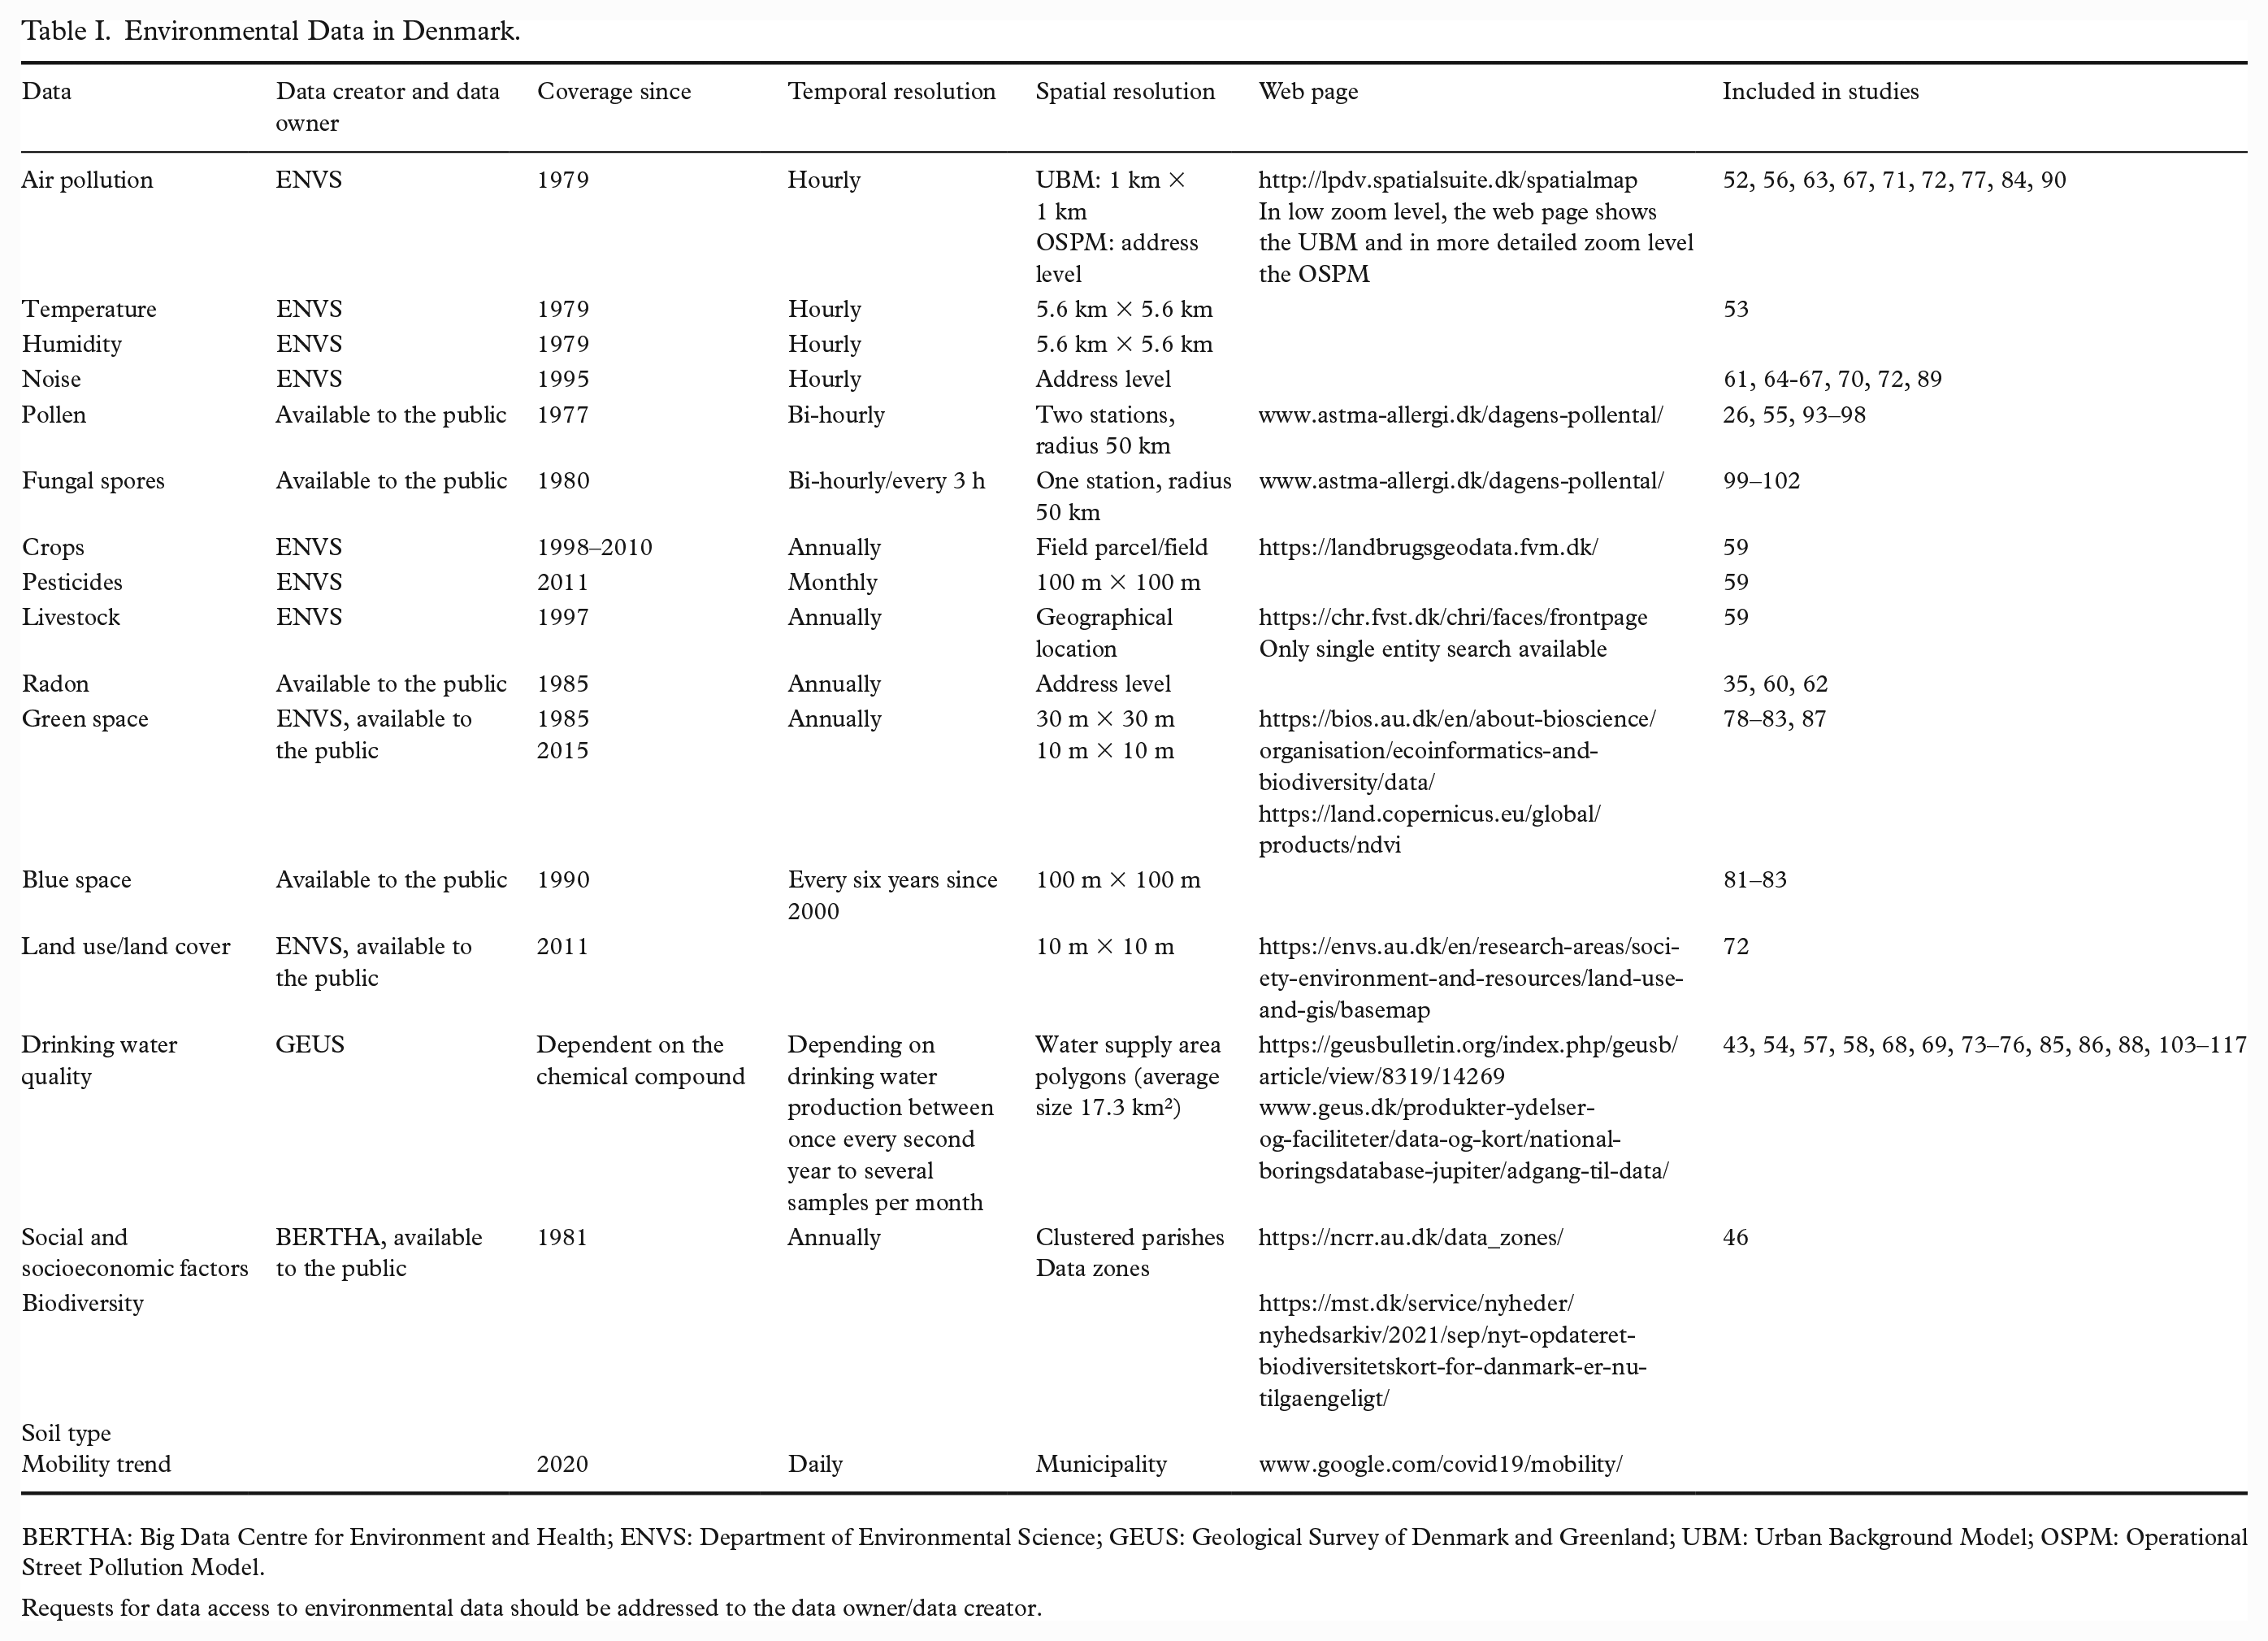
BERTHA: Big Data Centre for Environment and Health; ENVS: Department of Environmental Science; GEUS: Geological Survey of Denmark and Greenland; UBM: Urban Background Model; OSPM: Operational Street Pollution Model.
Requests for data access to environmental data should be addressed to the data owner/data creator.
The proposed merging of environmental data with register data can be supplemented with studies using the comprehensive biobanks available for Denmark. To assess the mechanisms behind the associations between environmental data and disease, biobanks may help to identify, for example, how environmental exposures affect levels of systemic inflammation markers by use of plasma samples. Genetic data are available for a growing number of citizens in various studies (e.g. the Danish Blood Donor Study [91] and iPSYCH [92]) and can be used for gene–environment interaction studies.
These spatial and temporal environmental data constitute one of the largest and most comprehensive data sources for register-based epidemiological studies aiming to elucidate the impact of environmental factors on human health.
Data access
The built, social and physical environmental datasets described here are either available to the general public or accessible through collaboration with the data owners, who control accessibility and potential costs for accessing the environmental data.
Estimations of individual exposure require linkage to individual-level data. Access to individual-level data in Denmark is governed by the Danish authorities. These include the Danish Data Protection Agency, the Danish Health Data Authority, the Ethical Committee, Statistics Denmark and the Danish National Archives. Each scientific project must be approved before initiation and approval is granted to a specific Danish research institution. Researchers at Danish research institutions may obtain the relevant approval and data. International researchers may gain data access if governed by a Danish research institution with the required approval and data access. According to Danish law, this secondary use of register data (collected for clinical or administrative purposes), where researchers only have access to pseudo-anonymised information, does not require informed consent.
Supplemental Material
sj-docx-1-sjp-10.1177_14034948231178076 – Supplemental material for Perspectives on environment and health research in Denmark
Supplemental material, sj-docx-1-sjp-10.1177_14034948231178076 for Perspectives on environment and health research in Denmark by Henriette T. Horsdal, Marianne G. Pedersen, Jörg Schullehner, Cecilie S. Østergaard, John J. Mcgrath, Esben Agerbo, Allan Timmermann, Ane Marie Closter, Jørgen Brandt, Jesper H. Christensen, Lise M. Frohn, Camilla Geels, Matthias Ketzel, Jibran Khan, Pia V. Ørby, Yulia Olsen, Gregor Levin, Jens-Christian Svenning, Kristine Engemann, Steen Gyldenkærne, Birgitte Hansen, Ole Hertel, Clive E. Sabel, Christian Erikstrup, Torben Sigsgaard and Carsten B. Pedersen in Scandinavian Journal of Public Health
Footnotes
Declaration of conflicting interests
The authors declared no potential conflicts of interest with respect to the research, authorship, and/or publication of this article.
Funding
The authors disclosed receipt of the following financial support for the research, authorship, and/or publication of this article: This study was supported by BERTHA – the Big Data Centre for Environment and Health – funded by the Novo Nordisk Foundation Challenge Programme (grant NNF17OC0027864). Part of the work was supported by Nordforsk under the Nordic Programme on Health and Welfare (Project #75007: NordicWelfAir – Understanding the Link between Air Pollution and Distribution of Related Health Impacts and Welfare in the Nordic Countries). JCS considers this work to be a contribution to his VILLUM Investigator project Biodiversity Dynamics in a Changing World, funded by VILLUM FONDEN (grant 16549) and the Center for Ecological Dynamics in a Novel Biosphere (ECONOVO), funded by Danish National Research Foundation (grant DNRF173).
Supplemental material
Supplemental material for this article is available online.
References
Supplementary Material
Please find the following supplemental material available below.
For Open Access articles published under a Creative Commons License, all supplemental material carries the same license as the article it is associated with.
For non-Open Access articles published, all supplemental material carries a non-exclusive license, and permission requests for re-use of supplemental material or any part of supplemental material shall be sent directly to the copyright owner as specified in the copyright notice associated with the article.