
Abstract
Aim: The Income Inequality Hypothesis asserts that income inequality causes negative health burdens within wealthy nations. We aimed to test the hypothesis in Norway, examining the relationship between both income and wealth inequality, net of individual economic resources, and individual all-cause mortality. To this day, little is known about the association between wealth inequality and mortality. In Norway, wealth is far more unequally distributed than income and can be a more prevalent indicator of long-term financial security. Methods: We estimated discrete-time event history models from Norwegian register data, covering all Norwegian-born men and women aged 25–84 years during the period 1993–2013. We include fixed effects at the municipal level, adjusting for time-invariant characteristics in the local area. Our data contain approximately 58.5 million person-year observations after sample restrictions. Results: Overall, increased income and wealth inequality (measured using Gini coefficients of individuals’ pensionable income and net worth) is not associated with higher mortality risk in Norway. With a one percentage point increase in income inequality, odds ratio (OR) for mortality was estimated at 0.998 (95% confidence interval (CI) 0.996–1.001) for men and 1.002 (95% CI 0.999–1.006) for women. Corresponding OR from increased wealth inequality was 0.998 (95% CI 0.997–1.000) for men and 0.999 (95% CI 0.998–1.001) for women.
Keywords
Background
Income and wealth inequality have been on a steady rise in almost all European countries since the 1980s [1]. High levels of income inequality have been associated with worse population health, and the body of literature investigating this association is still growing [2 –6]. Some have argued that when societies reach a certain level of affluence, income inequality, and not GDP per capita, becomes the most important driver of population health [7,8]. This theory, ‘The Income Inequality Hypothesis’, states that people’s health is affected by the degree of national and regional levels of income inequality, net of their own income. The inequality-effect is said to operate through psychosocial pathways, causing distrust, more status competition and higher stress levels [7]. Between-country comparisons have shown a positive linear relationship between income inequality and mortality [7]. The theory is controversial as it links contextual inequality to health, beyond individuals’ own position in the economic hierarchy, suggesting that all social strata will have better health with a more equal income distribution [7].
In the existing literature, the vast majority of studies focus on income inequality. However, a relatively egalitarian income distribution does not necessarily imply low inequality. In terms of national income distributions, the Nordic countries are usually considered egalitarian forerunners. Contrastingly, if we look at their wealth distributions, they are highly skewed, far higher than in other less egalitarian countries, and almost on a par with United States levels [9]. Wealth inequality also remains far less studied than income inequality, likely due to lack of data and problems related to accurately measuring wealth [10].
We define income as an individual’s pensionable income (including capital gains), and wealth as an individual’s net worth (assets with debts subtracted). Net worth may be a more important indicator of social status, and provide a more stable measure of an individual’s financial security and standard of living, as assets can function as a buffer in periods with low income [11]. Previous research has shown a strong intergenerational association between wealth and advantages in socioeconomic status or education [12 –16]. Wealth is also an important antecedent of health outcomes and associated with lower mortality, even after controlling for individuals’ own education and income [17]. A study from Sweden found significant mortality differences by wealth, and wealth remained a more stable predictor of mortality than income throughout an individual’s adult life [18].
In this study, we test whether increased income and wealth inequality in the Norwegian context is associated with higher individual all-cause mortality risk. We estimate a series of multilevel fixed effects models using administrative register data, with annual measurements of both micro-level and macro-level variables, allowing us to remove any bias from time-constant macro-level confounders.
Previous research and methodological debates
An important question is whether the association between income inequality and health reflects a causal relationship or whether it is due to confounding [19]. Income inequality could affect health through psychosocial mechanisms, for instance if economically unequal societies produce living conditions less conducive of general trust or more status competition than relatively more equal societies. This could in turn lead to the erosion of social cohesion, more stress and eventually to poorer health and higher mortality rates [7]. Another suggested pathway is that increased income inequality leads to underinvestment in social services such as health care and education [20]. Some studies have demonstrated correlations between income inequality and amount spent on human capital [20,21]. In the Norwegian context, however, social services do not vary much due to strong national regulations. This mechanism should therefore be more relevant in societies where local taxes determine more of the offered services, as, for instance, in the United States.
Although Pickett and Wilkinson have primarily performed aggregated cross-national comparisons of income inequality and health outcomes (ecological studies), they still argue that the association is causal and that income inequalities causally flow from the macro-social structure [5,8]. They worry that inclusion of individual-level controls such as income and education will lead to underestimation of the inequality-effect, as their roles could be as mediators instead of as confounders [5]. Without such controls, however, it is almost impossible to distinguish contextual from compositional effects and, further, to detect causal relationships of income inequality. Gravelle argues that since the relationship between individual income reduces mortality-risk with diminishing returns, it is likely to produce an artefactual aggregated relationship between inequality and mortality and, further, that the inequality-health-effect is markedly reduced, or that it disappears, when individual income is included as a control variable [22]. Consequently, if there is an overarching contextual effect of economic inequality on health, this should persist after adjusting for individual income.
Finally, wealth and income inequality should also be considered together, as wealth may generate income or be used as security for loan-financed investments. Wealth inequalities may fuel income inequalities, because wealthy individuals are able to take higher risks and can make investments with higher returns [23]. However, at country level, research has shown little or no association between level of income and wealth inequality [9]. Analysing and comparing the effects of both wealth and income inequality on mortality is an important contribution to the field.
Methods
Data and study population
We used data from various Norwegian administrative registers with information on all individuals who either live or have lived in Norway (8.3 million). Through personal, anonymized identification numbers, we linked longitudinal information from the Central Population Register (place of residence, age, year of death—if any, marital status and number of children), the National Education Database (educational level) and the Income and Wealth Registers (wealth and income). The data used in this study cover the 21-year period from 1993 until 2013.
We included a sample of women and men aged 25–84 years during the observational period. Some previous research has suggested that there could be differences in the inequality effect depending on age and gender [4,24]. We included a broad age-span and constructed six age groups. Experiments with age–inequality interactions yielded no significant interaction effects. Immigrants were excluded from the sample because there could be a time lag in the relationship between economic inequality and health, and we did not have information on what inequality patterns they were exposed to prior to immigration to Norway. This may have limited the external validity of the study but should not introduce any bias in the estimates obtained for the non-immigrant population, as immigrants were included when the inequality measures were calculated. After sample restrictions, the data contained approximately 58.5 million person-year observations and the total number of deaths in our sample during the period was 532,159.
Measures
Outcome measure
Our outcome variable is binary and measures whether a person dies within a calendar year. According to the theory, economic inequality is especially harmful to health outcomes with a socioeconomic gradient [5]. Our outcome variable, all-cause mortality, has such a gradient. To give one example: in Norway, women and men who have a university degree have better health and on average live 5–6 years longer than people with short or no education [25]. The trend in our data is that deaths slightly decrease during the 21-year period, with 1.16 % registered deaths in the sample in 1993 and 0.74 % in 2013.
Explanatory variables
Income inequality and wealth inequality are the main explanatory variables in the analysis. To estimate the level of inequality in the municipalities each year, we use the Gini coefficient, which is among the most frequently used measures of inequality. The Gini ranges from 0 to 1. A value of 0 would mean perfect equality where everyone earns (or in the case of wealth, owns) the same. In contrast, if one person earns or owns all assets, the Gini coefficient would have the value of 1. Due to lack of household identification numbers, we base the calculation of the Gini coefficient for income inequality on pensionable earnings from the previous year for men aged 30–69 years. On average, men still have higher incomes than women and part-time work is far more common among women than among men. As pointed out by Kravdal (2008), combining men and women’s incomes may cause bias due to within-household adaptations [24]. The wealth variable measures gross individual wealth in Norwegian kroner. Wealth inequality is also calculated based on men’s wealth only. The Norwegian tax authorities closely monitor reports of wealth. The value of real estate, cash and stocks, for example, is based not on self-reported wealth from individual taxpayers but on reports by banks and other financial institutions. Still, undervaluation of assets remains a problem. Our wealth measure is nevertheless markedly better than the alternatives used in the literature [17]. For ease of interpretation, the Gini variables, and other macro-level-measures, are centred at the mean value. We calculate Gini coefficients for each municipality each year.
Individual-level control variables
Main models include a set of individual-level controls: annual log-transformed individual income measured at t-1, log-transformed individual wealth measured at t-1, six 10-year age groups (25–34, 35–44, 45–54, 55–64, 65–74 and 75–84 years), educational level (primary/lower secondary education, upper secondary school, university – short, and university – long), marital status (single/unmarried, married/cohabiting, divorced/separated and widow/widower) and number of children.
Municipality-level controls
Since the data material covers residential histories at a rather detailed level (information on each person’s place of residence) which is updated yearly, we can control for area characteristics. All models include controls for aggregate mean municipality income and age (and mean wealth in models where wealth inequality is the explanatory variable).
Table I shows descriptive statistics at the municipal level. It shows that the variation in inequality in Norway is somewhat larger between municipalities (SD = 0.033) than within municipalities (SD = 0.017). As for wealth inequality, the two sources of variation are of similar magnitude (SD = 0.049 and 0.044). In a fixed effects analysis, municipality-level parameters are identified from the variation within municipalities rather than comparisons between municipalities. If there is limited variation in inequality within municipalities, standard errors and risk of making type-II errors will increase. Our study is larger than previously published work on the Income Inequality Hypothesis using fixed effects, and is thus an improved test of the hypothesis [24].
Descriptive statistics on municipality-level variables over the years 1993–2014.
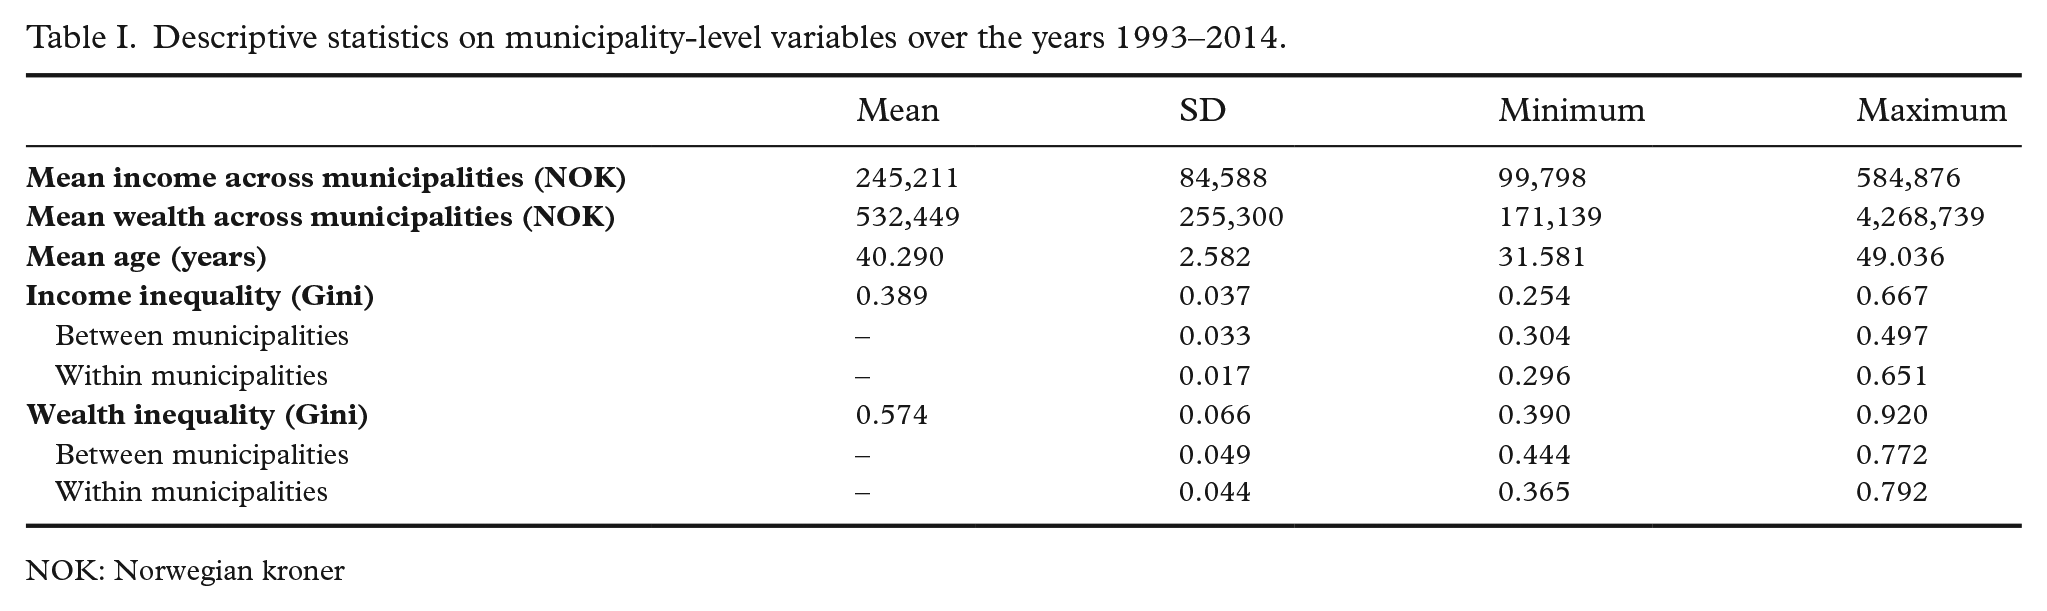
NOK: Norwegian kroner
Statistical analysis
We conducted discrete-time event history analyses using logistic regression. A series of observations for discrete time-periods (in our case one-year periods because of time fixed effects) were created for each person if s/he was alive and resident in Norway at the beginning of the period. Each individual in the age span 25–84 years old during the period 1993–2013 was observed until the occurrence of the event (death) or until censoring, which took place at the end of follow-up in 2013, or at emigration. Models were estimated separately for each sex due to mortality differences for men and women, and because some previous research suggest diverging results by gender [24]. We conducted separate analyses for the two inequality measures: income inequality, and wealth inequality, in addition to one model where they were analysed together.
Our main models include municipality fixed effects (i.e. municipality dummy variables). This removes confounding due to unobserved time-invariant characteristics of the municipality and only exploits the variance in inequality within municipalities. Municipality level is the smallest and most relevant political-administrative unit in Norway. Norwegian municipalities have some autonomy when it comes to part of the public health care, and they are the main providers of services connected to individuals’ health and well-being. Some aspects of a municipality could potentially affect both inequality and mortality (e.g. differences in health investments, or cultural attitudes towards health behaviours) and bias estimates of effects of income and wealth inequality. Fixed effects should at least limit the role of such confounding and eliminate it altogether if it is stable over time. We have also included calendar year fixed effects to account for general changes in mortality rates over time.
Results
The main results from the analyses are summarized in Table II, and complete regression results are listed in the Supplemental material online. Our main concern lies with the odds ratio (OR) for the two inequality measures estimated in separate and combined models. In all models, a unit change in income or wealth inequality is a percentage point change in the Gini coefficient (from the mean value).
Summary of results from discrete-time event history regression models of mortality, with income and wealth inequality included in separate and combined models. Odds ratios with 95% confidence intervals. Norway 1993–2013.
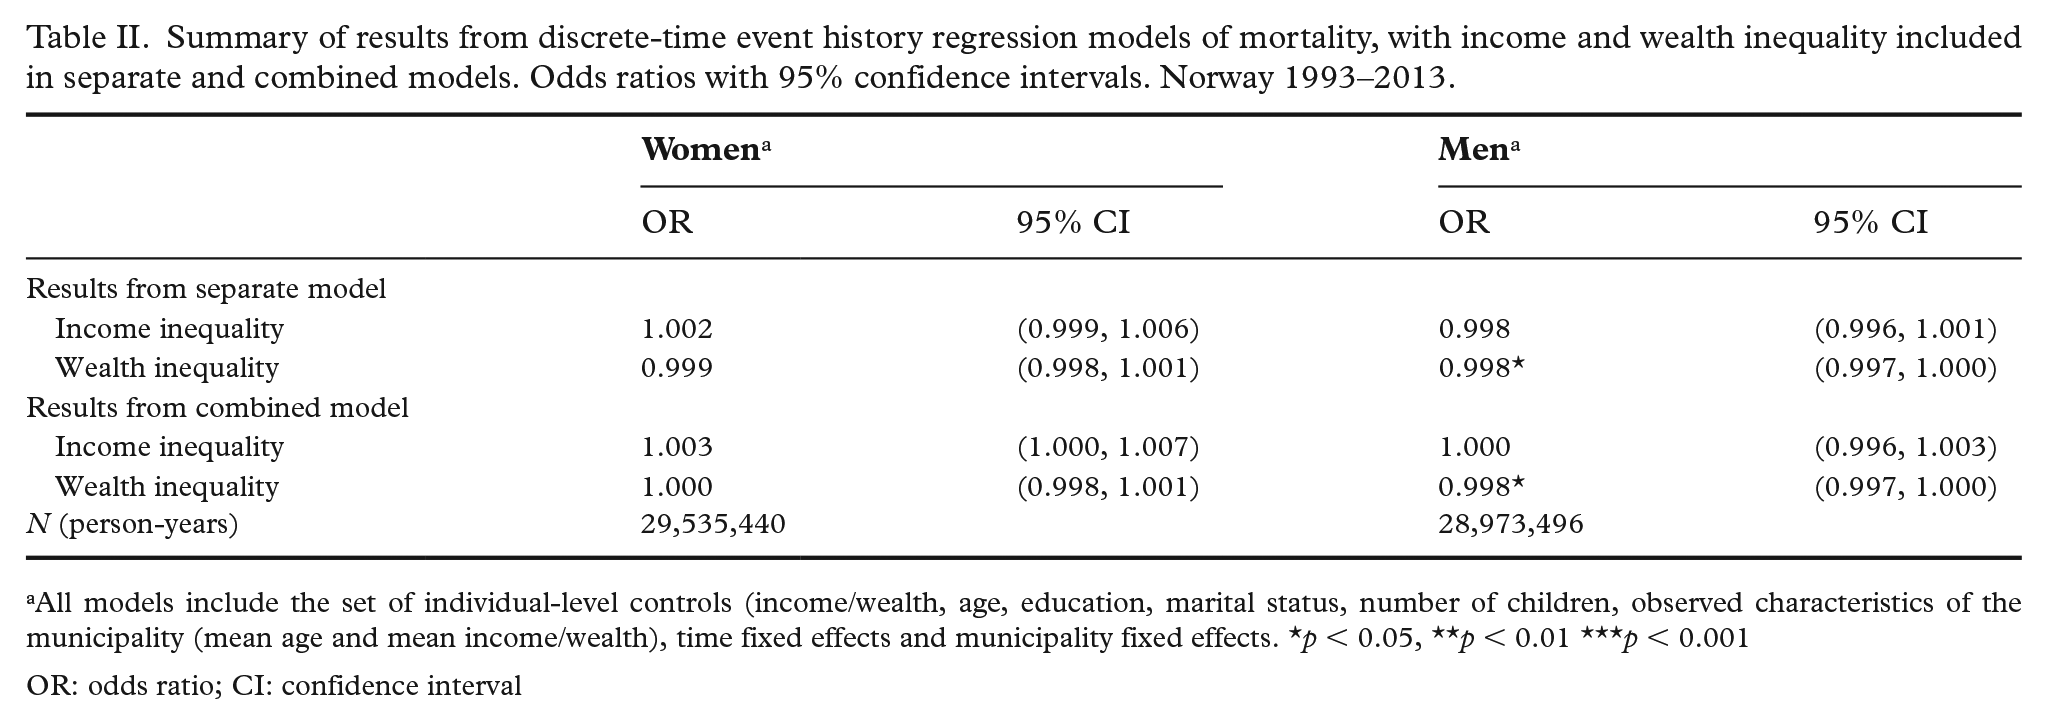
All models include the set of individual-level controls (income/wealth, age, education, marital status, number of children, observed characteristics of the municipality (mean age and mean income/wealth), time fixed effects and municipality fixed effects. *p < 0.05, **p < 0.01 ***p < 0.001
OR: odds ratio; CI: confidence interval
Starting with the separate model of income inequality, it is clear that it is not associated with mortality in our data. Neither for women nor for men does the confidence interval for the OR of income inequality exclude 1.00. The magnitude of the OR is also relatively small. For women, the OR is estimated at 1.002. This means that if the Gini coefficient increases from 0.26 (Norway’s 2019 level) to 0.36 (United Kingdom 2019 level), which entails a massive redistribution of income, the odds of mortality would increase by 1.00210 = 1.02, that is, a 2% increase. The results for wealth inequality are similar, in that the coefficients are rather small. For women the OR overlaps with 1.00. For men, there is even a lower mortality risk at higher levels of wealth inequality, but also this association is of relatively small (0.998) magnitude and non-significantly different from 1.
When we include both dimensions of inequality in one model, the pattern from two separate models holds. We find that income inequality does not have any measurable association with mortality risk, and that there is no association between wealth inequality and mortality risk for women. The finding that an increase in wealth inequality is associated with a decrease in mortality risk for men persists also in this model, but the magnitude of the association is still rather small. In sum, we do not find any support for the income inequality hypothesis, nor do we find any support for the corresponding hypothesis for wealth.
The results from the full models (cf. Supplemental material) conform to our expectations formed by the general mortality literature. Experiments with alternative model specifications yield similar (if not nearly identical) results. In models without municipality fixed effects (i.e. allowing between-municipality variation in inequality) the estimated ORs for income inequality and wealth inequality for women and men are 1.013, 1.013 and 1.004, 1.000, respectively (see Tables S7 and S8 in Supplemental material). This is in line with the expectation that there is confounding from unobserved municipality characteristics, which is reduced in models with fixed effects.
Discussion
The Income Inequality Hypothesis, and its corresponding version for wealth inequality, would be supported if an increase in inequality leads to a statistically significant, and substantively meaningful, increase in the probability of death, net of individuals’ own socioeconomic status and other relevant factors. The results in this study of the Norwegian population show no evidence of an association between local income and wealth inequality at the municipal level on the one hand, and individual mortality risk on the other hand.
Why do we not find support for the Income Inequality Hypothesis? It is possible that associations found in previous studies have been overestimated, due to a lack of control for relevant macro- and micro-level characteristics. In the existing literature, there is a pattern of stronger associations when fewer controls are included [26]. We can rule out both mechanisms working through individual-level income/wealth or through education, and stable macro-level factors, which is a more comprehensive set of controls than typically used. However, other potential confounding sources, such as time-variant characteristics such as changes in health care services or selective migration between municipalities, may remain. Despite this, there should be little left to explain by, for example, selection, since we find such weak associations between economic inequality and mortality in the first place.
Norway has a welfare system characterized by universal and relatively generous benefits. The tax paid by each individual is used to finance either free or strongly subsidized public services, such as the Norwegian health care system and the educational system. Additionally, levels of trust are also relatively high in Norway, which, according to previous research, could function as a mediator in the inequality–mortality relationship [27]. It is likely that this kind of welfare system functions as a safety net for severe deprivation and in that way mitigates some of the adverse health consequences of inequality. The effect of increasing inequality may also depend on which part of the income distribution that changes. The increase in inequality in Norway has mainly taken place at the top. Growing wealth for the richest segment of the population, and thus increased inequality, may not affect the rest of the population’s health (and ultimately mortality) as much as an increase in inequality within the middle segment of the distribution would have done. Additionally, this study applied the most commonly used measure to estimate inequality levels in the field – the Gini coefficient [28]. This measure is particularly sensitive to inequality among people located in the middle of the economic distribution. Future research should systematically test whether the results depend on the choice of inequality measure.
We cannot discard the possibility that inequality may affect some health measures to a larger extent than others, and that studying all-cause mortality may mask some possible variation in outcomes by cause of death. It is also possible that there is a threshold effect in the inequality–health relationship. The overall income inequality in Norway is relatively low. One could imagine that an effect is non-existent below a certain level of inequality. Some have suggested that such a threshold lies around a Gini level of 0.3 [26]. If this hypothesis holds, we could expect to see different results in the future, given that economic inequality continues to grow.
Conclusion
The aim was to estimate the effect of income and wealth inequality on mortality in Norway. We were able to use large-scale register data and estimate fixed effects models that remove bias from community-level confounders. Our results raise doubts about the existence of a contextual effect of economic inequality on mortality, at least in this Nordic setting. Extensive health policies, relatively generous benefits and high levels of trust in Norway could function as potential buffers against severe economic and social deprivation, and thus also ameliorate any negative health consequences of economic inequality. Future research should use similar designs in other contexts with relatively weaker social support systems.
Supplemental Material
sj-docx-1-sjp-10.1177_14034948221126264 – Supplemental material for Does local income and wealth inequality affect mortality? A register-based fixed effects study of 58 million person-years
Supplemental material, sj-docx-1-sjp-10.1177_14034948221126264 for Does local income and wealth inequality affect mortality? A register-based fixed effects study of 58 million person-years by Ruth E. Jørgensen and Torkild Hovde Lyngstad in Scandinavian Journal of Public Health
Footnotes
Declaration of conflicting interests
The authors declared no potential conflicts of interest with respect to the research, authorship, and/or publication of this article.
Funding
The authors disclosed receipt of the following financial support for the research, authorship, and/or publication of this article: This work was supported by the Research Council of Norway (grant number 236793).
Supplemental material
Supplemental material for this article is available online.
References
Supplementary Material
Please find the following supplemental material available below.
For Open Access articles published under a Creative Commons License, all supplemental material carries the same license as the article it is associated with.
For non-Open Access articles published, all supplemental material carries a non-exclusive license, and permission requests for re-use of supplemental material or any part of supplemental material shall be sent directly to the copyright owner as specified in the copyright notice associated with the article.