
Abstract
Aims:
The aims of this study were to provide Danish population norms for the EQ-5D-5L and to assess the measurement properties of the instrument in a Danish population setting.
Methods:
We used data from the Danish 5L valuation study in which a representative sample of the Danish population completed the EQ-5D-5L and answered socio-demographic questions. We generated population norms for the five EQ-5D-5L dimensions, corresponding utility scores and the EQ-5D visual analogue scale (EQ VAS) according to age and sex. Measurement properties of ceiling effects, known-group construct validity and convergent validity were assessed.
Results:
The mean EQ-5D-5L utility score for the 1014 respondents completing the EQ-5D-5L was 0.90 (standard deviation (SD)=0.16). No significant differences emerged across age groups (minimum mean utility score=0.88 (SD=0.19); maximum mean utility score=0.93 (SD=0.11)) or sex (mean utility score for women=0.89 (SD=0.17); mean utility score for men=0.91 (SD=0.15)). Statistical differences were found across educational level, occupational status, income and living situation. Similar patterns were observed for the EQ VAS. Generally, respondents most often reported problems with pain and discomfort, but young women most often reported problems with anxiety/depression. There was a significant strong correlation between EQ-5D-5L utility and the EQ VAS and a significant correlation between overall health and each of the five EQ-5D-5L dimensions. The overall ceiling effect for the EQ-5D-5L was 39% (compared to 56% for the EQ-5D-3L).
Conclusions:
Introduction
Population data on health-related quality of life (HRQoL) help to inform public health policy and are an important contribution to health economic evaluations. When these data are disaggregated according to relevant socio-demographic variables, they can be used to assess current population health and changes over time, and to identify groups with high risk of poor HRQoL. In health economic evaluations, population norm data can represent values for HRQoL, provide means for age adjustments and assist in medical decision making [1,2].
The EQ-5D, developed by the EuroQol Group, is a standardised generic measure of HRQoL that has been widely used to assess population health [3] and is one of the most popular preference-based, multi-attribute utility instruments used in clinical and economic appraisals [4,5]. It contains two main elements: a descriptive profile comprising five dimensions (mobility, self-care, usual activities, pain/discomfort and anxiety/depression) and the EQ-5D visual analogue scale (EQ VAS). The original EQ-5D-3L instrument [6] has three response levels in each of the five dimensions (none, some and extreme problems) and describes 243 health states. The more recent EQ-5D-5L [7] has five response levels in each dimension (none, slight, moderate, severe and extreme problems) and describes 3125 health states.
A numerical value (or utility score) can be assigned to each EQ-5D health state to reflect how good or bad the health state is according to the preferences of the general population. These utility scores are most often obtained from valuation studies in which a large representative sample of the general population directly values a subset of health states, and modelling is then used to derive utility scores for the entire set of health states [8–11]. Danish utility scores for EQ5D-3L were published in 2009 [12], and those for EQ-5D-5L were published in 2021 [13].
Population-based studies of EQ-5D utility scores have been reported for a number of countries, and several have found a relationship between HRQoL and socio-demographic variables such age, sex, duration of education, household income, employment and living situation [14–19]. Danish population norms based on EQ-5D-3L were reported in 2009 [20] but are not yet available for the EQ-5D-5L.
It is possible that population norm data have changed since 2009, and the EQ-5D-5L offers improved measurement properties (in particular, fewer problems with ceiling effects) over the EQ-5D-3L [21–23]. Hence, the objectives of the current study were to use the data from the Danish EQ-5D-5L valuation study:
To describe the HRQoL of a large representative sample of the Danish population in terms of the five EQ-5D-5L dimensions, the corresponding utility scores and the EQ VAS. When these data are reported for each age group by sex, they comprise the Danish EQ-5D-5L ‘population norms’.
To investigate associations between health and socio-demographic characteristics by analysing EQ-5D-5L utility scores and EQ VAS scores for each age group by sex, education, occupational status, income and living situation. Associations between responses to the descriptive profile and socio-demographic characteristics were also investigated.
To assess the measurement properties of EQ-5D-5L used in this Danish population sample, including ceiling effects, known-group construct validity and convergent validity.
Methods
Data collection
The Danish EQ-5D-5L valuation study was undertaken between October 2018 and November 2019 and comprised 1052 computer-assisted interviews conducted on a representative sample of the Danish general population across the five regions of the country [13]. In connection with the recruitment process, potential respondents were sent an invitation letter informing them of the study purpose and the use of their data. This contained a link to the project website that gave further details of the study, including data protection, the interviewer team and the research team. At the start of the interview, the information was repeated orally, and all respondents agreed to the described use of their data. This included a guarantee of full anonymity in association with publication of the results.
The study used the latest version (2.1) of the EuroQol Valuation Technology software developed for EQ-5D-5L valuation studies [24]. At the start of each interview, the respondent completed the EQ-5D-5L descriptive profile and the EQ VAS as a description of their own current health. The respondent then completed a number of valuation tasks using composite time trade-off (cTTO) and discrete choice experiments (DCE), followed by background questions on socio-demographic variables, that is, sex, age, highest educational attainment, occupational status, annual household income and living situation. Data on self-perceived general health were obtained via the question ‘How would you rate your health in general?’ with response categories ‘excellent’, ‘very good’, ‘good’, ‘not so good’ and ‘bad’.
Of the 1052 interviews conducted, 38 were excluded due to interviewer, participant or software problems, leaving data from 1014 respondents for analysis [13].
EQ-5D-5L health status
The data from the valuation study were used to describe each respondent’s health status in terms of (a) a specific EQ-5D-5L health state, (b) a utility score for that health state and (c) an EQ-5D VAS score.
Compared to the EQ-5D-3L, the EQ-5D-5L has fewer ceiling effects (caused by many respondents answering ‘no problems’) and shows improved psychometric properties [21–23]. The EQ-5D-5L health states range from 11111 (corresponding to ‘full health’, i.e. no problem on any of the EQ-5D dimensions) to 55555 (corresponding to the worst health state, i.e. maximum problems on all the EQ-5D dimensions). If, for example, a respondent indicated slight problems with mobility and slight pain/discomfort, their health state would be 21121.
The Danish valuation study generated utility scores for the 3125 health states described by the EQ-5D-5L descriptive system using the respondents’ answers to the cTTO and DCE tasks [13]. The Danish EQ-5D-5L utility scores range from −0.757 for state 55555 to 1.0 for state 11111. In all, 21.7% of the EQ-5D-5L health states were considered worse than being dead, as their utility scores were below zero. In the current study, each respondent was assigned a utility score based on their description of their own health. In the example above, the respondent in health state 21121 would have a utility score 0.91.
The EQ VAS is a 0–100 scale on which the respondent is asked to indicate their current health. The bottom end-point is labelled 0 (worst imaginable health state), and the top end-point is labelled 100 (best imaginable health state).
Data analysis
All analyses were carried out using Stata v16.1 (StataCorp, College Station, TX). Summary statistics were calculated for EQ-5D-5L utility scores and EQ VAS scores for the entire sample, for each age group and across both sexes.
Associations between health and socio-demographic characteristics were investigated by analysing EQ-5D-5L utility scores and EQ VAS scores as the mean and standard deviation for the entire sample and for each age group by sex, education, occupational status, income and living situation. For each socio-demographic variable, differences between levels were assessed using either the non-parametric t-test (Mann–Whitney U-test) if a binary variable or the non-parametric analysis of variance (Kruskal–Wallis) if an ordinal variable. If the Kruskal–Wallis test showed a significant difference, Dunn’s test with a Bonferroni correction was used to determine the relevant levels. We expected to see a similar set of relationships as for the logistic regression (see below). EQ-5D-5L profile data were analysed to show the proportion of respondents in each dimension level by age group and sex. For the 20 most frequently reported EQ-5D-5L health states in the sample, the associated EQ-5D-5L utility score along with the mean and standard deviation of the EQ VAS scores were calculated.
Ceiling effects were assessed by determining the proportion of respondents reporting full health (11111). To assess known-group construct validity, the relationship between socio-demographic variables and problems (odds ratios) for each of the five EQ-5D-5L dimensions was assessed using logistic regression. The existing literature finds older respondents, females and respondents with a shorter duration of education to be more likely to report problems [16–18,21]. Similarly, it was expected that respondents with higher income, employed respondents and respondents living together with others would be less likely to report problems [20,25,26].
To assess convergent validity, the relationship between each of the five EQ-5D dimensions and the responses to the self-perceived general health question was analysed using Spearman’s correlation. The standard cut-offs were used, that is, a correlation of <0.30 was considered weak, 0.30–0.50 was considered moderate and >0.50 was considered strong [27]. Based on recent findings in the literature, a moderate positive relationship between EQ-5D-5L utility scores and EQ VAS scores was hypothesised together with a strong negative relationship with age [28]. A Bonferroni adjusted alpha level of 0.017 was used [29].
Results
Study sample
Of the 1014 respondents with completed interviews in the valuation study, one respondent did not provide an answer to one of the EQ-5D dimensions, and another did not provide an answer to the EQ VAS question, resulting in a sample of 1012 for the current study. Four respondents did not answer a subset of the socio-demographic variables, leaving 1008 full answers.
Table I presents the socio-demographic characteristics of the sample and confirms the earlier findings that the respondents were similar to the adult Danish population in terms of sex, age (slight underrepresentation of 18- to 24-year-olds and overrepresentation of 65- to 74-year-olds) and marital status [13]. The sample had slightly more respondents with higher education than in the general population.
Socio-demographic characteristics of the sample.
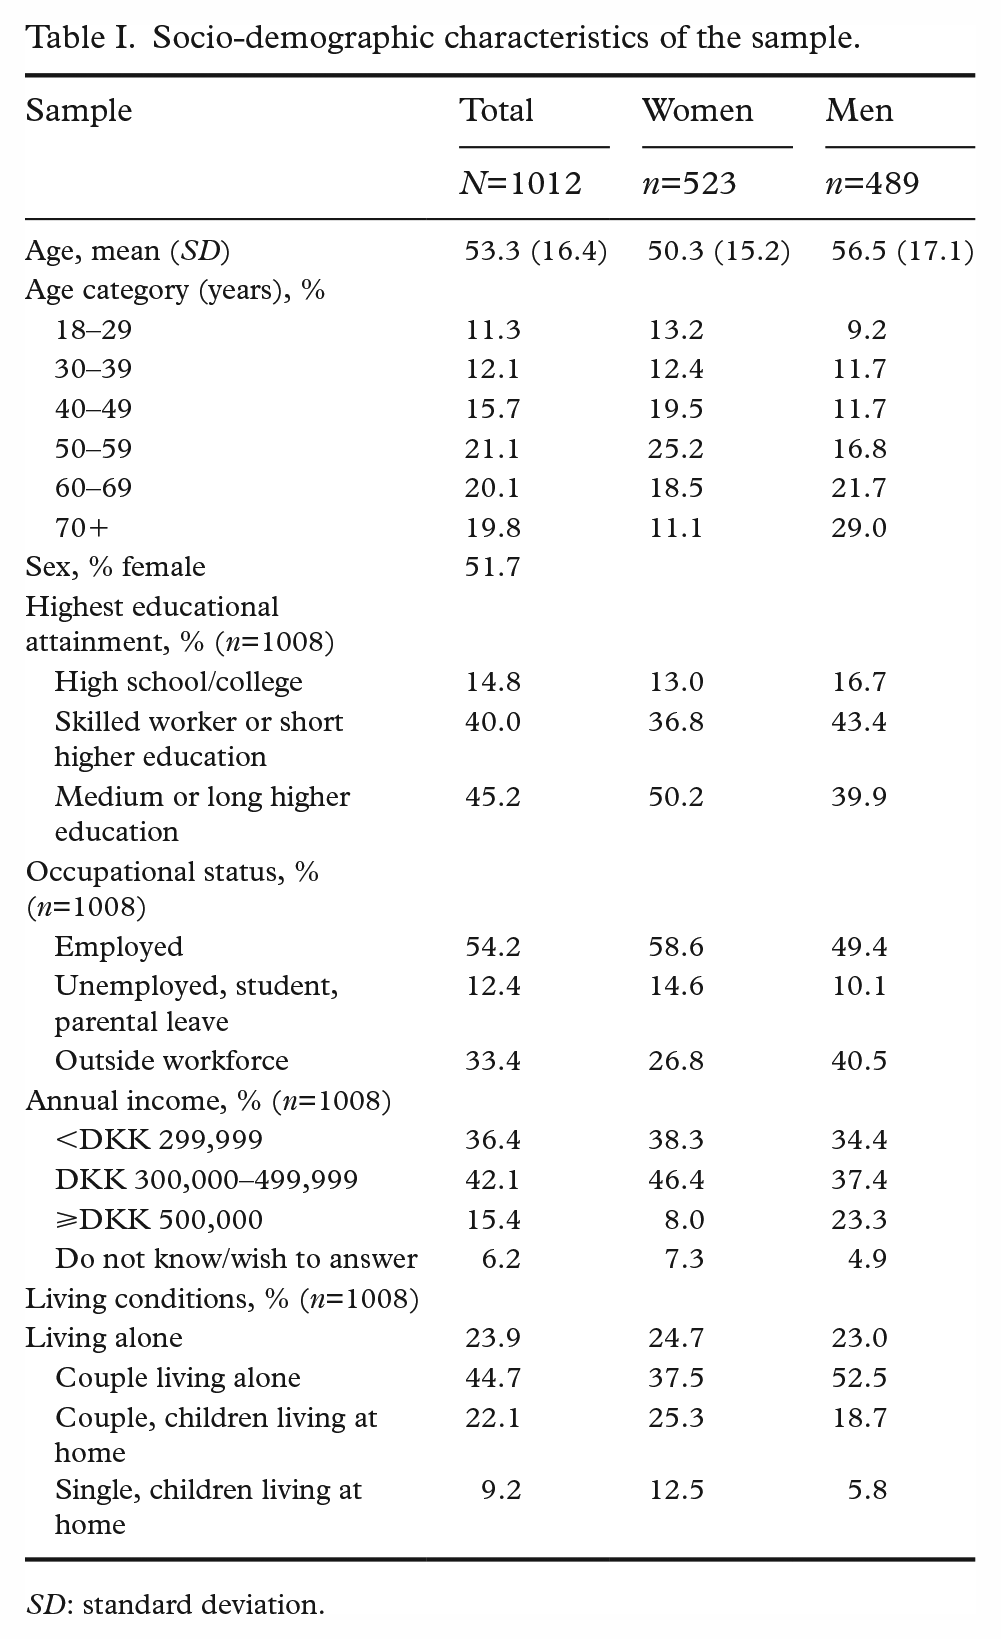
SD: standard deviation.
Associations between derived utility scores and socio-demographic characteristics
Table II shows the average EQ-5D-5L utility score across age and other socio-demographic variables. The average EQ-5D-5L utility score was 0.90 (standard deviation (SD)=0.16; 95% confidence interval (CI) 0.89–0.91), with values ranging from −0.25 to 1. There were no statistically significant differences in EQ-5D-5L utility scores across age groups (χ2=5.30, p=0.38) or between the sexes (Z=1.77, p=0.08). However, there were statistically significant differences for educational level (χ2=12.38, p<0.01), occupational status (χ2=25.74, p<0.01), income (χ2=25.30, p<0.01) and living situation (χ2=18.91, p<0.01). Thus, respondents with medium or long higher education had higher EQ-5D-5L utility scores than other respondents; those in employment had higher scores than respondents who were unemployed or outside the workforce; those in the lowest household income category had lower scores than those in the middle- and top-income categories; and respondents living alone had lower EQ-5D-5L utility scores than the other three categories.
EQ-5D-5L utility scores (mean, n, SD) by socio-demographic characteristics and age.
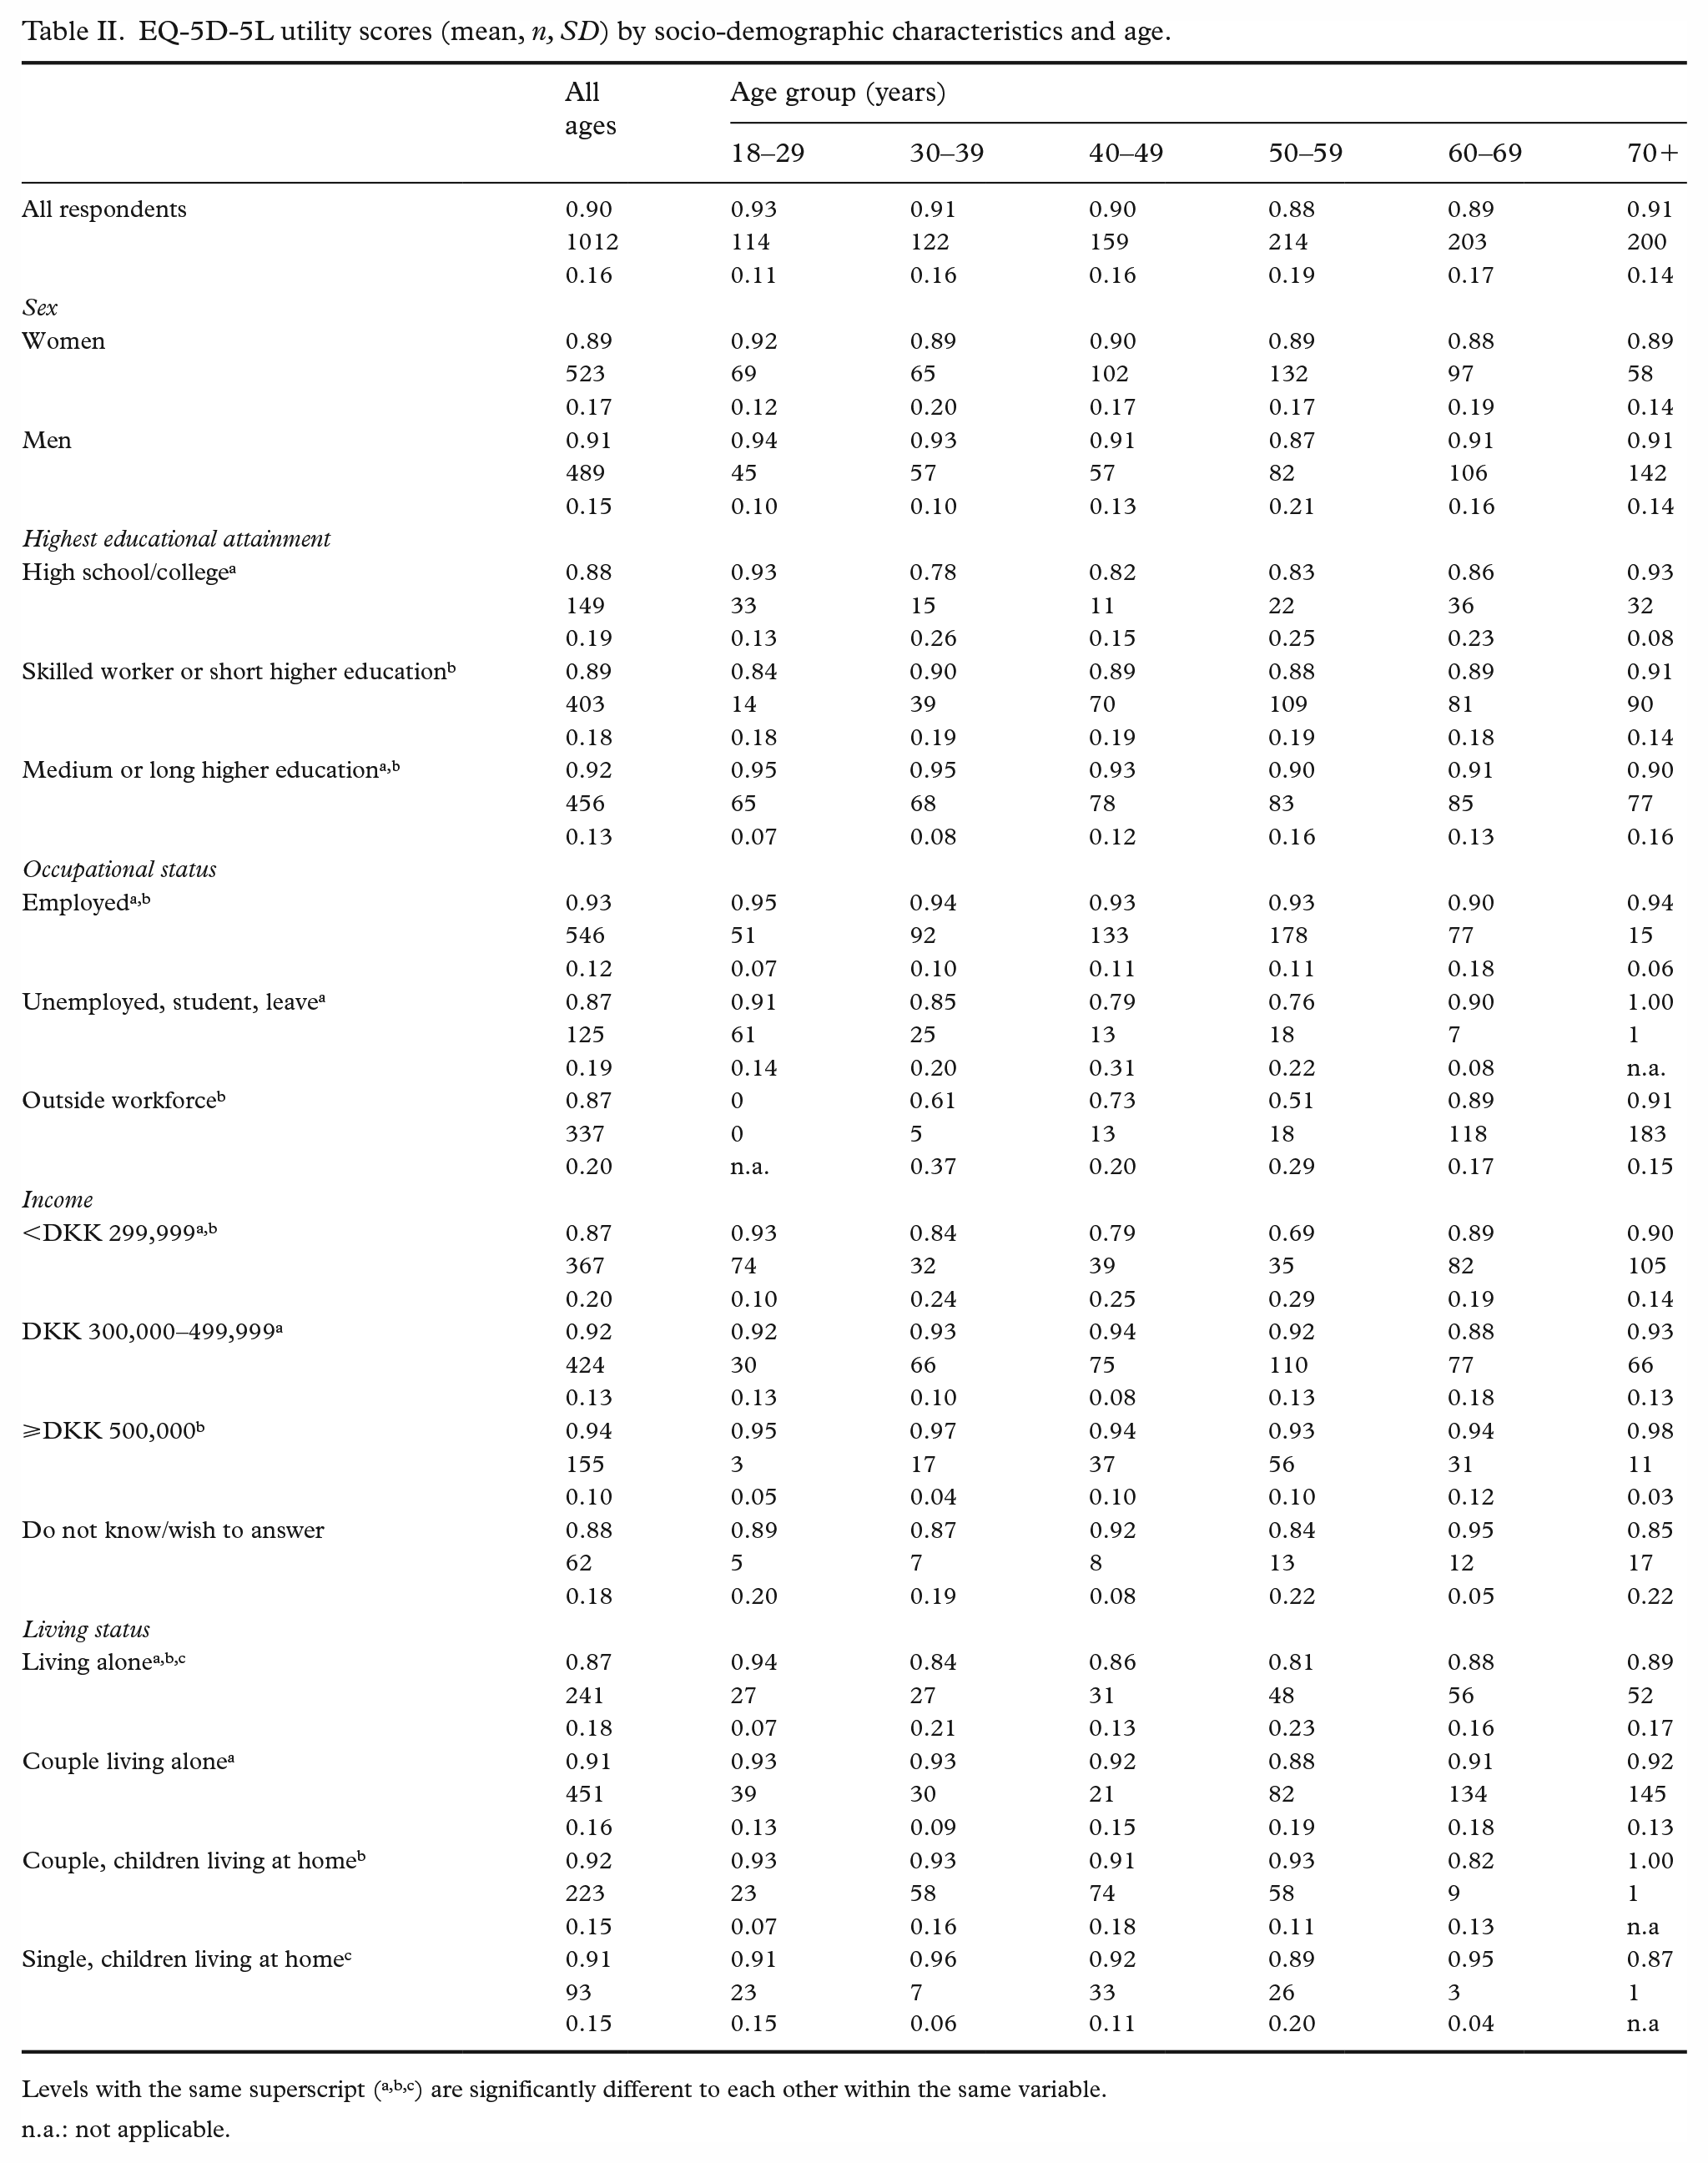
Levels with the same superscript (a,b,c) are significantly different to each other within the same variable.
n.a.: not applicable.
For the EQ VAS scores, the findings (not reported) were similar to those of the EQ5D-5L utility scores. The mean EQ VAS score was 82.43 (SD=15.89; 95% CI 81.45–83.41), with values ranging from 0 to 100. These data showed the same pattern of associations with socio-demographic variables as for the EQ-5D-5L utility scores.
EQ-5D-5L dimension responses
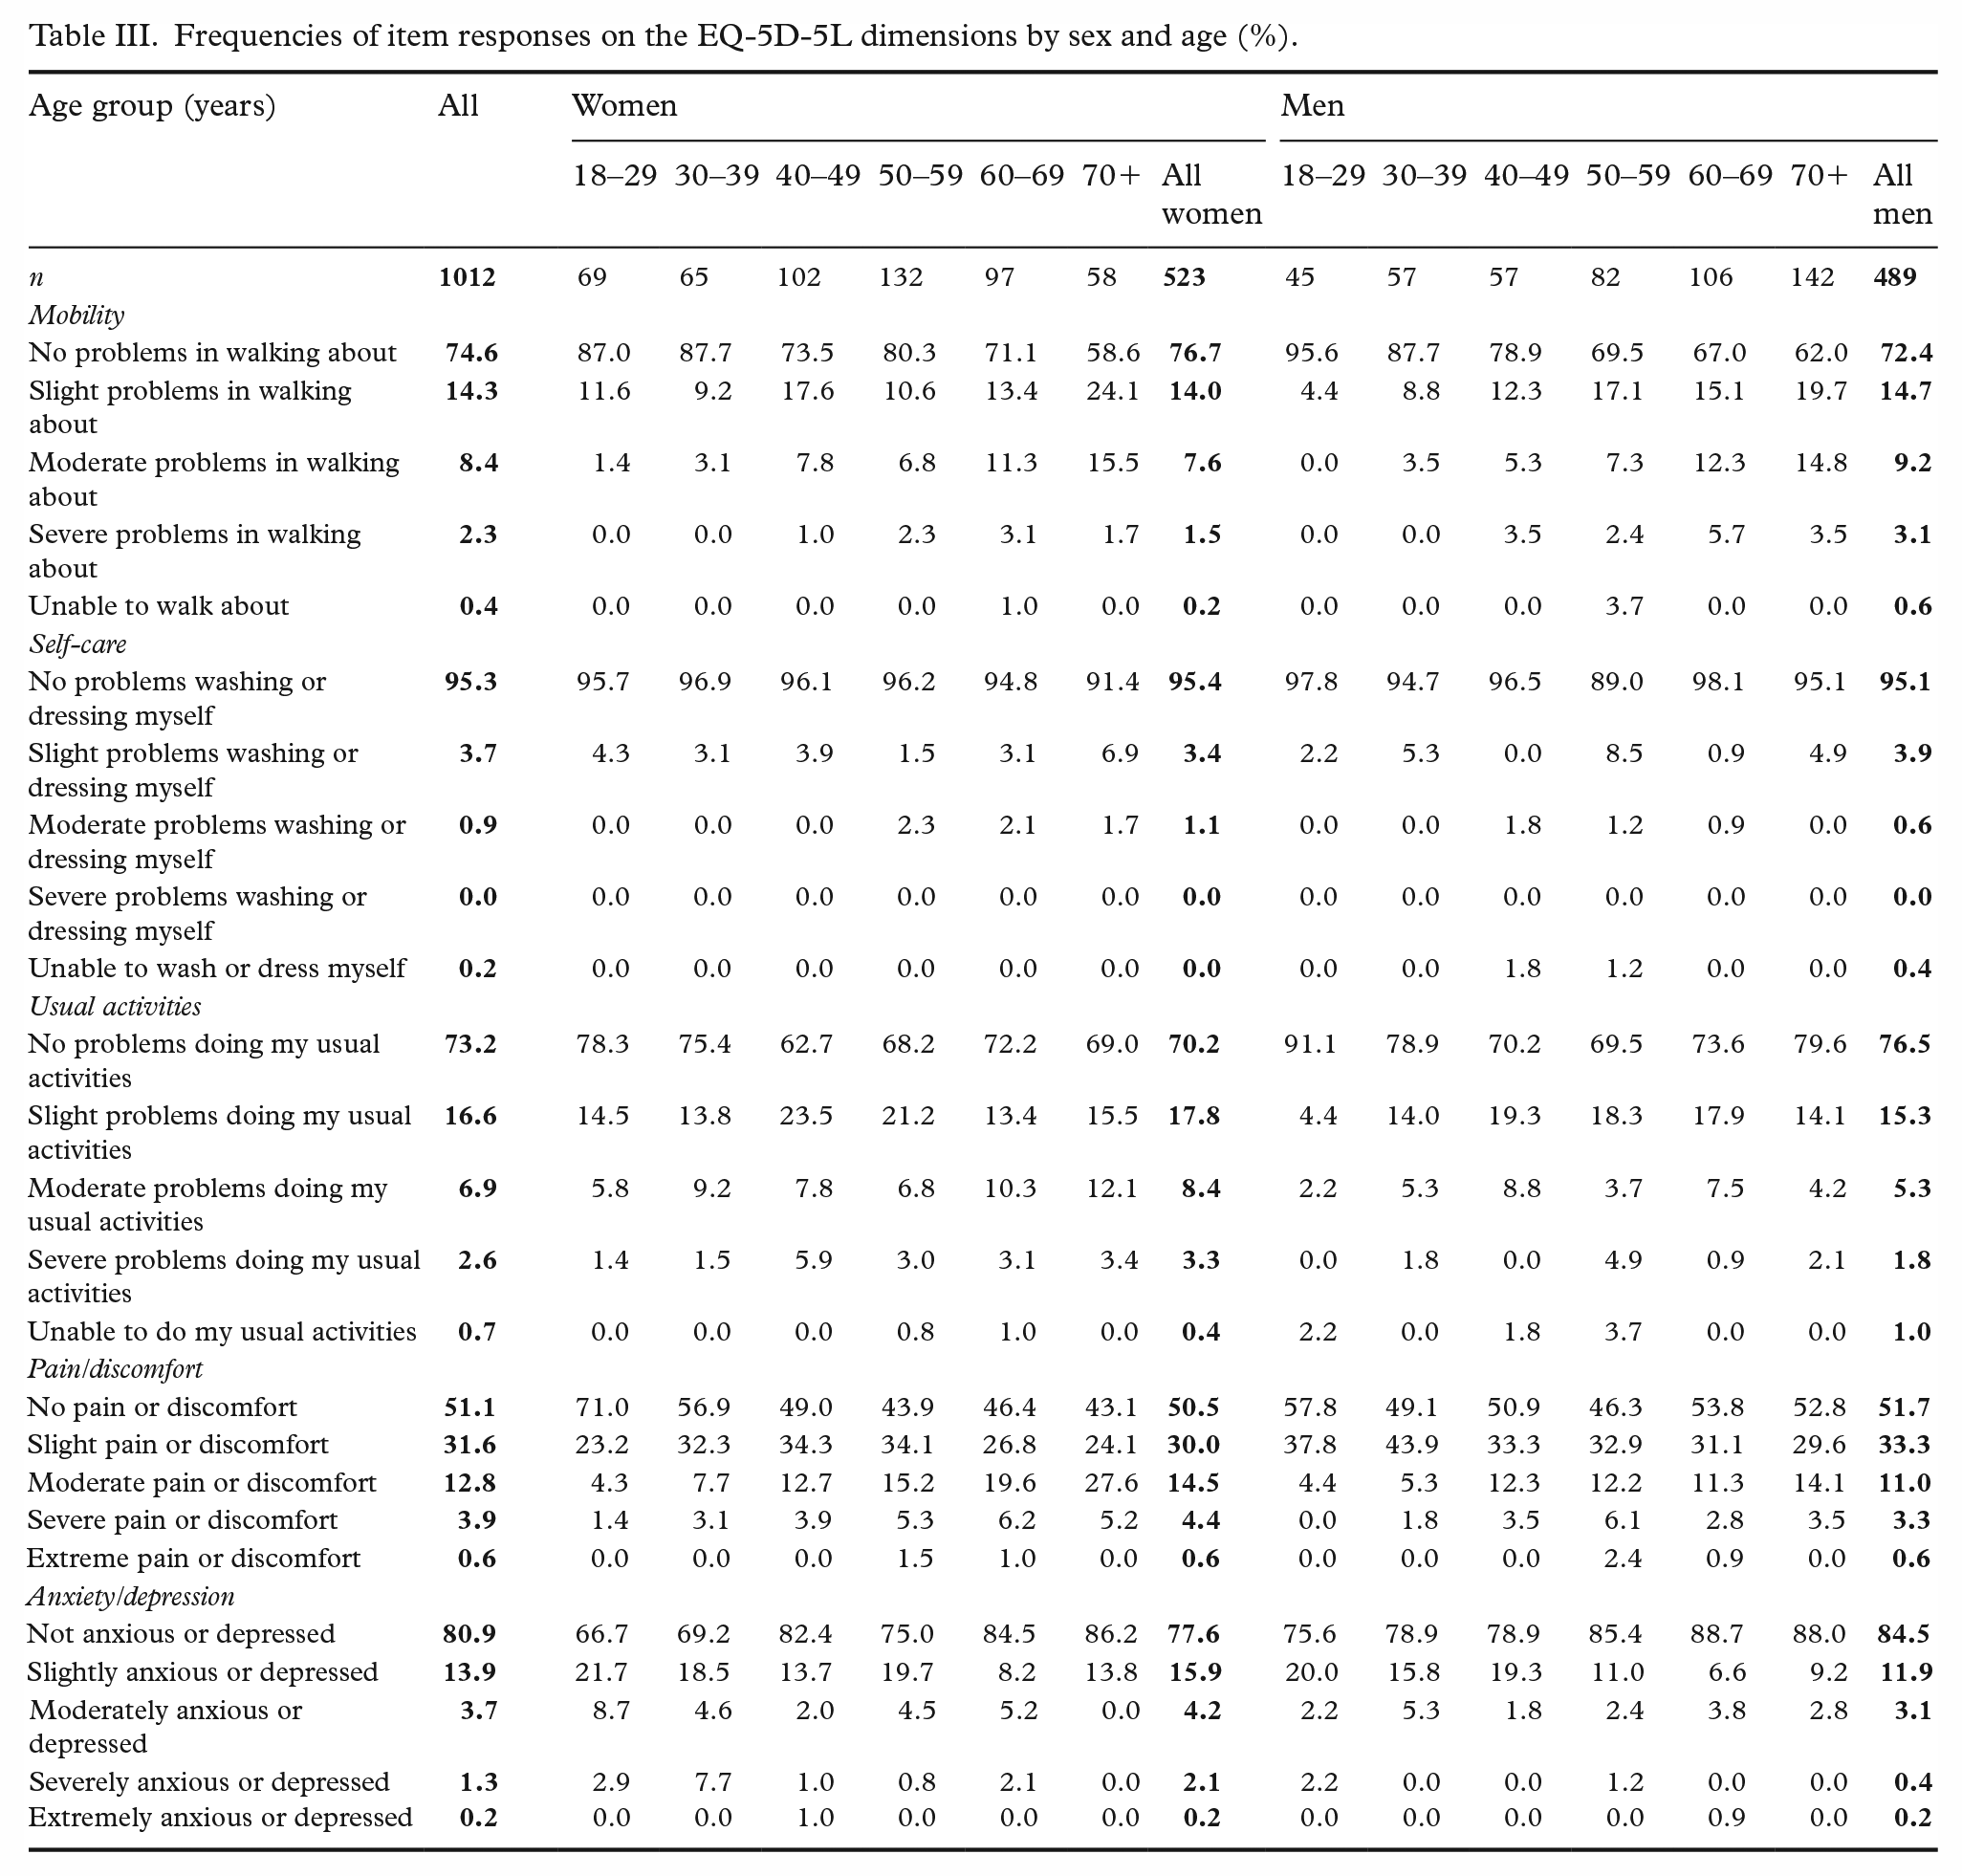
The frequencies of item responses for each EQ-5D-5L dimension are presented in Table III. As is commonly the case for population-based studies, a large proportion of respondents reported no problems on any of the dimensions (ceiling effect). The dimension with most reported problems was pain/discomfort, where 48.9% of the total sample reported current experience of pain or discomfort. Problems on the anxiety/depression dimension were especially prevalent for younger women and, to a lesser extent, younger men.
Frequencies of item responses on the EQ-5D-5L dimensions by sex and age (%).
Seventy per cent of respondents were in health states comprised only of no problems or slight problems on all dimensions, and thus had no health states with problems at level 3 or worse. Respondents reporting full health state (i.e. health state 11111) had on average an EQ VAS score of 90.8.
Construct and convergent validity
Table IV shows the odd ratios for reporting any problems on each of the EQ-5D-5L dimensions. The expected relationship with age was partly confirmed. Problems with mobility generally increased with age, but the findings were less clear for the other dimensions. As expected, respondents with a higher educational level and those who were in employment were less likely to report problems on any of the five dimensions. Finally, respondents with the lowest incomes and those living alone were more likely to report problems on all five EQ-5D-5L dimensions.
Odd ratios with confidence intervals for reporting problems on each of the EQ-5D-5L dimensions, for all socio-demographic variables.
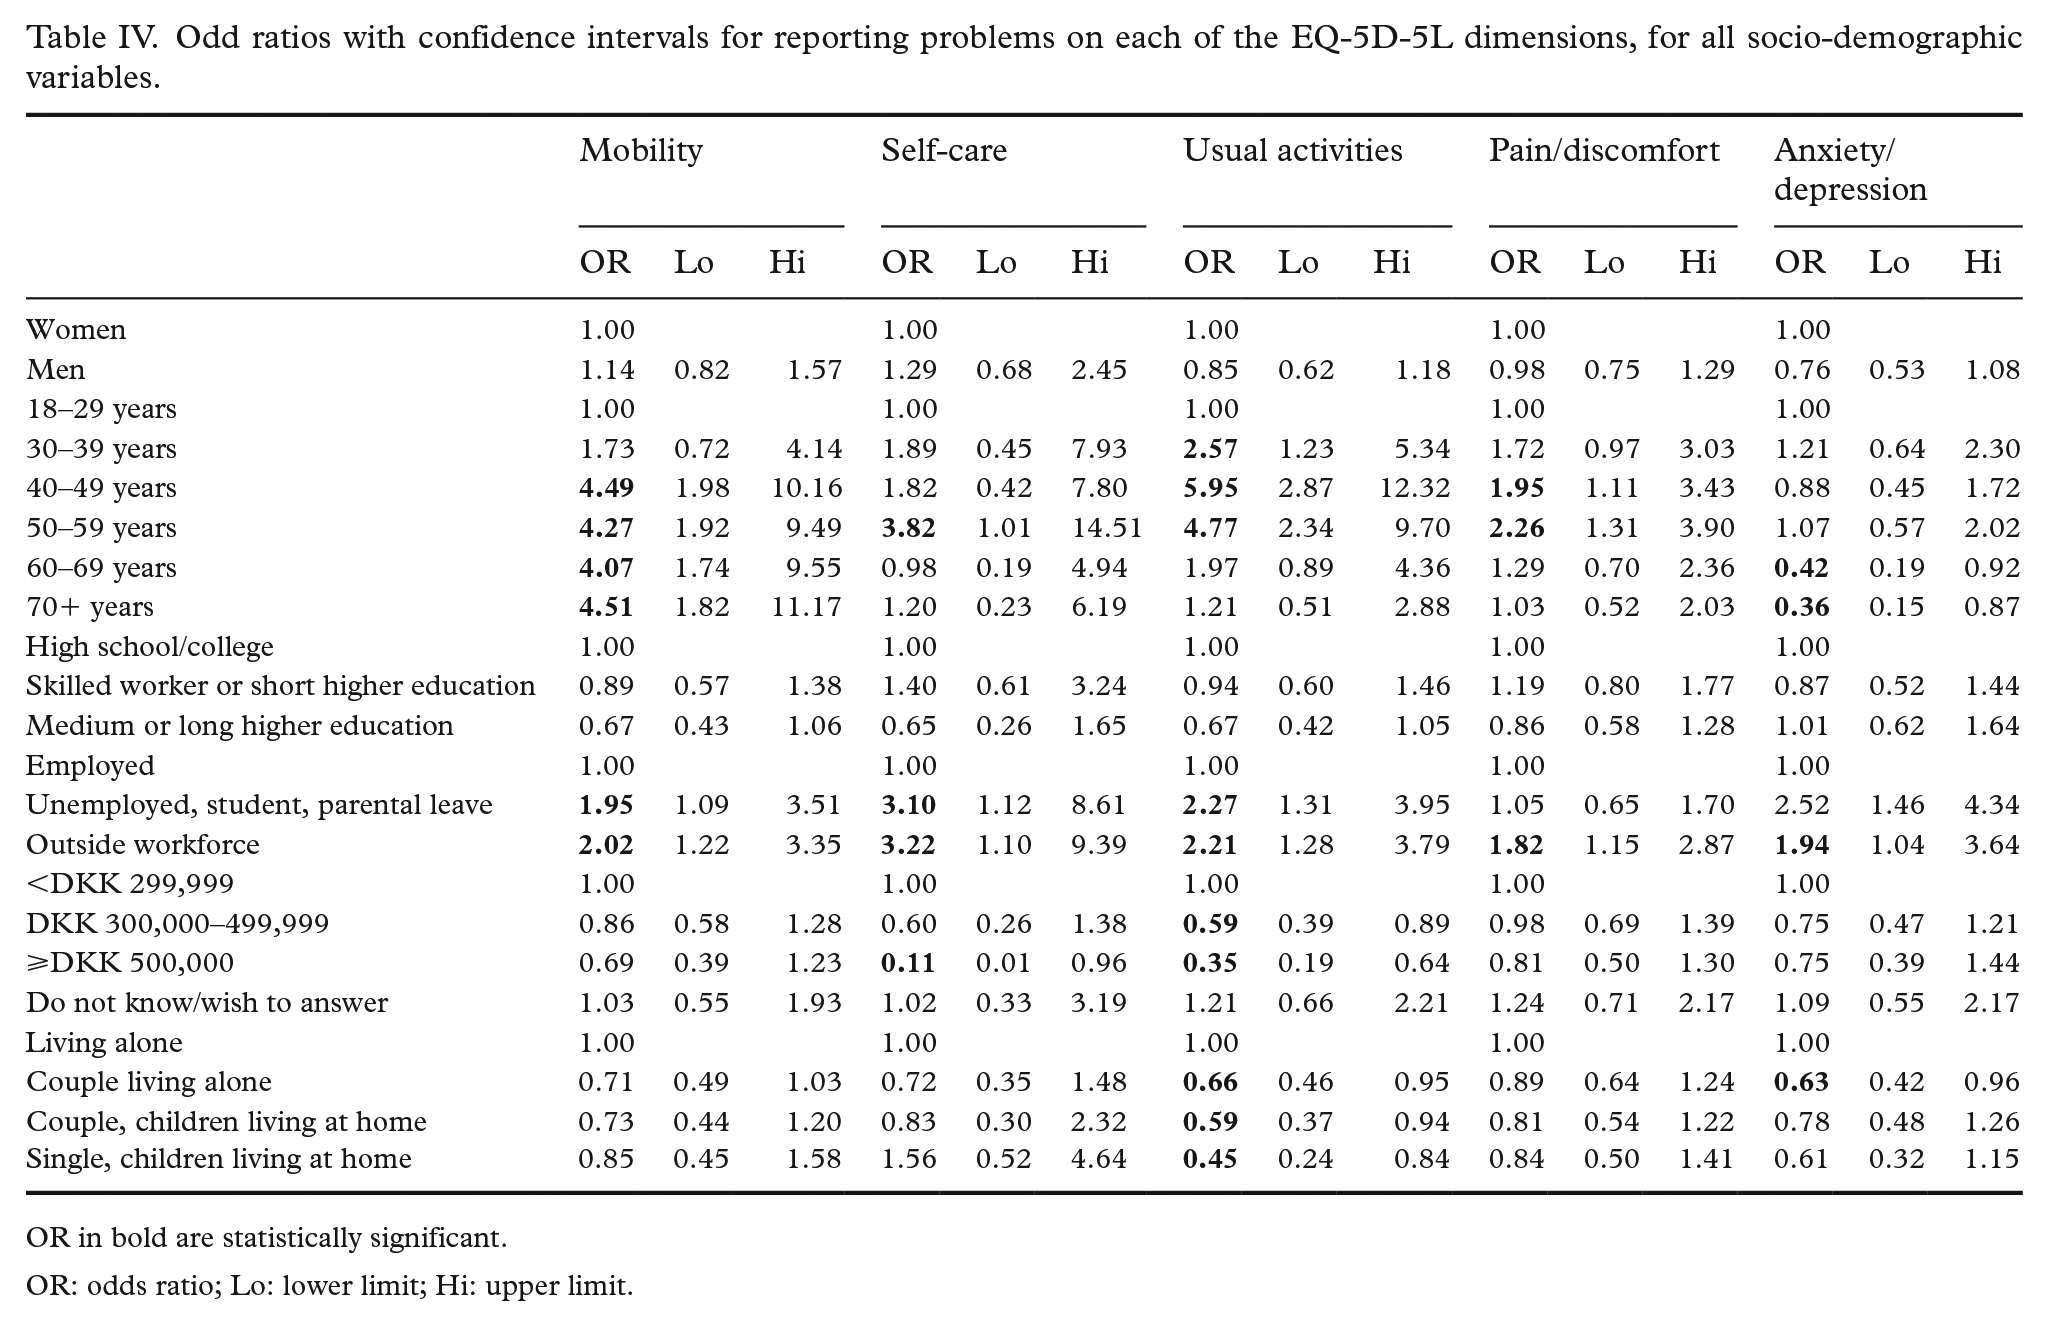
OR in bold are statistically significant.
OR: odds ratio; Lo: lower limit; Hi: upper limit.
Table V shows the correlations between the level of problems on each of the EQ-5D-5L dimensions and the responses to the question on self-perceived general health. All correlations were negative (as a higher score on general health reflects better health) and were also statistically significant. According to standard cut-offs, the correlation was strong between general health and EQ-5D usual activities, moderate between EQ-5D mobility and pain/discomfort, and weak between EQ-5D self-care and anxiety/depression.
Spearman correlations between self-reported problems on each of the five EQ-5D-5L dimensions and responses to the “General perception of health” item, and Pearson correlations between EQ-5D utility score, EQ-VAS score, and respondent age.
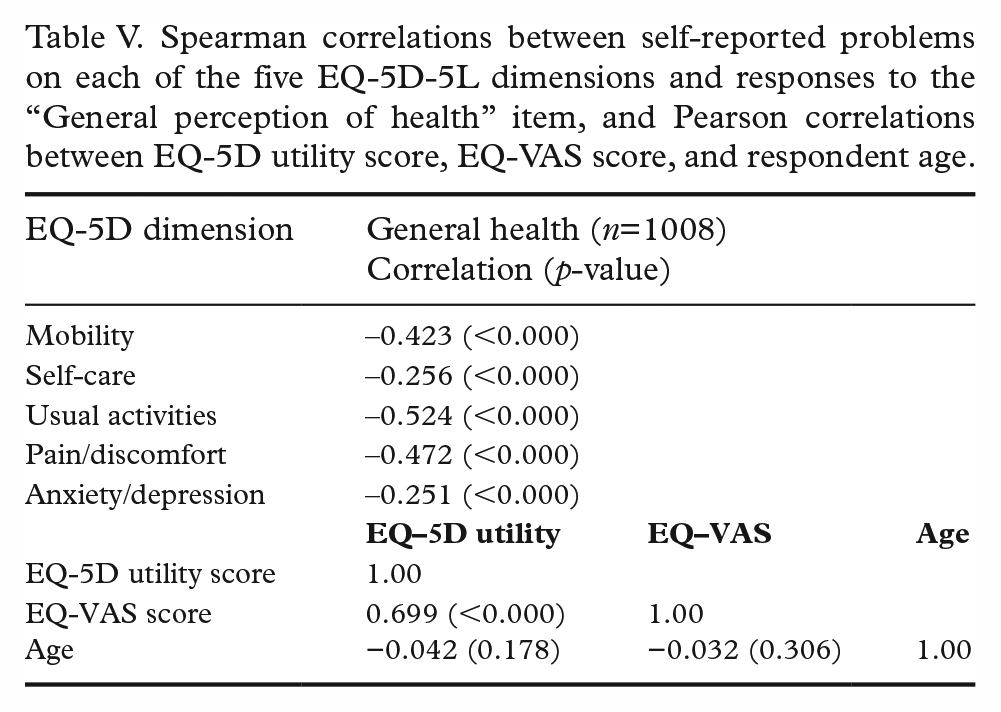
Table V also shows the expected positive correlation between EQ-5D-5L utility scores and EQ VAS scores, which was statistically significant (ρ=0.699, p<0.000). Contrary to expectations, however, age was not related to either EQ-5D-5L utility score or EQ VAS score (ρ=−0.042 and ρ=−0.032, respectively).
Discussion
This study provides Danish population norms for the EQ-5D-5L and assesses the measurement properties of the instrument in a Danish setting.
The study used data from the Danish EQ-5D-5L valuation study to generate population norms for self-reported health state, utility scores and EQ VAS scores. The mean EQ-5D-5L utility score was 0.90, which is slightly above the previously reported score of 0.88 for the EQ-5D-3L in Denmark [20]. Compared to populations in Germany (0.92) [17], Italy (0.92) [30] and South Australia (0.91) [14], the mean utility score for Denmark is a little lower but above the averages for Quebec (0.82) [15] and Poland (0.89) [16].
Overall health status measured via the EQ-5D-5L utility score and the EQ VAS score showed no clear relationship with respondent age or sex. EQ-5D-5L utility generally declined with age, but the decrease was modest. Similarly, EQ-5D-5L utility was higher for men than for women within each age group and for all ages together, but again the differences were modest. This corroborates the findings from the individual EQ-5D-5L dimensions but is contrary to our expectations and to the findings in previous international and Danish studies. However, a cross-country analysis using EQ-5D-3L data did show a considerably higher age slope/gradient in Southern Europe compared to Northwest Europe [3].
Similar to the findings from South Australia, England, Germany, Italy and Poland, the Danish sample reported greater problems with pain and discomfort compared to other dimensions [14,16,17,21,30]. However, problems with anxiety/depression were reported by 33% of women aged 18–29 years old, making problems with that dimension the most frequently reported for this group of respondents. Sex was not related to the likelihood of reporting problems on the EQ-5D-5L dimensions after controlling for the other socio-demographic variables. This is contrary to the findings from the EQ-5D-3L, where all dimensions except self-care were related to sex [20]. In terms of the parameter estimate itself, men were more likely to report problems with mobility and self-care than women, whereas for the other dimensions, the relationship was in the other direction. These relationships were not statistically significant, however. The relationship between EQ-5D-5L dimensions and age was also surprising. First, within each of the age categories, there was at least one dimension that showed no difference in odds ratios between the baseline group (18- to 29-year-olds) and the particular age category. Second, the magnitude of the odds ratios did not increase monotonically with age.
One of the key arguments for introducing a five-level version of the EQ-5D was to reduce the problem of ceiling effects. The percentage of respondents answering 11111 in the current study was 39.2%, which is well below the 56% reported for the EQ-5D-3L for Denmark [20]. This supports other evidence that ceiling effects are reduced when using the EQ-5D-5L [23]. Compared to other countries, the number of respondents reporting full health is similar to South Australia (42.8%) and Italy (38%) but slightly below Germany (47.5%) [14,17,30]. In the current study, 13% of respondents were in health states that included a level 4 or 5 on any dimension. Thus, in line with the findings from the USA, it appears that more health problems are reported with the EQ-5D-5L than with the EQ-5D-3L, but the health states are not more severe [22].
The reporting of problems on any of the EQ-5D-5L dimensions was significantly correlated with self-perceived general health. This provides evidence of convergent validity and is in line with findings from South Korea [19]. Furthermore, there was a strong significant relationship between the EQ-5D-5L utility score and the EQ VAS score. Regarding construct validity, the study confirmed expected associations between self-reported health scores and educational level, occupational status, household income and living conditions, but there were fewer differences by age and sex [16–18,20,21,25,26].
Limitations of this study include a somewhat smaller sample size compared to many of the population studies we have compared against (with 2000–4000 respondents). Furthermore, those agreeing to participate in this study knew in advance that they should spend more than one hour completing an interview, which is well above participation time in a general health survey. It cannot be excluded that our participants were healthier or more positive about their health than people who declined to participate in the interview or who were not invited to the study. The slight overrepresentation of respondents with higher education than the general population adds to this.
Conclusions
The study results represent the first assessment of the psychometric properties of the EQ-5D-5L in a Danish population sample and provide population norms for the EQ-5D-5L dimensions, utility scores and EQ VAS scores. The data came from the recent Danish EQ-5D-5L valuation study that generated the EQ-5D-5L Danish value set and were based on a representative sample of the Danish adult population. The greatest number of problems was reported on the pain/discomfort dimension, and 60% of respondents had problems on at least one dimension.
The EQ-5D-5L showed reduced ceiling effects compared to the EQ-5D-3L, and we found evidence of known group validity for education, occupational status, income and living situation. The relationships between self-reported health and age and sex were less clear. In terms of convergent validity, we found moderate to strong correlations between self-perceived general health and EQ-5D-5L mobility, usual activities and pain/discomfort.
We recommend the use of the EQ-5D-5L in Danish settings to monitor population health, explore patient HRQoL and assess the (cost-) effectiveness of health interventions.
Footnotes
Declaration of conflicting interests
The authors declared no potential conflicts of interest with respect to the research, authorship and/or publication of this article.
Funding
The authors disclosed receipt of the following financial support for the research, authorship and/or publication of this article: The Danish EQ-5D-5L valuation study has received funding from the EuroQol Research Foundation, The Danish Health Foundation (Helsefonden), Aase og Ejnar Danielsens Fond, the North Denmark Region, and the Department of Business and Management at Aalborg University.